multibeam bathmetric and seismic survey natovi port
TRANSCRIPT

1
MULTIBEAM BATHYMETRIC AND SEISMIC SURVEY
NATOVI PORT
NORTHEAST VITI LEVU
FIJI
Robert Smith Geoscience Dvision
March 2016 SPC Technical Report SPC0030
Natovi Jetty from Google Earth Imagery.

2
The Geosurvey Section of the Geoscience Division of Pacific Community completed this survey on a
contract to the Fiji Roads Authority.
DISCLAIMER
While care has been taken in the collection, analysis, and compilation of the data and information, it is
supplied on the condition that the Geoscience Division of the Secretariat of the Pacific Community shall
not be liable for any loss or injury whatsoever arising from the use of the same.
ADDRESS:
Geoscience Division
Pacific Community
Private Mail Bag
GPO, Suva
Fiji
E-mail: [email protected]
Phone: 3381377, Ext.266

3
TABLE OF CONTENTS
Page
ACKNOWLEDGEMENT ................................................................................................................................... 5
SUMMARY ..................................................................................................................................................... 6
INTRODUCTION AND OBJECTIVES ................................................................................................................. 8
EQUIPMENT & METHODS
Navigation control ................................................................................................................................. 9
Single Beam Bathymetry ....................................................................................................................... 9
Multibeam Bathymetry .......................................................................................................................10
Seismic Data Acquisition......................................................................................................................10
Tidal Corrections, Tide Datums and Bench Mark Control ...................................................................11
RESULTS
Tides and Vertical Datum Control ......................................................................................................12
Tide Data ......................................................................................................................................14
Data Processing- Multibeam, single beam data ..................................................................................17
XYZ files generation and contour plots ........................................................................................17
Multibeam Bathymetry................................................................................................................17
Sidescan mosaic data and interpretation ............................................................................................21
Geology and Coastal Geomorphology of Natovi .................................................................................22
Seismic data and interpretation ..........................................................................................................26
Geological Interpretation ....................................................................................................................33
Geological hazards, earthquakes, liquefaction, tsunami and sedimentation .....................................36
CONCLUSIONS and RECOMMENDATIONS ..................................................................................................40
REFERENCES ................................................................................................................................................42
APPENDICES
1 Fugro Marine STAR data sheet ....................................................................................................43
2 Equipment Specifications ............................................................................................................45
3 Natovi Jetty Bathymetry Map Sheets1, 2, 3 ...............................................................................54
4 Natovi Jetty Seismic Data Map Sheets and Sections ...................................................................55
5 Natovi Tide Data and Analysis .....................................................................................................56
6 Natovi GNSS Station Results and Data Processing ......................................................................58
7 Natovi CD Digital Data files .........................................................................................................59

4
List of Figures
Figure
1 Location map showing Natovi Jetty Site in Vanua Levu ............................................................. 9
2 Tide Gauge installation at Natovi Jetty ...................................................................................11
3 Tide gauge sensor setup with respect to tide pole ................................................................12
4 GNSS Net R9 setup on JICA-PIN Natovi jetty ..........................................................................13
5 Tide watch –Natovi tide pole to gauge comparison plot ......................................................14
6 Plot of 25hr tide watch ..........................................................................................................15
7 Spirit of Love Docking at jetty.................................................................................................16
8 Graph for vertical relationship between datum’s and bench mark control ..........................18
9 Track Map for multibeam and single beam data ...................................................................19
10 Bathymetry map of Natovi Jetty ............................................................................................20
11 Ballance Reef offshore Natovi ................................................................................................21
12 Vessel impact features seen on the seabed at Natovi ...........................................................22
13 Natovi Sidescan mosaic ..........................................................................................................24
14 Geological map of Natovi area (after Hirst 1965) ..................................................................25
15 Generalised structure of Natovi area ( after Hirst 1965) .......................................................26
16 Seismic line track plot with respect to the proposed wharf ..................................................27
17 Sketch map of seismic profile locations with respect to boreholes ......................................28
18 Interpretation of single channel seismic profile Line 3 ..........................................................29
19 Detailed Interpretation of single channel seismic profile 3 at jetty face ...............................30
20 Interpretation seismic profile-line 004 ...................................................................................31
21 Depth to top of conglomerate Interpretation of Seismic Profile 001 ....................................32
22 Depth to top of fresh bedrock as interpreted from seismic data ..........................................33
23 Core from end of boreholes 2 and 4 ......................................................................................34
24 Structural interpretation based on borehole .........................................................................35
25 Earthquake epicentre map for Fiji 1850-2015 .......................................................................36
26 Earthquake Hazard Map for Fiji ..............................................................................................34
TABLES
1 GNSS survey data results for bench marks and top of tide staff ............................................13
2 Calculated Tide Planes for Natovi and Suva ...........................................................................15
3 Calculated Tide Datum’s for Natovi wrt TGZ and FMG Mean Sea Level ...............................16
4 Strong Earthquakes felt in Fiji 1877-2001 ..............................................................................37
5 Tsunamis recorded in Fiji 1877-2014 ......................................................................................39

5
ACKNOWLEDGEMENT
The assistance from the various teams in the GSD Division of SPC, namely the Geodetic Survey Team led
by Andrick Lal; the Electronics Support Team and Workshop personnel led by Peni Musunamasi and the
Captain and crew of the vessel M.V. Lako Yani whose highly commendable efforts toward completing this
work is acknowledged and deeply appreciated.

6
SUMMARY
This report details the results of a multibeam and single channel seismic survey for Natovi, an important
port connecting Viti Levu to Vanua Levu and Ovalau. Level of vessel traffic utilising Natovi is significant
and expected to increase. The purpose of the survey was to provide bathymetry data and interpreted
sections from single channel seismic data for assessment of ground and subsurface conditions at the
existing port site. Data sets collected include detailed single and multibeam bathymetry side scan imagery
of the seafloor within the general vicinity of the port site and single channel seismic data. A grid of single
channel seismic lines offshore was collected to assess the sub-surface geology and structure. Positioning
was by RTK GPS using an SPS 852 with license to access the Fugro MarineStar Service. Tidal datum’s are
based 60 days of data collected with a tide gauge installed at the port for that purpose. Vertical control
was established and tied into existing bench marks.
Data were collected during the period 20th
July through to 23rd
November 2015.
The work planned is as follows:
• Conduct a multibeam bathymetric and side scan survey within the area of the existing port,
covering also the seaward approaches to the port.
• Acquisition of single channel seismic data to define bedrock structure and provide geological
interpretation of this data.
• Determine Port “Mean Sea Level” and Tidal datums.
• Establish good horizontal and vertical control for 3 existing or new bench marks as required that
link with the Fiji Map Grid.
• Provide a survey report.
Deliverables are also to include both digital data maps; hard copy of maps showing the bathymetric and
side scan; and seismic reflection detail of the substrate data of the port site. Tidal datum and Mean Sea
Level (MSL) were determined. Mapping coordinates are in metres based on the Fiji Map Grid (FMG).
Conclusions
• There is a vertical difference of 0.582 m and 0.096 m, respectively, for the height calculated by
GSD in this survey and the heights provided by MWH, for the bench marks IRO2 and IRO3.
• Multibeam mapping of the Natovi jetty area has delineated well the present bathymetry and
morphology of the seabed.
• The calculated MSL depth at the jetty head averages 5.5 metres.
• Sedimentation is an issue at Natovi. Significant scouring is interpreted from the detailed
bathymetry mapping and is also seen in the seismic data. This is a direct result of vessel docking
at the jetty face. As much as 2 m of seabed has been stripped from under the jetty head (Pers.
comm., Dive Centre).

7
• The acquisition of tidal data at Natovi proved problematic due to serious damage sustained to the
unit by a ferry docking at the jetty coupled with a strong hydrodynamic prevailing.
• While hydrodynamics were not a requirement of this study; given the location of the jetty; the
high level of usage currently as well forecasted increase in the future; and the small working area
or turning basin between the coast and Ballance Reef – such a study needs to be incorporated
into future port design works.
• The seismic data reveals that bedrock is between 30 m and 35 m depth, with respect to the jetty
head location. To the west of the jetty a significant portion of the over-burden appears as a
homogenous sequence of fine sands silt with faint clay bands.
• The seismic data shows the current jetty head is located on the western edge of a bedrock high
that is interpreted to be an extension of a northwest-southeast ridge scarp feature associated
with Vatucou Peak. The apparent scarp seen in the Google Earth image is interpreted to represent
the western edge of a paleo half graben fault system that plunges to the south. The half graben
fault block(s) would account for the thicker sequence of marine silts and clays deposits found on
the west side of the jetty. To the east of the jetty the bedrock appears as a shallow terrace or
bench that extends some 400 m seaward where there is an apparent dip of 13.7 degrees to the
east.
• Based on the seismic data available, liquefaction would not be considered a significant geological
hazard at Natovi.
• Based on the tide data, and the GNSS levelling survey, actual Mean Sea Level is calculated to be
0.01 m below the topographic or Fiji Map Grid Vertical Datum of Mean Sea Level.
• There is no factual report or data known to suggest Natovi is at risk to possible tsunamigenic
events; however, it is something that should not be ruled out.
Recommendations
• Natovi Jetty is a very important piece of infrastructure, as the principal point of entry and
departure from Viti Levu into Vanua Levu and Ovalau. The lack of multi-faceted data sets in the
current design has compromised the functional ability of the jetty to cater for an expanding fleet
of vessels and vessel sizes using the site. Current and wave data need to be considered in any final
design.
• Sedimentation is an issue at Natovi, however the continued vessel traffic maintains a navigable
depth within the vicinity of the jetty head due to scouring which in turn generates high levels of
suspended sediments in the water column. This sediment load may have longer term
consequences for engine cooling systems.
• Data from four boreholes provided by FRA was integrated with the seismic data. This assisted
with the interpretation of the profiles and the subsurface geology of the jetty location. That said,
although the borehole logs aided interpretation, basing borehole locations on the seismic data
would have value added to the subsurface information now currently available.

8
• It is recommended that high-resolution multibeam surveys be scheduled for occasional
evaluation of seabed conditions at port and harbour sites.
• In rural settings such as Natovi, the lack of multi-faceted data sets that look at the long-term
impacts of important infrastructure development projects in the nearshore area is often
overlooked and needs to be improved.
INTRODUCTION AND OBJECTIVES
The primary objective of the mapping survey was to collect data on the geological and geophysical ground
conditions at Natovi Jetty, in the north east corner of Viti Levu. The location of Natovi Jetty is shown in
Figure 1.
Objectives
Undertake bathymetric and seismic reflection surveys at the Natovi port of entry and its approaches.
The survey works at this location included the following:
1) Single channel seismic reflection to delineate the subsurface structure, sediment thickness and
depth to bedrock.
2) Single beam and multibeam bathymetric surveys of the site and approaches to delineate depth to
seabed.
3) Derive Mean Sea Level and tidal planes for Natovi and provide three GNSS control points for
horizontal control with respect to the Fiji Map Grid Datum.
This baseline data will assist with final location and geotechnical conditions to effect new design for the
port.
This report provides an account of the activities and the results of the Natovi field survey undertaken
during the period 20th
July to 08th
August 2015.

9
Figure 1 – The location of Natovi Jetty in Viti Levu captured from Google Earth. Natovi is some 65 nm miles
from Suva.
EQUIPMENT & METHODS
Navigation Control
Navigation control was accomplished with an integrated IMU navigation system integrated with the
MarineSTAR Fugro correction service for corrected RTK data in real-time. Map coordinates and vertical
datum are based on the Fiji Map Grid.
Single Beam Bathymetry
In the shallow areas of the jetty sites, that is along the flank of the jetty head, single beam profiles where
collected at 10-m line spacing overlapping the multibeam data.

10
Multibeam Bathymetry
Background
High-resolution swath mapping, using multibeam echosounders, is able to map a complete underwater
landscape in a fraction of the time that is currently required by a single-beam echosounder, and with
greater accuracy. Computer processing of swath-mapping data can produce data visualisations that
render complex three-dimensional concepts into simple, informative, colour diagrams for the lay
observer.
Swath mapping of the sea floor is carried out using sophisticated multibeam echo sounders fitted to a
ship or towed at depth. A computer is used to co-ordinate the large amounts of imaging information with
the ship’s position and attitude at very close time intervals. With further processing, an image can be
created that represents, in fine detail, the morphology of the sea floor as well as objects on the sea floor.
Multibeam Configuration
The system used is a R2 Sonic 2024 multibeam system. Details of the system configuration are given in
Appendix 2.
Seismic Data Acquisition
Background
High-resolution shallow marine seismic reflection data were collected at the jetty site for subsurface
information on the geological structure and sediment thickness. This was done by continuous profiling
using a Datasonics Bubble-Pulser SPR 1200 profiling unit on the survey vessel. The seismic source used
was a boomer system, mounted on a surfboard sled, operating at 400 Hz that was towed by the vessel.
The seismic signal was recorded by a single-channel, 7-metre Datasonics BPH-540 Hydrophone Streamer
cable with 10 hydrophone elements in oil-filled polyurethane tubing. Band pass filter with low cut
frequency of 200 Hz and high cut frequency of 2000 Hz were used. The time variable gain (TVG) setting on
the seismic processor was adjusted throughout the survey for best possible signal. The profiles were
recorded on an EPC 1048 digital graphic recorder. The seismic profiles collected represent 150 ms two-
way travel time (TWT) (11.25 m for 15 ms, assuming interval velocity of ~1.5 km/s).
The seismic profiles are unmigrated. Several acoustic artifacts of non-migrated seismic sections are to be
recognised. These are bubble pulse reverberations of prominent seismic reflectors, such as the seafloor,
which produce a couplet of reflectors up to 2 milliseconds apart, direct arrivals from source, hyperbolic
diffraction patterns and bow tie effects, and reflection multiples. Individual seismic units can been
identified from stratigraphic analysis of seismic profiles on the basis of their geometry, contact
relationships, internal structure and reflection characteristics such as amplitude, continuity, frequency
and configuration. The seismic profiles also image the near-surface expressions of buried reef sediment
thickness and top of bedrock.

11
Tidal Corrections, Tide Datums and Bench Mark Control
To establish tidal datums and tide levels, a tide gauge was installed at Natovi Jetty (Figure 2) for a period
of 60 days. The tide gauge and tide pole were tied to MWH local bench marks linking to the Vatucou Trig
Station using high-end GNSS survey equipment with observation periods of 6 hours on each point. Three
such control marks were located in this manner; with the GNSS data post processed using AUSPOST. It
should be noted that there is a two-week period after data is acquired before post processing of the data
can be completed. The Top of Tide Staff (ToTS) was then levelled to the control points so that tide datums
could be then calculated from the tide data. A 25-hour tide watch was also undertaken for quality control
on the tide data recorded.
Figure 2 – Tide gauge installation at Natovi Jetty.
For the tide data two gauges were installed a Valeport as the primary tide recorder and a RBR tide gauge
recorder which is a submerged unit. The locations of the sensors were placed 0.2 m above tide gauge zero
of the tide pole. The tide pole had a measured length of 4.05 m.
Figure 3 illustrates the setup or position of the sensors for the tide gauge.

12
Figure 3 – showing the actual position of the sensors with respect to the tide staff. Both were placed at
0.2 m above the zero point of the tide staff.
RESULTS
Tides, Vertical, Horizontal Datum Control
Table 1 contains the results of the GNSS data processing with the position and elevation of the control
points and “top of tide staff” height from which elevations of the tide levels are calculated. Bench marks
occupied are same as those listed in the MWH Natovi drawing and were physically shown to thee GSD
Team by MWH survey representatives.
In Table 1, for bench marks IRO2 and IRO3, there is a vertical difference of 0.582 m and 0.096 m,
respectively, for the heights calculated by GSD in this survey and the heights provided by MWH. Based on
data from the Government control section, the Vatucou trig point height under the Cassini projection was
509 feet or 155.143 m; but based on a more recent control survey completed as part of the surveys for
the Viti Levu Photo control points, the final height adopted was 155.729 m. Figure 4 shows the typical
setup of the GNSS NetR9 on the control point.

13
Table 1 – GNSS data for bench marks and top of tide staff – Fiji Map Grid.
MWH Point GSD Survey Point Easting m Northing m
GSD-Ht MSL m
MWH-Ht-MSL Latitude Longitude Ellipsoid in metres
IR01-?? Nat1 1982638 3925337 1.477 ?? -17ー40'28.687894353" 178ー35'11.333563486" 56.877
IR02 Nat2 1982467 3925451 4.043 4.625 -17ー40'24.981992566" 178ー35'05.544748020" 59.453
IR03 Nat3 1982402 3925341 2.336 2.432 -17ー40'28.564287616" 178ー35'03.327709837" 57.75
Vatucou trig 1982184 3925831 155.729 ?? -17ー40'12.601240469" 178ー34'55.949258261" 211.153
Natovi ToTS 1.423
Figure 4 – showing the control point (IR01?)s surveyed using GNSS positioning and post processing of data
to determine position and elevation with respect to the Fiji Map Grid. This data contained in AutoCAD dwg
files is provided on disc with this report.
The base drawing initially used to plot the bathymetry and overlay images was the Natovi Jetty survey
.DWG file provided by MWH. Post processing results of the positions derived from the GNSS survey are
provided in Appendix 6.

14
Tide Data
After setting up the tide gauge a 25-hour tide watch was undertaken to verify the recorded data. A plot of
the results is shown in Figure 5. The full data set file is “Natovi-Pole to Gauge 25hr comparison.xls” as
provided in Appendix 7 for the digital tide data files.
Figure 5 – Plot of the 25-hour tide watch for Natovi tide gauge.
Tide gauge data from 28th
September through to 24th
November 2015, representing 58 days of continuous
data that was used to calculate the tide datums. During the initial phase of the survey the tide staff setup
was damaged by a docking ferry, where its ramp was inadvertently dropped on the staff during docking
manoeuvres and so a repeat set of measurements was required. How the damage happened is shown in
Figure 6.

15
Figure 6 – Spirit of Love docking at Natovi. This docking manoeuvre was captured during the 25-hr tide
watch which fortunately prevented a second mishap with the tide gauge being knocked out again. Note
that the ramp is split and it is this split that resulted in the gauge being damaged. With the current
running from left to right in the image, the ship uses the starboard mooring line to pull the stern up
current, to line up with the dock.
Based on the 58 days of data the tide levels were then kindly calculated for this report by Paul Davill of
the Tide Unit of the Bureau of Meteorology of Australia (see Appendix 5).
Table 2 provides is the levels calculated with respect to “Tide Gauge Zero”.
Table 2 – Tidal planes calculated for Suva (1997-2014) and the two gauges at Natovi (28112015-
24112015).
Name Number Ratio HAT* MHWS MHWN MSL MLWN MLWS ISLW LAT
Suva 67050 0.215 2.15 1.842 1.658 1.185 0.712 0.528 0.386 0.180
Natovi (RBR) 6705a 0.22 3.631 3.271 3.087 2.626 2.165 1.981 1.839 1.609
Natovi (Valeport) 6705b 0.215 3.616 3.272 3.082 2.616 2.15 1.961 1.819 1.573
*see Table 3 for Tide Datum long forms
Final levels calculated are based on the levelling results for the height of the tide staff and tide staff zero
with respect to the Fiji Map Grid vertical datum of MSL that is 0.0 m for topographical heights. The
reduced level (reference to FMG vertical Datum MSL) for tide staff zero was –2.626 m below MSL (Fiji
Vertical Datum). Based on the tide data for this survey, the reduced level of the tidal plane for Mean Sea
Level is calculated to be –0.011 m below the Fiji Map Grid vertical datum of MSL. Table 3 then provides

16
the reduced Tidal Planes for Natovi calculated with respect to the Fiji Map Grid Vertical Datum of MSL
based on the tide gauge zero reduced level height of –2.626 m as determined from our levelling survey.
Table 3 – Calculated Tide Datums for Natovi with respect to (wrt) Tide Gauge Zero and FMG MSL.
Tide Datum Height in m wrt to Tide Gauge Zero
RL Heights in metres with respect Fiji Map Grid Survey vertical Datum MSL
HAT Highest Astronomical tide 3.616 0.989
MHWS Mean High Water Spring 3.272 0.645
MHWN Mean High Water Neap 3.082 0.455
MSL Mean Sea Level 2.616 –0.011
MLWN Mean Low Water Neap 2.15 –0.477
MLWS Mean Low Water Spring 1.961 –0.666
LAT Lowest Astronomical Tide 1.573 –1.054
Based on the results of the tide measurements, there is a negative 1.1 cm height difference for MSL with
reference to the Fiji Map Grid Vertical Datum standard of MSL, which has an assigned height of 0.0 m.
Figure 7 is a diagram to scale, in the vertical sense, to help illustrate the relationship between the
respective datums from the hydrographic and a topographical perspectives.
Figure 7 – AutoCAD drawing describing the relationship between the heights of the various Tide Datums,
MSL and the control bench marks. The working file for this data is “Datum-levels-Natovi-
tidedata28102015-24112015.DWG”.
Further analysis of the Natovi tidal data with that of the Port of Suva tide gauge shows that the Natovi
high and low tides occur approximately 30 minutes earlier than the Port of Suva.

17
Data Processing – Multibeam, Single Beam Data
The multibeam data were processed using HYSWEEP software from HYPACK Inc. Sound-velocity profiles
were generated from conductivity, temperature, pressure profiles that were taken during the course of
the survey. Accurate sound-velocity profiles are required to correct swath data for refraction-path travel
times. Details of the data processing process are provided in Appendix 2.
XYZ Files Generation and Contour Plots
Using the multibeam processing software MAPPER xyz, files for surface modelling were extracted based
on cell matrix size of 1.0 m (see Appendix 2 for more details). A series of maps at scale 1:5000 showing
the bathymetric contours have been drawn using AutoCAD MAP 2012. The contour plot of the
bathymetry was generated using Quicksurf working inside AutoCAD for final plotting. Final file with “x,y,z”
data points used for the generation of contour plots is “Natovi Bathymetry-MSL-5msort.xyz”. This final
data has been referenced to Mean Sea Level based on tide data measured for this project. The single map
sheet showing the final bathymetric contours, sheet 1 at a scale of 1:2500 with a contour interval of
0.5 m is provided in Appendix 3.
Multibeam Bathymetry
Processing of the multibeam data from Natovi follows along the lines as described in Appendix 2
Processing files used are identified in the multibeam log. Based on the three days of survey for Natovi
area, the xyz data set was extracted from the edited file logs based on a cell matrix size of 1x1 m. Track
plot of the survey lines are shown in Figure 8.
It must be stated that the final bathymetry data set for Natovi was in the first instance reduced to LAT of
the Suva tide gauge. A final correction to MSL value for Natovi was then computed based on heights
relationships determined from the second round of measurements in the period from 28th
September
through to the 24th
November 2015, between the Suva and Natovi tide gauges. This was needed as the
tide gauge setup for that period was knocked out by a docking ferry before completion of the 25-hour
tide calibration and that the first levelling results were therefore corrupted. A final adjustment of 0.863 m
was applied to the Natovi data to reduce data to MSL based on water levels at the time of acquisition.

18
Figure 8 – Sketch map showing the multibeam and single beam tracks for Natovi port of entry survey.

19
Figure 9 is a contour map of the bathymetry of Natovi Jetty immediate area and approaches.
Figure 9 – Detail of bathymetry at Natovi Jetty. Contours interval is 0.5 m. The bathymetry reflects a very
uniform slope and curvature setting. Minor scouring can be interpreted from the contours close to the
southern end of the jetty. This is probably due to the fact that vessels prefer approaching from the south
to dock.
From the bathymetry shown in Figure 9, the jetty head has an average depth of about 5 m for mean sea
level. Serious scouring is evident at the jetty head. This is reflected in the morphology of the seabed
contours with the formation of a small basin some 7.5 m deep (reference MSL) that is seen to extend
some 80 m offshore. Personal communications from divers that have worked at Natovi indicate that the
scouring has also seriously undermined the jetty head. To the northeast of the jetty head an extensive
coral reef shelf dominates, which is associated with the bench or terrace of the seaward extension of the
peninsula of Natovi Point, for some distance offshore. This is a reflection of the underlying bedrock
structure. To the southwest of the jetty the shoreline indicates sediment-dominated shoaling gently to
form a broad sandy plain when exposed at low tide. Further offshore, the bathymetric isobars reflect a
very uniform slope and curvature that profiles the general shape of the coastline. A bathymetric ridge
trending northwest – southeast north of the jetty is an expression of the continuation of the underlying
bedrock structure of the peninsula where the jetty is sited.

20
Although not captured in the data set, the large reef patch to the southeast, Ballance Reef, results in a
narrow inshore channel sweeping behind Ballance Reef and the coastline, see Figure 10. This structure
has a significant impact on the hydrodynamic regime for the jetty at Natovi where currents appear to be
an issue for docking vessels. These currents are reported to flow from north to south with little to no
change with respect to state of tide (Pers. Comm., Dive Centre).
Vessel impacts on the seabed are also evident in the data. Apart from the scouring at the jetty head,
there are numerous anchor scars in the seabed further offshore from the jetty, indicative of the
procedures docking vessels need to follow when berthing at Natovi. Two significant features identified in
the bathymetry are: a mooring block some 3.5 m in length located approximately 120 m southwest of
the jetty head and a possible block or remnant of the old jetty in close proximity to the jetty head. These
are shown in Figure 11. The larger the vessel the more difficult it is to dock at the current site. Although
Ballance Reef affords some protection from the trade winds the local current regime remains an issue for
docking.
Figure 10 – Ballance Reef offshore from Natovi Jetty.
Hydrodynamics were not a requirement of this study but considering the location of the jetty; its present
level as well as forecasted increase in usage; and the size of the turning area basin behind Ballance Reef;
we recommend that a hydrodynamic study be incorporated into future design works.

21
Figure 11 – Vessel impact features apparent on the seabed around Natovi Jetty.
Sidescan Mosaic Data and Interpretation
The digital sidescan data for the area surveyed has been compiled into a mosaic at a scale of 1: 2500 with
a resolution of 0.18 m in an AutoCAD file “Natovi-Sidescan-Mosaic-Sheet-3.dwg” (see Figure 12). A pdf file
“ Natovi-Sidescan-Mosaic-Sheet-3.pdf” of this plot is provided in Appendix 7.
A large-scale map of the sidescan mosaic is presented in Appendix 3. The mosaic was generated using
Geocoder.

22
Figure 12 – Sidescan mosaic compiled from the multibeam data. Anchor scour marks are clearly
identifiable in the sediments of the basin. In the nearshore areas where scouring and where the sediments
are extremely fine and constantly mobilised, difficulties arose in finding a compromise in the gain versus
time single-pulse power out control of the equipment, resulting in artefact generated in the Nadir portion
of the beam. This is not a problem with the bathymetry data, which is best with respect to the Nadir area
of the beam across track. The Nadir is defined as the area directly below and centre of the cross track
beam.
Geology and Coastal Geomorphology of Natovi
The geology of Natovi is described in Fiji Geological Survey (later Mineral Resources Department) Bulletin
No.12 with Sheet 8 “Londoni” illustrating the geology of east and north east Viti Levu (Hirst 1965). The
Mba (using the spelling of the original report) Group is divided into a northern and southern facies
separated by the Wainimala Ridge.
The Natovi area lies within the northern facies of the Mba Group. The northern facies is reported as a
thick, extensive and almost undisturbed succession of sedimentary and basic volcanic rocks. For Natovi
the main formation present are andesitic conglomerates of the Tova Andesite which are mapped to

23
overlay the Nakorotumbu Basalt, the boundary between the two formations being inferred as having a
gradational contact. In examining the geology map sheet for the Natovi area, it is a little difficult to tell
from the geological legend the difference between the Tova Andesite unit representing the andesite
cobble conglomerate from the subordinate basaltic detritus of the Nakorotumbu Basalt unit. This
difficulty is referred to in reference to the interpretation of the borehole logs for the Natovi geotech holes
where the logged formation considers it to be the Nakorotumbu Basalt (Natovi factual report for MWH
ID2342-2014). The Tova andesites are described as consisting of two units, an andesite cobble
conglomerate with subordinate basaltic detritus and lava, mainly of augite andesite with lithic tuff
(grading to an agglomerate) with basal limestone. The basal limestone is not apparent in the boreholes at
Natovi. The older Nakorotubu Basalt formation on the other hand has as its major constituent volcanic
conglomerates which at best is an indistinctly bedded deposits of basaltic detritus. A later or younger
formation, the Korovou Sandstone, is of interest as it is known to occur in outcrop to the north and south
of Natovi. The Korovou sandstone is a grey calcareous and marly sandstone with shelly beds.
The geology is detailed in Figure 13.

24
Figure 13. Geological map of Natovi (after Hirst 1965).
From Hirst (1965), the southerly andesitic conglomerate facies of the Tova Andesite occurs along the
coastal slopes south-east of Tova peak (not captured in Figure 13), which is located to the far northwest.
This same formation is reported in Hirst (1965) to reappear and thickens south of Lawaki Village reaching
a maximum thickness of 243 m at Waivou Creek, south of Londoni. This andesitic conglomerate is crudely
bedded with sub-rounded to well-rounded cobbles and small boulders, generally less than 0.3 m across,
embedded in a poorly-sorted sand and gravel matrix cemented by carbonate.
In contrast, the Nakorotumbu Basalt group which has a gradational contact with the Tova Andesite group
does have some coarse bedding apparent in land forms. The conglomerates are poorly sorted with

25
abundant cobbles up to 30 cm in diameter. Occasional boulders are reported to be present but frequency
and size is a little vague in Hirst (1965). The proportion of cobbles to matrix is variable and the cobbles
appear angular to sub rounded. The ground mass of the rock is aphanitic, too fine to identify individual
grains with the naked eye. The inclusion of lithic tuff as fine-grained interbeds within the volcanic
conglomerate are described for other localities where the Nakorotumbu Volcanics Group is present but
has not been mapped in the Natovi area.
In borehole BH2342J 02 drilled west of the jetty, the borehole terminated in fresh bedrock that appears
to be a conglomerate with gravels that are well rounded representing the Tova Andesite(?). A number of
inclusions appear to show fine bedding. Borehole BH2342J.04 drilled to the east also terminated in fresh
bedrock. From the core photographs for borehole BH2342J.04 the bedrock appears to have more angular
inclusions suggesting the formation intersected may belong to the Nakorotumbu Basalt. No faults,
fractures or joints are shown to exist in the Nakorotumbu Basalt in Sheet 8, but in the accompanying
Bulletin 12 (Hirst 1965), Figure 3 did show a number of large NW—SE trending fractures for the
Nakorotumbu Fault Zone – the figure is reproduced here in Figure 14, below.
Figure 14 – Generalised geology and structure as presented by Hirst (1965) in Fiji Geological Survey
Bulletin No.12. Of interest in this generalised sketch map are the northwest–southeast trending fractures
representing the Nakorotumbu Fault Zone.

26
Seismic Data and Interpretation
Interpretation of the subsurface geology and structure with depth to top of weathered conglomerate
mapped is based on single channel seismic data collected offshore adjacent to Natovi Jetty. Single channel
seismic acquisition is an art form where many external parameters can degrade signal to noise such as
weather, sea state and vessel noise that can impact data quality. Seismic units can be identified from
stratigraphic analysis of seismic profiles on the basis of their geometry, contact relationships, internal
structure and reflection characteristics such as amplitude, continuity, frequency and configuration. The
seismic profiles also image the near-surface expressions of buried reefs, sediment thickness and top of
bedrock. A grid of ten seismic lines was run across the area and these lines are shown in the track plot in
Figure 15, referenced to the jetty site.
Figure 15 – Seismic line track plot with respect to Natovi Jetty. File reference is Natovi-seismic-profile-
location-map-Sheet 4.dwg and pdf.
Four boreholes drilled at Natovi have been integrated into the interpretation of the seismic profile data.
The locations of the boreholes are presented in Figure 16. For reference BH 1(BH2342J.01) was drilled on
the west side of the jetty in shallow water, BH 3 (BH2342J.03) on the east side of the jetty in shallow
water. BH 2 (BH2342J.02) was drilled on the west side of the jetty offshore in 6.5 m of water and BH 4
(BH2342J.04) on the east side offshore in 6 m of water. Seismic Line 003 is a NE-SW profile that intersects
both boreholes providing a continuous subsurface profile. Based on the borehole data, an interpretation

27
of three seismic profiles, Lines 1, 3, 4 are provided with their locations with respect to the boreholes
positions as illustrated in Figure 16.
Figure 16 – Location of interpreted seismic profiles and boreholes as discussed in this report. Up to four
distinct seismic facies have been delineated in the seismic data with mapping of the most definitive seismic
reflector that can be traced across the profile data to be the top of the weathered Tova Andesite
(conglomerate unit), based on the borehole data.

28
Figure 17 – Interpretation of single channel seismic profile Line 003.
In Figure 17, the location of seismic profile 3 with respect to the jetty head and boreholes is illustrated with the position of the jetty head, as indicated, to be located
between events 115 and 130 centred principally adjacent to event 120. Up to four seismic facies or units have been interpreted based on the seismic reflection patterns
seen in the seismic cross sections. Three major horizons correlating with the borehole data are delineated by a colour boundary line and are extrapolated along the
seismic profile based on seismic reflection patterns that appear to separate the units. Continuity of horizons across the study area is based on line intersections for
continuity. From the reflection data a geological interpretation of the horizon is made based on the interpretation of the borehole data. The first is seabed and is depicted
by the blue line. Horizon one is drawn as a brown line marking a major seismic reflector in the section that appears as a continuous reflector of high amplitude along the
length of the profile record. In this case, Line 003 intersects the two offshore boreholes BH2342J.02 and BH2342J.04. Using a figure of 1500 msec-1 for rock velocity to
convert the time section to depth Horizon one (brown reflector) is interpreted to represent the top of the weathered unit representing the probable top of the Tova
Andesite (conglomerate unit). Bedding is reported to be crude; however, the seismic reflection data displays internal bedding with high reflectance, that is amplitude, but
with some discontinuity in the reflectors being apparent. From the borehole data this reflectance discontinuity could be related to varying levels of weathering both
vertically and laterally in the horizon. In borehole BH2342J.02, a thicker section of marine silts and clays is recorded and this is well represented in the seismic data by a
sequence that has faint continuity and internal reflection characteristics, more often termed as a more transparent facies. The lack of internal flections is indicative of a
homogenous formation that is very uniform in composition. Weathered Tova Andesite (conglomerate sequence) was intersected at a depth of 17 m below seabed and
fresh bedrock at a depth of 24m below seabed in borehole BH2342J.02. The green horizon is interpreted as where the top of fresh bedrock occurs. The interpretation of
this horizon is based on the borehole data and where there is a definite change in the seismic reflections, frequency and amplitude in the record. In a zoomed section of
Line 003-1416, shown in Figure 18, some reflection is apparent but at a different wavelength or interval compared to the seismic facies representing the weathered
sequence interpreted to be the Tova Andesite conglomerate. Coming back to Figure 17, there appears to be a bench or terrace in the bedrock on which the current jetty
site is located, on the western edge of this structure. To the east of the jetty, the bedrock then has an apparent dip of 13 degrees to the east. Figure 18 is a detailed
section of the seismic data across the existing wharf face. Full profile interpretations in are presented Appendix 4.

29
Figure 18 – Detail of the seismic reflection profile Line 003 with respect to jetty face. Line also intersects or traverses boreholes 2342J.02 and 2342J.04.

30
Figure 19 – Seismic profile for Line 004 which traverses east west and closer to the jetty head.
In Figure 19, the profile shows the same subsurface structure as interpreted in profile 3 as presented in Figure 17. Likely top of fresh bedrock is delineated by the green
line and the top of the weathered conglomerate unit of the Tova Andesite is shown as a brown horizon. Bedrock is relatively flat lying with possible erosional irregularities
in its surface. To the west (left in image) the deep section of marine silt and clays can be seen. Near the jetty head the scouring in the seabed is evident depicted by a
noticeable depression. The orange horizon to the east of the jetty is interpreted to be a localised sequence of clay beds with fair continuity and amplitude representing a
layer of completely weathered conglomerate similar to the orange clay layer intersected in borehole 2342J.03. Full profile interpretations are provided in pdf file “Seismic
Profile-line-4-Natovi-Jetty.pdf” in Appendix 4 and on disc.

31
Figure 20 shows seismic profile 001 that traverses from offshore towards the jetty face and intersects lines 3 and 4.
Figure 20. Interpretation of line one. This seismic profile runs from south to north to capture the cross-section geology from the jetty to offshore. Near the jetty (EOL-1 in
profile) the data is affected by the shoaling and the vessel anchored at the jetty. The general dip of the top of the interpreted weather conglomerate bedrock is about 7
degrees. A thick sequence of marine silts and clays can be seen as you progress seawards. The lack of reflection data in the marine sequence is an indicator of its
homogeneity or uniformity in composition.

32
Based on the seismic interpretation, maps representing depth to the top of the weathered conglomerate
and top of fresh bedrock have been generated. These are shown in Figures 21, 22, respectively. Large-
scale plots of the same are provided in Appendix 4.
Figure 21 – Depth to top of weathered conglomerate as interpreted from the seismic data and drill core.
The contours are referenced to MSL with a contour interval of 2.0 m.

33
Figure 22 Depth to top of fresh bedrock as interpreted from the seismic data and drill cores. The contours
are referenced to MSL with a contour interval of 2.0 m.
Geological Interpretation
Based on the geological mapping by Hirst (1965) no significant faulting has been identified in the Natovi
area; however, based on the offshore seismic mapping, the possibility of faulting cannot be ruled out.
This interpretation is based on observations on the borehole data; the seismic profiles data; and the
imagery data where possible half grabens structures control the existing topography. Vatucou Peak can
be seen to be located on a ridge that has a distinct northwest-southeast axis extending in a southeast
direction that gives rise to the peninsular on which Natovi Jetty is located. Further to the west a small
creek, name unknown, with its mouth near IR03 on the coast is extremely linear with a strike that
parallels the axis of the ridge and scarp associated with Vatucou peak for a distance of 750 m.
Extrapolating this ridge-scarp axis southwards it appears to align with the western edge of the interpreted
subsurface high off the top of the weathered conglomerate unit as mapped from the seismic profile data.
The presence of a thick marine sequence of sediments to the west of this high also suggests structural
control, that is, faulting in the bedrock structure which has resulted in a thicker section of marine silts and
clays being present. A notable difference between the rock types at the end of the holes BH2324J.02 and
BH2324J.04 is evident in the photos of the cores. This is shown in Figure 23.

34
Figure 23 – Core from the end of boreholes BH2342J.02 (left) and BH2342J.04 (right). In Borehole 02 core
inclusions are well rounded with a section that shows fine bedding in the core between the interval 26-28
m. BH2342J.04 shown on the right, appears to have coarser inclusions that appear more angular.
In BH2324J.02, the rock type intersected at the base of the hole is a volcanic conglomerate with well-
rounded small cobble and gravel inclusions as interpreted by the team logging the borehole. A number of
the well-rounded inclusions present also exhibit fine bedding. In BH2324J.04 the rock type the borehole
was terminated in was interpreted by the team logging as representing a fresh conglomerate of the
Nakorotumbu Basalt. Upon closer examination of the core photos however, there does seem to be a
subtle difference. The inclusions appear more angular implying minimal transport before consolidation
indicating that the rock type is possibly a fault breccia. Thus considering the structural interpretation
presented in Figure 24, the bedding apparent in BH2342J.02 at approximately 27 m, also appears in
BH2324J.04 but at a shallower depth – at approximately 17.8 m – as a thinner unit implying if considered
a marker bed, displacement would be in the order of 10 m.
From Hirst (1965), the Tova Andesite (conglomerate unit) has a gradational relationship with the
Nakorotumbu Basalt with the Tova Andesite overlying it. Therefore in BH2342J.04, it is interpreted that at
or near the base of the Tova Andesite (conglomerate), the Nakorotumbu Basalt conglomerate intersected
in this borehole. With fresh bedrock, the seismic data is unable to distinguish the variation in rock type;
and with the lack of internal reflectors and depth, distinguishing possible fault boundaries is difficult and
so is only inferred based on the data presented. In seismic profile Line 003 a number of smaller faults

35
have been inferred. The ridge associated with Vatucou Peak appears to plunge in a southerly direction
with bedrock having an apparent dip to the east of 13.7 degrees based on the seismic profile
interpretation in Figure 17.
Figure 24 – Structural interpretation based on the borehole, seismic data and Google Earth imagery for
the Natovi Jetty area.
Geological Hazards – Liquefaction, Earthquakes, Tsunami and Sedimentation
In terms of geological hazards, sedimentation and liquefaction are existing issues for two of Fiji’s major
ports – Suva and Lautoka.
Liquefaction
Liquefaction is a process by which water-saturated sediment temporarily loses strength and acts as a fluid
during an earthquake. A consequence of this process is that ground damage may occur and impact
surface infrastructure. There are a number of factors required for liquefaction to occur. Foremost is
ground shaking and duration of the motion. Other factors are underlying sediment properties – grain size
and type; and levels of saturation with respect to the water table.

36
A scale used to measure ground shaking force in the context of liquefaction is the Modified Mercalli
Intensity. The scale has a range from 1 to 10; and while it measures the strength of ground shaking at a
particular location; it is not the same as measuring the ‘magnitude’ of an earthquake. On the Modified
Mercalli Intensity scale, liquefaction can begin to occur at MM7. Physically speaking, at MM7, it is difficult
to stand, furniture moves around and unreinforced structures like chimneys will break, roofing tiles and
water intakes as well will suffer damage. At Natovi the seismic data shows there is an average thickness
of 15 m of silt, sand and with intermittent clay beds over Horizon 3 which overlies bedrock.
Earthquakes
Figure 25 – Plot of earthquakes in Fiji Region from 1850 to 2015 that have similar parameters to that of
the earthquake that generated both liquefaction and a tsunami that damaged Suva Port in 1953.
Table 4 is a listing of strong earthquakes from Everingham 1983 taken from a table prepared by the
Pacific Disaster Centre.
37
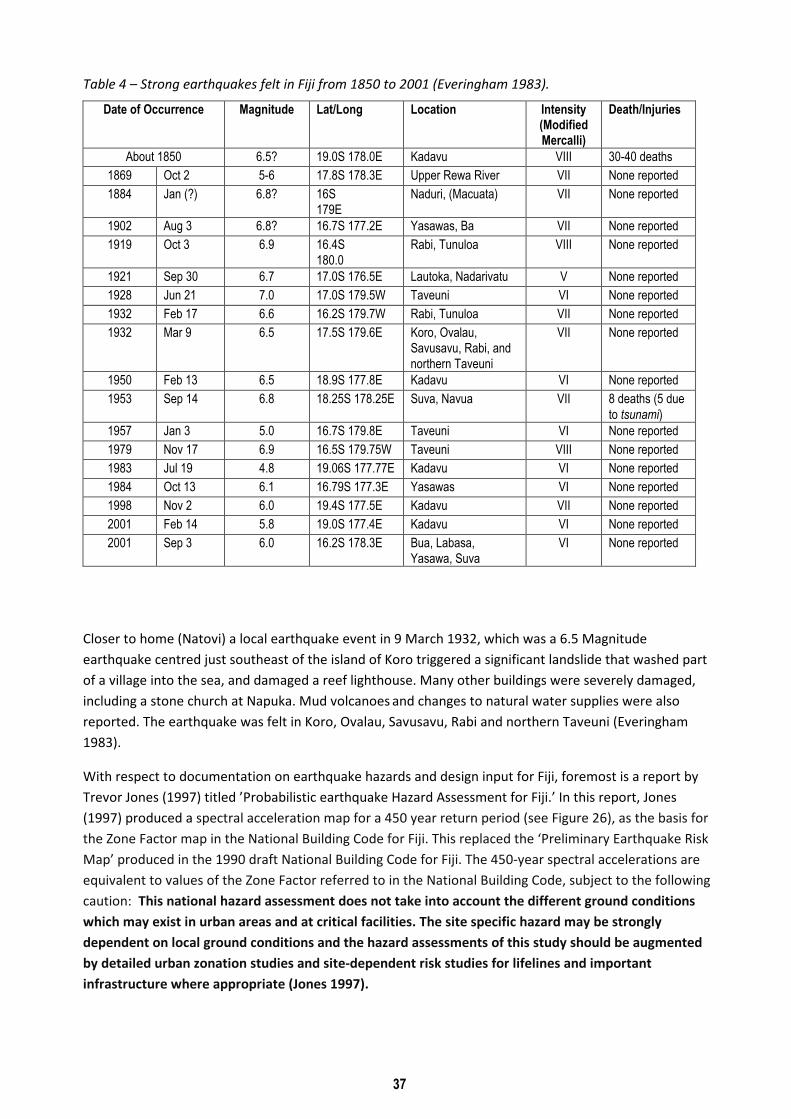
Table 4 – Strong earthquakes felt in Fiji from 1850 to 2001 (Everingham 1983).
Date of Occurrence Magnitude Lat/Long Location Intensity (Modified Mercalli)
Death/Injuries
About 1850 6.5? 19.0S 178.0E Kadavu VIII 30-40 deaths
1869 Oct 2 5-6 17.8S 178.3E Upper Rewa River VII None reported
1884 Jan (?) 6.8? 16S
179E
Naduri, (Macuata) VII None reported
1902 Aug 3 6.8? 16.7S 177.2E Yasawas, Ba VII None reported
1919 Oct 3 6.9 16.4S
180.0
Rabi, Tunuloa VIII None reported
1921 Sep 30 6.7 17.0S 176.5E Lautoka, Nadarivatu V None reported
1928 Jun 21 7.0 17.0S 179.5W Taveuni VI None reported
1932 Feb 17 6.6 16.2S 179.7W Rabi, Tunuloa VII None reported
1932 Mar 9 6.5 17.5S 179.6E Koro, Ovalau,
Savusavu, Rabi, and
northern Taveuni
VII None reported
1950 Feb 13 6.5 18.9S 177.8E Kadavu VI None reported
1953 Sep 14 6.8 18.25S 178.25E Suva, Navua VII 8 deaths (5 due
to tsunami)
1957 Jan 3 5.0 16.7S 179.8E Taveuni VI None reported
1979 Nov 17 6.9 16.5S 179.75W Taveuni VIII None reported
1983 Jul 19 4.8 19.06S 177.77E Kadavu VI None reported
1984 Oct 13 6.1 16.79S 177.3E Yasawas VI None reported
1998 Nov 2 6.0 19.4S 177.5E Kadavu VII None reported
2001 Feb 14 5.8 19.0S 177.4E Kadavu VI None reported
2001 Sep 3 6.0 16.2S 178.3E Bua, Labasa,
Yasawa, Suva
VI None reported
Closer to home (Natovi) a local earthquake event in 9 March 1932, which was a 6.5 Magnitude
earthquake centred just southeast of the island of Koro triggered a significant landslide that washed part
of a village into the sea, and damaged a reef lighthouse. Many other buildings were severely damaged,
including a stone church at Napuka. Mud volcanoes
and changes to natural water supplies were also
reported. The earthquake was felt in Koro, Ovalau, Savusavu, Rabi and northern Taveuni (Everingham
1983).
With respect to documentation on earthquake hazards and design input for Fiji, foremost is a report by
Trevor Jones (1997) titled ’Probabilistic earthquake Hazard Assessment for Fiji.’ In this report, Jones
(1997) produced a spectral acceleration map for a 450 year return period (see Figure 26), as the basis for
the Zone Factor map in the National Building Code for Fiji. This replaced the ‘Preliminary Earthquake Risk
Map’ produced in the 1990 draft National Building Code for Fiji. The 450-year spectral accelerations are
equivalent to values of the Zone Factor referred to in the National Building Code, subject to the following
caution: This national hazard assessment does not take into account the different ground conditions
which may exist in urban areas and at critical facilities. The site specific hazard may be strongly
dependent on local ground conditions and the hazard assessments of this study should be augmented
by detailed urban zonation studies and site-dependent risk studies for lifelines and important
infrastructure where appropriate (Jones 1997).

38
Figure 26 – Earthquake hazard map for Fiji, for a return period of 450 years. Contours are shown for values
of elastic, 5% damped, horizontal response spectral acceleration (in units of the acceleration due to
gravity, g), Katayama ground condition Type 3, at a period of T = 0.2 s. The acceleration contours over
marine areas indicate the general pattern of the hazard but cannot be used for the design of marine or
submarine structures. This map was recommended as the Zone Factor Map for the National Building Code
for Fiji (from Jones 1997).
Tsunami
Fiji experienced 17 tsunami events between 1877 and 2004. Of these, four had recorded wave heights
ranging between 0.5 and 5.0 meters. The 1953 event triggered the largest wave heights, measuring 1.5 to
5.0 meters above Mean Sea Level. Three other significant events were caused by earthquakes that
occurred off the island of Vanua Levu in 1881, and off of the coast of Chile in South America in both1877
and 1960. A list of tsunami events between 1870 and 2004 are presented in Table 5, some of which are
described in more detail below. It should be noted that these examples are categorized as either local,
regional, or distant tsunami, referring to Fiji’s proximity to the source region or point of origination. A
"local" tsunami is defined as one originating from a source within 200 kilometers of a given location –
where destructive effects are confined to coasts within 100 kilometers of the source. A “regional” tsunami
is defined as one where destructive effects are confined to within 1,000 kilometers from the source.
Finally, a "distant" tsunami (also referred to as a “Pacific-wide,” or “tele-tsunami”) originates from a
source greater than 1,000 kilometers away.

39
Table 5 – Tsunami recorded in Fiji from 1877 to 2004 (based on Everingham 1984).
Date of Occurrence Location Lat/Long Magnitude Category Location Wave Height (m)
1877 May 10 Chile 21.5S
71.0W
MS 8.3 Distant (D) Savusavu 2.0
(1881) Jul 12 Fiji (Vanua
Levu)
16.9S
179.0E
MS 6.8 Local (L) Labasa
Levuka
1.8
0.4
1953 Sep 14 Fiji – Suva 18.2S
178.3E
MS 6.8 L Nakaseleka
Makuluva
Suva
Beqa
Koro
4.3
3.4
1.8
1.4
1.4
1960 May 23 Chile 41.0S
73.5W
MS 8.4 D Suva 0.5
1967 Jan 01 Vanuatu 11.3S
166.0E
No
magnitude
listed
Regional (R) Suva <0.10
1968 Jul 25 Kermadec 30.8S
178.4W
MS 7.2 R Suva 0.10
1975 Dec 17 Fiji (Kadavu) 18.5S
178.6E
MS 5.2 L Suva
Ono
(0.2)
(0.2)
1975 Dec 27 Tonga 16.2S
172.5W
MS 7.8 R Suva 0.08
1976 Jan 15 Kermadec 29.0S
177.4W
MS 8.0 R Suva 0.22
1977 Jun 23 Tonga 16.8S
172.0W
MS 7.2 R Suva 0.16
1977 Oct 10 Kermadec 26.1S
175.3W
MS 6.9 R Suva 0.02
1995 May 16 Loyalty
Islands
23.0S
169.9E
MS 7.7 R Lautoka
Suva
0.06
0.05
1995 Jul 30 Chile 23.3S
70.3W
MW 8.0 D Lautoka 0.10
1997 Apr 21 Santa Cruz
Islands
12.6S
166.7E
MW 7.7 R Suva <0.10
1999 Nov 26 Vanuatu 16.4S
168.4E
MS 7.5 R Lautoka 0.13
2001 Jun 23 Peru 16.1S
73.4W
MW 8.4 D Suva
Lautoka
0.10
0.10
2004 Dec 26 Sumatra 3.29N
95.98E
MW 9.0 D Suva 0.11
Natovi appears not to be of any significant risk to tsunami events based on existing data.
Sedimentation
Many ports suffer from is sedimentation which over time reduces berthing depth so dredging becomes a
maintenance requirement. Based on the seismic data and the multibeam data extensive scouring of the
seabed and at the jetty head is occurring. The constant scouring to a certain extent is controlling the
sedimentation at Natovi Jetty. Continued high levels of suspended sediment in the water column may
result in possible long term impacts on engine cooling systems. This of course would need to be verified
with the ferry operators if indeed the levels of turbidity continually generated by the docking vessels are
having a long term impact on the engine cooling systems of the ferry’s.

40
CONCLUSIONS AND RECOMMENDATIONS
Conclusions
• There is a vertical difference of 0.582 m and 0.096 m, respectively, for the height calculated by
GSD in this survey and the heights provided by MWH, for the bench marks IRO2 and IRO3.
• Multibeam mapping of the Natovi jetty area has delineated well the present bathymetry and
morphology of the seabed.
• The calculated MSL depth at the jetty head averages 5.5 metres.
• Sedimentation is an issue at Natovi. Significant scouring is interpreted from the detailed
bathymetry mapping and is also seen in the seismic data. This is a direct result of vessel docking
at the jetty face. As much as 2 m of seabed has been stripped from under the jetty head (Pers.
comm., Dive Centre).
• The acquisition of tidal data at Natovi proved problematic due to serious damage sustained to the
unit by a ferry docking at the jetty coupled with a strong hydrodynamic prevailing.
• While hydrodynamics were not a requirement of this study; given the location of the jetty; the
high level of usage currently as well forecasted increase in the future; and the small working area
or turning basin between the coast and Ballance Reef – such a study needs to be incorporated
into future port design works.
• The seismic data reveals that bedrock is between 30 m and 35 m depth, with respect to the jetty
head location. To the west of the jetty a significant portion of the over-burden appears as a
homogenous sequence of fine sands silt with faint clay bands.
• The seismic data shows the current jetty head is located on the western edge of a bedrock high
that is interpreted to be an extension of a northwest-southeast ridge scarp feature associated
with Vatucou Peak. The apparent scarp seen in the Google Earth image is interpreted to represent
the western edge of a paleo half graben fault system that plunges to the south. The half graben
fault block(s) would account for the thicker sequence of marine silts and clays deposits found on
the west side of the jetty. To the east of the jetty the bedrock appears as a shallow terrace or
bench that extends some 400 m seaward where there is an apparent dip of 13.7 degrees to the
east.
• Based on the seismic data available, liquefaction would not be considered a significant geological
hazard at Natovi.
• Based on the tide data, and the GNSS levelling survey, actual Mean Sea Level is calculated to be
0.01 m below the topographic or Fiji Map Grid Vertical Datum of Mean Sea Level.
• There is no factual report or data known to suggest Natovi is at risk to possible tsunamigenic
events; however, it is something that should not be ruled out.

41
Recommendations
• Natovi Jetty is a very important piece of infrastructure, as the principal point of entry and
departure from Viti Levu into Vanua Levu and Ovalau. The lack of multi-faceted data sets in the
current design has compromised the functional ability of the jetty to cater for an expanding fleet
of vessels and vessel sizes using the site. Current and wave data need to be considered in any final
design.
• Sedimentation is an issue at Natovi, however the continued vessel traffic maintains a navigable
depth within the vicinity of the jetty head due to scouring which in turn generates high levels of
suspended sediments in the water column. This sediment load may have longer term
consequences for engine cooling systems.
• Data from four boreholes provided by FRA was integrated with the seismic data. This assisted
with the interpretation of the profiles and the subsurface geology of the jetty location. That said,
although the borehole logs aided interpretation, basing borehole locations on the seismic data
would have value added to the subsurface information now currently available.
• It is recommended that high-resolution multibeam surveys be scheduled for occasional
evaluation of seabed conditions at port and harbour sites.
• In rural settings such as Natovi, the lack of multi-faceted data sets that look at the long-term
impacts of important infrastructure development projects in the nearshore area is often
overlooked and needs to be improved.

42
REFERENCES
2015 Admiralty Tidal Tables, Volume 4, NP 204-11 published by the United Kingdom Hydrographic Office.
Everingham, Ian B., Reports of Earthquakes Felt in Fiji, 1850-1940. Fiji Ministry of Energy and Mineral
Resources, Mineral Resources Department. Suva, 1983. (Internal document – Report 48).
Everingham, Ian B., Tsunamis in Fiji. Fiji Ministry of Energy and Mineral Resources, Mineral Resources
Department. Suva, 1984. (Internal document).
Hirst, J. A., 1965. Geology of East and North –East Viti Levu. Explanation of Viti Levu Sheets No. 3, 7, 8,
13, 14. Geological Survey of Fiji, Bulletin 12.
Jones, T., 1997 Probabilistic Earthquake Assessment for Fiji. AGSO Record 1997/46. Australian Geological
Survey Organisation.

43
APPENDIX 1
Fugro MarineSTAR Signal Service Data Sheet
General Description
Fugro MarineSTAR provides consistent and highly reliable DGNSS corrections signal for both the American Global
Positioning System (GPS) and the Russian Global Navigation Satellite System (GLONASS) for marine survey and
positioning. DGNSS corrections are broadcast on dedicated communication satellite channels in all four INMARSAT
ocean regions and in addition to high power satellite SPOT beams including Oceania (OC-Sat) and Eastern Pacific
(AM-Sat).
Technical benefits :
� The world’s first composite GPS/GLONASS orbit and clock solution (G2) to cope with the effect of the forecast
increase in solar activity and interference [ref. Appendix B]
� The G2 service increases the number of satellites available by accessing the GLONASS satellite constellation in
addition to the GPS constellation. More satellites mean less likelihood of shadowing when operating close to
steep shorelines, mangroves and other obstructions ; “more is better”
� Integrated L-band corrections demodulator, GNSS positioning and heading sensor in a single rugged enclosure
combined with two antennas for ease of configuration and mobilisation.
� With seamless coverage, approximately 100 reference stations, 14 satellite uplinks and 2 global network
control centres, Fugro MarineSTAR provides consistent and highly reliable positioning services worldwide, 24
hours a day, 365 days a year.
� Fugro Satellite Positioning offers three totally independent decimeter level DGPS augmentation services that
provide High Accuracy positioning for the marine user:
Orbit/Clock Carrier Phase Based GPS Service (XP)
Orbit/Clock Carrier Phase Based GPS/GLONASS Service (G2)
Wide Area Network Carrier Phase Based Service (HP)
MarineSTAR DGNSS Signal Services
VBS
– Single frequency DGPS Service,
– Accuracy: 1 m, 2dRMS within 1000 km of a reference station
XP
– Dual frequency DGPS Service,
– XP positioning is based on satellite ‘orbits and clocks’ data based on the JPL reference station network.
– Accuracy: 20 cm, 2dRMS world-wide
HP
– Dual frequency DGPS Service,
– Based on the Fugro 100 + reference station network.
– Accuracy: 10 cm, 2dRMS within 1000 km of a reference station
G2
– Dual frequency DGPS Service,
– Based on precise ‘orbits & clocks’ technology for both GPS and Glonass using the Fugro~ESA G2 reference station
network.
– Accuracy: 15 - 20 cm, 2dRMS world-wide
pecifications Trimble SPS852
Modular GPS Receiver
Receiver Name SPS852 Modular GPS Receiver
Configuration Option
Base and Rover interchangeability Yes
Rover position update rate 1 Hz, 2 Hz, 5 Hz, 10 Hz, 20 Hz
Rover maximum range from base radio Unrestricted, typical range 2–5 km (1.2–3 miles) without radio repeater
Rover operation within a VRS™ network Yes
Heading and Moving Base operation Yes7

44
Factory options See Receiver Upgrades below
General
Keyboard and display Vacuum Fluorescent display 16 characters by 2 rows. Invertable
On/Off key for one-button startup
Escape and Enter keys for menu navigation
4 arrow keys (up, down, left, right) for option scrolls and data entry
Dimensions (L × W × D) 24 cm × 12 cm × 5 cm (9.4 in x 4.7 in x 1.9 in) including connectors
Weight 1.65 kg (3.64 lb) receiver with internal battery and radio
1.55 kg (3.42 lb) receiver with internal battery and no radio
Antenna Options
GA510 L1/L2/L2C GPS, SBAS, and OmniSTAR
GA530 L1/L2/L2C GPS, SBAS, and OmniSTAR
GA810 GPS, Glonass, OmniSTAR, SBAS, Galileo (optimized for OmniSTAR)
L1/Beacon, DSM 232 Not Supported
Zephyr™ Model 2 L1/L2/L2C/L5 GPS, Glonass, OmniSTAR, SBAS, Galileo
Zephyr Geodetic™ Model 2 L1/L2/L2C/L5 GPS, Glonass, OmniSTAR, SBAS, Galileo
Zephyr Model 2 Rugged L1/L2/L2C/L5 GPS, Glonass, OmniSTAR, SBAS, Galileo
Zephyr, Zephyr Geodetic, Z-Plus, Micro-Centered™ Refer to Antenna specification
Temperature
Operating1 -40 °C to +65 °C (-40 °F to +149 °F)
Storage -40 °C to +80 °C (-40 °F to +176 °F)
Humidity MIL-STD 810F, Method 507.4
Waterproof IP67 for submersion to depth of 1 m (3.3 ft), dustproof
Shock and Vibration
Pole drop Designed to survive a 1 m (3.3 ft) pole drop onto a hard surface
Shock – Non-operating To 75 g, 6 ms
Shock – Operating To 40 g, 10 ms, saw-tooth
Vibration Tested to Trimble ATV profile (4.5 g RMS): 10 Hz to 300 Hz: 0.04 g/Hz2
300 Hz to 1,000 Hz; –6 dB/octave

45
APPENDIX 2
Equipment Specifications
Configuration, Calibration and Processing
The system used was R2Sonic 2024 multibeam system configured with a POSmV Wave master for heave pitch and
roll and a Trimble R10 GNSS system with dual antenna arrangement providing heading. A Universal Sonar Mount
system was used to mount the complete system in a repeatable reference frame.
Motion Sensor

46

47
Universal Multibeam Side mount

48
Multibeam Specifications

49
Navigation and heading control

50
Table detailing sensor offsets
Horizontal Offsets with respect to IMU Vertical Reference is Water Line
SENSOR X (Port /Starboard)
Y(Forward ,Aft) Z WRT Water line
GPS-Primary Antenna 0.248 m 1.1985 m -3.265 m
MRU 0 0 0.5403 m
R2Sonic 0 0.3803 m 1.3152.m

51
Sound-Velocity Profiler: Sound-velocity measurements in the water column are required to correct for beam
refraction as the sound passes through the water column. Sound-velocity profiles in the survey area are measured
using a Valeport mini sound velocity profiler. Sound velocity corrections applied during the processing and editing
phase.
Multibeam Bathymetry Data Editor: Multibeam data, once collected, require editing and cleaning before
presentation of data can be considered. This is accomplished using HYSWEEP software from HYPACK Inc.
Tidal reductions: All bathymetric data acquired during the survey are reduced to Tide Gauge Zero based on tidal data
recorded by a Valeport and or RBR tide recorder on site over a of period 35 days. Calculation of tidal planes were
done by Paul Davill of the National tidal Facility The South Pacific Sea Level and Climate Monitoring Project and
SOPAC from the Kings Wharf tide gauge maintained by. These corrections are applied during the editing and cleaning
of the data.

52
Multibeam Data-Presentation software: Commercially available software that accepts X, Y, Z points can be used.
Once the datasets have been cleaned and reduced, presentation of the data can be accomplished in software
package is such as AutoCAD using QuickSURF, MapINFO using Vertical Mapper, or Surfer for that matter.
PATCH TEST CALIBRATION
The patch test is a multibeam calibration procedure that is completed after installation and setup to calculate sonar
roll, pitch, yaw and GPS latency errors in the multibeam data. Data for the patch test are collected over specific
bottom terrain in a specific order. The roll-angle test is done in an area where the bottom terrain is smooth and flat,
running the same line in different directions at survey speed. Latency test follows running a line twice in the same
direction up a slope once at survey speed and once as slowly as possible. The pitch test is done running reciprocal

53
lines with a slope at normal survey speed. The yaw test is done last by running offset lines in the same direction,
approximately 2 to 4 times water depth apart. The roll test is by far the most important, because it is misalignment in
the roll direction that leads to the greatest survey errors.
The Patch test utility in HYSWEEP was used to calculate the patch test calibrations parameters.
Patch Test calibration Completed in Natovi on the 11 July6th
2015.
For processing the patch files, the following were used in the final analysis.
The patch test was completed in the vicinity of Natovi Wharf, Viti Levu.
Table showing patch test processing and results.
Patch test Files Results
LATENCY Natovi192_003_0503 0.10 secs
Natovi192_003_0454
ROLL Natovi192_001_0426- -0.25 degrees
Natovi192_001_432
PITCH Natovi192_003_0503 12.0 degrees
Natovi192_003_0509
YAW Natovi192_003_0503 -2.0 Degrees
Natovi192_004_0513
MULTIBEAM DATA PROCESSING
MULTIBEAM DATA FILES
A log of all the files for the multibeam data is provided in Appendix 4. The original data files have the file extension
*.hsx and are archived on DVD. For processing, the raw *.hsx files are processed with HYSWEEP and saved as Edited
HYSWEEP files *.hs2. During the editing process the raw files are first imported into the sweep editor along with a
tidal-correction file and sound-velocity file. Tidal and sound-velocity-profile correction files have been archived along
with the raw data files. The graphical representation of all collected data, position, heave, heading and soundings,
makes it easier to separate good points from bad.
Once satisfied with the graphs, the Sweep Editor will convert the raw survey data into X, Y, Z points and redisplay
them, again in a graphical format. In multibeam surveys, data spikes in the dataset occur due to fish, bubbles, hull
turbulence, etc.
SOUNDING REDUCTIONS
Multibeam surveys produce a lot more data than are actually required, particularly for presentation. Sounding
reductions of a multibeam data set are done using the Mapper program in HYSWEEP. This program will load an
entire survey and reduce the data to the desired density. This data reduction is accomplished through gridding. A
grid is created from a matrix with rectangular cells of any size, and the soundings are loaded and reduced to one per
cell.

54
APPENDIX 3
Bathymetric Map Sheets
Natovi Jetty Bathymetry-MSL- Map Sheet 1
Files: Natovi-Jetty Bathymetry-MSL Sheet 1.pdf, Natovi-Jetty Bathymetry-MSL Sheet 1.dwg
Natovi Jetty Soundings-MSL- Map Sheet 2.dwg
File:Natovi Jetty Soundings-MSL- Map Sheet 2.pdf
Natovi Side Scan Mosaic- Map Sheet 3.dwg
File:Natovi Side Scan Mosaic Map Sheet 3.pdf
Natovi-Datum-Levels.dwg

55
APPENDIX 4
Natovi –Seismic Data
NATOVI-seismic-profile-location-map-Sheet-4
File: NATOVI-seismic-profile-location-map-Sheet-4.pdf, NATOVI-seismic-profile-location-map-Sheet-
4.dwg.
NATOVI- Depth-Bedrock-map-Sheet-5
Files: NATOVI- Depth-Bedrock-map-Sheet-5.pdf, NATOVI- Depth-Bedrock-map-Sheet-5.dwg
Scanned Seismic line profile sections -
Natovi_sol_7.tif
Natovi_sol_6.tif
Natovi_line_5tif
Natovi_line_1.tif
Natovi_line_3.tif
Natovi_line_2.tif
Seismic-profile-line-1-Natovi-Jetty.dwg
Seismic-profile-line-6-Natovi-Jetty.dwg
Seismic-profile-line-1-Natovi-Jetty.pdf
Seismic-profile-line-6-Natovi-Jetty.pdf

56
APPENDIX 5
Tide Data and Analysis
Natovi Tide pole 25-hour tide watch Comparison to recorded data.
Data File “Natovi Pole – Gauge-25hr Comparison.xls”

57
Tide analysis report from Paul Davill
Normally we compute the tidal analysis with at least 30 days of data. Below is an analysis on the 19 days of data from
the Natovi-adj-ML column of your Natovi-Suva-TL-comparison.xlsx spreadsheet.
ort A02.685year##vday%%%fstd%%%endd***doc 24oth 0step 10 2.6847 ?
FIJI ISLANDS, VANUA BALAVU - NATOVI 4171817859 -1200 67290
1 0.0410686 0.0310 290.4153 Sa
2 0.0821373 0.0142 334.6388 Ssa
5 1.0980331 0.0188 242.0653 Mf
6 12.8542862 0.0051 242.5614 2Q1
10 13.9430356 0.0466 202.2334 O1
15 14.9589314 0.0249 231.8291 P1
16 15.0000000 0.0071 31.3880 S1
17 15.0410686 0.0851 239.9183 K1
23 16.1391017 0.0019 214.1492 OO1
27 27.9682084 0.0275 112.7724 MEU2
28 28.4397295 0.1248 142.0895 N2
31 28.9841042 0.5535 174.2952 M2
35 29.9589333 0.0039 185.5606 T2
36 30.0000000 0.0806 175.9769 S2
37 30.0410667 0.0015 193.0843 R2
38 30.0821373 0.0230 167.2145 K2
43 43.4761563 0.0044 217.8234 M3
46 45.0410686 0.0037 325.3339 SK3
48 57.9682084 0.0020 13.2819 M4
50 58.9841042 0.0024 223.1184 MS4
52 60.0000000 0.0025 17.1092 S4
55 86.9523127 0.0017 238.7252 M6
57 87.9682084 0.0019 332.4089 2MS6
59 88.9841042 0.0013 190.6370 2SM6
116 0.0000000 2.6847 0.0000 A0
NATOVI - 2015 ANALYSIS IN METRES Time zone -1200
Six-minute sea levels in metres from 20-Jul-2015 to 07-Aug-2015. No gaps
Given and related from SUVA 1997-2012 analysis
Analysis of 09-Oct-15 for 24 constituents on 19 days of data
Sa and Ssa from 15 years of Suva sea levels from 1997 to 2012 Analysis
Relationships from 15 years of Suva sea levels from 1997 to 2012 Analysis
(P1:K1, S1:K1, N2:M2, T2:S2, R2:S2 and K2:S2)
Sample Correlation Coefficient is 0.9967
Standard Devn of the Residuals is 0.0337
Mean Sea Level is 2.685m above adjusted Tide Gauge Zero
--------------------------------------------------------
Tide is semi-diurnal. Ratio = 0.208 is less than 0.5
HAT = 3.620
MHWS = 3.319
MHWN = 3.158
MSL = 2.685
MLWN = 2.212
MLWS = 2.051
ISLW = 1.919
LAT = 1.785

58
APPENDIX 6
GNSS Station Results and Data Processing

59
APPENDIX 7
Natovi Jetty – Digital Data files
Natovi-survey draft report.pdf
Appendix -3 Bathymetry Files
Sheet 1 Natovi Jetty Bathymetry-MSL.DWG
Sheet 2 Natovi Jetty Soundings –MSL.DWG
Sheet 1 Natovi Jetty Bathymetry-MSL.PDF
Sheet 2 Natovi Jetty Soundings –MSL.PDF
Sheet 1 Natovi Jetty Sidescan.PDF
Sheet 2 Natovi Jetty Sidescan.PDF
Natovi Jetty- Bathymetry –MSL.XYZ
Appendix-4 Seismic –Data
NATOVI-seismic-profile-location-map-Sheet-4
File: NATOVI-seismic-profile-location-map-Sheet-4.pdf
NATOVI- Depth-Bedrock-map-Sheet-5
File: NATOVI- Depth-Bedrock-map-Sheet-5.pdf
Scanned Seismic line profile sections -
Natovi_sol_7.tif
Natovi_sol_6.tif
Natovi_line_5tif
Natovi_line_1.tif
Natovi_line_3.tif
Natovi_line_2.tif
Seismic-profile-line-1-Natovi-Jetty.dwg
Seismic-profile-line-6-Natovi-Jetty.dwg
Seismic-profile-line-1-Natovi-Jetty.pdf
Seismic-profile-line-6-Natovi-Jetty.pdf
Appendix-5 Tide Data files
Datum-levels-Natovi.DWG
Natovi Pole to Gauge 25Hr Comparison.xls
Natovi-Suva-TL-Comparison.xls