multi-vessel pci vs. cabg william r. alexis, m.d., m.p.h...
TRANSCRIPT
MultiMulti--vessel PCI vs. vessel PCI vs. CABGCABG
William R. Alexis, M.D., M.P.H., F.A.C.C.William R. Alexis, M.D., M.P.H., F.A.C.C.
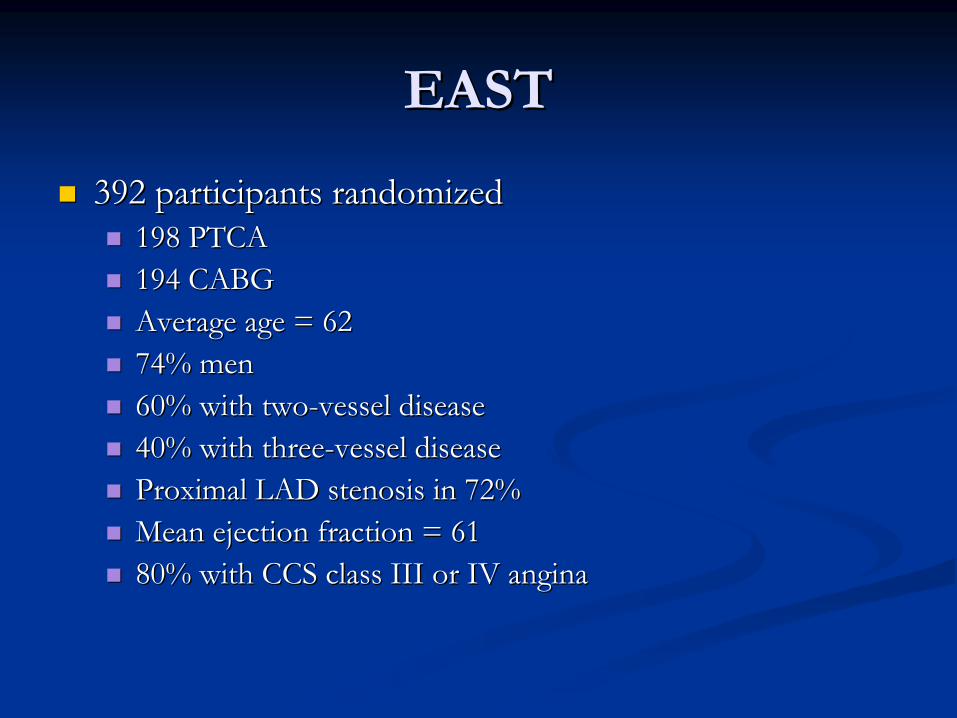
EASTEAST
392 participants randomized392 participants randomized198 PTCA198 PTCA194 CABG194 CABGAverage age = 62Average age = 6274% men74% men60% with two60% with two--vessel diseasevessel disease40% with three40% with three--vessel diseasevessel diseaseProximal LAD stenosis in 72%Proximal LAD stenosis in 72%Mean ejection fraction = 61Mean ejection fraction = 6180% with CCS class III or IV angina80% with CCS class III or IV angina
King SB, et al. NEJM 1994;331:1044-1050
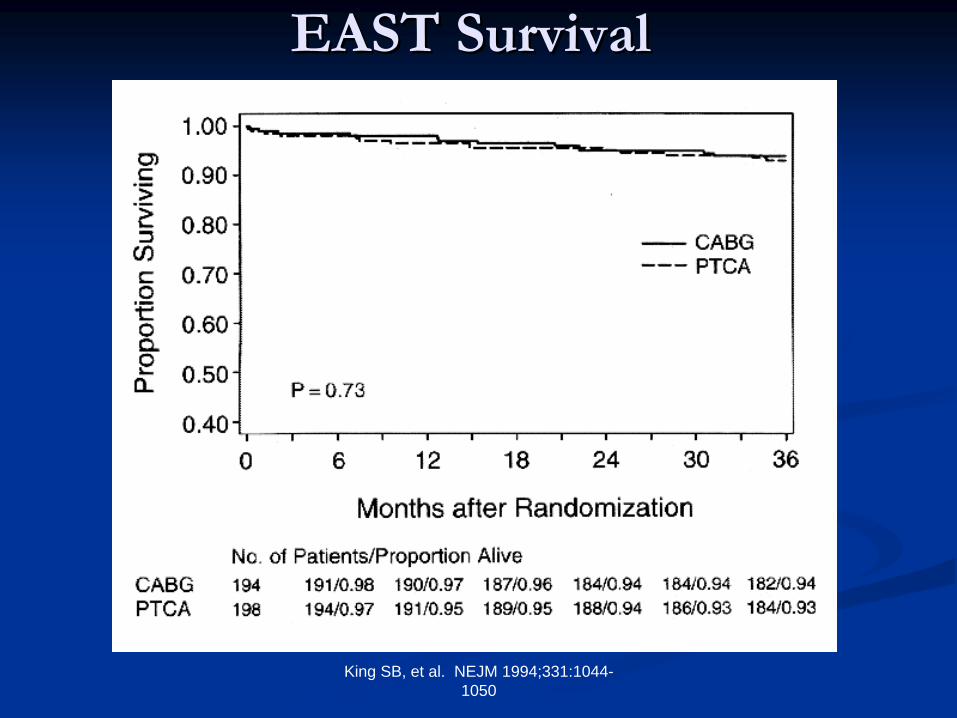
EAST SurvivalEAST Survival
King SB, et al. NEJM 1994;331:1044-1050
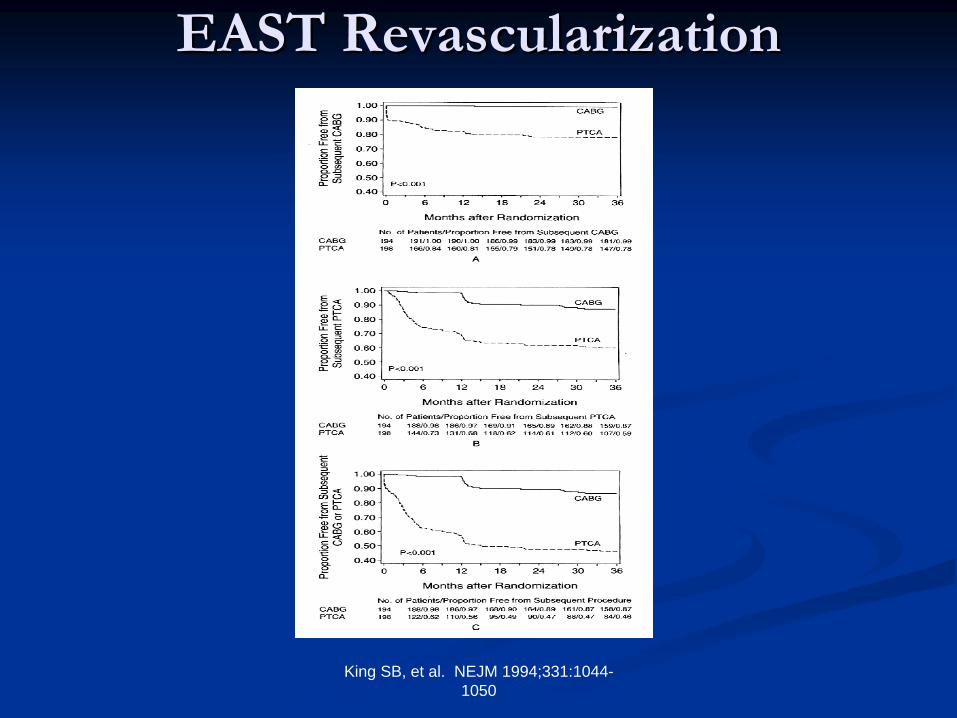
EAST RevascularizationEAST Revascularization

EASTEAST Secondary End PointsSecondary End Points
1% of CABG patients and 22% of PTCA patients 1% of CABG patients and 22% of PTCA patients underwent additional surgery (P<0.001)underwent additional surgery (P<0.001)PTCA or surgery required in 13% of the CABG group PTCA or surgery required in 13% of the CABG group compared with 54% of the PTCA group (P<0.001)compared with 54% of the PTCA group (P<0.001)Most subsequent PTCAs in the PTCA group were Most subsequent PTCAs in the PTCA group were performed during the first six monthsperformed during the first six months

FollowFollow--up Conditionup Condition
No difference in ejection fraction (69%)No difference in ejection fraction (69%)20% of patients in the PTCA group had CCS 20% of patients in the PTCA group had CCS Class II, III, or IV angina compared to 12% in Class II, III, or IV angina compared to 12% in the CABG group (P=0.039)the CABG group (P=0.039)No difference in terms of functional statusNo difference in terms of functional status
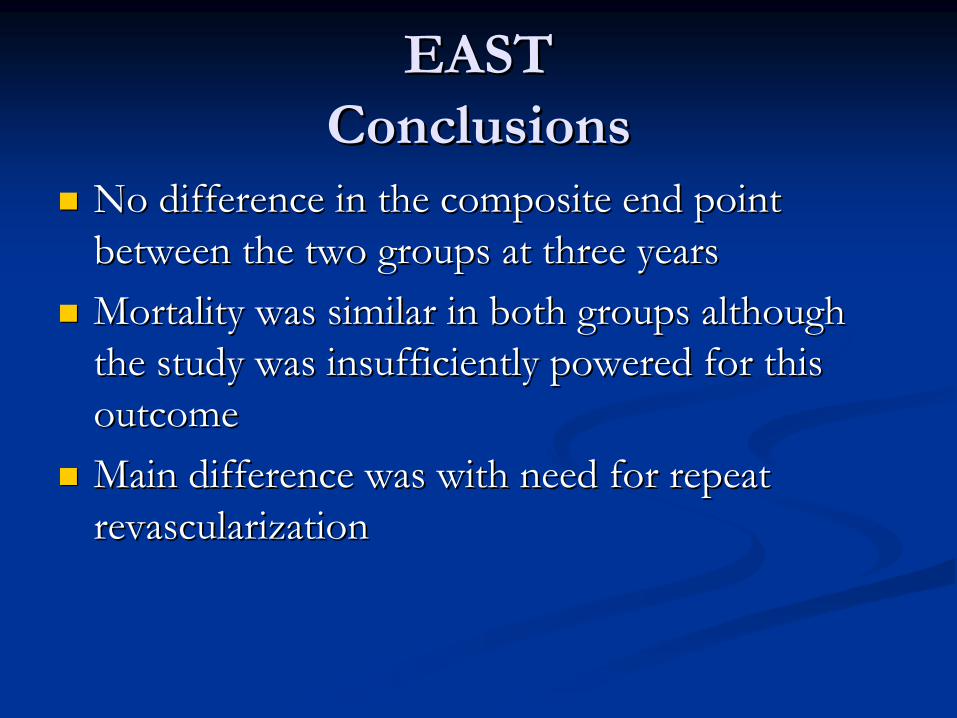
EASTEAST ConclusionsConclusions
No difference in the composite end point No difference in the composite end point between the two groups at three yearsbetween the two groups at three yearsMortality was similar in both groups although Mortality was similar in both groups although the study was insufficiently powered for this the study was insufficiently powered for this outcomeoutcomeMain difference was with need for repeat Main difference was with need for repeat revascularizationrevascularization

EAST 8EAST 8--Year FollowYear Follow--upup

EASTEAST 88--Year FollowYear Follow--upup
100% follow100% follow--upupCABG survival was 82.7% and PTCA survival CABG survival was 82.7% and PTCA survival was 79.3% (P=0.40)was 79.3% (P=0.40)Slight, nonSlight, non--significant separation of survival significant separation of survival curves in favor of surgery for 3curves in favor of surgery for 3--vessel diseasevessel diseaseAfter five years survival curves separated for After five years survival curves separated for diabetics (n=59) and favored surgery diabetics (n=59) and favored surgery
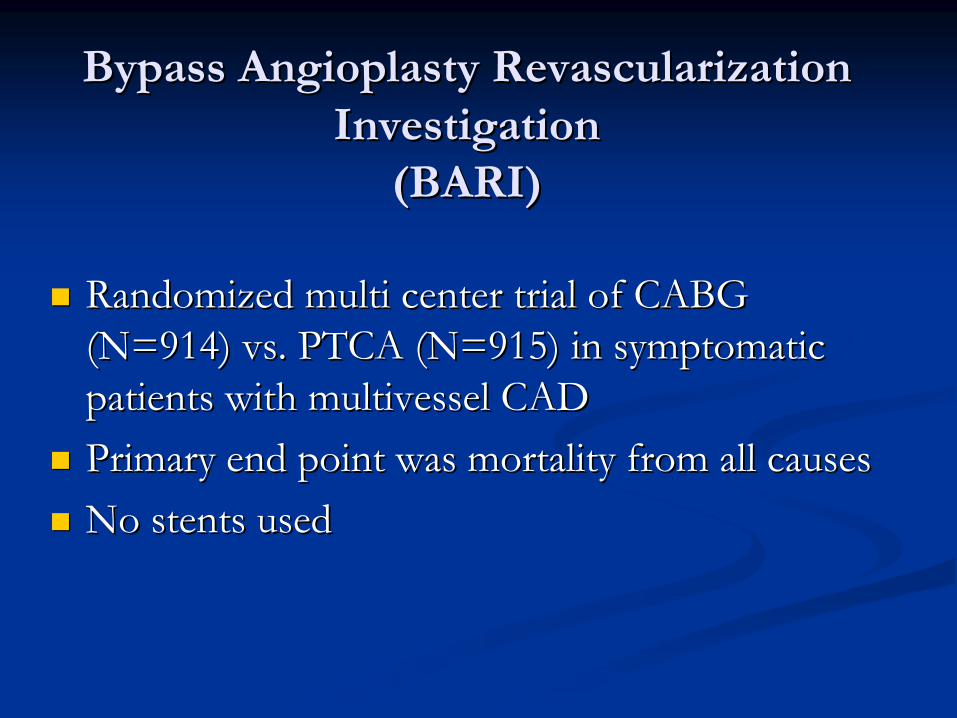
Bypass Angioplasty Revascularization Bypass Angioplasty Revascularization InvestigationInvestigation
(BARI)(BARI)
Randomized multi center trial of CABG Randomized multi center trial of CABG (N=914) vs. PTCA (N=915) in symptomatic (N=914) vs. PTCA (N=915) in symptomatic patients with multivessel CADpatients with multivessel CADPrimary end point was mortality from all causesPrimary end point was mortality from all causesNo stents usedNo stents used
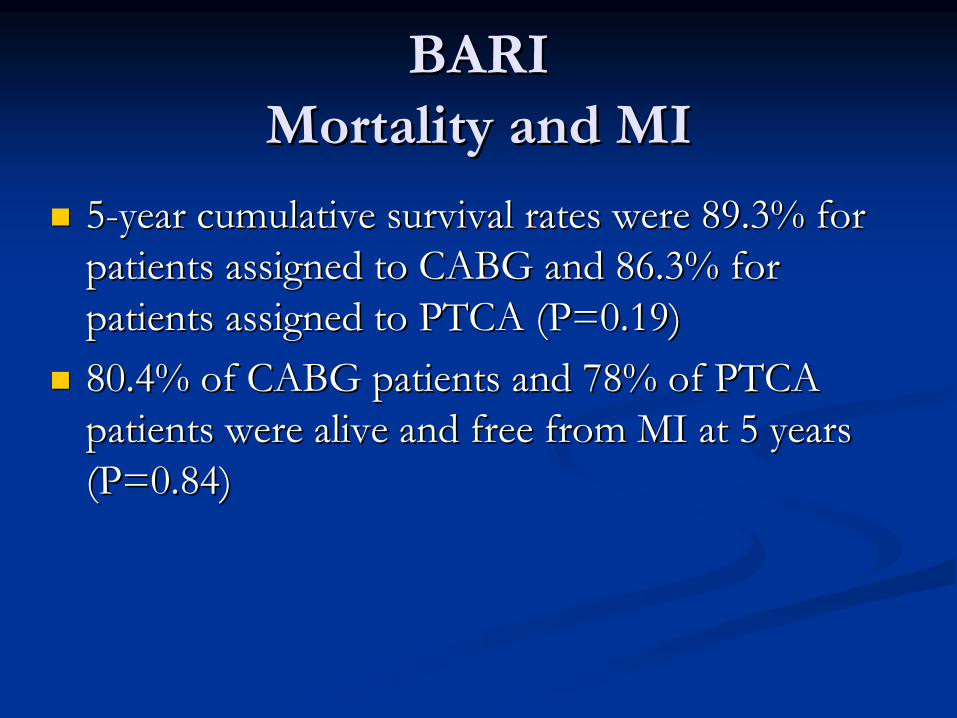
BARIBARI Mortality and MIMortality and MI
55--year cumulative survival rates were 89.3% for year cumulative survival rates were 89.3% for patients assigned to CABG and 86.3% for patients assigned to CABG and 86.3% for patients assigned to PTCA (P=0.19)patients assigned to PTCA (P=0.19)80.4% of CABG patients and 78% of PTCA 80.4% of CABG patients and 78% of PTCA patients were alive and free from MI at 5 years patients were alive and free from MI at 5 years (P=0.84)(P=0.84)
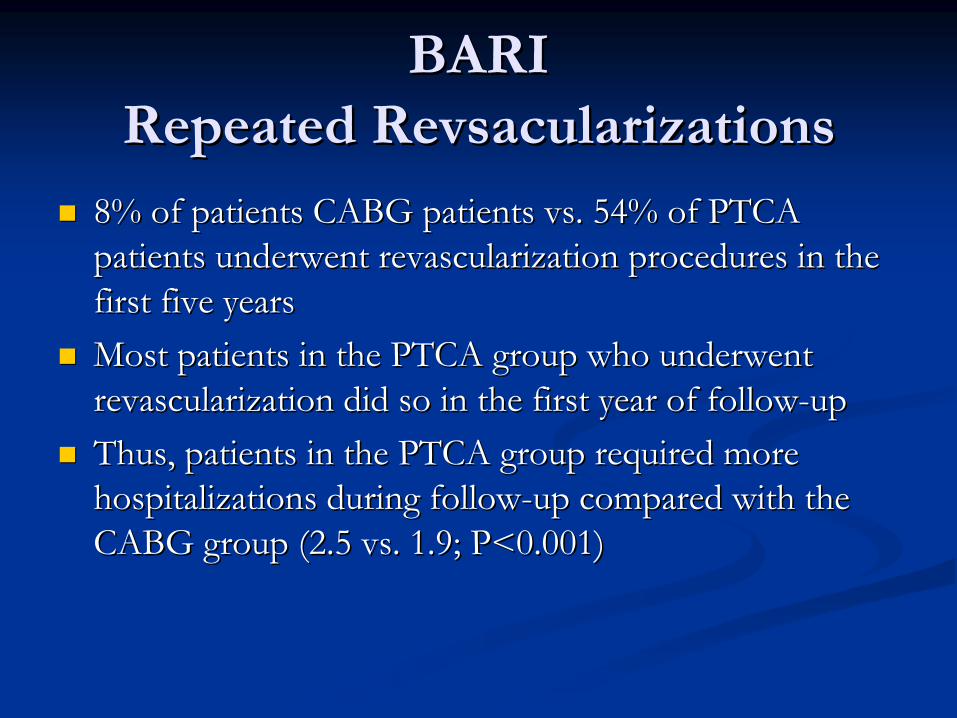
BARIBARI Repeated RevsacularizationsRepeated Revsacularizations
8% of patients CABG patients vs. 54% of PTCA 8% of patients CABG patients vs. 54% of PTCA patients underwent revascularization procedures in the patients underwent revascularization procedures in the first five yearsfirst five yearsMost patients in the PTCA group who underwent Most patients in the PTCA group who underwent revascularization did so in the first year of followrevascularization did so in the first year of follow--upupThus, patients in the PTCA group required more Thus, patients in the PTCA group required more hospitalizations during followhospitalizations during follow--up compared with the up compared with the CABG group (2.5 vs. 1.9; P<0.001)CABG group (2.5 vs. 1.9; P<0.001)

BARIBARI Mortality within SubgroupsMortality within Subgroups
The only significant difference occurred in the The only significant difference occurred in the subgroup with diabetes (19%)subgroup with diabetes (19%)Five year survival was 65.5% among diabetics Five year survival was 65.5% among diabetics assigned to PTCA vs. 80.6% among diabetics assigned to PTCA vs. 80.6% among diabetics assigned to CABG assigned to CABG

BARIBARI ConclusionsConclusions
No statistically significant difference in survival No statistically significant difference in survival between the two treatment strategiesbetween the two treatment strategiesFiveFive--year survival free of MI was similar in both year survival free of MI was similar in both treatment groupstreatment groupsAn initial strategy of angioplasty was associated with a An initial strategy of angioplasty was associated with a substantially greater need for additional substantially greater need for additional revascularization procedures, especially during the first revascularization procedures, especially during the first year of followyear of follow--upupSurvival was reduced in diabetic patients assigned to Survival was reduced in diabetic patients assigned to PTCA compared with CABGPTCA compared with CABG

JACC 2000;35:1122-9
BARI SurvivalBARI Survival

BARIBARI SevenSeven--Year OutcomeYear Outcome
SevenSeven--year survival rates for the total population were year survival rates for the total population were 84.4% for CABG and 80.9% for PTCA (P=0.043)84.4% for CABG and 80.9% for PTCA (P=0.043)SevenSeven--year survival rates for diabetics (N=353) were year survival rates for diabetics (N=353) were 76.4% for CABG and 55.7% for PTCA (P=0.0011)76.4% for CABG and 55.7% for PTCA (P=0.0011)Among patients without diabetes cumulative survival Among patients without diabetes cumulative survival was similarwas similarThe diabetic subgroup was the only one with a The diabetic subgroup was the only one with a significant treatment difference at seven yearssignificant treatment difference at seven years

BARIBARI SevenSeven--Year OutcomeYear Outcome
Diabetics who received at least one LIMA graft had Diabetics who received at least one LIMA graft had better sevenbetter seven--year survival compared with those who year survival compared with those who received only SVGsreceived only SVGsSurvival in the diabetic SVG group was nearly identical Survival in the diabetic SVG group was nearly identical to that for the diabetic PTCA groupto that for the diabetic PTCA groupAmong nonAmong non--diabetics, these three groups had nearly diabetics, these three groups had nearly identical survival ratesidentical survival rates

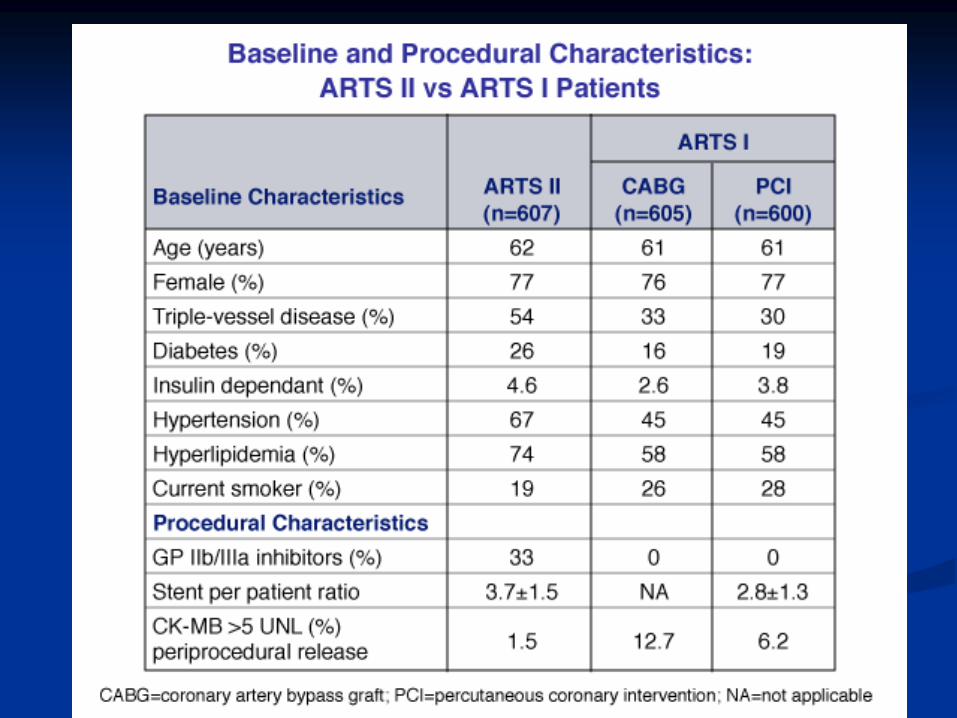
••Randomized comparison of stent vs CABG in 1205 Randomized comparison of stent vs CABG in 1205 patients with multivessel CAD suitable for either patients with multivessel CAD suitable for either technique with equivalent degree of revascularizationtechnique with equivalent degree of revascularization
CABGCABG n = 605n = 605
STENT STENT n = 600n = 600
••Excluded EF <30%, prev CVA, recent MIExcluded EF <30%, prev CVA, recent MI
••11O endpoint = endpoint = freedom from MACCE (death, MI) and stroke freedom from MACCE (death, MI) and stroke (or TIA, RIND), or repeat revasc. at 12 mos.(or TIA, RIND), or repeat revasc. at 12 mos.
DESIGNDESIGNARTS StudyARTS Study
Serruys et al, NEJM 2001;344:1117
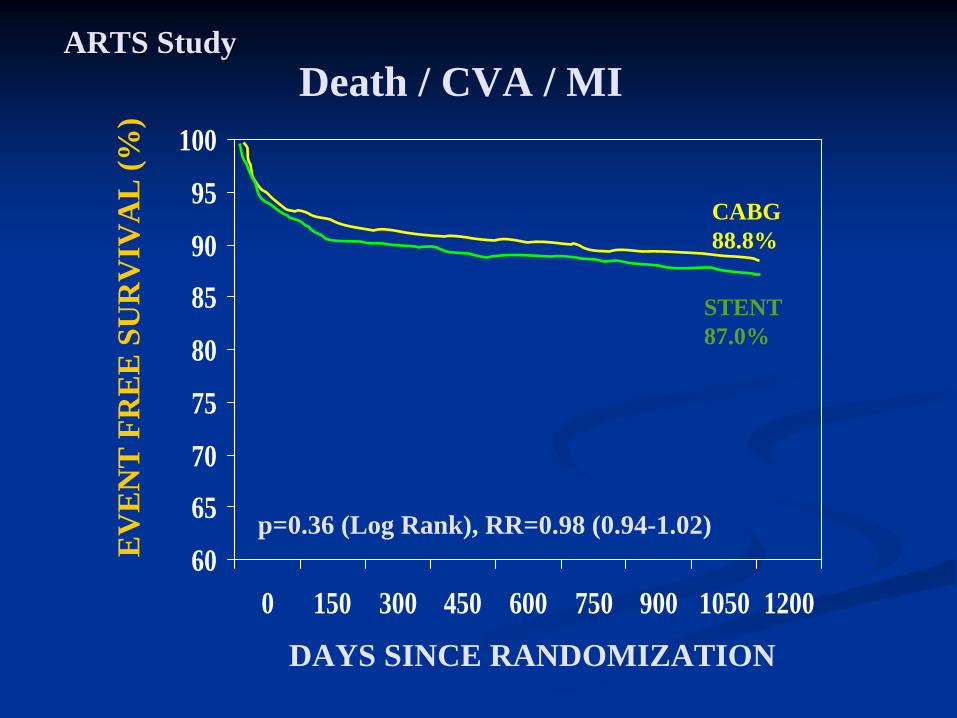
Death / CVA / MIARTS StudyARTS Study
60
65
70
75
80
85
90
95
100
0 150 300 450 600 750 900 1050 1200
CABG 88.8%
STENT 87.0%
p=0.36 (Log Rank), RR=0.98 (0.94-1.02)
DAYS SINCE RANDOMIZATION
EV
EN
T F
RE
E S
UR
VIV
AL
(%)

CABG and Re-PTCAARTS StudyARTS Study
60
65
70
75
80
85
90
95
100
0 150 300 450 600 750 900 1050 1200
CABG 93.6%
STENT 73.3%
p=0.0001 (Log Rank), RR=0.78 (0.74-0.83)
DAYS SINCE RANDOMIZATION
EV
EN
T F
RE
E S
UR
VIV
AL
(%)
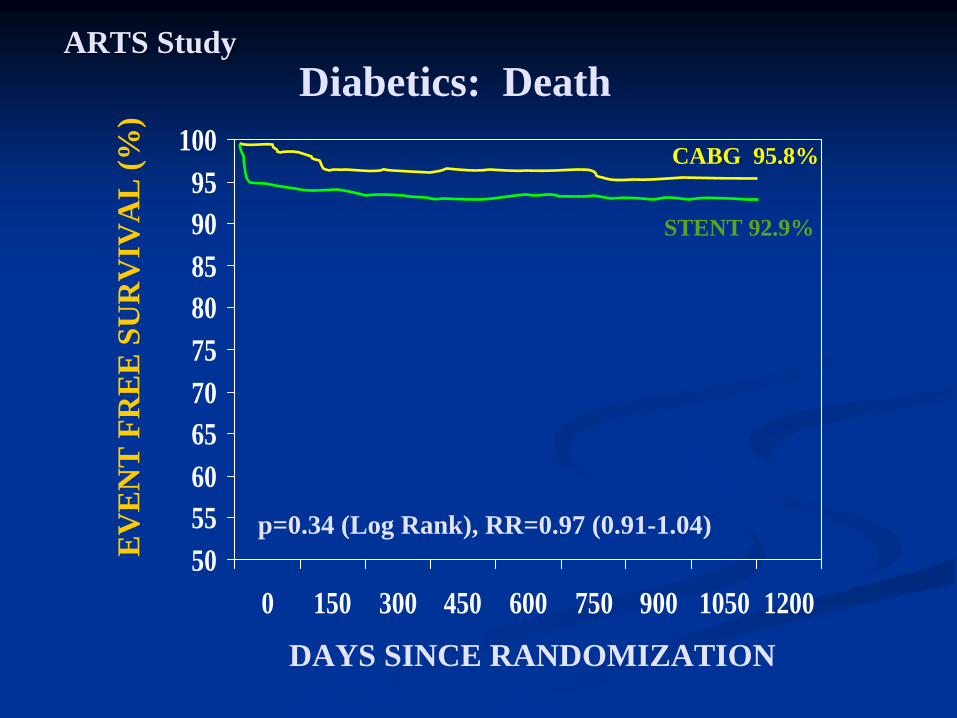
Diabetics: DeathARTS StudyARTS Study
50556065707580859095
100
0 150 300 450 600 750 900 1050 1200
CABG 95.8%
STENT 92.9%
p=0.34 (Log Rank), RR=0.97 (0.91-1.04)
DAYS SINCE RANDOMIZATION
EV
EN
T F
RE
E S
UR
VIV
AL
(%)
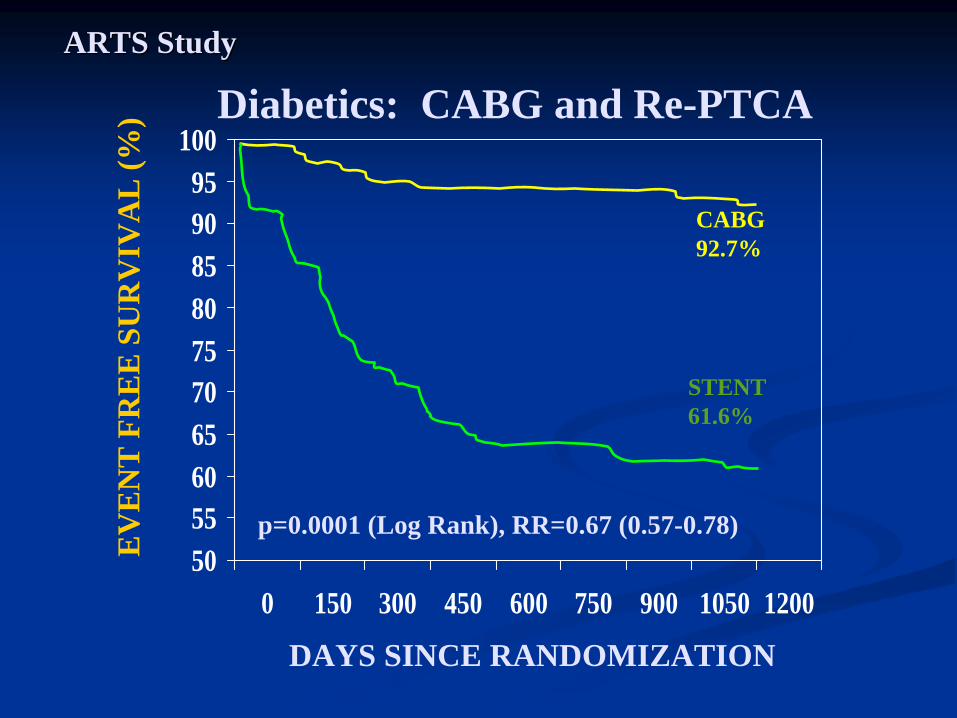
Diabetics: CABG and Re-PTCAARTS StudyARTS Study
50556065707580859095
100
0 150 300 450 600 750 900 1050 1200
CABG 92.7%
STENT 61.6%
p=0.0001 (Log Rank), RR=0.67 (0.57-0.78)
DAYS SINCE RANDOMIZATION
EV
EN
T F
RE
E S
UR
VIV
AL
(%)

ANGINA at 2 and 3 Year F/UANGINA at 2 and 3 Year F/U
Stent CABG
2 years 3 years 2 years 3 years
None 79.6% 81.6% 87.3% 87.0%
Unstable 0.4% 1.2% 0.2% 0.4%
Stable 19.0% 16.5% 12.1% 11.7%
Silent 1.1% 0.7% 0.4% 0.9%
All N = 553 N=569 N=529 N=554

Conclusion Conclusion
•• Diabetic patients show poor clinical Diabetic patients show poor clinical outcome in the stent group when compared outcome in the stent group when compared to the CABG group. to the CABG group.
•• Consequently surgery may be preferable Consequently surgery may be preferable to stenting in diabetic patients with to stenting in diabetic patients with multivessel coronary disease, although multivessel coronary disease, although surgery carries a significant risk of surgery carries a significant risk of cerebrovascular accidentcerebrovascular accident
ARTS StudyARTS Study

Serruys P. American College of Cardiology 2005 Scientific Sessions; March 6-9, 2005; Orlando, FL.
OneOne--year eventyear event--free survival outcomes in the ARTS trials free survival outcomes in the ARTS trials
End pointEnd point ARTS II, ARTS II, n=607 (%)n=607 (%)
p, ARTS II vs p, ARTS II vs ARTS I CABGARTS I CABG
ARTS I ARTS I CABG, CABG, n=602 n=602 (%)(%)
ARTS I ARTS I PCI, PCI, n=600 n=600 (%)(%)
Survival free from Survival free from death/CVE/MIdeath/CVE/MI
96.996.9 <0.001<0.001 92.092.0 90.790.7
Survival free from reinterventionSurvival free from reintervention 91.591.5 0.0030.003 95.995.9 78.178.1
Survival free from MACCE*Survival free from MACCE* 89.589.5 0.460.46 88.588.5 73.773.7
*Primary end point. CVE=cerebrovascular event. MACCE=major adverse cardiac and cerebrovascular events


Observational StudiesObservational Studies
The NYS Database suggested superior The NYS Database suggested superior outcomes for CABG when compared to PCI outcomes for CABG when compared to PCI with DESwith DES
Controversial given nonControversial given non--randomized study design randomized study design susceptible to biassusceptible to biasSafety issues driven by Safety issues driven by ““StentStent thrombosisthrombosis””Possibly a true reflection of Possibly a true reflection of ““The real worldThe real world””experience of cardiovascular physiciansexperience of cardiovascular physicians

Optimal revascularization strategy in patients with three-vessel disease
and/or left main disease
The 2-year Outcomes of the SYNTAX Trial
Optimal revascularization strategy in Optimal revascularization strategy in patients with threepatients with three--vessel disease vessel disease
and/or left main diseaseand/or left main disease
The 2The 2--year Outcomes of the SYNTAX year Outcomes of the SYNTAX TrialTrial
A. Pieter Kappetein, MD PhDA. Pieter Kappetein, MD PhDErasmus MC, Rotterdam, NLErasmus MC, Rotterdam, NL
On behalf of the SYNTAX investigatorsOn behalf of the SYNTAX investigators
Clinical Trial Update IIIClinical Trial Update III2 September 2009, Room Barcelona Zone 22 September 2009, Room Barcelona Zone 2
9:24 AM to 9:37 AM 9:24 AM to 9:37 AM Conflicts of Interest: NoneConflicts of Interest: None

ESC 2009 • Two-year Outcomes of the SYNTAX Trial • Kappetein • Slide 32
SYNTAX Study ObjectivesSYNTAX Study Objectives
With technological advances and changes in clinical practice, the respective values of coronary artery bypass surgery and percutaneous
coronary
intervention needed to be reassessed
The SYNTAX randomized trial is an attempt to provide an evidence base to determine the best treatment option for patients in a real-world population seen by the surgeon and the interventional cardiologist in their daily practice

ESC 2009 • Two-year Outcomes of the SYNTAX Trial • Kappetein • Slide 33
SYNTAX Trial Design
De novo 3VD and/or LM (isolated, +1,2,3 VD)De novo 3VD and/or LM (isolated, +1,2,3 VD)
Limited Exclusion CriteriaLimited Exclusion CriteriaPrevious interventions , Acute MI with CPK>2x, Concomitant cardPrevious interventions , Acute MI with CPK>2x, Concomitant cardiac surgeryiac surgery
Two Registry ArmsTwo Registry Arms N=1275N=1275
Randomized ArmsRandomized ArmsN=1800N=1800
Heart Team (Surgeon & Interventional CardiologistHeart Team (Surgeon & Interventional Cardiologist
Amenable for only one Amenable for only one treatment approachtreatment approach
Amenable for bothAmenable for bothtreatment optionstreatment options
Stratification: Stratification: LM and DiabetesLM and Diabetes
23 US Sites23 US Sites62 EU Sites62 EU Sites ++

ESC 2009 • Two-year Outcomes of the SYNTAX Trial • Kappetein • Slide 34
Patient ProfilingPatient ProfilingLocal Heart team (surgeon & interventional cardiologist) assessed each patient with regards to:Patient’s operative risk (euroSCORE
& Parsonnet score)Coronary lesion complexity (Newly developed SYNTAX Score)Goal: SYNTAX Score to provide guidance on optimal revascularization strategies for patients with high risk lesions
Sianos et al, EuroIntervention 2005;1:219-27Valgimigli et al, Am J Cardiol 2007;99:1072-81Serruys et al, EuroIntervention 2007;3:450-9
Coronary tree segments AHA classification and modified for the ARTS study, Circulation 1975; 51:5-40 & Semin
Interv
Cardiol
1999; 4:209-19Modified Leaman
score, Circ
1981;63:285-92Lesions classification ACC/AHA , Circ 2001;103:3019-41Bifurcation classification, CCI 2000;49:274-83CTO classification, J Am Coll
Cardiol
1997;30:649-56
www.syntaxscore.com available now

ESC 2009 • Two-year Outcomes of the SYNTAX Trial • Kappetein • Slide 38ITT population
P=0.24
6.2%4.9%
0 12 240
Months Since Allocation
Cum
ulat
ive
Even
t Rat
e (%
)
TAXUS
(N=903)CABG
(N=897)
AllAll--Cause Death to 2 YearsCause Death to 2 Years
20
40
0
Cumulative KM Event Rate ±
1.5 SE; log-rank P value;*Binary rates
Before 1 year*
3.5% vs
4.4%P=0.37
After 1 year*
1.5%
vs
1.9%P=0.53

ESC 2009 • Two-year Outcomes of the SYNTAX Trial • Kappetein • Slide 39
CVA to 2 Years CVA to 2 Years
1.4%2.8%
0 12 24Months Since Allocation
Cum
ulat
ive
Even
t Rat
e (%
)
ITT population
P=0.03
TAXUS
(N=903)CABG
(N=897)
Cumulative KM Event Rate ±
1.5 SE; log-rank P value;*Binary rates
20
40Before 1 year*
2.2% vs
0.6%P=0.003
After 1 year*
0.6%
vs
0.7%P=0.82

ESC 2009 • Two-year Outcomes of the SYNTAX Trial • Kappetein • Slide 40
Myocardial Infarction to 2 Years Myocardial Infarction to 2 Years
3.3%5.9%
0 12 24Months Since Allocation
Cum
ulat
ive
Even
t Rat
e (%
)
ITT population
P=0.01
TAXUS
(N=903)CABG
(N=897)
Cumulative KM Event Rate ±
1.5 SE; log-rank P value;*Binary rates
20
40Before 1 year*
3.3% vs
4.8%P=0.11
After 1 year*
0.1%
vs
1.2%P=0.008

ESC 2009 • Two-year Outcomes of the SYNTAX Trial • Kappetein • Slide 41
All-Cause Death/CVA/MI to 2 Years
P=0.44
0 12 24Months Since Allocation
Cum
ulat
ive
Even
t Rat
e (%
)
ITT population
9.6%
10.8%
TAXUS
(N=903)CABG
(N=897)
Cumulative KM Event Rate ±
1.5 SE; log-rank P value;*Binary rates
20
40Before 1 year*
7.7% vs
7.6%P=0.98
After 1 year*
2.2%
vs
3.5%P=0.11

ESC 2009 • Two-year Outcomes of the SYNTAX Trial • Kappetein • Slide 42
Repeat Revascularization to 2 YearsRepeat Revascularization to 2 Years
8.6%
17.4%
0 12 24Months Since Allocation
Cum
ulat
ive
Even
t Rat
e (%
)
ITT population
P<0.001
TAXUS
(N=903)CABG
(N=897)
Cumulative KM Event Rate ±
1.5 SE; log-rank P value;*Binary rates
20
40Before 1 year*
5.9% vs
13.5%P<0.001
After 1 year*
3.7%
vs
5.6%P=0.06

ESC 2009 • Two-year Outcomes of the SYNTAX Trial • Kappetein • Slide 43
MACCE to 2 Years
P<0.001
0 12 24Months Since Allocation
Cum
ulat
ive
Even
t Rat
e (%
)
ITT population
16.3%
23.4%
TAXUS
(N=903)CABG
(N=897)
Cumulative KM Event Rate ±
1.5 SE; log-rank P value;*Binary rates
20
40Before 1 year*
12.4% vs
17.8%P=0.002
After 1 year*
5.7%
vs
8.3%P=0.03

ESC 2009 • Two-year Outcomes of the SYNTAX Trial • Kappetein • Slide 44
0 12 24Months Since Allocation
Cum
ulat
ive
Even
t Rat
e (%
)
TAXUS
(N=299)CABG
(N=275)
P=0.63
19.4%17.4%
Calculated by core laboratory; ITT population
MACCE to 2 Years by SYNTAX Score Tercile
Low Scores (0-22)
Mean baselineSYNTAX Score
CABG
16.6 ±
4.0
TAXUS
16.7 ±
4.1
Cumulative KM Event Rate ±
1.5 SE; log-rank P value
20
40
ESC 2009 • Two-year Outcomes of the SYNTAX Trial • Kappetein • Slide 45
0 12 24Months Since Allocation
Cum
ulat
ive
Even
t Rat
e (%
)
Calculated by core laboratory; ITT population
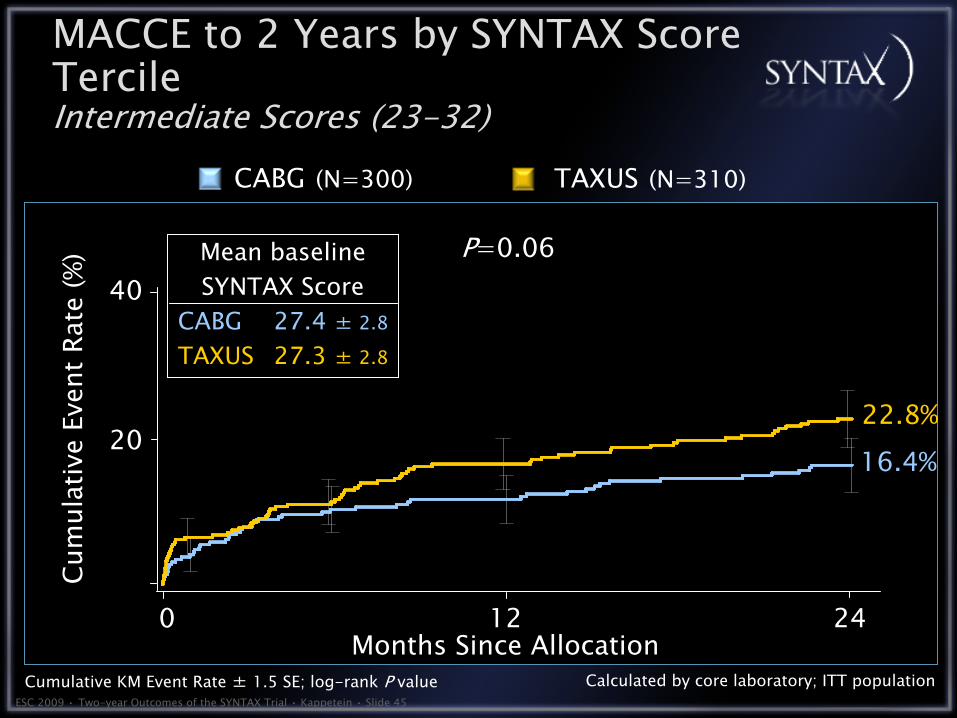
MACCE to 2 Years by SYNTAX Score Tercile
Intermediate Scores (23-32)TAXUS
(N=310)CABG
(N=300)
P=0.06
22.8%16.4%
Mean baselineSYNTAX Score
CABG
27.4 ±
2.8
TAXUS
27.3 ±
2.8
Cumulative KM Event Rate ±
1.5 SE; log-rank P value
20
40

ESC 2009 • Two-year Outcomes of the SYNTAX Trial • Kappetein • Slide 46
0 12 24Months Since Allocation
Cum
ulat
ive
Even
t Rat
e (%
)
Calculated by core laboratory; ITT population
MACCE to 2 Years by SYNTAX Score Tercile
High Scores (≥33) TAXUS
(N=290)CABG
(N=315)
P<0.001
28.2%
15.4%
Mean baselineSYNTAX Score
CABG
41.5 ±
7.1
TAXUS
41.7 ±
7.8
Cumulative KM Event Rate ±
1.5 SE; log-rank P value
20
40
ESC 2009 • Two-year Outcomes of the SYNTAX Trial • Kappetein • Slide 47
TAXUSCABG
Patie
nts,
%
Patie
nts,
%
ITT population
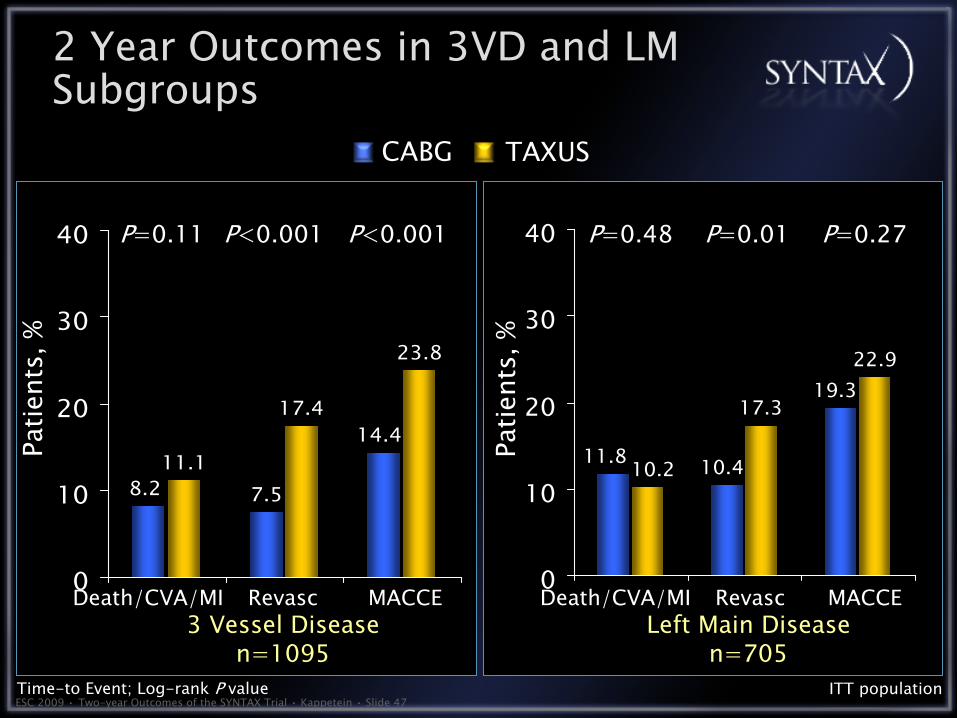
7.511.1
23.8
14.4
8.2
17.4
0
10
20
30
40
17.3
22.919.3
10.411.8 10.2
0
10
20
30
40
Death/CVA/MI MACCERevasc
Time-to Event; Log-rank P value
P=0.11 P<0.001 P<0.001
Death/CVA/MI MACCERevasc
P=0.48 P=0.01 P=0.27
2 Year Outcomes in 3VD and LM Subgroups
3 Vessel Diseasen=1095
Left Main Diseasen=705

%
0
5
15
8.8
3.0
20
SYNTAX Registry
• Main reason for PCI only: inoperable (comorbidities); main reason for CABG only: complex anatomy
• PCI outcomes: MACCE (20.4%), mortality (7.3%), MI (4.2%), repeat revascularization (12%), CVA (0)
• CABG outcomes: MACCE (8.8%), mortality (2.5%), MI (2.5%), repeat revascularization (3%), CVA (2.2%)
Trial design: Patients with severe three-vessel or left main (LM) disease who did not meet criteria for entry into the SYNTAX trial were followed for 12 months in the SYNTAX CABG and PCI registry.
Results
Conclusions
• The SYNTAX registry describes outcomes in PCI and CABG in patients not eligible for the SYNTAX trial
• Of all-comers with three-vessel and/or LM disease, 6.4% were considered inoperable; 35% not feasible for PCI
Presented by Dr. Friedrich Mohr at ESC 2008MACCE Repeat
revascularization
5
15
20
25
12.0
20.4
%
0DES-PCI (n = 198)
1010
20
25
10
CABG (n = 1,077)

ESC 2009 • Two-year Outcomes of the SYNTAX Trial • Kappetein • Slide 49
Summary: I Summary: I
In the SYNTAX randomized patients, 2-year MACCE rates were significantly higher for PCI than CABG, mainly driven by higher repeat revascularization in the PCI arm.
Significant increase of MI compared to CABG at 2 years driven by higher PCI MI rate between years 1and 2Significantly higher CVA rate in CABG compared to PCI with the majority of CVAs
occurring in the first yearComposite safety (death/CVA/MI) remains similar between arms at 2 years
MACCE rates at 2 years not significantly different for patients with a low (0-22) or intermediate (23-32) baseline SYNTAX Score; for patients with high SYNTAX Scores (≥33), MACCE continued to be increased at 2 years in patients treated with PCI

ESC 2009 • Two-year Outcomes of the SYNTAX Trial • Kappetein • Slide 50
In the predefined subgroups of patients with either 3VD or LM disease:
Safety outcomes (death/CVA/MI) in the 3VD group were similar for PCI and CABG, but the 2-year revascularization and MACCE rates favored
CABG.In the LM group, safety outcomes and MACCE rates were similar for PCI and CABG, but the 2-year revascularization rate was lower in the CABG group.
The 2-year SYNTAX results suggest that CABG remains the standard of care for patients with complex disease (high SYNTAX Scores); however, PCI may be an acceptable alternative revascularization method to CABG when treating patients with less complex (low or intermediate SYNTAX Score) disease.SYNTAX patients will continue to be followed for 5 years.
Summary: II Summary: II

Future DirectionsFuture Directions
Hybrid ProceduresHybrid ProceduresCombines the best aspects of surgical and Combines the best aspects of surgical and percutaneouspercutaneous treatmentstreatments
Minimally invasive LIMA graft with DES to nonMinimally invasive LIMA graft with DES to non--LAD LAD lesionslesionsPercutaneousPercutaneous intervention to MI culprit lesion followed intervention to MI culprit lesion followed by CABGby CABG
In contemporary practice, surgeons are In contemporary practice, surgeons are becoming more like becoming more like interventionalistsinterventionalists and and interventionalistsinterventionalists more like surgeonsmore like surgeons