multi-sensor remote sensing image fusion based on …grewe/pubs/distsensornet… · ·...
TRANSCRIPT

2009 IEEE Symposium on Industrial Electronics and Applications (ISIEA 2009), October 4-6, 2009, Kuala Lumpur, Malaysia
Multi-sensor Remote Sensing Image Fusion Based On Retina-Inspired Model
Hassan Ghassemian School of Electrical and Computer Engineering
Tarbiat Modares University Tehran, Iran
e-mail: [email protected]
Abstract—Remote sensing systems observe pixels in different portions of electromagnetic spectrum. These systems are designed within many competing constraints, among the most important being the trade off between the spatial resolution and the spectral resolution. To collect more photons and maintain image SNR, the multispectral sensors have a larger pixel compared to panchromatic sensors. With appropriate algorithms it is possible to combine these data and produce imagery with the best characteristics of both, namely high spatial and high spectral resolution. This process is known as a kind of data fusion. Some widely performed in the remote sensing community are HSI (hue-saturation and intensity) technique, PCA (principal component analyses) technique, and the Brovey transform technique. Recently, the Wavelet transform has been used for merging multi-resolution images. Normally, the objective of these procedures is to create a composite image of enhanced interpretability, but, those methods can distort the spectral characteristics of the multispectral images. This paper presents a multi-resolution data fusion scheme, based on visual channels image decomposition. This paper introduces a general issue of Retina-Inspired image analysis model, and application of the model in multispectral image fusion. A qualitative and quantitative comparison used to evaluate the spectral and spatial features performance of the proposed method with the others. Visual and statistical analyses show that the proposed algorithm significantly improves the fusion quality; compared to fusion methods including, IHS, PCA, Brovey, and discrete Wavelet transform (DWT). In this method, there is no need to resample images, which is an advantage over the other methods, it can perform in any aspect ratio between the panchromatic and MSS pixels.
Keywords—Data Fusion; Multi-sensor; Remote Sensing; Retina-Inspired Model
I. INTRODUCTION Earth observation satellites provide data in different
portions of the electromagnetic spectrum at different spatial and spectral resolutions. For the full exploitation of increasingly sophisticated multi-source data, advanced data fusion techniques are being developed [1-3]. The fused images may provide increased interpretation capabilities and more reliable results. Many fusion methods have been proposed for fusing high spectral and spatial resolution data in order to produce multi-spectral
images having the highest spatial resolution available within the data set. The higher resolution image is used as a reference which the lower resolution image is geometrically registered. Therefore the lower resolution image is up sampled to match the ground sample interval of the higher resolution image. The proposed method in this paper is a feature level image fusion technique.
The objective of the multi-resolution image fusion is to generate hybrid high spatial resolution multi-spectral images that attempt to preserve the radiometric characteristics of the original low spatial resolution multi-spectral data. In this study, low-resolution multi-spectral MSS LandSat image fuse with a high-resolution panchromatic SPOT image to achieve optimal resolution in the spatial and spectral domains. Several methods have been used for this job, such as the IHS, PCA and DWT etc. [4-10]. The above methods and several other techniques have been developed to merge high-resolution panchromatic data with low-resolution Multispectral data. Normally, the objective of these procedures is to create a composite image of enhanced interpretability, but, those methods can distort the spectral characteristics of the multispectral images, and the analysis becomes difficult.
The biological retina is more than a simple video sensor. It not only converts optical information into electrical signals but performs considerable processing on the visual signal before transmitting it to a higher visual system levels. Image fusion can incorporate the processing principles of human vision system [11]. This paper presents a multi-resolution data fusion scheme, based on retinal visual channels decomposition, motivated by analytical results obtained from "retina based image analysis, or multiscale image decomposition incorporates the visual channels phenomena" [12].
The energy packing the spectral features are distributed in the lower frequency subbands, and the spatial features, edges, are distributed in the higher frequency sub-bands. By adding the high-scale spatial features (extracted from a panchromatic image) to the low-scale spatial features (from TM images), the visual-channels procedure enhances the multispectral images. The retina model is based on Difference-Of-Gaussian (DOG) operator, which describes some of the receptive field properties of the ganglion cells [12].
978-1-4244-4683-4/09/$25.00 ©2009 IEEE 500

2009 IEEE Symposium on Industrial Electronics and Applications (ISIEA 2009), October 4-6, 2009, Kuala Lumpur, Malaysia
Figure 1. A thin piece of retina is enlarged in a photomicrograph revealing its layers [11].
II. RETINA MODEL The retina is a thin layer of neural tissue in the back
of the eye. It can be decomposed in five layers: three layers of cell bodies and two layers of synaptic interconnections between the neurons. This structural form is depicted in Figures 1. Light enters from the ganglion cell layer side first, and must penetrate all cell types before reaching the rods and cones. This is because the pigment-bearing membranes of the photoreceptors have to be in contact with the eye's pigment epithelial layer [11]. The photoreceptors' cell bodies are located in the outer nuclear layer of the retina. The synaptic terminals of the photoreceptors make contact with the dendritic fields of the bipolar cells and horizontal cells in the outer plexiform layer (OPL). The cell bodies of the bipolar and horizontal cells are located in the inner nuclear layer. The horizontal cells make connections with the cells in the outer nuclear layer. The bipolar cells, however, make connections onto the dendrites of the ganglion cells within the inner plexiform layer (IPL). Since only the bipolar cells link the signals in the outer and inner plexiform layers, all the visual signals must go through the bipolar cells. Another class of cells located in the inner nuclear layer is the amacrine cells. These cells have no identifiable axons, only dendrites. The dendritic fields of the amacrine and ganglion cells connect in the inner plexiform layer. The retinal ganglion cell bodies are located in the ganglion cell layer, and their dendritic fields connect with the axon terminals of the bipolars as well as with the dendritic fields of the amacrine cells.
Totally, OPL properties are generated by the synaptic triad, which is composed of three kind of interconnected cells [11]:
– The cone cells constitute a layer of the transduction and regularization processing. The transduction converts luminance into electrochemical potentials aimed at the downstream layers. The regularization consists in filtering input signals with a light low-pass frequencies filtering. The cone cells are defined by their shapes (midget, diffuse…), their types of response (on, off) and their functions (spectral sensibilities: red, green, and blue colors). Moreover their behaviors depend locally on the luminance intensity and contrast;
Figure 2. A multi-sensor image fusion scheme in the Retina-Inspired Model
– The horizontal cells constitute a layer of strong regularization processing. The output response performs from the cone cells output to elaborate a spatial average of the image intensity;
– The bipolar cells make the difference between the horizontal (luminance average) and the cone outputs .So bipolar cells estimate the local contrasts of the image intensity to increase visual indices. As cone cells, the bipolar cells are various. We observe bipolar cells are classified also by their shapes (midget, diffuse…), their types of response (bipolar on, off…), and their functions (contrast estimation: red/green, blue/green+red…);
The bipolar axons transmit the OPL outputs to the IPL area. The IPL Processing is assumed by ganglion cells:
– The ganglion cells have a receptive field organized as concentric circles. The ganglion cells are classified as bipolar cells by their shapes, their types of response (on, off, on+off), and their functions (spatial contrast estimation and luminance estimation) [11].
Our image fusion architectures are motivated by the biological computational processes of the human retina. The three different cone cells in the retina are sensitive to the short, medium, and long wavelengths of the visible spectrum. If the retina were simply to transmit opposite-contrast images directly from the photoreceptors to the brain, the resulting vision would probably be coarse-grained and blurry. Further processing in the retina defines precise edges to images and allows us to focus on fine details. The honing of the image starts at the first synaptic level in the retina, where horizontal cells receive input from cones.
The biological retina not only converts optical information into electrical signals but performs
501

2009 IEEE Symposium on Industrial Electronics and Applications (ISIEA 2009), October 4-6, 2009, Kuala Lumpur, Malaysia
considerable processing on the visual signal before transmitting it to higher visual system levels. Image fusion can incorporate the processing principles of human vision system. This paper presents a multiresolution data fusion scheme, based on retinal visual channels decomposition, motivated by analytical results obtained from "retina based image analysis, or multiscale image decomposition incorporates the visual channels phenomena": the energy packing the spectral features are distributed in the lower frequency subbands, and the spatial features, edges, are distributed in the higher frequency subbands [5]. By adding the high-scale spatial features (extracted from a PAN image) to the low-scale spatial features (from MSS image), the visual-channels procedure enhances the multispectral images (see Fig. 2). The retina model is based on Difference-Of-Gaussian operator [12], which describes some of the receptive field properties of the ganglion cells. It consists of two Gaussians with different variances at position (x,y) and can generally be written as:
);();(),( sscc rGrGyxCS σασα −= . (1)
2
2
2 2exp
21);(
σπσσ
rrG
−= . (2)
where 22 yxr += , cα and sα are weighting of
centre and surround inputs and c
Gσ and s
Gσ are normalized filters (meaning a spatial integral of one) that represent the filtering of the visual sequence taking place respectively in light receptors (
cGσ , or center signal) and
in horizontal cells (s
Gσ , or surround signal). Both filters
are spatially low-pass. Filter s
Gσ is more low-pass than
cGσ , meaning cS σσ > . It corresponds to biological fact that horizontal cells develop their signal with more synapse and more cellular integration than receptors, and are linked to their neighboring horizontal cells through strongly coupling gap junctions. In summary the outputs from these photoreceptors are oppositely enhanced within band by center-surround spatial opponent processes at the bipolar cells. In later stages (ganglion cells in retina) these signals are oppositely enhanced by center-surround processes between the different bands. Ultimately, we can represent the function of this model by:
),(),(),(),(),( 2211 yxfyxhyxfyxhyxf ⊗+⊗= . (3)
where f1(x,y) is the high resolution image, h1(x,y) is the high pass filter (photoreceptors cells), f2(x,y) is the low resolution image and h2(x,y) is the low pass filter (horizontal cells). This allows to generate a spatially enhancing multi-spectral images f(x,y), by adding the high resolution spatial features to f2(x,y).
Figure 3. SPOT image and LANDSAT image of North-West of Tehran
III. EXPERIMENTS AND RESULTS In this experiment, the Landsat TM images are spatially
enhanced to 10-m resolution by fusing them with the SPOT panchromatic data. The test area is 10-km by 10-km (Figure 3) located in the north-west of Tehran, Iran, which included various, international airport, natural park, small lake, vegetation, agricultural, mountains, bare soil, highway, etc. The TM images were registered geometrically onto SPOT PAN as a reference image, by selecting 20 control points. For all merging methods, except our proposed method, the TM images resample to 10-m resolution, by using first order polynomial, and nearest neighbor interpolation algorithm.
The purpose of multiple image fusion is to achieve complementary spatial and spectral benefits from different sensors. The merged results should be evaluated both spectrally and spatially. The combination of TM bands 2,3,4 was selected because these bands most
502

2009 IEEE Symposium on Industrial Electronics and Applications (ISIEA 2009), October 4-6, 2009, Kuala Lumpur, Malaysia
closely covered the same portion of the electromagnetic spectrum as the PAN image. The PCA, wavelet and the proposed methods can merge all multi-spectral bands with the PAN image at once.
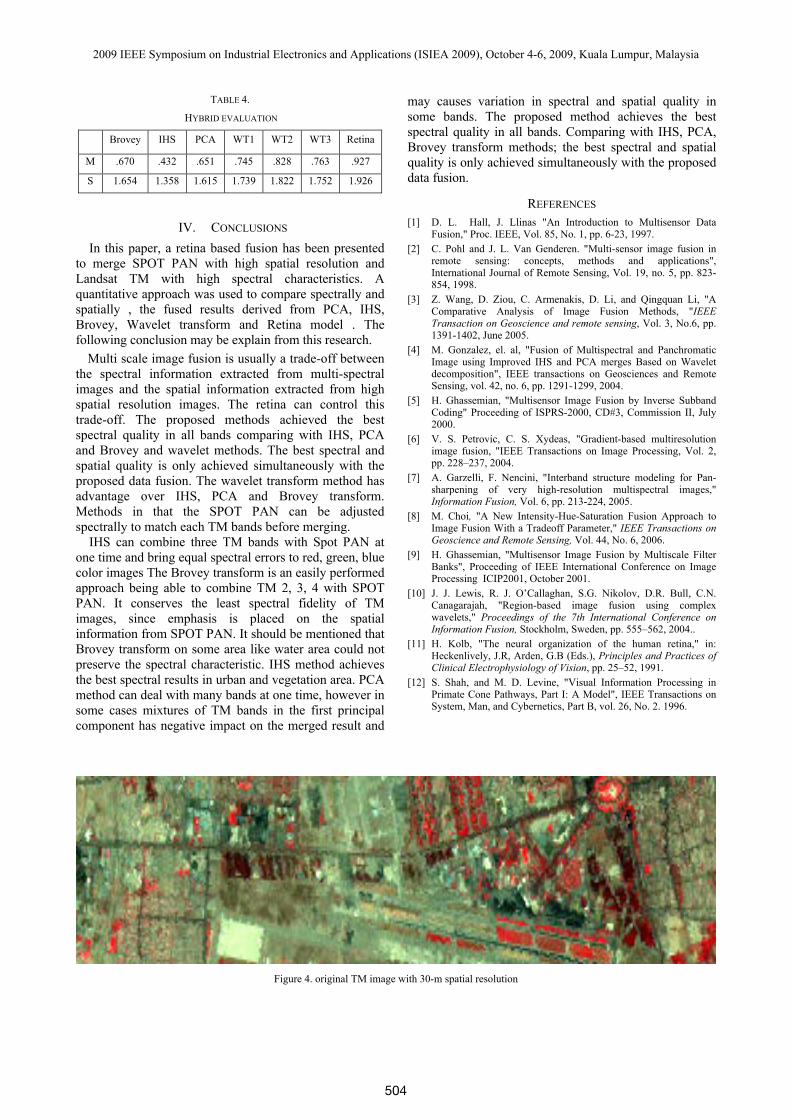
Visual evaluation of the 432-bands color composite images indicates that the IHS, PCA and Brovey Methods change color of the composite images, which means the spectral features, are distorted by these methods. Due to limitation of space, Fig.4 shows some part of the original images of TM bands in RGB color composite. This part has shown in PAN-SPOT image in figure 3. Fig.5a-e shows a 432-bands color composite image of the enhanced TM data by the proposed method. Some methods for evaluating the spectral quality are based on the calculation of the image difference between the merged image and standard pattern image, which is the desired merge result. However such a standard remote sensing image is usually not available. For remote sensing application the methods used to merge data with high spatial and high spectral resolution properties should not distort the spectral characteristics of the original high spectral resolution data. Not distorting the spectral characteristics is important for calibration purposes and for insuring that targets that are spectrally separable in the original data still separable in merged data set. Thus the spectral quality of fused images can be measured band by band by the average difference between the pixel value of the merged image and corresponding original (the registered and down-sampled one) TM, as shown in equation (4).
)i(kb)i(kf
N
1iN1)k(d −
↓∑=
=. (4)
where kf and kb are the pixel values of merged and TM images. It is desirable that the fused image has a small difference with the corresponding original TM image.
The data fusion should not distort the spectral characteristics of the original multi-spectral data. The spectral quality of the spatially enhanced images is measured band by band in term of correlation between the pixel value of the original images and spatially enhanced ones.
C ( f , b )k k( k )2 2.f bk k
ρ =σ σ
. (5)
TABLE1. AVERAGE DIFFERENCE BETWEEN ENHANCED FUSED IMAGE AND
ORIGINAL TM BANDS TMav TM7 TM5 TM4 TM3 TM2 TM1 FUSION
METHOD 14.49 10.58 10.58 22.37 12.50 20.34 10.58 IHS
53.47 39.02 71.70 45.51 41.53 33.17 89.89 BROVEY
7.94 8.46 11.85 3.13 9.62 5.87 8.72 PCA
3.18 3.02 4.51 2.54 3.37 2.13 3.49 WT1
6.66 6.59 7.21 6.80 6.53 6.25 6.56 WT2
8.95 8.82 9.76 9.83 8.33 8.37 8.61 WT3
3.11 3.12 4.31 2.57 3.27 2.08 3.32 RETINA
TABLE2. CORRELATION BETWEEN ENHANCED FUSED IMAGE AND ORIGINAL TM BANDS
TMav TM7 TM5 TM4 TM3 TM2 TM1 Fusion
Method
.510 .612 .809 .700 .564 .330 .766 IHS
.712 .801 .720 .475 .817 .763 .693 BROVEY
.781 .714 .746 .937 .735 .754 .805 PCA
.971 .972 .972 .966 .972 .972 .971 WT1
.931 .931 .930 .890 .950 .940 .942 WT2
.812 .826 .808 .445 .871 .860 .865 WT3
.976 .977 .974 .971 .980 .972 .983 RETINA
In this paper we used the correlation coefficient
between the high pass filtered fused SPOT PAN and TM images and the high pass filtered SPOT PAN Image as an index of the spatial quality. This measurement is based on the fact that the spatial information unique in spot pan is mostly concentrated in the high frequency domain. The higher correlation between the high frequency component of fused TM and SPOT PAN Images and the high frequency component of SPOT PAN indicates that more spatial information from SPOT PAN Images is incorporated during fusing. The filter we used was a Laplacian as illustrated in equation (6). The results are presented in Table 3.
1 1 1H P F(m ask ) 1 8 1
1 1 1
− − −⎡ ⎤⎢ ⎥= − −⎢ ⎥⎢ ⎥− − −⎣ ⎦
. (6)
C ( P A N , f )H P F k ,H P F( k )2 2.P A N f
ρ =σ σ
. (7)
When fusing images derived from low spatial high spectral resolution and high spatial low resolution, it is desirable that these two types of data share some spectral similarity. Otherwise it is difficult to achieve optimally spectral and spatial results simultaneously. Equations (15) describe hybrid evolution of these criteria. The results have shown in Table 4 .The best result for both criteria is obtained in Retina model.
M (spectral). (spatial)T TS (spectral) (spatial)T T
= ρ ρ
= ρ + ρ. (8)
TABLE 3.
CORRELATION BETWEEN THE HIGH FREQUENCY COMPONENT OF FUSED IMAGE AND HIGH FREQUENCY COMPONENT OF SPOT PAN
TMav TM7 TM5 TM4 TM3 TM2 TM1
.848 .970 .909 .846 .739 .734 .891 IHS
.942 .936 .955 .891 .955 .974 .943 BROVEY
.834 .937 .910 .409 .953 .927 .869 PCA
.768 .796 .786 .645 .804 .798 .778 WT1
.890 .900 .880 .821 .910 .924 .915 WT2
.940 .950 .931 .901 .952 .962 .952 WT3
.950 .957 .943 .912 .959 .972 .957 RETINA
503
2009 IEEE Symposium on Industrial Electronics and Applications (ISIEA 2009), October 4-6, 2009, Kuala Lumpur, Malaysia
TABLE 4.
HYBRID EVALUATION
Retina WT3 WT2 WT1 PCA IHS Brovey
.927 .763 .828 .745 .651 .432 .670 M
1.926 1.752 1.822 1.739 1.615 1.358 1.654 S
IV. CONCLUSIONS In this paper, a retina based fusion has been presented
to merge SPOT PAN with high spatial resolution and Landsat TM with high spectral characteristics. A quantitative approach was used to compare spectrally and spatially , the fused results derived from PCA, IHS, Brovey, Wavelet transform and Retina model . The following conclusion may be explain from this research.
Multi scale image fusion is usually a trade-off between the spectral information extracted from multi-spectral images and the spatial information extracted from high spatial resolution images. The retina can control this trade-off. The proposed methods achieved the best spectral quality in all bands comparing with IHS, PCA and Brovey and wavelet methods. The best spectral and spatial quality is only achieved simultaneously with the proposed data fusion. The wavelet transform method has advantage over IHS, PCA and Brovey transform. Methods in that the SPOT PAN can be adjusted spectrally to match each TM bands before merging.
IHS can combine three TM bands with Spot PAN at one time and bring equal spectral errors to red, green, blue color images The Brovey transform is an easily performed approach being able to combine TM 2, 3, 4 with SPOT PAN. It conserves the least spectral fidelity of TM images, since emphasis is placed on the spatial information from SPOT PAN. It should be mentioned that Brovey transform on some area like water area could not preserve the spectral characteristic. IHS method achieves the best spectral results in urban and vegetation area. PCA method can deal with many bands at one time, however in some cases mixtures of TM bands in the first principal component has negative impact on the merged result and
may causes variation in spectral and spatial quality in some bands. The proposed method achieves the best spectral quality in all bands. Comparing with IHS, PCA, Brovey transform methods; the best spectral and spatial quality is only achieved simultaneously with the proposed data fusion.
REFERENCES [1] D. L. Hall, J. Llinas "An Introduction to Multisensor Data
Fusion," Proc. IEEE, Vol. 85, No. 1, pp. 6-23, 1997. [2] C. Pohl and J. L. Van Genderen. "Multi-sensor image fusion in
remote sensing: concepts, methods and applications", International Journal of Remote Sensing, Vol. 19, no. 5, pp. 823-854, 1998.
[3] Z. Wang, D. Ziou, C. Armenakis, D. Li, and Qingquan Li, "A Comparative Analysis of Image Fusion Methods, "IEEE Transaction on Geoscience and remote sensing, Vol. 3, No.6, pp. 1391-1402, June 2005.
[4] M. Gonzalez, el. al, "Fusion of Multispectral and Panchromatic Image using Improved IHS and PCA merges Based on Wavelet decomposition", IEEE transactions on Geosciences and Remote Sensing, vol. 42, no. 6, pp. 1291-1299, 2004.
[5] H. Ghassemian, "Multisensor Image Fusion by Inverse Subband Coding" Proceeding of ISPRS-2000, CD#3, Commission II, July 2000.
[6] V. S. Petrovic, C. S. Xydeas, "Gradient-based multiresolution image fusion, "IEEE Transactions on Image Processing, Vol. 2, pp. 228–237, 2004.
[7] A. Garzelli, F. Nencini, "Interband structure modeling for Pan-sharpening of very high-resolution multispectral images," Information Fusion, Vol. 6, pp. 213-224, 2005.
[8] M. Choi, "A New Intensity-Hue-Saturation Fusion Approach to Image Fusion With a Tradeoff Parameter," IEEE Transactions on Geoscience and Remote Sensing, Vol. 44, No. 6, 2006.
[9] H. Ghassemian, "Multisensor Image Fusion by Multiscale Filter Banks", Proceeding of IEEE International Conference on Image Processing ICIP2001, October 2001.
[10] J. J. Lewis, R. J. O’Callaghan, S.G. Nikolov, D.R. Bull, C.N. Canagarajah, "Region-based image fusion using complex wavelets," Proceedings of the 7th International Conference on Information Fusion, Stockholm, Sweden, pp. 555–562, 2004..
[11] H. Kolb, "The neural organization of the human retina," in: Heckenlively, J.R, Arden, G.B (Eds.), Principles and Practices of Clinical Electrophysiology of Vision, pp. 25–52, 1991.
[12] S. Shah, and M. D. Levine, "Visual Information Processing in Primate Cone Pathways, Part I: A Model", IEEE Transactions on System, Man, and Cybernetics, Part B, vol. 26, No. 2. 1996.
Figure 4. original TM image with 30-m spatial resolution
504

2009 IEEE Symposium on Industrial Electronics and Applications (ISIEA 2009), October 4-6, 2009, Kuala Lumpur, Malaysia
Figure 5a. The output result of IHS technique
Figure 5b. The output result of Brovey technique
Figure 5c. The output result of PCA technique
Figure 5d. The output result of Wavelet technique
Figure 5e. The output result of Retina technique
505