multi-sensor aerosol products sampling system (mapss)
TRANSCRIPT

N ational Aeronautics and Space Adm inistration
Melanie Follette-Cook and Pawan Gupta
Satellite Remote Sensing of Dust, Fires, Smoke, and Air Quality, July 10-12, 2018
Multi-Sensor Aerosol Products Sampling System (MAPSS)

N A SA ’s A p p lied Rem ote Sensing Tra in ing Prog ra m 2
Multi-Sensor Aerosol Products Sampling System (MAPSS)
• MAPSS is a portal for evaluating and comparing various aerosol datasets with AERONET
http://giovanni.gsfc.nasa.gov/aerostat/
N A SA ’s A p p lied Rem ote Sensing Tra in ing Prog ra m 3
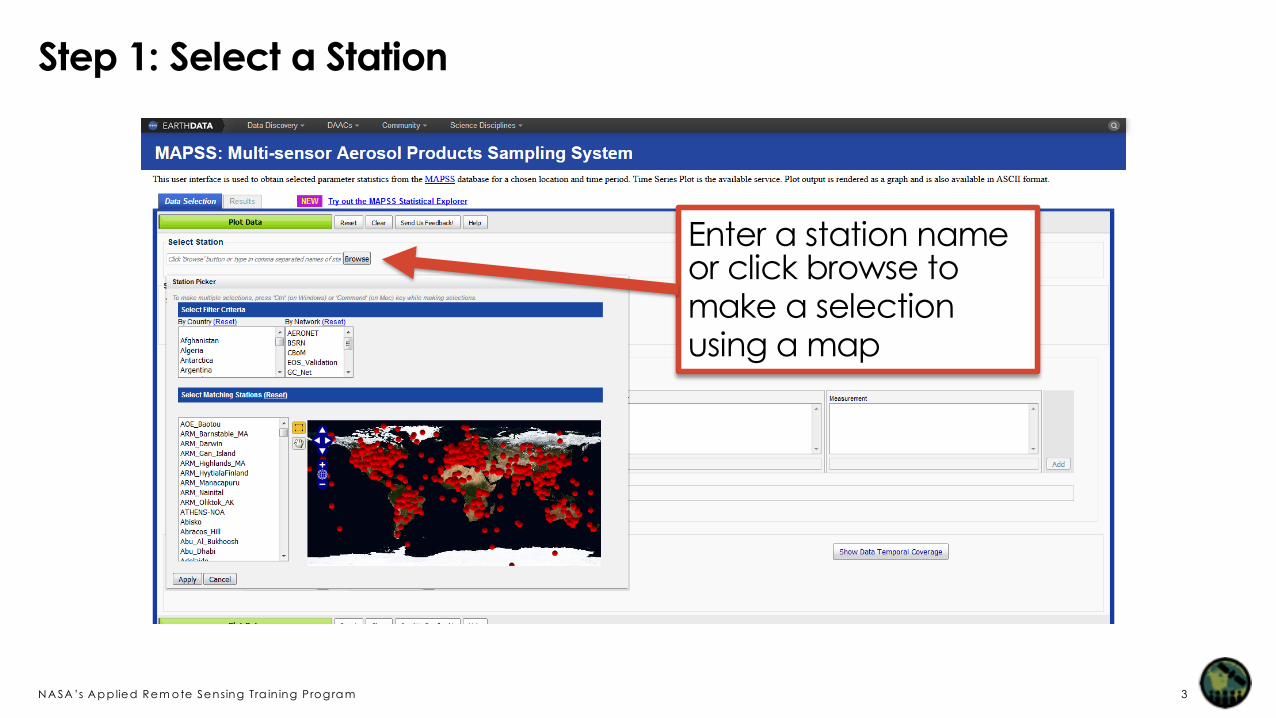
Step 1: Select a Station
Enter a station nameor click browse to make a selection using a map

N A SA ’s A p p lied Rem ote Sensing Tra in ing Prog ra m 4
Step 2: Select Plot Type and AERONET Measurement
Select: Scatter Plot
Select: AERONET aerosols, Ver. 2
Select: AOD - interpolated
Select: AOD at 550 nm
Select: Mean
Lastly, click: Add
Rimrock

N A SA ’s A p p lied Rem ote Sensing Tra in ing Prog ra m 5
Selected Measurements Will Appear
Rimrock

N A SA ’s A p p lied Rem ote Sensing Tra in ing Prog ra m 6
Step 3: Select Satellite Measurement
Select: MODIS aerosols L2 (Aqua), ver. 006
Select: AOD 550nm-combined
Select: AOD 550nm-combined
Select: Mean
Lastly, click: Add
Rimrock

N A SA ’s A p p lied Rem ote Sensing Tra in ing Prog ra m 7
X and Y Axis Information Will Appear in the Selected Measurements Section
These are the two parameters that will be compared in the analysis
Rimrock

N A SA ’s A p p lied Rem ote Sensing Tra in ing Prog ra m 8
Step 4: Select a Date Range
Make sure both datasets are available for the selected range. You can verify this by clicking here

N A SA ’s A p p lied Rem ote Sensing Tra in ing Prog ra m 9
Step 5: Click Plot Data and Wait for Results

N A SA ’s A p p lied Rem ote Sensing Tra in ing Prog ra m 10
• Which two parameters were compared?
• What is the location of the AERONET station you selected?
• Describe (correlation, slope, quality, etc.) the comparison of satellite AOD to AERONET in your region.
Exercise Questions: