multi-scale simulation approach for the fluidised … · multi-scale simulation approach for the...
TRANSCRIPT
1
MULTI-SCALE SIMULATION APPROACH FOR THE
FLUIDISED BED SPRAY GRANULATION PROCESS
STEFAN HEINRICH
HAMBURG UNIVERSITY OF TECHNOLOGY, Germany
NIELS DEEN & HANS KUIPERS
EINDHOVEN UNIVERSITY OF TECHNOLOGY, The Netherlands
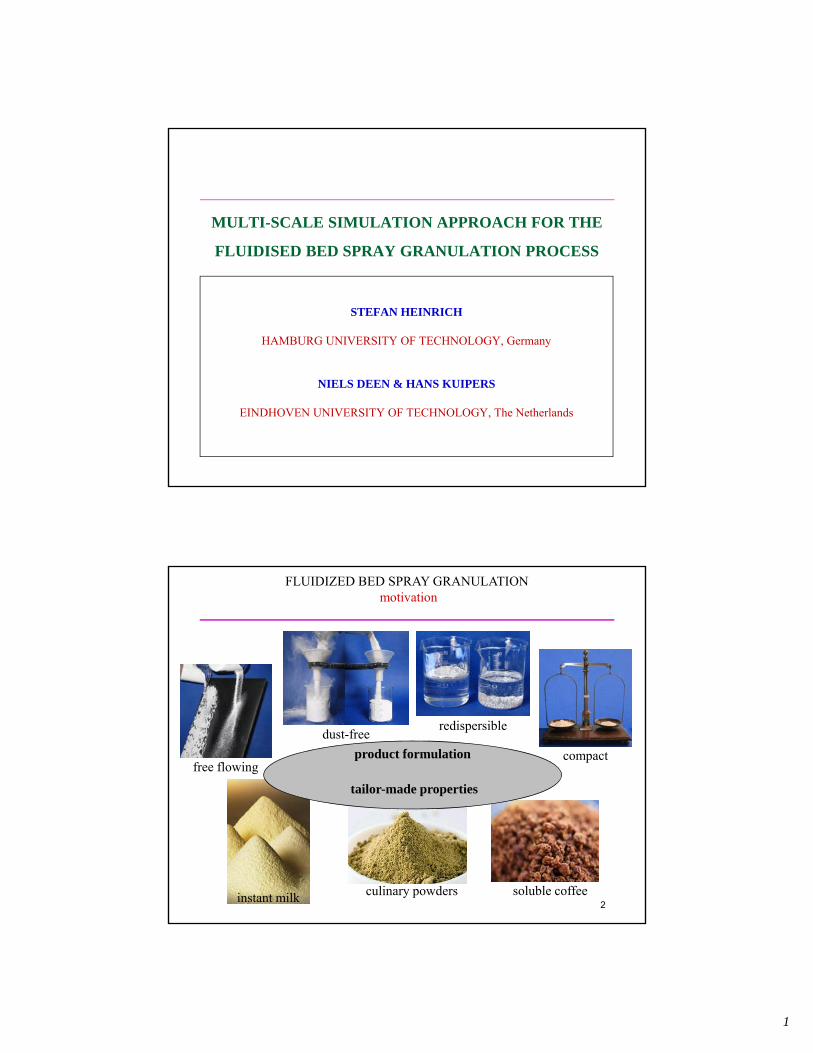
dust-freeredispersible
compactfree flowing
soluble coffeeculinary powdersinstant milk
product formulation
tailor-made properties
FLUIDIZED BED SPRAY GRANULATIONmotivation
2
2
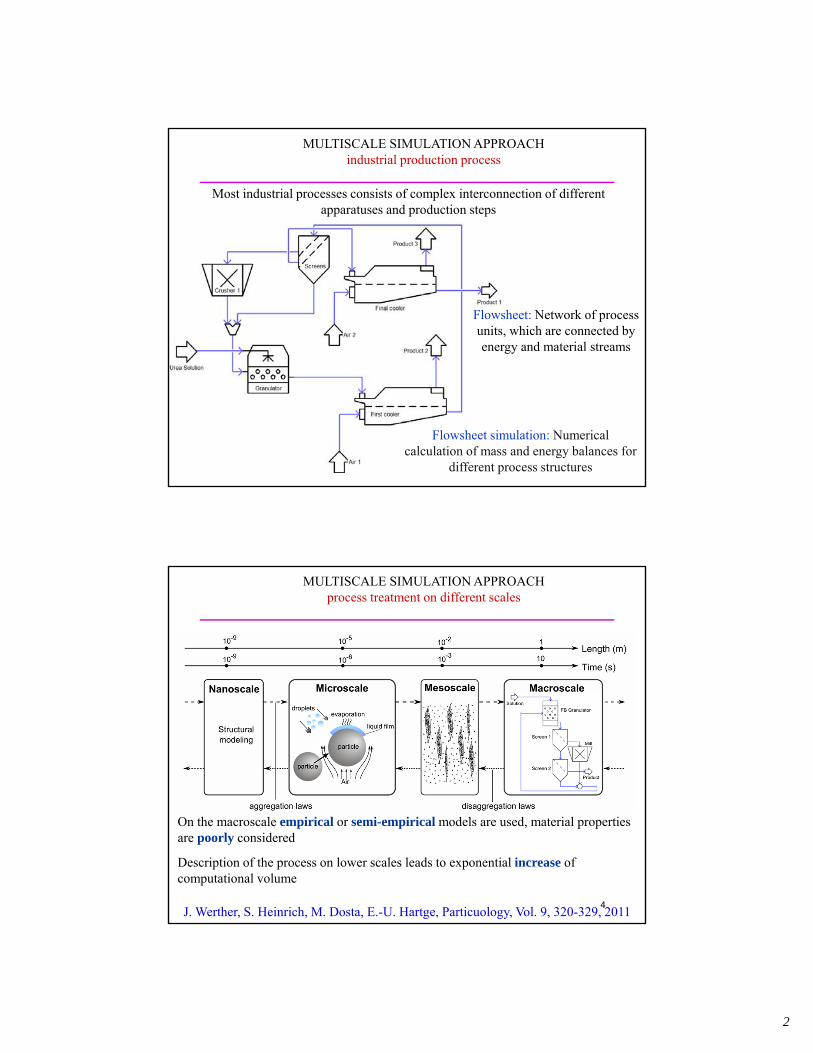
Most industrial processes consists of complex interconnection of different apparatuses and production steps
Flowsheet: Network of process units, which are connected by energy and material streams
Flowsheet simulation: Numerical calculation of mass and energy balances for
different process structures
MULTISCALE SIMULATION APPROACHindustrial production process
On the macroscale empirical or semi-empirical models are used, material properties are poorly considered
Description of the process on lower scales leads to exponential increase of computational volume
MULTISCALE SIMULATION APPROACHprocess treatment on different scales
J. Werther, S. Heinrich, M. Dosta, E.-U. Hartge, Particuology, Vol. 9, 320-329, 20114

3
MULTI-SCALE MODELLING
Van der Hoef et al., Annu. Rev. Fluid M., 20085
MULTI-SCALE MODELLING
6

4
RESULTS OF LATTICE BOLTZMANN MODELstatic array of bi-disperse particles at low Rep
example of initial particle configuration for
a bi-disperse systemgenerated with a
Monte Carlo procedure
7
RESULTS OF LATTICE BOLTZMANN MODELstatic array of bi-disperse particles at low Rep
8

5
RESULTS OF LATTICE BOLTZMANN MODELstatic array of particles with log-normal PSD
9
RESULTS OF LATTICE BOLTZMANN MODELstatic array of particles with log-normal PSD
Re=0.1 Re=500
10

6
RESULTS OF LATTICE BOLTZMANN MODELfinal drag closure for mono-disperse and poly-disperse particles
good fit (deviation less then 8%) of basic LB simulation data
generated over wide range of g and Re
strictly valid for homogeneous arrays of particles
11
MECHANICAL PARTICLE PROPERTIESmeasurement of restitution coefficient
vn
vR
R
Vacuum nozzle
R
n
t
High speedcamera
vR,t
vR,n
v
vt
R n
nn
,=v
ev
nv
normal restitution coefficientnormal impact velocitynormal rebound velocity
en
vn
vR,n
Target plate
van Buijtenen, M.S., Deen, N.G., Heinrich, S., Antonyuk, S. and J.A.M. Kuipers: A discrete element study of wet particle-particle interaction during granulation in a spout fluidized bed, Canadian Journal of Chemical Engineering (2009), Vol. 9999, 1-10.12

7
MECHANICAL PARTICLE PROPERTIESmeasurement of restitution coefficient
vn
vR
R
vacuum nozzle
R
n
t
high-speedvideo camera
vR,t
vR,n
v
vt
R n
nn
,=v
ev
R t
tt
,=v
ev
Restitution coefficient:
kin,R diss
kin kin
RE Ee = = 1-
E E v
v
vR/v relative rebound/impact velocity
n/t normal and tangential component
normal
tangential
13
0
0.2
0.4
0.6
0.8
1
0 1 2 3 4 5
Res
titu
tio
n c
oef
fici
ent
e [-
]
Impact velocity v [m/s]
-Al2O3
Sodium benzoate
Zeolite
Maltodextrin agglomerates
Glass beads
5 mm
5 mm
5 mm
1 mm
1 mm dominantly elastic
elastic-plastic
dominantly plastic
Normal impact on a dry glass plate
MECHANICAL PARTICLE PROPERTIESmeasurement of “dry” restitution coefficient
Antonyuk, S., Heinrich, S., Tomas, J., Deen, N.G., van Buijtenen, M.S. and J.A.M. Kuipers: Energy absorptionduring compression and impact of dry elastic-plastic spherical granules,Granular Matter (2010) 1, 12.
14

8
Objectives of the study: e = f (impact velocity, liquid film thickness and viscosity)
vR/v relative rebound/impact velocityEkin,R elastic rebound energy Ekin impact energyEdiss irreversible absorbed energy
kin,
in
RR
k
Ee = =
E
v
v
hs
vacuum nozzle
high-speedcamera
steeltarget
precisionstable
polymerfilm
confocal sensor
MECHANICAL PARTICLE PROPERTIESmeasurement of “wet” restitution coefficient
15
PARTICLE COLLISION IN WET SYSTEMS
(above) Formation, thinning & eventual breakup of the liquid bridge (simulation results)
(below) Images from high-speed recording of α-Al2O3 granule impacting with velocity of 2.36
m/s on wall with a water layer (thickness 0.4 mm) (Antonyuk et al. (2009)).
16

9
PARTICLE COLLISION IN WET SYSTEMS
0 200 400 600 800 10000.0
0.1
0.2
0.3
0.4
0.5
0.6
0.7
0.8
Re
stitu
tion
co
effi
cie
nt e
Layer Thickness (µm)
CFD model vel=1.0 vel=2.36
Antonyuk model vel=1.0 vel=2.36
Experimental vel=1.0 vel=2.36
Influence of impact velocity on restitution coefficient of the Al2O3
granules impacting on water layers with varying thickness.
17
PARTICLE COLLISION IN WET SYSTEMS
18

10
During fluidized bed granulation the particles are covered by a liquid film
Different types of collisions can occur:
How can the influence of the liquid film be predicted?
PARTICLE COLLISION IN WET SYSTEMScollision types for different moisture contents
kin,
in
RR
k
Ee = =
E
v
v
Awet wetted surfaceAtot total particle surface
For the description of the liquid film, the wetted surface fraction φ is used
φ obtained from the calculations of the model on the macroscale
wet
tot
A=
A
PARTICLE COLLISION IN WET SYSTEMScollision types for different moisture contents
232
21 e)1(2e1ee
kin,
in
RR
k
Ee = =
E
v
v
20

11
vn,rel normal relative velocityvt,rel tangential relative velocityh minimum separation distanceha roughnessη viscosityR* average curvature radius in contactFcap capillary force
*2,
,
6 n relv n
R vF
h
**
, ,2 ln 12v t t relR
F R vh
Normal impact1
h Tangential impact2
h 1Adams, M.J., Edmondson, B. (1987). Tribology in particulate technology.2Popov, V. (2009) Kontaktmechanik und Reibung, Springer.
h ≥ 2 ha
ha
Viscous forces
PARTICLE COLLISION IN WET SYSTEMScontact model for wet collisions
21
Particles: R = 0.4 mm, = 190 kg/m3, edry = 0.6, G = 6.3 MPa
Liquid layer: = 1 mPas, h = 60 µm, ha = 2.5 µm
model: FHertz-Tsuji
edry = 0.6
model: FHertz-Tsuji + Fv
ewet = 0.05
steel wall
Liquid bridge
PARTICLE COLLISION IN WET SYSTEMSapplication of viscous contact model

12
dp = 0.8 mmvimp = 1.2 m/sliquid layer:
= 8 mPas, hm ≈ 60 µm
dp = 0.8 mm vimp = 1.2 m/sliquid layer:
= 4 mPas, hm ≈ 60 µm
PARTICLE COLLISION IN WET SYSTEMSapplication of viscous contact model
23
For the description of particle motion in the fluid field the Computational Fluid Dynamics (CFD) model is coupled
COUPLING BETWEEN DEM AND CFD

13
RESULTS DISCRETE PARTICLE MODEL spouted bed
“CAPABILITIES” OF DPM(COLLISION PARAMETERS!!!)
(Link et al., CES, 2005)
REGIME PREDICTION
GAS BUBBLES BEHAVIOUR
PRESSURE FLUCTUATIONS
SOLIDS MOTION
25
RESULTS DISCRETE PARTICLE MODEL spouted bed (dry system)
26

14
nozzle
ilev
jcspisuspjsusp A
AMM
,
,,
j,cspA
i,levA
cross-cut surface of particle j [m2]
cross-cut surface of level i [m2]
ilev
jcspisusp
isusp A
AMM
,
,1 1
The nozzle zone is described by the suspension mass stream, spraying angle and the height of cone area
In apparatus the different nozzles can be defined simultaneously
For the description of particle wetting the nozzle zone model has been developed
The suspension mass flow which comes to the particle j in the level i is defined as:
Mass stream on the level i+1:
DISCRETE PARTICLE MODEL nozzle region
L. Fries, M. Dosta, S. Antonyuk, S. Heinrich, S. Palzer, Chemical Engineering Technology, 34, 201127
For the calculation of liquid film drying the equations of energy and mass balance are used
The heat and mass transfer coefficients α and β are calculated for each particle
filmairfilmafaf AQ
filmpfilmpfpf AQ
pairfilmpapap )AA(Q
filmA
pASurface of liquid film [m2]
Particle surface [m2]
p
filmParticle temperature [°C]
Temperature of liquid film [°C]
afvappfsuspfilm QHQH
dt
dH
DISCRETE PARTICLE MODEL heat and mass transfer
28

15
• growth rate for each particle:
sw2p
wvapp
xR4
)x1(M
dt
dR
pR Particle radius [m]
vapM Vapor mass stream [kg/s]
s Solid density [kg/m3]
DISCRETE PARTICLE MODEL heat and mass transfer and particle growth
29
Exterior view Cross cut
Simplified geometry for DPM
high gas velocity
Segmented distributor plate
low gas velocity
Mesh forCFD-simulation
12.000 tetrahedralmesh cells
Design and process parameters
Gap distance below Wurster
Height and diameter of Wurster
Injection velocity
Fluidization gas velocity
Air split ratio Wurster/annulus
nozzle
RESULTS DISCRETE PARTICLE MODEL / CFD real granulators – Wurster coater
30

16
vnozzle = 20 m/s vnozzle = 100 m/s vnozzle = 160 m/sHigh spout velocity provides stable circulation regimeBackmixing is prevented
150.000 particles, dp = 2 mm, p = 1500 kg/m³, total mass = 0.94 kg, e = 0.8, simulation time t = 2.5 s, fluidization velocity: Wurster: uW = 8 m/s = 10.1·umf , annulus: uann = 3 m/s = 3.8·umf
RESULTS DISCRETE PARTICLE MODEL / CFD real granulators – Wurster coater
31
bag filter
liquid binder
bottom plate
fluidizing air
Wurster tube
nozzle
bag filter
liquid binder
fluidized powder
bottom plate
fluidizing air
Top spray Wurster-coater
Application:tablet coating,encapsulation of flavors.
Application:Granulation and agglomeration of food and fertilizers.
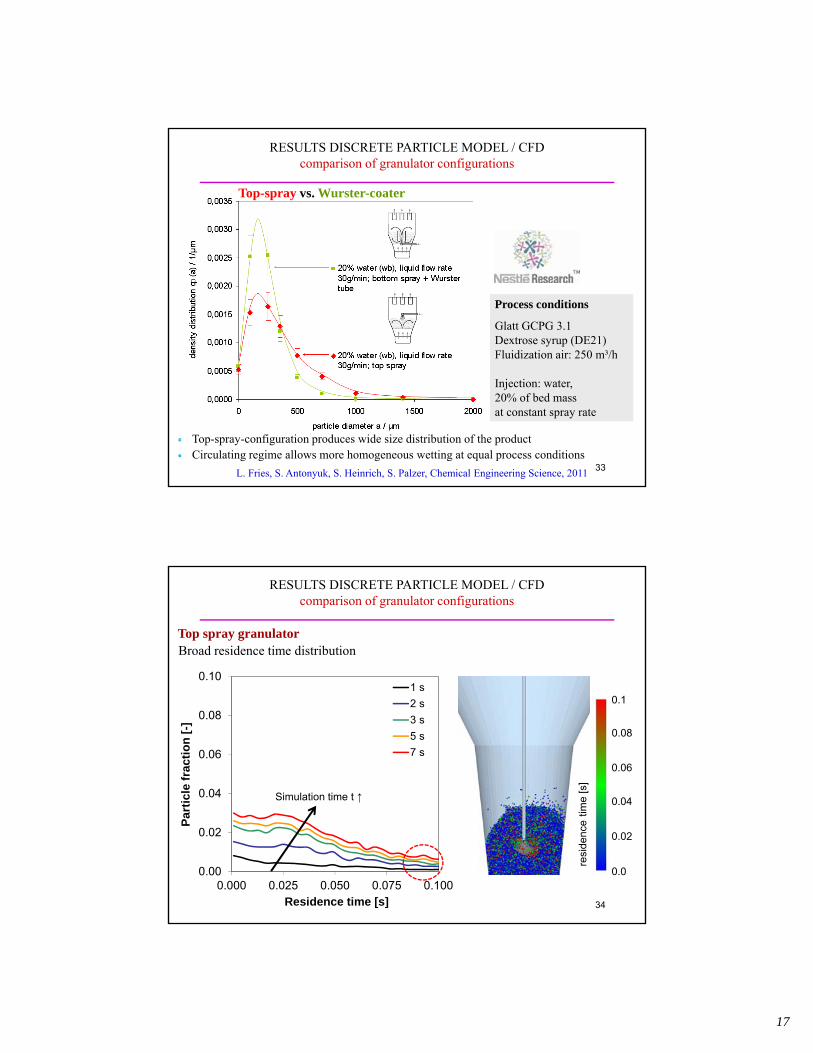
RESULTS DISCRETE PARTICLE MODEL / CFD comparison of granulator configurations
32
17
Top-spray-configuration produces wide size distribution of the productCirculating regime allows more homogeneous wetting at equal process conditions
Process conditions
Glatt GCPG 3.1Dextrose syrup (DE21)Fluidization air: 250 m³/h
Injection: water,20% of bed massat constant spray rate
RESULTS DISCRETE PARTICLE MODEL / CFD comparison of granulator configurations
Top-spray vs. Wurster-coater
L. Fries, S. Antonyuk, S. Heinrich, S. Palzer, Chemical Engineering Science, 201133
Top spray granulatorBroad residence time distribution
0.00
0.02
0.04
0.06
0.08
0.10
0.000 0.025 0.050 0.075 0.100
Pa
rtic
le f
ract
ion
[-]
Residence time [s]
1 s
2 s
3 s
5 s
7 s
0.1
0.08
0.06
0.04
0.02
0.0
resi
denc
etim
e [s
]
Simulation time t ↑
RESULTS DISCRETE PARTICLE MODEL / CFD comparison of granulator configurations
34

18
Wurster-coater Cyclic wettingDefined residence time per cycle
0.1
0.08
0.06
0.04
0.02
0
resi
denc
e tim
e [s
]
0.00
0.02
0.04
0.06
0.08
0.10
0.000 0.025 0.050 0.075 0.100
Par
ticl
e fr
acti
on
[-]
Residence time [s]
1 s
2 s
3 s
5 s
7 s
RESULTS DISCRETE PARTICLE MODEL / CFD comparison of granulator configurations
35
Wurster-coater:
Lower collision frequency
Higher kinetic energy
→ Reduced agglomeration probability
Collisions between surface-wet particles
Nozzle
30 m
m15
mm
d = 50 mm
Inje
ctio
n de
pth
L
Parameter Wurster-coater Top Spray
Particle fraction inside spray zone 0.53 % 0.36 %
Average angular velocity inside spray zone 43 rad/s 54rad/s
Average collision frequency (inside spray zone) 88 s-1 864 s-1
Average relative collision velocity inside spray zone 0.39 m/s 0.15 m/s
RESULTS DISCRETE PARTICLE MODEL / CFD particle collision dynamics
36

19
Abluft-filter
liquid binder
bottom plate
fluidizing air
Wurster-tube
Wurster-Coater
liquid binder
adjustable gas inlet
fluidizing air
Spouted bed
Application:very fine, cohesive and non-spherical particles
bag filter
Application:tablet coating,encapsulation of flavors.
RESULTS DISCRETE PARTICLE MODEL / CFD comparison of granulator configurations
37
Par
ticle
vel
ocity
[m
/s]
2,0
1,5
1,0
0,5
0,0
Spouted bed
150.000 Particle, dp = 2 mm, Density p = 1500 kg/m³, Bed mass = 0.94 kg, e = 0.8, Simulation time t = 5 s150.000 Particle, dp = 2 mm, Density p = 1500 kg/m³, Bed mass = 0.94 kg, e = 0.8, Simulation time t = 5 s
Joint STW/DFG project
RESULTS DISCRETE PARTICLE MODEL / CFD comparison of granulator configurations
38

20
0.0
0.2
0.4
0.6
0.8
1.0
1.0 1.5 2.0 2.5 3.0
Par
ticl
e ve
loci
ty v
p/
m/s
Simulation time t / s
Spouted bed
Wurster-coater
0.62 m/s
0.44 m/s
0.0
0.2
0.4
0.6
0.8
1.0
1.0 1.5 2.0 2.5 3.0
Co
llisi
on
vel
oci
ty v
coll
/ m
/sSimulation time t / s
Spouted bed particle-wall
Spouted bed particle-particle
Wurster-coater particle-wall
Wurster-coater particle-particle
0.13 m/s
0.39 m/s
0.27 m/s
Translation: mean particle velocity Collision dynamics
Spouted bed: Higher impact energy for particle-wall collisions → Increased agglomerate strength
RESULTS DISCRETE PARTICLE MODEL / CFD comparison of granulator configurations
39
t = 0.3 s t = 0.5 s t = 0.7 s t = 0.9 s t = 1.0 s
of v
p,ve
rt[s
/m]
2
1
0
-2 -1 0 1 2 3vp,vert [m/s]
start-up process from fixed bed
(transient), simulation time t = 01 s t = 1.1 s t = 1.2 s t = 1.3 s t = 1.4 s t = 1.5 s t = 1.6 s t = 1.7 s t = 1.8 s
of v
p,ve
rt[s
/m]
-2 -1 0 1 2 3
1.2
0.6
0.0
vp,vert [m/s]
steady-state spouting, t > 1 s
Typical distribution of vertical particle velocities for spouted bed was found
This kind of parameters can’t be measured up-to-day by available methods. They can be obtained only from a simulation.
RESULTS DISCRETE PARTICLE MODEL / CFD spouted bed behaviour
40

21
2
1.5
1
0.5
0
-0.5verti
cal p
artic
le v
eloc
ity [m
/s]
High friction influences the particle mobility β
The spread of the function strongly decreases
The shape of velocity distribution changes from Gumbel Max to Gumbel Min (skewed to
the left)
0
5
10
-0.8 -0.4 0.0 0.4 0.8
PD
F o
f v p
,ve
rt[s
/m]
vp,vert [m/s]
high friction
low friction
0.035
0.175
HF
LF
RESULTS DISCRETE PARTICLE MODEL / CFD stable spouted bed behaviour
41
RESULTS DPM MODELsegregation in bidisperse systems
42

22
RESULTS DPM MODELsegregation in bidisperse systems
43
RESULTS DPM MODELsegregation in bidisperse systems
44

23
RESULTS MFM MODELsegregation in bidisperse systems
45
RESULTS MFM MODELsegregation in bidisperse systems
New MFMOld MFM
46

24
1. Calculation of the process on the macroscale up to steady-state
2. Generation of initial conditions for DEM+CFD simulation
3. Microscale calculation for short time interval (in order of seconds)
5. Mesoscale calculation of wetting, drying, growth, …
4. Transmission of particle trajectories and fluid profile to the mesoscale
6. Recreation of microscale simulation according to new parameters
7. Microscale simulation -> calculation of coalescence kernel
8. Repeating of the calculation on the macroscale with new kernel
PSDBed massFluidization air mass flow
PSD, particle trajectoriesflow profile
suspension mass flowstreams temperaturessuspension water partfluidization air mass flowbed mass
wetted surface fractionwetted surface fraction
coalescence kernel
INTERSCALE COUPLINGgranulation agglomeration in fluidized beds
47
spraydroplets
nuclei / powder solidified shell „onion-like“structure
Granulation (granum (lat.) = grain)
Transfer of solids from liquids (suspensions, solutions, melts) or dusty solids to a well defined granule structure
e.g. detergents, food technology, preservatives
spraying spreading solidification granule
MACROSCALEgranulation
48

25
Input and output streamsGrowthrate
out,0outin,0inp
b,0toteb,0tot qnqnd
qnG
t
qn
tot
ee A
M2G
)x1(MM wsuspe
For the description of the change of particle size distribution, a one-dimensional Population Balance Model (PBM) has been used
Empirical model:
MACROSCALEpopulation balance model for granulation
Ge
Atot
ρ
xw
Growth rate [m/s]Total particle surface [m2]Effective mass stream [kg/s]Particle density [kg/m3]Suspension mass stream [kg/s]Water part in suspension [%]
eM
suspM
SolidSim FlowsheetProduction process
Short-cut models
Multiscale model
MACROSCALEflowsheet of granulation process
M. Dosta, S. Heinrich, J. Werther, Powder Technology, 204, 71-82, 201050
26
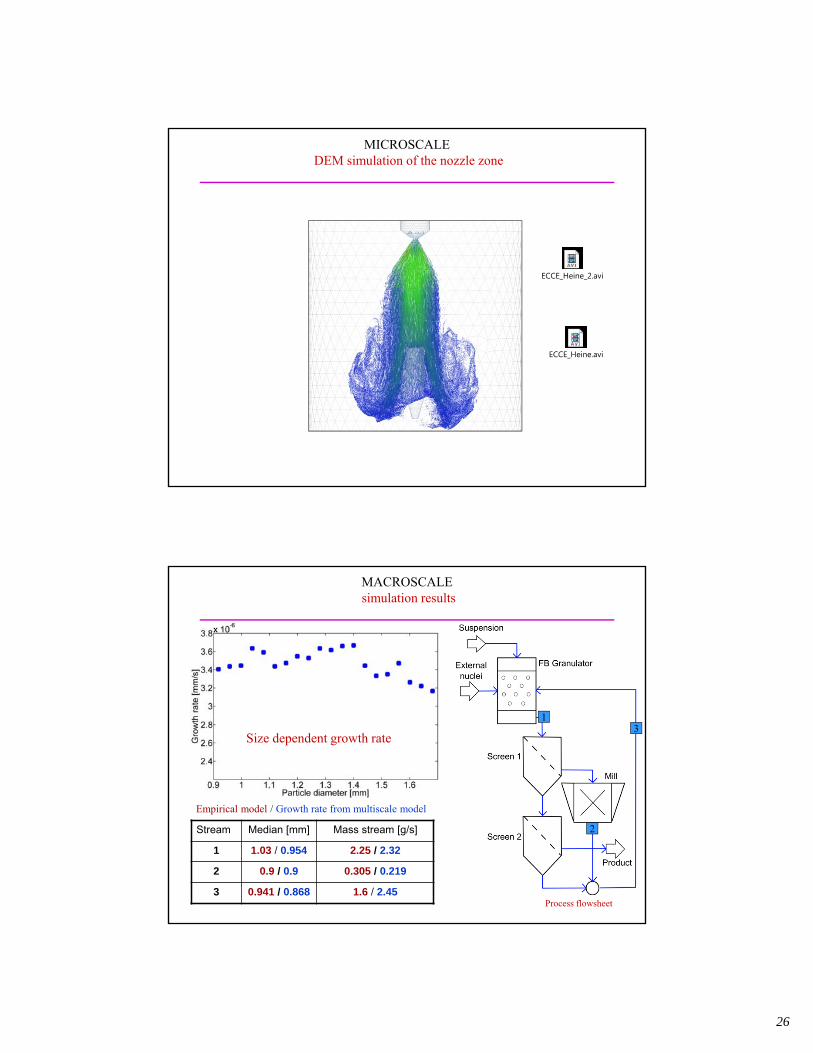
MICROSCALEDEM simulation of the nozzle zone
ECCE_Heine_2.avi
ECCE_Heine.avi
Stream Median [mm] Mass stream [g/s]
1 1.03 / 0.954 2.25 / 2.32
2 0.9 / 0.9 0.305 / 0.219
3 0.941 / 0.868 1.6 / 2.45
13
2
Empirical model / Growth rate from multiscale model
Process flowsheet
Size dependent growth rate
MACROSCALEsimulation results

27
binder primary particle
liquid bridge solid bridge
e.g. pharmaceutical technology, combination of active agentsand excipients, instant coffee
of primary particles (powder)
Agglomeration (agglomerare (lat.) = to agglomerate)
spraying agglomeratesolidificationwetting
„blackberry-like“ structure
MACROSCALEagglomeration
53
Air
As an simulation example the continuous agglomeration process has been used
Short-cut models
Multiscale model
MACROSCALEflowsheet of agglomeration process
28
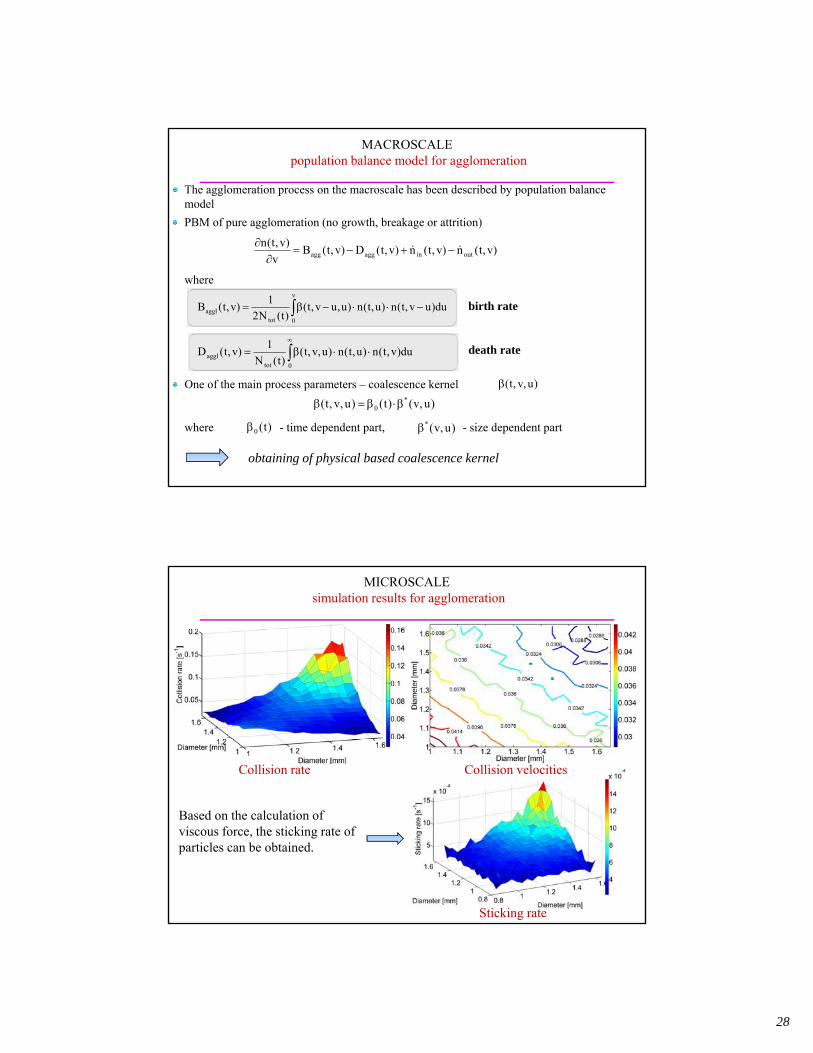
MACROSCALEpopulation balance model for agglomeration
The agglomeration process on the macroscale has been described by population balance model
PBM of pure agglomeration (no growth, breakage or attrition)
where
One of the main process parameters – coalescence kernel
where - time dependent part, - size dependent part
)v,t(n)v,t(n)v,t(D)v,t(Bv
)v,t(noutinaggagg
du)uv,t(n)u,t(n)u,uv,t()t(N2
1)v,t(B
v
0totaggl
0tot
aggl du)v,t(n)u,t(n)u,v,t()t(N
1)v,t(D
birth rate
death rate
)u,v,t(
)u,v()t()u,v,t( *0
)t(0 )u,v(*
obtaining of physical based coalescence kernel
Collision rate Collision velocities
Sticking rate
Based on the calculation of viscous force, the sticking rate of particles can be obtained.
MICROSCALEsimulation results for agglomeration

29
The contact forces which arise from subsequent collisions with neighbour particles can cause the rupture of the formed liquid bridge
A force balance including viscous adhesion forces in the liquid bridge and separating forces due to collisions is solved on the microscale
The received results are used to calculate the probability for the destruction of a liquid bridges connecting two particles due to further collisions with other particles
Time progression of PSD of macro process
MACROSCALEsimulation results for agglomeration
The multiscale simulation leads to more detailed process description, where material microproperties can be considered
Accurate closures are required for fluid-particle and particle-particle interactions
Complex solids processes with multiple process units can be described by flowsheet simulation
In this contribution the general view of simulation framework has been proposed and applied for granulation/agglomeration processes
CONCLUSIONS
58