multi-scale flow behavior in gas–solids two-phase flow systems
TRANSCRIPT

Chemical Engineering Journal 117 (2006) 187–195
Multi-scale flow behavior in gas–solids two-phase flow systems
B. Wu, L. Briens ∗, J.-X. ZhuDepartment of Chemical and Biochemical Engineering, The University of Western Ontario, London, Ont., Canada N6A 5B9
Received 11 May 2005; received in revised form 9 November 2005; accepted 23 November 2005
Abstract
Differential pressure along the axis and local solids concentration in the fully developed region were measured in a high-density downer (0.025 mi.d., 5 m high). Chaos analysis was used to study the non-linear and multi-scale flow behavior in the downer. Local solids concentration measurementsand global differential pressure measurements in the fully developed region were used to estimate the correlation integral. Pressure fluctuationsin the fully developed region of the downer showed bi-fractal behavior. Large-scale behavior corresponded to a low correlation dimension, andsmall-scale behavior corresponded to a high correlation dimension. FCC particles showed more significant bi-fractal behavior than glass beads.Local flow dynamics from solids concentration measurements were contributed by solids flow of many different scales, namely dispersed particlesand clusters of different sizes, so that there was only one scaling region in the log–log plot of correlation integral versus distance. Solids flux wasfound to significantly affect the correlation dimension.©
K
1
iblccwatgyout
tssco
1d
2005 Elsevier B.V. All rights reserved.
eywords: Downer; Chaos analysis; Flow dynamics; High flux; Solids concentration; Pressure fluctuation; Multi-scale
. Introduction
In gas–solid two-phase systems, there are many flow behav-ors at different scales due to the strong interactive effectsetween the particles and the gas. For example, gas-phase turbu-ence, particulate turbulence and cluster behavior all exist in theirculating fluidized bed (CFB). Generally, small-scale behaviororresponds to fluctuations of low amplitude and high frequencyhile large-scale behavior corresponds to fluctuations of high
mplitude and low frequency [1]. Fluctuations are important ashey promote distribution of the solids and the gas and withoutood distribution of the solids and gas there can be significantield deviations across the downer. Therefore, characterizationf the flow behavior according to scale is very important innderstanding the flow dynamics and operation of gas–solidwo-phase systems.
Fluidized beds have been recognized as chaotic systems sincehe early 1990s [2–4]. Since then, chaos analysis has been exten-ively used to characterize the flow behavior in fluidized bedystems. The correlation dimension is one of the most frequentlyalculated chaos parameters. It indicates the spatial complexity
degrees of freedom of the system [5]. A method proposed byGrassberger and Procaccia [6] has been frequently used to esti-mate the correlation dimension, and will be illustrated later inthis paper.
Some researchers have reported two scaling regions in thelogarithmic plot of correlation integral versus distance (r) andthus two correlation dimensions or bi-fractal behavior [1,7–13].In these cases, the correlation dimension estimated from the scal-ing region at large distances was generally related to large-scaleflow behavior and the correlation dimension estimated from thescaling region at small distances was related to small-scale flowbehavior. Bai et al. [1] correlated the higher correlation dimen-sion of small-scale behavior to particle motion, and the lowercorrelation dimension of large-scale behavior to the motion ofvoids; when the flow was dominated by dispersed particlesin the fast fluidization regime, only one scaling region wasobserved and thus only one correlation dimension was estimated.Karamavruc and Clark [9] correlated the large-scale correlationdimension to slugs and the small scale to dispersed particles inthe study of heat transfer in a slugging bed. Therefore, flowbehavior of different scales in the gas–solid two-phase sys-
f the attractor in phase space and the number of dynamical
∗ Corresponding author. Tel.: +1 519 661 2111x88849; fax: +1 519 661 3498.E-mail address: [email protected] (L. Briens).
tems caused bi-fractal behavior. The appearance of two scalingregions in the log–log plot has also been discussed in other papers[14–18]. However, this bi-fractal phenomenon is not alwaysreported in the study of fluidized bed systems characterized bythe correlation dimension. This paper aims to further investigate
385-8947/$ – see front matter © 2005 Elsevier B.V. All rights reserved.oi:10.1016/j.cej.2005.11.010
188 B. Wu et al. / Chemical Engineering Journal 117 (2006) 187–195
Nomenclature
CFB circulating fluidized bedCm(r) correlation integral at distance r for embedding
dimension of mD correlation dimensionFCC fluid catalytic crackingGs solid flux (kg/m2/s)h distance from the top entrance of the downer (m)i.d. inner diameter (m)m embedding dimensiono.d. outer diameter (m)r distance between a pair of points on the attractorUg superficial gas velocity (m/s)Vp particle velocity (m/s)ε̄s cross-sectional average solids holdupν scaling factorρp particle density (kg/m3)τ time delay (units of time)
the multi-scale flow behavior in gas–solid systems using differ-ent measurements.
2. Experimental and operating procedures
Experiments were conducted in a high-density downer. Aschematic diagram of the experimental apparatus is illustrated inFig. 1. This cold-model gas–solids downflow fluidized bed wasa 5 m tall plexiglass column of 0.025 m i.d. There were two con-duits: one was the downer column and the other was the particlerecycle line. One solids storage tank was on the top and the otherone was at the bottom. Twelve pressure taps were installed alongthe downer column, located at 0.10, 0.30, 0.50, 0.70, 1.00, 1.20,1.50, 1.70, 2.50, 2.70, 3.40 and 3.60 m from the top entrance ofthe column. Six differential pressure transducers were connectedto the 12 taps to measure a distance of 0.2 m along the axial direc-tion. Local solids concentration fluctuations were measured bya fibre optical solids concentration probe installed 2.6 m fromthe top entrance of the column, between the two taps located at2.50 and 2.70 m at r/R = 0.5. Two pinch valves were installed3.00 and 4.40 m from the top entrance to obtain the actual cross-sectional average solids holdup in the fully developed regionby collecting the solids and measuring the height of the solidstrapped between the two valves when they were closed simul-taneously near the end of each experiment. The solids flux (G )wst
ttppa
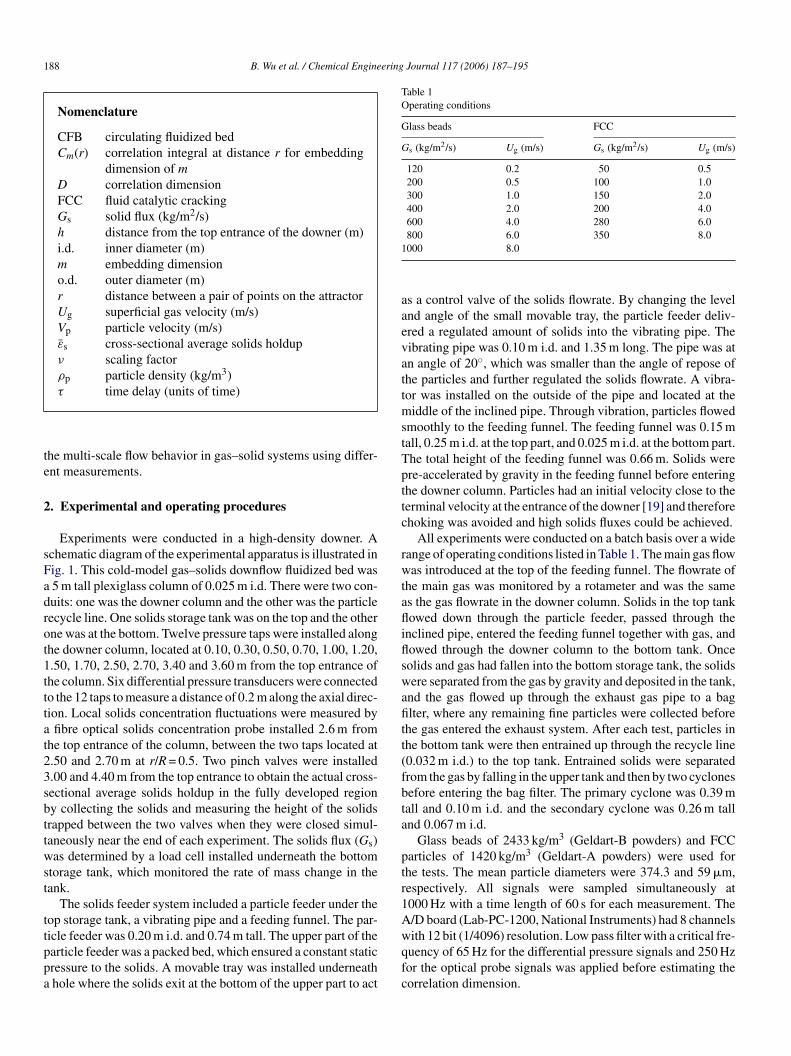
Table 1Operating conditions
Glass beads FCC
Gs (kg/m2/s) Ug (m/s) Gs (kg/m2/s) Ug (m/s)
120 0.2 50 0.5200 0.5 100 1.0300 1.0 150 2.0400 2.0 200 4.0600 4.0 280 6.0800 6.0 350 8.0
1000 8.0
as a control valve of the solids flowrate. By changing the leveland angle of the small movable tray, the particle feeder deliv-ered a regulated amount of solids into the vibrating pipe. Thevibrating pipe was 0.10 m i.d. and 1.35 m long. The pipe was atan angle of 20◦, which was smaller than the angle of repose ofthe particles and further regulated the solids flowrate. A vibra-tor was installed on the outside of the pipe and located at themiddle of the inclined pipe. Through vibration, particles flowedsmoothly to the feeding funnel. The feeding funnel was 0.15 mtall, 0.25 m i.d. at the top part, and 0.025 m i.d. at the bottom part.The total height of the feeding funnel was 0.66 m. Solids werepre-accelerated by gravity in the feeding funnel before enteringthe downer column. Particles had an initial velocity close to theterminal velocity at the entrance of the downer [19] and thereforechoking was avoided and high solids fluxes could be achieved.
All experiments were conducted on a batch basis over a widerange of operating conditions listed in Table 1. The main gas flowwas introduced at the top of the feeding funnel. The flowrate ofthe main gas was monitored by a rotameter and was the sameas the gas flowrate in the downer column. Solids in the top tankflowed down through the particle feeder, passed through theinclined pipe, entered the feeding funnel together with gas, andflowed through the downer column to the bottom tank. Oncesolids and gas had fallen into the bottom storage tank, the solidswere separated from the gas by gravity and deposited in the tank,and the gas flowed up through the exhaust gas pipe to a bagfitt(fbta
ptr1Awqfc
sas determined by a load cell installed underneath the bottom
torage tank, which monitored the rate of mass change in theank.
The solids feeder system included a particle feeder under theop storage tank, a vibrating pipe and a feeding funnel. The par-icle feeder was 0.20 m i.d. and 0.74 m tall. The upper part of thearticle feeder was a packed bed, which ensured a constant staticressure to the solids. A movable tray was installed underneathhole where the solids exit at the bottom of the upper part to act
lter, where any remaining fine particles were collected beforehe gas entered the exhaust system. After each test, particles inhe bottom tank were then entrained up through the recycle line0.032 m i.d.) to the top tank. Entrained solids were separatedrom the gas by falling in the upper tank and then by two cyclonesefore entering the bag filter. The primary cyclone was 0.39 mall and 0.10 m i.d. and the secondary cyclone was 0.26 m tallnd 0.067 m i.d.
Glass beads of 2433 kg/m3 (Geldart-B powders) and FCCarticles of 1420 kg/m3 (Geldart-A powders) were used forhe tests. The mean particle diameters were 374.3 and 59 �m,espectively. All signals were sampled simultaneously at000 Hz with a time length of 60 s for each measurement. The/D board (Lab-PC-1200, National Instruments) had 8 channelsith 12 bit (1/4096) resolution. Low pass filter with a critical fre-uency of 65 Hz for the differential pressure signals and 250 Hzor the optical probe signals was applied before estimating theorrelation dimension.

B. Wu et al. / Chemical Engineering Journal 117 (2006) 187–195 189
Fig. 1. Schematic diagram of the high-density downer.
The solids concentration probe had a very tiny tip and onlymeasured the solids concentration very close to the tip. The flowdynamics captured by the probe were thus very local volumetri-cally. The tip of the probe was always located at a dimensionlessradial position of r/R = 0.5. The differential pressure fluctuationsreflected the pressure fluctuations mainly between the two mea-surement ports along the axis of the downer with a distance of0.2 m. The measured pressure fluctuations, however, also hadcontributions from the flow behavior above the upper measure-ment port and below the bottom measurement port. Therefore,flow dynamics captured by pressure fluctuations were moreglobal volumetrically.
3. Estimation of correlation dimension
The correlation dimension was estimated using the methodproposed by Grassberger and Procaccia [6]. The correlation inte-gral, Cm, is calculated at various distances, r, and embeddingdimensions, m:
Cm(r, m) = 2
Nm(Nm − 1)
Nm∑
i=1,j=i+1
θ(r − rij) (1)
The scaling factor, ν, is then calculated from the slope of thelinear region of the plot of ln Cm(r, m) versus ln(r). If ν does

190 B. Wu et al. / Chemical Engineering Journal 117 (2006) 187–195
Fig. 2. An example of log–log plot of correlation integral vs. r.
not change with an increase in m, the scaling factor ν is equal tothe correlation dimension (D). Embedding dimension, m, was atleast 18 in this study according to Takens [20].
A typical example of a log–log plot of correlation integralversus distance r is shown in Fig. 2. There are generally threeregions: for r close to or greater than the diameter of the attractor,the correlation integral does not increase with increasing r, andthis region is called the saturation region; when r is smaller thanthe smallest distance between phase space pairs, the correlationintegral should be zero and the region is called the depopulationregion; an intermediate linear part is the scaling region for cal-culating the scaling factor ν [21]. An example of a plot that hastwo scaling regions, or that shows bi-fractal behavior, is shownin Fig. 3. The two scaling regions are separated by a transi-tion region. The curve was fitted and the scaling factors ν1 andν2 were then estimated from the two local maxima of the firstderivative of the fitted curve.
Fig. 4. Axial profiles of pressure gradient using glass beads.
4. Results and discussion
4.1. Axial flow development from pressure gradient
An example of time-averaged pressure gradient profiles alongthe axial direction of the downer column is shown in Fig. 4.Pressure gradients increased rapidly along the downer columnwithin the initial 1–2 m, and then became approximately con-stant. The slight drop of pressure gradient past 1.5 m at lower Ug(≤1.0 m/s) may be caused by solids deceleration due to the highvelocity particle feeding and low velocity operation. The con-stant pressure gradients indicated that the particles had reacheda constant velocity. Axial profiles of pressure gradients underother operating conditions showed similar trends for both theglass beads and FCC particles with the acceleration length forthe FCC particles slightly shorter than that for the glass beads.Therefore, the acceleration region was estimated to be withinapproximately 1–2 m from the top entrance of the downer.
4.2. Distinguishing between local and global measurements
Segments of time series from local solids concentration mea-surements and differential pressure measurements are shown inFig. 5. Small and large fluctuations were distributed through-out the solids concentration signals, while the pressure signalswtbddmtbsdt
sm
Fig. 3. An example of bi-fractal behavior.ere dominated by large and slow fluctuations. Solids concen-ration measurements from the optical probe indicate a local flowehavior. The small and rapid fluctuations were possibly due toispersed particles while the larger fluctuations were more likelyue to clusters. Pressure measurements indicated global volu-etric flow behavior, and thus there were large fluctuations in
he signals. As the pressure measurements were also affectedy the flow of dispersed particles and clusters, there were alsoome smaller fluctuations in the signals. Local and global flowynamics were thus observed to be different directly from theime series.
Correlation integrals were estimated from time series ofolids concentration measurements and differential pressureeasurements. All the correlation integrals shown in this study

B. Wu et al. / Chemical Engineering Journal 117 (2006) 187–195 191
Fig. 5. Time series of signals measured simultaneously by the pressure trans-ducer and fibre optical probe in the downer section of 2.5–2.7 m using glassbeads at Gs = 400 kg/m2/s and Ug = 0.2 m/s. (a) Signal from optical fibre probeand (b) signal from differential pressure transducer.
were estimated using an embedding dimension of at least 18,which was verified to be sufficiently large to correctly recon-struct the attractor. For solids concentration measurements, onlyone scaling region was found in the logarithmic plots of corre-lation integral versus r, similar to the plot shown in Fig. 2. Asshown in Fig. 6, for most pressure measurements, two scalingregions were identified from the logarithmic plots of correla-tion integral versus r. For pressure measurements in the topentrance region (h < 1.0 m) under low superficial gas velocities(Ug ≤ 2 m/s) using glass beads particles, only one scaling regionwas observed. Therefore, in the fully developed region, pressuremeasurements could be easily distinguished from solids con-centration measurements by the correlation integral, as only thepressure measurements showed bi-fractal behavior.
In order to directly examine the flow dynamics, attractorswere reconstructed from time series of pressure and concentra-tion measurements and shown in two dimensions in Figs. 7 and 8.The attractor for the concentration measurements had a morecomplex shape than the attractor reconstructed from pressuremeasurements. The trajectories of the attractor of pressure mea-surements were smoother than those of the concentration mea-surement attractor. However, considering the attractors drawnas scattered points, it appeared that there were some relativelydense regions, mostly close to the core, of the attractor of pres-sure measurements, while there were no obviously dense regionsof the attractor of concentration measurements. The relativelydtm
4
f
Fig. 6. Correlation integral vs. r at different axial levels for pressure mea-surements using glass beads. (a) Gs = 400 kg/m2/s and Ug = 0.2 m/s and (b)Gs = 400 kg/m2/s and Ug = 8 m/s.
the top entrance region due to very low solids velocities. Dis-persed particles and aggregates of different sizes existed in thetop entrance region of the downer. They contributed to the pres-sure fluctuations although their contribution was relatively weak.Therefore, only one scaling region was found (Fig. 6a). Fur-ther along the downer axis (0.5–0.7 m), the solids velocity washigher due to acceleration. Large clusters with high momentumcontributed more significantly to the pressure fluctuations andcaused strong cyclic behavior. Therefore, two scaling regionsappeared (Fig. 6). At a high Ug of 8 m/s, two scaling regionswere found from pressure measurements at all axial levels ofthe downer.
Results found in this study are comparable to those fromZhao et al. [11] in a bubbling bed using pressure measurements.When the fluidized bed was in the particulate regime, only onescaling region was identified; in the bubbling regime, two scal-ing regions appeared. The correlation dimension of large-scalebehavior was attributed to the bubbles and the correlation dimen-sion of small-scale behavior was attributed to the dense phase.
ense region may have caused the scaling region at small dis-ances r and thus the observed bi-fractal behavior for the pressure
easurements.
.3. Multi-scale flow behavior in the high-density downer
Fig. 9 shows time series of pressure measurements at dif-erent axial levels. Pressure fluctuations were not significant in

192 B. Wu et al. / Chemical Engineering Journal 117 (2006) 187–195
Fig. 7. Attractor reconstruction from time series of solid concentrationmeasurements in fully developed downer using glass beads. (a) h = 2.6 m,Gs = 400 kg/m2/s, Ug = 0.2 m/s, lined curve and (b) h = 2.6 m, Gs = 400 kg/m2/s,Ug = 0.2 m/s, scattered points.
Therefore, dense flow in the top entrance region of the downerwas likely in particulate regime with the dominant effect of clus-tering behavior on pressure fluctuations in the fully developedregion of the downer similar to the dominant effect of bubble/gasbehavior on the pressure fluctuations in conventional fluidizedbeds.
A comparison of the correlation integrals estimated frompressure measurements and solids concentration measurementsin the fully developed region is shown in Fig. 10. The correla-tion dimensions of small-scale and large-scale behavior frompressure measurements were 11.6 and 5.8, respectively. Thecorrelation dimension estimated from solids concentration mea-surements was 10.6. Local flow behavior (D = 10.6) was morecomplex than the global flow (D1 = 5.8) but more regular thanthe small-scale flow behavior (D2 = 11.6) of the pressure fluctua-tions, since large-scale flow behavior of clusters also contributedto local solids concentration fluctuations.
Fig. 11 shows a comparison of the correlation integrals esti-mated from the pressure measurements for FCC particles and
Fig. 8. Attractor reconstruction from time series of pressure measurements infully developed downer using glass beads: (a) h = 2.5–2.7 m, Gs = 400 kg/m2/s,Ug = 0.2 m/s, lined curve and (b) h = 2.5–2.7 m, Gs = 400 kg/m2/s, Ug = 0.2 m/s,scattered points.
Fig. 9. Time series of pressure measurements in the downer using glass beads.

B. Wu et al. / Chemical Engineering Journal 117 (2006) 187–195 193
Fig. 10. Comparison of correlation integrals from different measurements atGs = 120 kg/m2/s, Ug = 0.2 m/s.
glass beads in the fully developed region. There are two scal-ing regions for both solids indicating multi-scale behavior. Thescaling regions are separated by a transition region. The lengthof the transition region reflects the difference in the scales. Thetransition region was wider for the FCC particles than for theglass beads. According to the continuous equation of solids:ρpε̄svp = Gs, where Gs is solids flux, vp the particle veloc-ity, ρp the particle density, and ε̄s is the cross-sectional averagesolids holdup, the particle density and terminal velocity of glassbeads were much higher than those of FCC particles. Therefore,the cross-sectional average solids holdup for glass beads wasmuch lower than that of FCC particles at the same Gs and Ug.Therefore, FCC particles (Geldart-A) formed large clusters morereadily compared to glass beads (Geldart-B). Large clusters ofFCC particles caused much stronger cyclic behavior (Fig. 12).As the scale difference between the large clusters and dispersedparticles/small clusters was significant, the transition region of
Fig. 12. Time series of pressure measurements using different particles.
the correlation integral was longer for FCC particles than forglass beads. Larger clusters of FCC particles caused a lowercorrelation dimension (D = 6.0) compared to that of glass beads(D = 6.7), as larger clusters caused more regular pressure fluctu-ations. Small-scale flow behavior of finer FCC particles caused alarger correlation dimension (D = 9.8) compared to that of glassbeads (D = 7.9), as fine particles caused irregular and small pres-sure fluctuations.
Fig. 13 shows profiles of correlation dimension as a functionof Gs for both pressure and solids concentration measurementsat Ug of 0.2 m/s using glass beads. For solids concentrationmeasurements, D decreased with increasing solids flux at lowGs (<400 kg/m2/s). Under these conditions, the flow was dilutewith intermittent passage of particles and small clusters. Athigh solids fluxes of 400–800 kg/m2/s, D was lower and almost
FmG
Fig. 11. Comparison of correlation integral for different particles.ig. 13. Correlation dimensions estimated from differential pressure measure-ents and solids concentration measurements using glass beads as a function of
s.

194 B. Wu et al. / Chemical Engineering Journal 117 (2006) 187–195
constant. Under these conditions, as Gs increased more clusterswere formed. These clusters might lead to a dense flow condi-tion that occupied the whole cross-section. Such local dense flowmight be similar to the dense suspension upflow (DSU) [22] sug-gested in a high-density riser. However, the size of the clusters inthe downer did not significantly increase due to high slip veloc-ities between clusters and the gas flow. Large clusters causedregular flow while more clusters caused irregular flow. Thiscompeting change in fluctuation behavior resulted in almost con-stant D values over high solids fluxes from 400 to 800 kg/m2/s.High-flux flow was therefore identified at over 400 kg/m2/s. Ata very high solids flux of 800 kg/m2/s, D decreased slightly withincreasing Gs as the fluctuations from the large clusters becamesignificant. D was affected more significantly by large and slowfluctuations than small rapid fluctuations at very high solids flux.
Similar to D from local solids concentration measurements,D2 estimated from small scales of differential pressure mea-surements decreased with increasing Gs under low-flux flow(<300 kg/m2/s). Small-scale pressure fluctuations were domi-nant under low-flux flow and were very irregular resulting in avery high D2. Small-scale behavior was damped with increasingGs and D2 decreased. Large-scale behavior under low-flux flow(<400 kg/m2/s) was slow, weak and regular with very small D1due to small clusters. D1 became higher under high-flux flow(400–800 kg/m2/s), due to enhanced clustering behavior. Moreclusters caused irregular pressure fluctuations, while large clus-tpDbdtflcs
wpcddaoia
tbwHfifflswd
ments in denser beds (e.g., bubbling or turbulent bed) should beconsidered.
5. Conclusions
Local solids concentration measurements and global differ-ential pressure measurements in the fully developed region of ahigh-density downer were distinguished by estimation of the cor-relation integral: the log–log plot of correlation integral versusr from solids concentration measurements had only one scalingregion; two scaling regions were usually identified from pressuremeasurements.
Pressure fluctuations in the fully developed region of thedowner were dominated by strong cyclic behavior from largeclusters. The dominant cyclic behavior caused the large differ-ence in temporal scales in the time series of pressure fluctuations,so that bi-fractal behavior was observed. Large-scale behaviorcorresponded to a low correlation dimension, and small-scalebehavior corresponded to a high correlation dimension. FCCparticles (Geldart-A) easily formed clusters compared to glassbeads (Geldart-B), so that bi-fractal behavior was more signifi-cant from pressure measurements in the fully developed regioncompared to glass beads under the same operating conditions.
Local flow dynamics from solids concentration measure-ments were almost equally influenced by flow behavior at manydfsms
dDflctfl
A
nBf
R
ers caused large and regular pressure fluctuations. This com-eting flow behavior of clusters also resulted in almost constant1 over high solids fluxes from 400 to 800 kg/m2/s. Small-scaleehavior was further damped with increasing Gs and D2 keptecreasing. D1 and D2 became closer under high-flux flow dueo regular behavior for both small and large scales under denseow. At very high Gs (>800 kg/m2/s), more and larger clustersaused more regular pressure fluctuations across many scales,o that D1 and D2 decreased and became very close.
D estimated from local solids concentration measurementas generally much higher than those from global differentialressure measurements (both D1 and D2), indicating extremelyomplex local flow dynamics and relatively regular global flowynamics. This reflects the different flow properties of theowner system. Even though correlation dimensions from localnd global flow behaviors showed different values under sameperating conditions, some similar transitions with increasing Gsndicated that flow properties could be captured by both localnd global flow dynamics.
Considering the small diameter of the downer (0.025 m i.d.),here may have been wall effects on the solids and gas distri-utions in the downer and thus on the fluid dynamics. Thisould affect the absolute value of the correlation dimension.owever, the multi-scale flow behavior has been confirmed
rom preliminary pressure fluctuation measurements in a 0.20 m.d. riser (10 m high) using FCC particles by authors. There-ore, multi-scale flow should be a characteristic of two-phaseow systems. For solids concentration measurements, only onecaling region of log–log plot of correlation integral versus ras found in the 0.20 m i.d. riser circulating fluidized beds atifferent axial and radial position. However, further measure-
ifferent scales, namely dispersed particles and clusters of dif-erent sizes. Local flow behavior from solids concentration mea-urements in the developed region of the downer was generallyore complex than the global flow behavior from pressure mea-
urements.Comparisons of small and large scales flow behavior from
ifferential pressure measurements were drawn from D1 and2. Even though correlation dimensions from local and globalow behavior showed different values under the same operatingonditions, some similar transitions with increasing Gs indicatedhat flow properties could be captured by both local and globalow dynamics.
cknowledgements
The authors are grateful to the Natural Sciences and Engi-eering Research Council of Canada for the financial support.angyou Wu would like to thank Dr. Q. Zhao and Joshua Smit
or their help with the experiments.
eferences
[1] D. Bai, H. Bi, J.R. Grace, Chaotic behavior of fluidized beds based onpressure and voidage fluctuations, AIChE J. 43 (5) (1997) 1357–1361.
[2] J. Stringer, Is a fluidized bed a chaotic dynamic system? in: Proceedingsof the10th International Conference on Fluidized Bed Combustion, vol.1, 1989, pp. 265–272.
[3] C.S. Daw, J.S. Halow, Characterization of voidage and pressure signalsfrom fluidized beds using deterministic chaos theory, in: E.J. Anthony(Ed.), Proceedings of the 11th International Conference on FluidizedBed Combustion, vol. 2, ASME, 1991, pp. 777–786.
[4] C.M. van den Bleek, J.C. Schouten, Deterministic chaos: a new tool influidized bed design and operation Chem. Eng. J. 53 (1993) 75–87.

B. Wu et al. / Chemical Engineering Journal 117 (2006) 187–195 195
[5] M.L.M. van der Stappen, Chaotic hydrodynamics of fluidized beds,Ph.D. Thesis, Delft University of Technology, The Netherlands, DelftUniversity Press, 1996.
[6] P. Grassberger, I. Procaccia, Characterization of strange attractors, Phys.Rev. Lett. 50 (5) (1983) 346–349.
[7] F. Franca, M. Acigoz, R.T.J. Lahey, A. Clausse, The use of fractaltechniques for flow regime identification, Int. J. Multiphase Flow 17 (4)(1991) 545–552.
[8] B. Izrar, F. Lusseyran, Chaotic behavior of an annular film of liquidunstabilized by an interfacial shear stress, in: G. Gouesbet (Ed.), Insta-bilities in Multiphase Flows, Plenum, New York, 1993, pp. 1–15.
[9] A.I. Karamavruc, N.N. Clark, Local differential pressure analysis in aslugging bed using deterministic chaos theory, Chem. Eng. Sci. 52 (3)(1997) 357–370.
[10] D. Bai, A.S. Issangya, J.R. Grace, Characteristics of gas-fluidized bedsin different flow regimes, Ind. Eng. Chem. Res. 38 (3) (1999) 803–811.
[11] G.B. Zhao, Y.F. Shi, G.Q. Guan, H.R. Yu, in: M. Kwauk, J. Li, W.C.Yang (Eds.), Chaotic Method for Distinguishing Between Particulate andCluster Fluidization, Fluidization X, Engineering Foundation, New York,2001, pp. 157–164.
[12] L. Huilin, D. Gidaspow, J.X. Bouillard, Chaotic behavior of local tem-perature fluctuations in a laboratory-scale circulating fluidized bed, Pow-der Technol. 123 (2002) 59–68.
[13] A. Ajbar, K. Alhumaizi, A. Ibrahim, M. Asif, Hydrodynamics of gasfluidized beds with mixture of group D and B particles, Can. J. Chem.Eng. 80 (2002) 281–288.
[14] A. Ben-Mizrachi, I. Procaccia, Characterization of experimental (noisy)strange attractors, Phys. Rev. A 29 (2) (1984) 975–977.
[15] J. Theiler, Spurious dimension from correlation algorithms appliedto limited time-series data, Phys. Rev. A 34 (3) (1986) 2427–2432.
[16] J.X. Bouillard, A.L. Miller, Experimental investigations of chaotichydrodynamic attractors in circulating fluidized beds, Powder Technol.79 (3) (1994) 211–215.
[17] L. Huilin, D. Gidsapow, J.X. Bouillard, Dimension measurements ofhydrodynamic attractors in circulating fluidized beds, Powder Technol.90 (1997) 179–185.
[18] G.B. Zhao, J.Z. Chen, Y.R. Yang, Predictive model and determinis-tic mechanism in a bubbling fluidized bed, AIChE J. 47 (7) (2001)1524–1532.
[19] W.D. Liu, K.B. Luo, J.-X. Zhu, J.M. Beeckmans, Characterization ofhigh density gas–solids downflow fluidized beds, Powder Technol. 115(2001) 27–35.
[20] F. Takens, in: D.A. Rand, L.-S. Young (Eds.), Detecting Strange Attrac-tors in Turbulence, Lecture Notes in Mathematics, vol. 898, SpringerVerlag, New York, 1981, pp. 366–381.
[21] L. Briens, Identification of flow regimes in multiphase reactors by timeseries analysis, Ph.D. Thesis, The University of Western Ontario, Lon-don, Canada, 2000.
[22] J.R. Grace, A.S. Issangya, D. Bai, H.-T. Bi, J.-X. Zhu, Situating thehigh-density circulating fluidized bed, AIChE J. 45 (10) (1999) 2108–2116.