multi-scale analysis of wellbore...
TRANSCRIPT

Multi-Scale Analysis of Wellbore Performance
Bill Carey, Hari Viswanathan, Rajesh Pawar, Phil Stauffer, and George Guthrie, Jr.
Earth and Environmental SciencesLos Alamos National Laboratory
Carbon Mitigation Initiative MeetingPrinceton, NJ
November, 2005

OutlineWellbore Performance—PENS-CO2 Sequestration Framework
Components of the frameworkWellbore leakage within framework (e.g., Nordbotten and Celia)
Statistics of Wellbore PerformanceSustained Casing pressure as a performance measure
Observations of Wellbore PerformanceSACROC
Laboratory ExperimentsE.g., Scherer et al.
Numerical IntegrationFlexible Reservoir-Wellbore Simulation
System Scale
ReservoirScale
WellboreScale
BenchtopScale
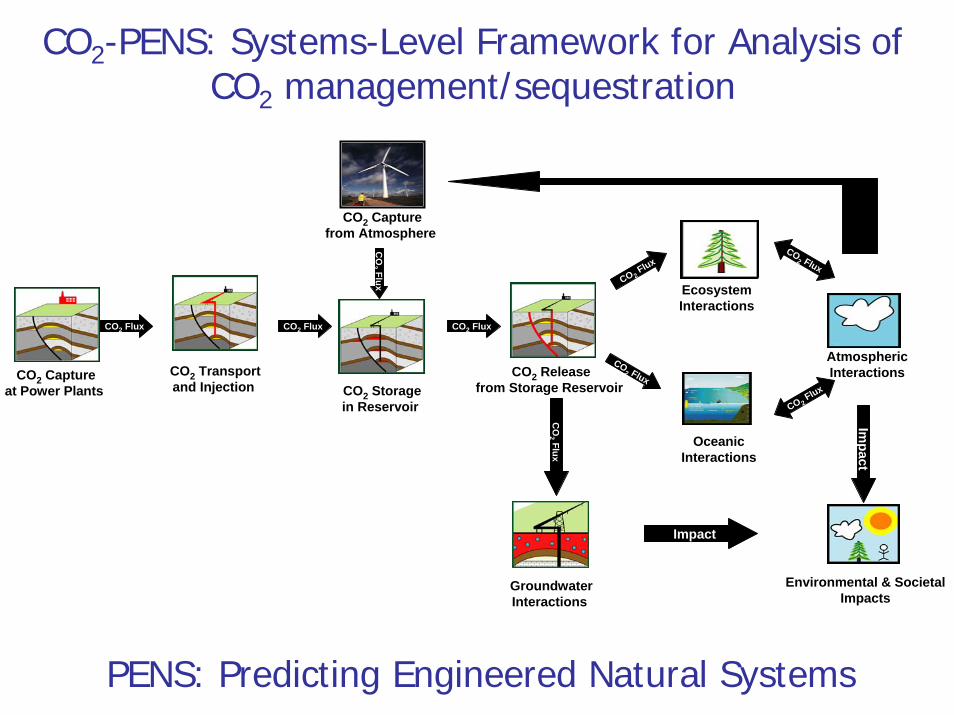
CO2-PENS: Systems-Level Framework for Analysis of CO2 management/sequestration
CO2 Flux
CO2 Capturefrom Atmosphere
CO2 Storagein Reservoir
CO2 Releasefrom Storage Reservoir
CO2 Flux
EcosystemInteractions
CO 2Flux
CO2 Flux
OceanicInteractions
AtmosphericInteractions
CO2 Flux
CO 2Flux
CO
2 Flux
GroundwaterInteractions
Impact
Impact
CO
2 FluxEnvironmental & Societal
Impacts
CO2 Flux
CO2 Transportand Injection
CO2 Captureat Power Plants
PENS: Predicting Engineered Natural Systems

CO2-PENS: Reservoir Sub-System
StorageReservoir
ReservoirSeal
Potential ReleaseMechanism
CO2 Transportfrom Reservoir
CO2 Releaseat Surface
Frac
ture
Flow
Satu
rate
d &
Uns
atur
ated
Poro
us F
low
Wel
l Bor
eFl
ow
Wel
l Bor
eFa
ilure
Faul
t or
Frac
ture
Seal
Failu
reC
atas
trop
hic
Even
t
Salt
Shal
eM
udst
one
Car
bona
teO
ther
Sand
ston
e Li
mes
tone
Dol
osto
neB
asal
tC
oal B
edO
ther
Hos
t
Terr
estr
ial
Syst
ems
Atm
osph
eric
Proc
esse
s
Suba
queo
usSy
stem
s
Late
ral
Mig
ratio
nO
ther


CO2-PENS output includes tracking of CO2 in different subsystems over time, controlling factors (such as wellbore status),
economics, etc.
Time
Time
Rel
ease
Rat
e
Bor
ehol
es F
ixed

CO2-PENS: Wellbore ModuleNecessary Components
Failure Rates Failure Rates Leak Rates• Time to fail• Frequency of failure
Time
Probability to Fail
Frequency of failure at time t
Failure mechanism distribution
Permeability distribution for fracture flow
Failure Mechanisms• Poor job of cementing• Cement deterioration• Casing failure• Blow-out
Flow Paths• Matrix flow• Fracture flow• Pipe flow

Sustained Casing Pressure (SCP)(a measurable build-up of pressure in any casing string)
A possible analog and measure of wellbore failureOrigins
Casing and tubingThreads, corrosion, thermal and mechanical stress/rupture
Primary cement jobGas invasion, mud cake, formation damage
Cement damageMechanical shocks, T-P stress
Micro-annuliFracture/cracking
ConsequencesCasing failure, hydrocarbon loss, pollution

Sustained Casing Pressure (SCP)Databases
Regulatory agencies; oil and gas companies
Example data set: Gulf of Mexico (Mineral Management Services)
“A review of sustained casing pressure on the OCS” by A. T. Bourgoyne, Jr., S. L. Scott, and W. Manowski (LSU and Dowell-Schlumberger) (2000)
“Diagnosis and remediation of sustained casing pressure in wells” by A. K. Wojtanowicz, S. Nishikawa, and X. Rong (LSU) (2001)
% A
LL C
ASI
NG
S W
ITH
SC
P
11,498 casings with SCP in 8122 wells
0%
10%
20%
30%
40%
50%
60%
Production Intermediate Surface Conductor Structural

800 400600 200 0 Number of wells
0 20 40 60 80 100Percent of wells
Towards a probabilistic distribution of wellbore failure:Outer casingfailure statistics
Bourgoyne et al. (2000)
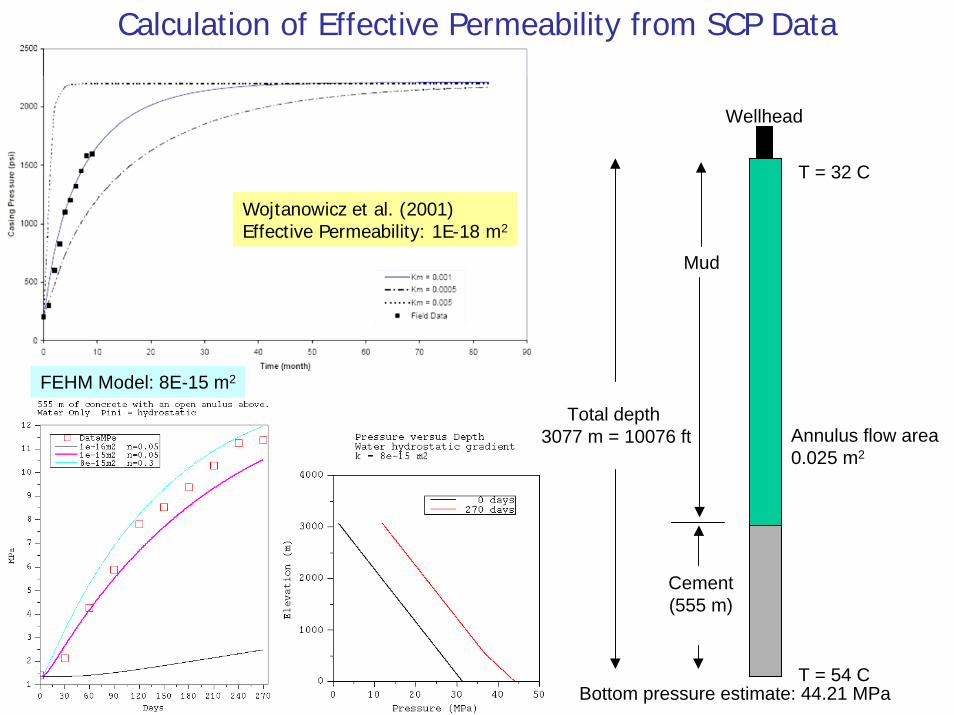
Calculation of Effective Permeability from SCP Data
Wojtanowicz et al. (2001)Effective Permeability: 1E-18 m2
Total depth 3077 m = 10076 ft Annulus flow area
0.025 m2
T = 54 C
T = 32 C
Wellhead
Bottom pressure estimate: 44.21 MPa
Cement (555 m)
Mud
FEHM Model: 8E-15 m2

Field Studies: SACROC• Pennsylvanian age reef
system• Discovered 1948• 54,000 acres• 3 billion BBLS original oil
in-place• 13th largest in North
America
SACROC (Scurry Area Capital Reef Operations Committee)
81 mi2, 1800 wells, 600 operationalProductive zone at 7000’ and is as thick as 800’Field temperature 50 ºC; Initial pressure 3200 psi (now 2600 psi)CO2 flooding initiated 1972 (only one field in the world is older)CO2 now obtained primarily from McElmo Dome, CO62% of all CO2 injected is not recovered (effectively sequestered)Drilling and production from zones above and below the Cisco/Canyon Reef complex have been free of CO2
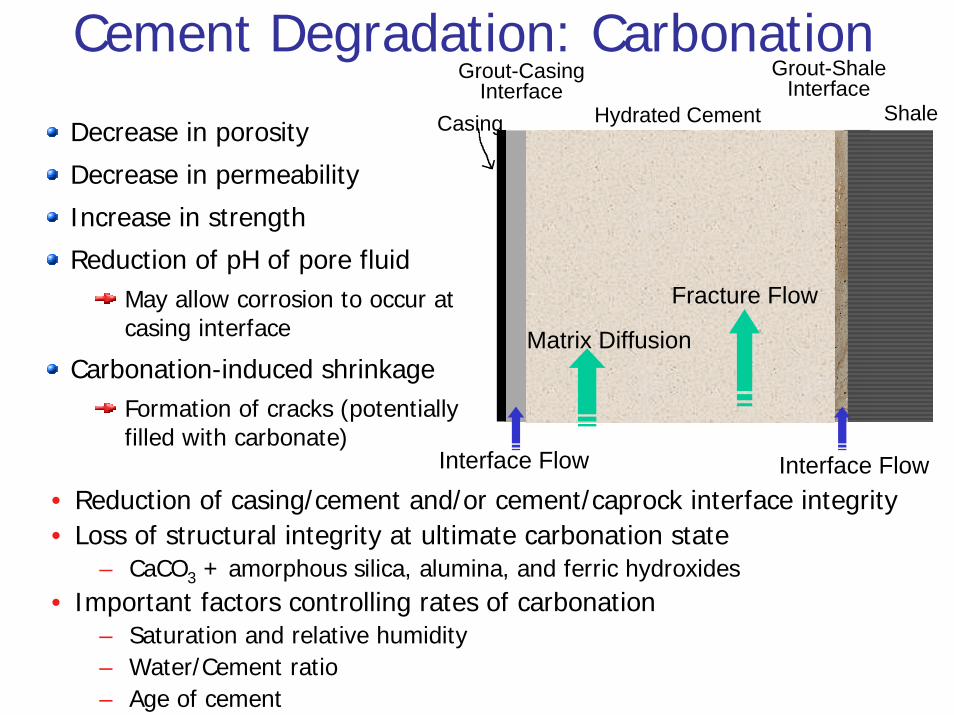
Casing Shale
Grout-CasingInterface
Hydrated Cement
Grout-ShaleInterface
Matrix Diffusion
Interface Flow
Cement Degradation: Carbonation
Interface Flow
Decrease in porosity
Decrease in permeability
Increase in strength
Reduction of pH of pore fluidMay allow corrosion to occur at casing interface
Carbonation-induced shrinkageFormation of cracks (potentially filled with carbonate)
• Reduction of casing/cement and/or cement/caprock interface integrity• Loss of structural integrity at ultimate carbonation state
– CaCO3 + amorphous silica, alumina, and ferric hydroxides • Important factors controlling rates of carbonation
– Saturation and relative humidity– Water/Cement ratio– Age of cement
Fracture Flow

Cross-Section Through Well-Bore: 49-6

Gray Cement – Orange Zone – Shale Fragment Zone
Phase Gray Zone
Amorphous Major
Portlandite 15-58%
Calcite 0-28%
Halite 9-32%
Katoite 22-26%Brucite 3-9%Ettringite 3-4%Friedel’s Salt 2-4%
Phase Orange Zone
Calcite 44%
Aragonite 8%
Vaterite 33%
Halite 13%
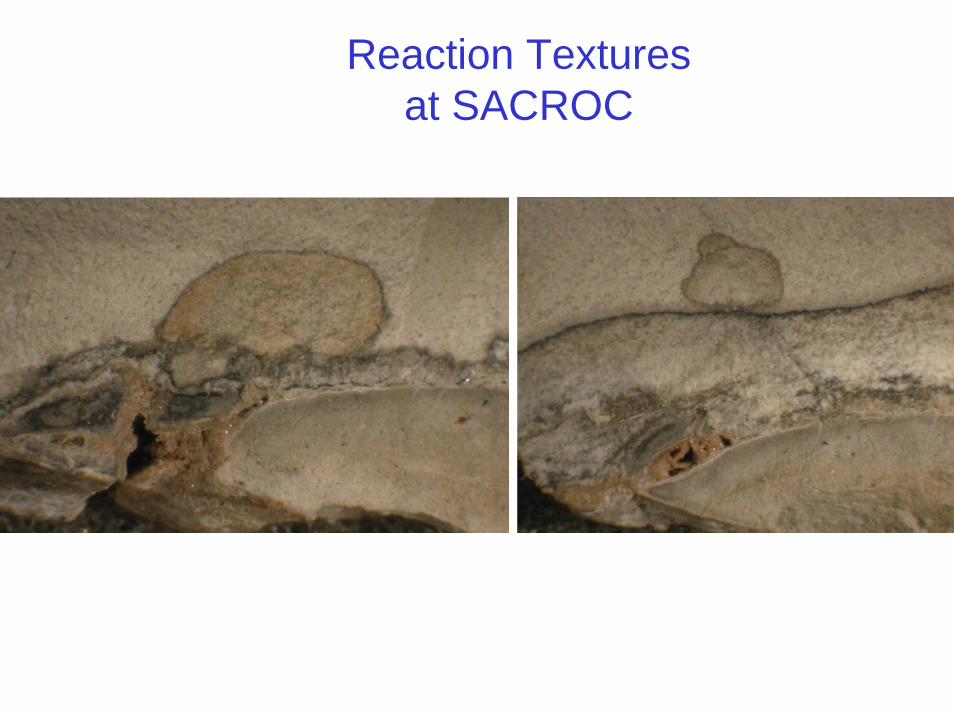
Reaction Texturesat SACROC

Reaction Textures at SACROC

Zone Air Dried Oven Dried (mD) (mD) Upper Cement 0.09 74.00 Gray Zone C 0.10 Gray Zone A1 0.09 38.54 Gray Zone A2 0.07 48.22 Gray Zone A3 0.11 18.94 Gray Zone B1 5.75 Gray Zone B2 3.33 Gray Zone B3 8.40 Orange Zone A1 0.38 0.43 Orange Zone A2 0.19 0.19 Orange Zone A3 0.11 0.05 Orange Zone B1 0.17 Orange Zone B2 0.14 Orange Zone B3 0.22 Orange Zone B4 1.22 Shale along layers 8.57
Air-Permeability Measurements of Cement and Shale in milliDarcy
Measurements courtesy of Bob Svec, New Mexico Tech
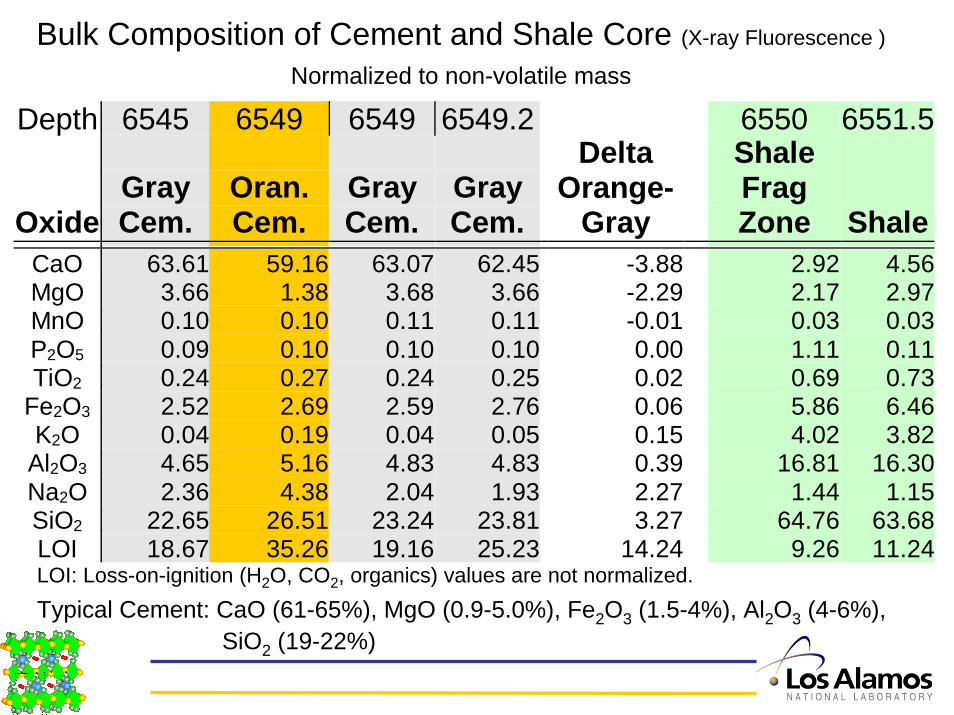
Bulk Composition of Cement and Shale Core (X-ray Fluorescence )
Normalized to non-volatile mass
Depth 6545 6549 6549 6549.2 6550 6551.5
Oxide Gray Cem.
Oran. Cem.
Gray Cem.
Gray Cem.
Delta Orange-
Gray
Shale Frag Zone Shale
CaO 63.61 59.16 63.07 62.45 -3.88 2.92 4.56MgO 3.66 1.38 3.68 3.66 -2.29 2.17 2.97MnO 0.10 0.10 0.11 0.11 -0.01 0.03 0.03P2O5 0.09 0.10 0.10 0.10 0.00 1.11 0.11TiO2 0.24 0.27 0.24 0.25 0.02 0.69 0.73
Fe2O3 2.52 2.69 2.59 2.76 0.06 5.86 6.46K2O 0.04 0.19 0.04 0.05 0.15 4.02 3.82
Al2O3 4.65 5.16 4.83 4.83 0.39 16.81 16.30Na2O 2.36 4.38 2.04 1.93 2.27 1.44 1.15SiO2 22.65 26.51 23.24 23.81 3.27 64.76 63.68LOI 18.67 35.26 19.16 25.23 14.24 9.26 11.24
LOI: Loss-on-ignition (H2O, CO2, organics) values are not normalized.Typical Cement: CaO (61-65%), MgO (0.9-5.0%), Fe2O3 (1.5-4%), Al2O3 (4-6%),
SiO2 (19-22%)

Stable Isotope Studies of Core Samples

Two-phase multicomponent reactive flow and transportMass & energy conservationSingle and dual continuum formulationsDarcy’s law for two-phase liquid-air systemAqueous speciation (Debye-Hückel and Pitzer)Kinetic formulation of solid reactions
Numerical Analysis of Cement Degradation: FLOTRAN
1-D diffusion of CO2-saturated brine into cementIdealized cement: 40% C-S-H (xSiO2=0.36, Ca/Si = 1.78), 25% portlandite, 15% ettringite, 4% hydrogarnet (16% porosity)Idealized limestone country rock: 80% calcite (20% porosity)Mineral kinetics and rock tortuosity (0.02) control extent of reactionSimulation for 30 year life of well

C-S-H Solid Solution ModelEndmembers: Ca(OH)2 and SiO2
Mol-fraction XSiO2 = 1 / (1+R), R = Ca/Si
( )22
2log SiOOHCaaaa +−+Lippman Variable:
Excess Mixing Model:
]))1(())1(([)1( 2210 xxaxxaaRTxxGE −−+−−+−=
Parameter Estimation:µCa(OH)2,µSiO2, a0, a1, a2, (a3)
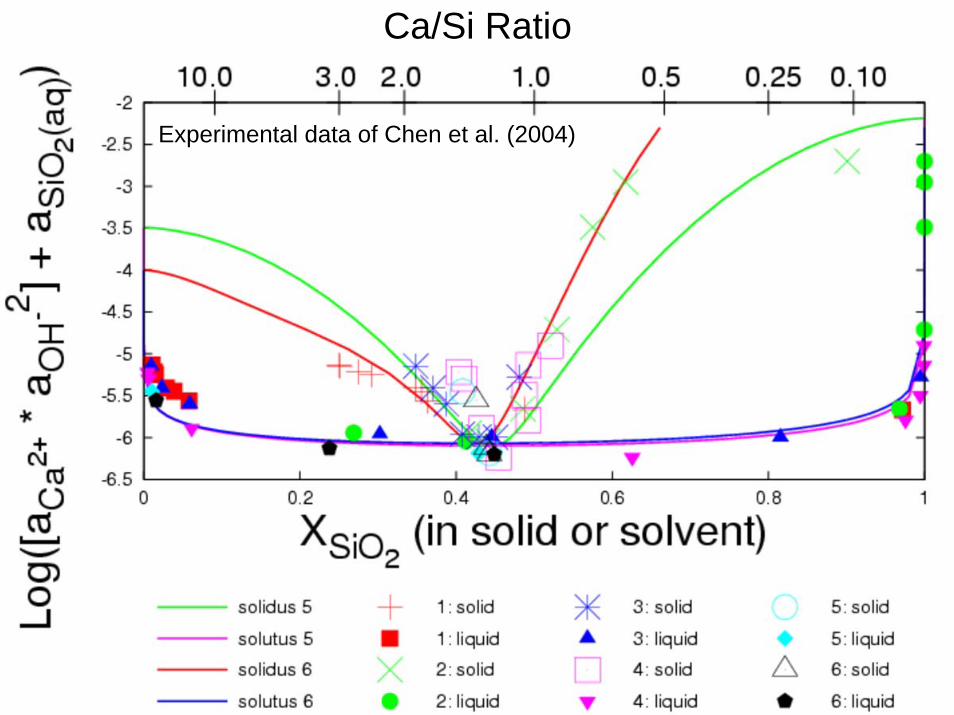
Ca/Si Ratio
Experimental data of Chen et al. (2004)

Cement Rock

Cement Rock

Cement Rock

Numerical Integration: Flexible Reservoir-Wellbore Simulation
Traditional approach of incorporation of wellbore requires grid refinement
Ideally, grid refinement should be based on hydrogeology and numerical issues
Goal: Add a well at any desired location with any level of complexity without grid refinement
Allow for a variety of wellbore flow processes
FEHM: Finite Element Heat and Mass Transfer CodeControl volume finite element approach: results in an unstructured gridEasy to add or modify connections to all existing/primary grid blocks (e.g., as used in dual permeability calculations)Wellbore grid blocks can be added to the geologic framework without modifying framework connectivities
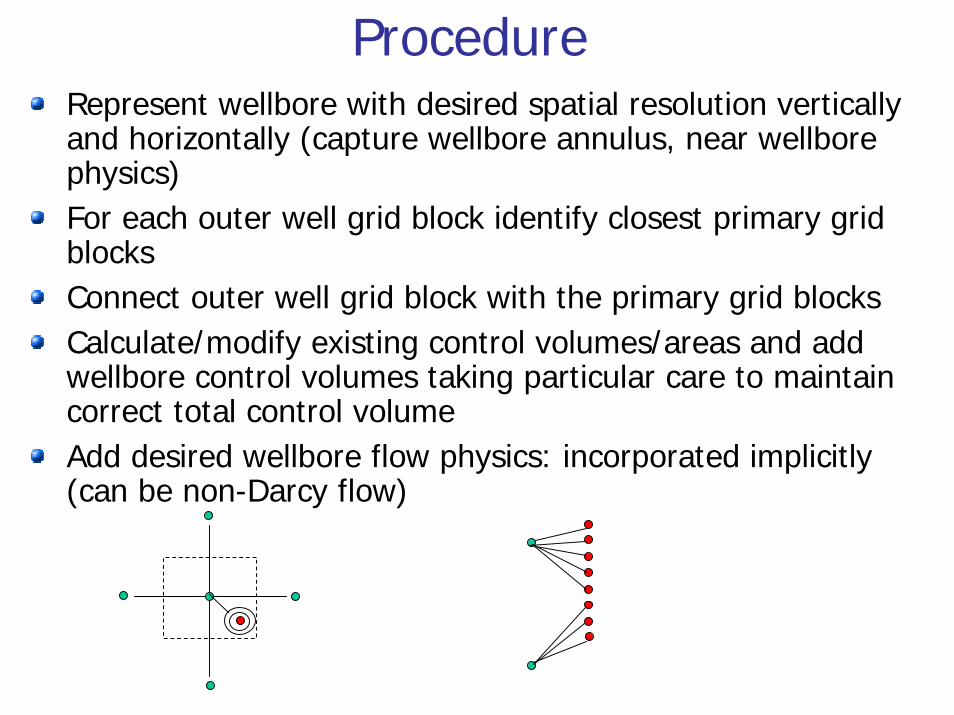
ProcedureRepresent wellbore with desired spatial resolution vertically and horizontally (capture wellbore annulus, near wellbore physics)For each outer well grid block identify closest primary grid blocksConnect outer well grid block with the primary grid blocksCalculate/modify existing control volumes/areas and add wellbore control volumes taking particular care to maintain correct total control volumeAdd desired wellbore flow physics: incorporated implicitly (can be non-Darcy flow)

ConclusionsGoal: wellbore behavior analyzed within system-level frameworkOil and gas field records offer provide a potential statistical basis for performance measuresField observations provide mechanisms and dataExperimental work provides rates Integrated numerical methods provide benchmarksAnalytical/semi-analytical methods provide methods for rapid calculation sampling parameter and well location distributions
Funding Acknowledgements: DOE’s National Energy and Technology Laboratory, the Los Alamos LDRD program and the Zero Emission Research & Technology project
Colleague at LANL: Peter Lichtner, George Guthrie, Phil Stauffer, George Zyvoloski and Marcus Wigand
Colleagues at Kinder Morgan CO2: Scott Wehner and Mike Raines