multi-objective optimization of diesel engine … multi-objective optimization of diesel engine...
TRANSCRIPT
02FFL-183
Multi-Objective Optimization of Diesel Engine Emissions andFuel Economy using Genetic Algorithms and
Phenomenological ModelT. Hiroyasu, M. Miki, J. Kamiura, S. Watanabe
Doshisha University
H. HiroyasuKinki University
Copyright c© 2002 Society of Automotive Engineers, Inc.
ABSTRACT
In this paper, the simulation of the multi-objective opti-mization problem of a diesel engine is performed using thephenomenological model of a diesel engine and the ge-netic algorithm. The target purpose functions are Specificfuel consumption, NOx, and Soot. The design variableis a shape of injection rate. In this research, we empha-size the following three topics by applying the optimiza-tion techniques to an emission problem of a diesel engine.Firstly, the multiple injections control the objectives. Sec-ondly, the multi-objective optimization is very useful in anemission problem. Finally, the phenomenological modelhas a great advantage for optimization. The developedsystem is illustrated with the simulation examples.
INTRODUCTION
Because of the merit of the durability and fuel efficiency,a diesel engine is loaded on from small to large vehi-cles. However, with increasing environmental concernsand legislated emissions standards, current engine re-search is focused on simultaneous reduction Soot andNOx during maintaining reasonable fuel economy. Thecombustion improvement especially can be achieved de-signing a good injection system and characteristics ofspray combustion.
To develop a good injection system, a parameter search todetermine the influence an organization performance andan exhaust performance should be performed. However,when this parameter search is executed experimentally,the huge expense and huge time are needed. For thisreason, the optimization of parameters by simulation on acomputer is very useful.
When the parameter is optimized by the simulation, the
minimization of the fuel efficiency, the amounts of the ni-tric oxide (NOx), and the amounts of the soot have beeninterested in many engine designer[1, 2, 3]. Therefore,these NOx, Soot and fuel efficient become objective func-tions in optimization problems. There are some studiesthat solve this optimization problem[4, 5, 6, 7]. However,these problems are treated as single objective problems.
Since there are trade-off relationships between the fuel ef-ficiency, NOx and Soot, it is natural to handle these prob-lems as Multi-objective Optimization Problems (MOPs).In this research, the minimization of fuel efficient, theamounts of NOx, and the amounts of Soot are simultane-ously performed by using the concept of multiple-purposeoptimization.
To perform optimization by simulations, an optimizer (itdetermines the next searching point) and an analyzer (itevaluates the searching point) are needed.
The process of the combustion of the diesel engine is verycomplicated. At the same time, there are many require-ment items for the models such as injection character-istics, spray characteristics, air-fuel mixing, ignition, heatrelease rate, heat losses, exhaust emissions, and so on.Thus, it is almost impossible to build the model of dieselcombustion with the numerical expressions. On the otherhand, several types of the models of diesel combustionhave been proposed[8]. Those are roughly divided intothree categories; thermodynamic model, phenomenologi-cal model and detailed multidimensional model. The ther-modynamic model only predicts the heat release rate.In the phenomenological model, the prediction of equa-tion which is derived by the fundamental experiment isused. The detailed multidimensional model predicts sev-eral items by solving differential equations with small timesteps. In this paper, the HIDECS which is based on thephenomenological model is used since it does not need a
1
high calculation cost.
Many researchers are studying and developing severaltypes of the optimization methods. Many algorithms thatuse the information about the gradient of the functionsare developed and implemented into several commercialsoftware[9, 10]. In this paper, the Genetic Algorithm (GA)is used for solving MOPs. The GA is an algorithm thatsimulates the heredity and evolution of creatures[11]. It isone of the multi-point search methods and probabilistic al-gorithm. It is said that it is easy to apply the GAs to severaltypes of problems. It is also said that the GA is a robust al-gorithm for searching for an optimum solution even whenthe objective function has many local optimums. The GAespecially is suitable for solving MOPs since the GA is amulti-point search.
In this paper, the simulation of a multi-objective optimiza-tion problem of a diesel engine is performed using thephenomenological model of a diesel engine and geneticalgorithm. At first, the concept of multi-objective opti-mization problems is explained. Secondly, the GA andphenomenological model of diesel engine are illustratedbriefly. In this paper, the extended GA that is developed byauthors is applied. That is called the ”Neighborhood Cul-tivation GA (NCGA)”. The procedure of the NCGA is alsomentioned. In the simulation, the target purpose functionsare SFC, NOx, and Soot and the design variables are theshape of injection rate. Through this simulation, the effec-tiveness of the GAs for solving the diesel engine problemand the importance of phenomenological model in opti-mization problems are made clarified.
MULTI-OBJECTIVE OPTIMIZATION PROBLEMS
Problems to find design variables �x that minimize ormaximize k objective functions within the m constraintsare called Multi-objective Optimization Problems (MOPs).MOPs can be formulated as follows[26, 27],
min �f(�x) = (f1(�x), f2(�x), . . . , fk(�x))T
s.t. �x ∈ X = {�x ∈ Rn
| gj(�x) ≤ 0 (j = 1, . . . , m)(1)
Objective functions and constraints are consisted of de-sign variables as follows,
{fi(�x) = fi(x1, x2, . . . , xn), i = 1, . . . , kgj(�x) = gj(x1, x2, . . . , xn), j = 1, . . . , m
(2)
When the objective functions are in the trade-off relation-ship, it is difficult to minimize or maximize all objectivefunctions at the same time. Therefore, the concept ofthe Pareto optimum Solution should be introduced in thiscase. {bf Difinition (Dominant): �x1, �x2 ∈ Rn.
When fi(�x1) ≤ fi(�x2) (∀i = 1, . . . , k) and fi(�x1) <fi(�x2) (∃i = 1, . . . , k), �x1 dominates �x2.
When �x1 dominates �x2, �x1 is the better solution than �x2.Therefore, it is a good way to select non-dominant solu-tions.
Definition (Pareto optimum solutions): �x0 ∈ Rn.
a) There is no solution �x ∈ Rn that dominates �x0, �x0 isa (strong) Pareto optimum solution.
b) There is no solution �x∗ ∈ Rn that satisfies fi(�x∗) <fi(�x0)(∀i = 1, . . . , k), �x0 is a week Pareto optimumsolution.
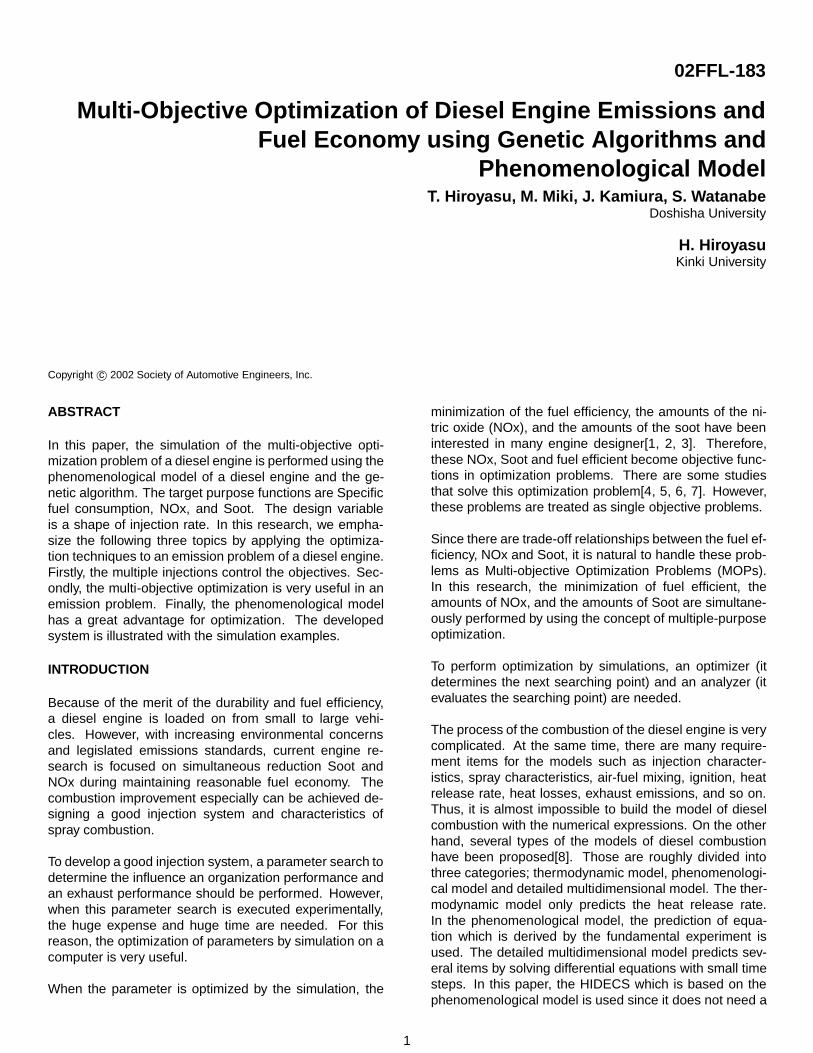
Usually, there is not only one Pareto optimum solution butplural solutions in MOPs. In Figure1, the concept of thePareto optimum solutions are illustrated in the case of twoobjectives.
minimize
1(x)f
2(x)
f
Pareto optimum solution
non Pareto optimum solution
Figure 1: The Pareto optimum solutions
In this figure, the line of the Pareto optimum solution iscalled a Pareto front. In MOPs, to find Pareto optimumsolutions is one of the goals.
GENETIC ALGORITHMS FOR MOPS
The Genetic Algorithm is an algorithm that simulates crea-tures’ heredity and evolution[11]. Since the GA is one ofthe multi point search methods, an optimum solution canbe determined even when the landscape of the objectivefunction is multi modal. Moreover, the GA can be appliedto problems whose search space is discrete. Therefore,the GA is one of very powerful optimization tools and isvery easy to use. In multi-objective optimization, GA canfind a Pareto optimum set with one trial because the GAis a multi point search. As a result, the GA is a very ef-fective tool especially in multi-objective optimization prob-lems. Thus, there are many researchers who are workingon the multi-objective GA and there are many algorithmsof the multi-objective GA[12, 13]. These algorithms of themulti-objective GA are roughly divided into two categories;those are the algorithms that treat the Pareto optimum so-lution implicitly or explicitly. The most of the latest meth-ods treat the Pareto optimum solution explicitly. Typical
2
algorithms are SPEA2[14] and NSGA-II[15].
In the GAs, a searching point is called an individual.Usually, an individual is express as a bit string. Thereare many ways to convert design variables to bit strings.When the design variables are real numbers, the easiestway is to code the real number into the binary number.The following steps are the basic procedure of the GAsfor MOPs.
Step 1: It supposes there are m individuals. This meansthere are m search points. These individuals are initial-ized. Since each individual is shown as a bit string, eachbit is determined using the random number.
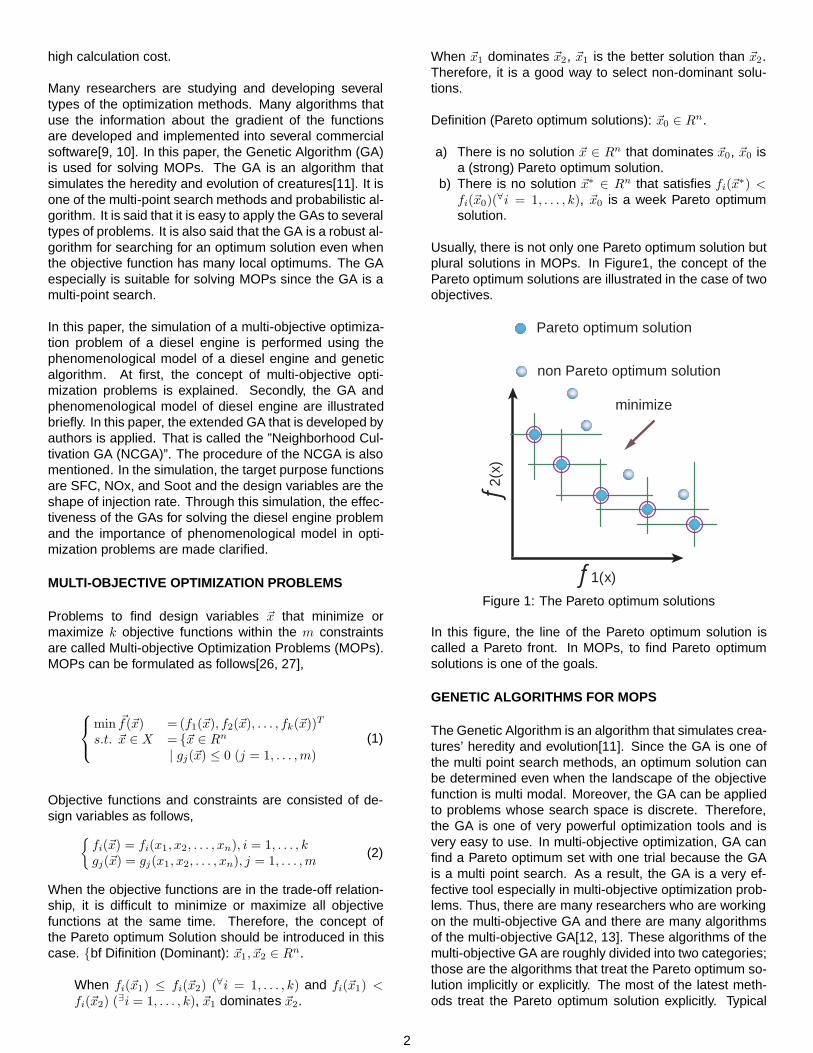
Step 2: Each individual has fitness value. In this step, thefitness value of each individual is determined. This oper-ation is called ”Evaluation”. In MOPs, the Pareto rankingis often used for determining the fitness value[28]. ThePareto ranking is determined in the following procedure.For each solution, the number of the solution that aredominant to the focused solution is counted. The Paretoranking is this number + 1. When the solution is non-dominant, the Pareto ranking becomes 1. The concept ofthe Pareto ranking is shown in 2. In this figure R denotesthe Pareto ranking. The fitness value of each individual isa reciprocal number of the Pareto ranking.
f1
f2
Real Pareto Front
R=1
R=1
R=1
R=2
R=3
R=4
Figure 2: Pareto Ranking
Step 3: After the evaluation, with according to the fitnessvalue, an individual is checked to remain for the next it-eration. This checking is performed probabilistically. Theindividual whose evaluation value is big has a high pos-sibility of remaining in the next iteration. There is a casewhere the individual who has high evaluation value mayincrease. On the other hand, the individual whose evalua-tion value is small may be disappeared. This operation iscalled ”Selection”. Usually, the roulette selection methodis performed.
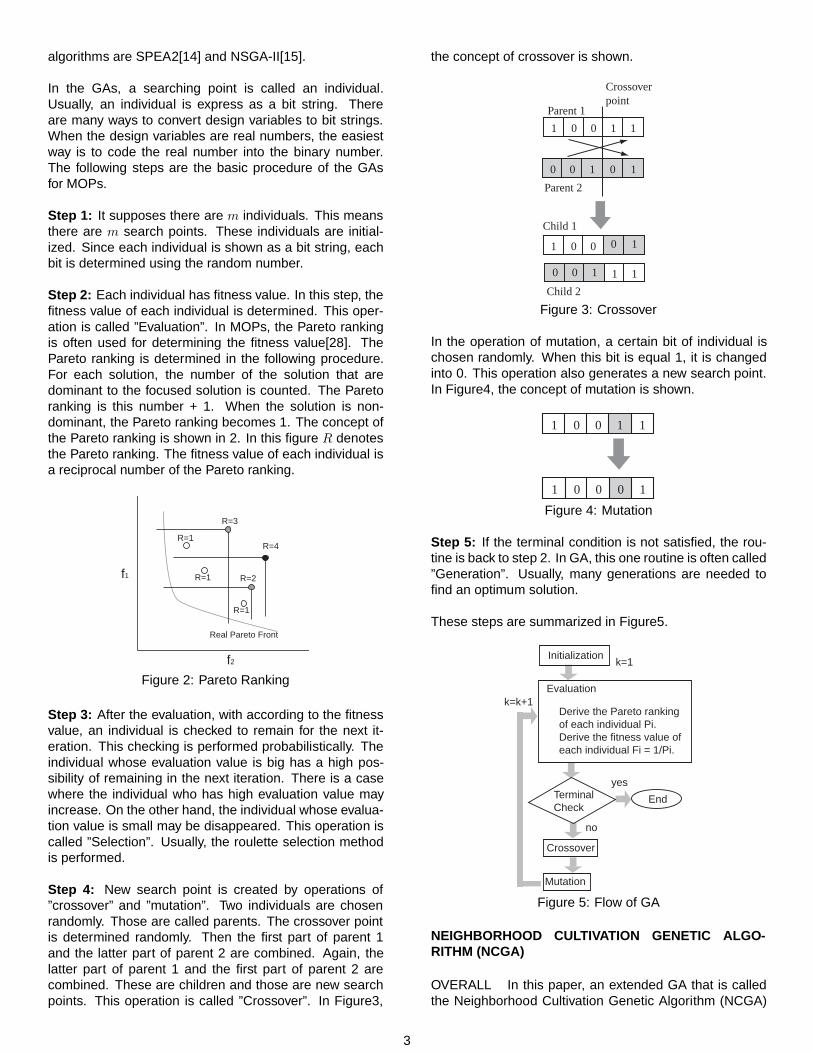
Step 4: New search point is created by operations of”crossover” and ”mutation”. Two individuals are chosenrandomly. Those are called parents. The crossover pointis determined randomly. Then the first part of parent 1and the latter part of parent 2 are combined. Again, thelatter part of parent 1 and the first part of parent 2 arecombined. These are children and those are new searchpoints. This operation is called ”Crossover”. In Figure3,
the concept of crossover is shown.
1 0 0 1 1
0 10 0 1
Parent 1
Parent 2
Crossover point
1 0 0 0 1
1 10 0 1
Child 1
Child 2Figure 3: Crossover
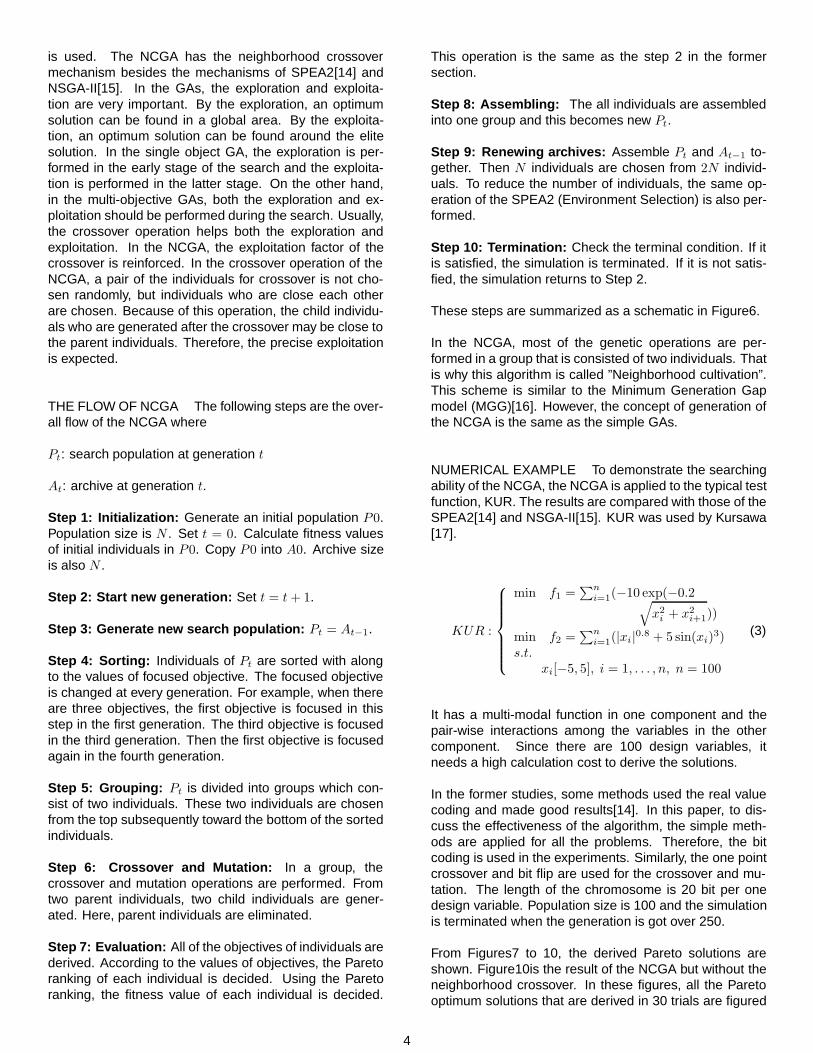
In the operation of mutation, a certain bit of individual ischosen randomly. When this bit is equal 1, it is changedinto 0. This operation also generates a new search point.In Figure4, the concept of mutation is shown.
1 0 0 11
01 0 0 1
Figure 4: Mutation
Step 5: If the terminal condition is not satisfied, the rou-tine is back to step 2. In GA, this one routine is often called”Generation”. Usually, many generations are needed tofind an optimum solution.
These steps are summarized in Figure5.
Initialization
Evaluation
Derive the Pareto ranking of each individual Pi.Derive the fitness value of each individual Fi = 1/Pi.
Terminal Check
End
Crossover
Mutation
yes
no
k=1
k=k+1
Figure 5: Flow of GA
NEIGHBORHOOD CULTIVATION GENETIC ALGO-RITHM (NCGA)
OVERALL In this paper, an extended GA that is calledthe Neighborhood Cultivation Genetic Algorithm (NCGA)
3
is used. The NCGA has the neighborhood crossovermechanism besides the mechanisms of SPEA2[14] andNSGA-II[15]. In the GAs, the exploration and exploita-tion are very important. By the exploration, an optimumsolution can be found in a global area. By the exploita-tion, an optimum solution can be found around the elitesolution. In the single object GA, the exploration is per-formed in the early stage of the search and the exploita-tion is performed in the latter stage. On the other hand,in the multi-objective GAs, both the exploration and ex-ploitation should be performed during the search. Usually,the crossover operation helps both the exploration andexploitation. In the NCGA, the exploitation factor of thecrossover is reinforced. In the crossover operation of theNCGA, a pair of the individuals for crossover is not cho-sen randomly, but individuals who are close each otherare chosen. Because of this operation, the child individu-als who are generated after the crossover may be close tothe parent individuals. Therefore, the precise exploitationis expected.
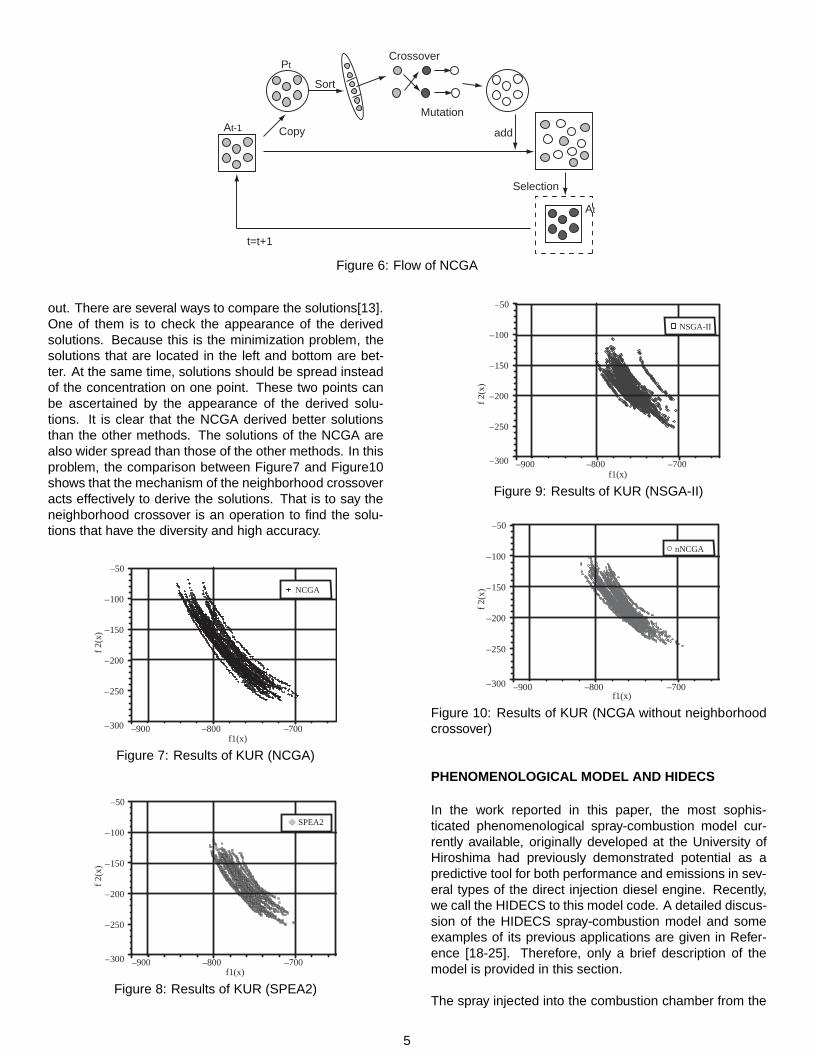
THE FLOW OF NCGA The following steps are the over-all flow of the NCGA where
Pt: search population at generation t
At: archive at generation t.
Step 1: Initialization: Generate an initial population P0.Population size is N . Set t = 0. Calculate fitness valuesof initial individuals in P0. Copy P0 into A0. Archive sizeis also N .
Step 2: Start new generation: Set t = t + 1.
Step 3: Generate new search population: Pt = At−1.
Step 4: Sorting: Individuals of Pt are sorted with alongto the values of focused objective. The focused objectiveis changed at every generation. For example, when thereare three objectives, the first objective is focused in thisstep in the first generation. The third objective is focusedin the third generation. Then the first objective is focusedagain in the fourth generation.
Step 5: Grouping: Pt is divided into groups which con-sist of two individuals. These two individuals are chosenfrom the top subsequently toward the bottom of the sortedindividuals.
Step 6: Crossover and Mutation: In a group, thecrossover and mutation operations are performed. Fromtwo parent individuals, two child individuals are gener-ated. Here, parent individuals are eliminated.
Step 7: Evaluation: All of the objectives of individuals arederived. According to the values of objectives, the Paretoranking of each individual is decided. Using the Paretoranking, the fitness value of each individual is decided.
This operation is the same as the step 2 in the formersection.
Step 8: Assembling: The all individuals are assembledinto one group and this becomes new Pt.
Step 9: Renewing archives: Assemble Pt and At−1 to-gether. Then N individuals are chosen from 2N individ-uals. To reduce the number of individuals, the same op-eration of the SPEA2 (Environment Selection) is also per-formed.
Step 10: Termination: Check the terminal condition. If itis satisfied, the simulation is terminated. If it is not satis-fied, the simulation returns to Step 2.
These steps are summarized as a schematic in Figure6.
In the NCGA, most of the genetic operations are per-formed in a group that is consisted of two individuals. Thatis why this algorithm is called ”Neighborhood cultivation”.This scheme is similar to the Minimum Generation Gapmodel (MGG)[16]. However, the concept of generation ofthe NCGA is the same as the simple GAs.
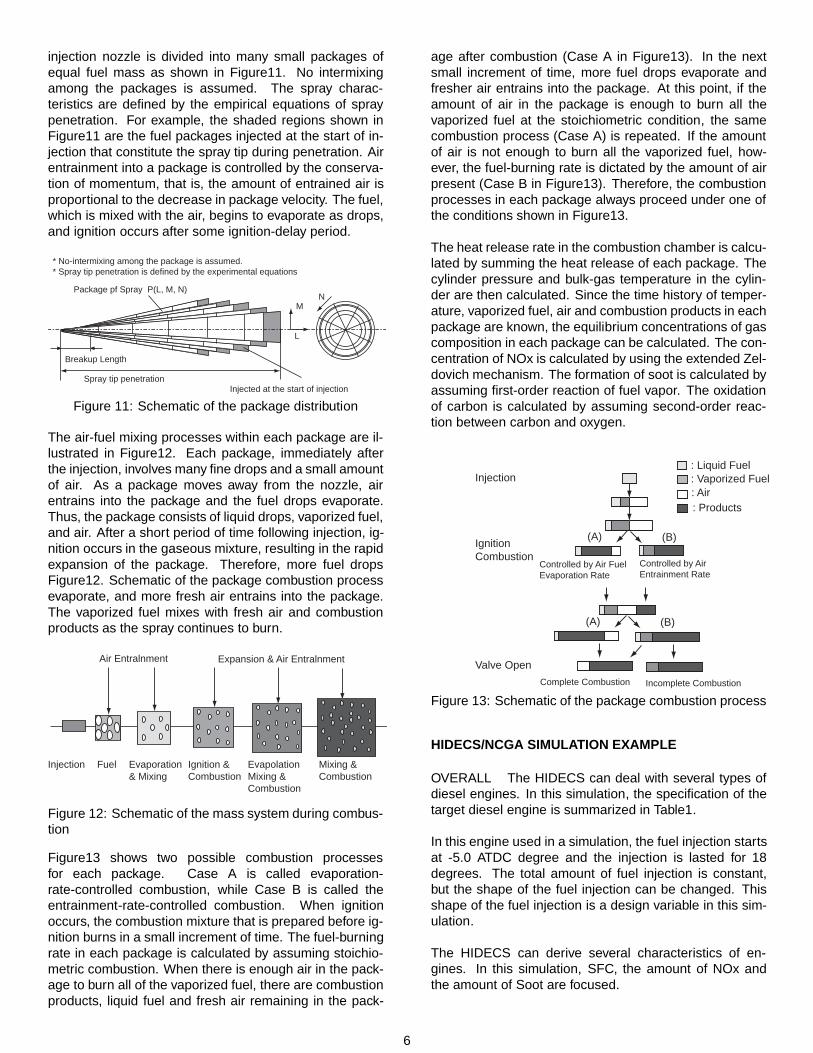
NUMERICAL EXAMPLE To demonstrate the searchingability of the NCGA, the NCGA is applied to the typical testfunction, KUR. The results are compared with those of theSPEA2[14] and NSGA-II[15]. KUR was used by Kursawa[17].
KUR :
min f1 =∑n
i=1(−10 exp(−0.2√x2
i + x2i+1))
min f2 =∑n
i=1(|xi|0.8 + 5 sin(xi)3)s.t.
xi[−5, 5], i = 1, . . . , n, n = 100
(3)
It has a multi-modal function in one component and thepair-wise interactions among the variables in the othercomponent. Since there are 100 design variables, itneeds a high calculation cost to derive the solutions.
In the former studies, some methods used the real valuecoding and made good results[14]. In this paper, to dis-cuss the effectiveness of the algorithm, the simple meth-ods are applied for all the problems. Therefore, the bitcoding is used in the experiments. Similarly, the one pointcrossover and bit flip are used for the crossover and mu-tation. The length of the chromosome is 20 bit per onedesign variable. Population size is 100 and the simulationis terminated when the generation is got over 250.
From Figures7 to 10, the derived Pareto solutions areshown. Figure10is the result of the NCGA but without theneighborhood crossover. In these figures, all the Paretooptimum solutions that are derived in 30 trials are figured
4
At-1
Pt
At
Copy
Sort
Crossover
Mutation
add
Selection
t=t+1
Figure 6: Flow of NCGA
out. There are several ways to compare the solutions[13].One of them is to check the appearance of the derivedsolutions. Because this is the minimization problem, thesolutions that are located in the left and bottom are bet-ter. At the same time, solutions should be spread insteadof the concentration on one point. These two points canbe ascertained by the appearance of the derived solu-tions. It is clear that the NCGA derived better solutionsthan the other methods. The solutions of the NCGA arealso wider spread than those of the other methods. In thisproblem, the comparison between Figure7 and Figure10shows that the mechanism of the neighborhood crossoveracts effectively to derive the solutions. That is to say theneighborhood crossover is an operation to find the solu-tions that have the diversity and high accuracy.
–300
–250
–200
–150
–100
–50
–900 –800 –700
NCGA
f1(x)
f 2(x
)
Figure 7: Results of KUR (NCGA)
–300
–250
–200
–150
–100
–50
–900 –800 –700
SPEA2
f1(x)
f 2(x
)
Figure 8: Results of KUR (SPEA2)
300
–250
–200
–150
–100
–50
–900 –800 –700–
NSGA-II
f1(x)f 2
(x)
Figure 9: Results of KUR (NSGA-II)
–300
–250
–200
–150
–100
–50
–900 –800 –700
nNCGA
f1(x)
f 2(x
)
Figure 10: Results of KUR (NCGA without neighborhoodcrossover)
PHENOMENOLOGICAL MODEL AND HIDECS
In the work reported in this paper, the most sophis-ticated phenomenological spray-combustion model cur-rently available, originally developed at the University ofHiroshima had previously demonstrated potential as apredictive tool for both performance and emissions in sev-eral types of the direct injection diesel engine. Recently,we call the HIDECS to this model code. A detailed discus-sion of the HIDECS spray-combustion model and someexamples of its previous applications are given in Refer-ence [18-25]. Therefore, only a brief description of themodel is provided in this section.
The spray injected into the combustion chamber from the
5
injection nozzle is divided into many small packages ofequal fuel mass as shown in Figure11. No intermixingamong the packages is assumed. The spray charac-teristics are defined by the empirical equations of spraypenetration. For example, the shaded regions shown inFigure11 are the fuel packages injected at the start of in-jection that constitute the spray tip during penetration. Airentrainment into a package is controlled by the conserva-tion of momentum, that is, the amount of entrained air isproportional to the decrease in package velocity. The fuel,which is mixed with the air, begins to evaporate as drops,and ignition occurs after some ignition-delay period.
Breakup Length
Spray tip penetration
Package pf Spray P(L, M, N)
M
L
N
Injected at the start of injection
* No-intermixing among the package is assumed.* Spray tip penetration is defined by the experimental equations
Figure 11: Schematic of the package distribution
The air-fuel mixing processes within each package are il-lustrated in Figure12. Each package, immediately afterthe injection, involves many fine drops and a small amountof air. As a package moves away from the nozzle, airentrains into the package and the fuel drops evaporate.Thus, the package consists of liquid drops, vaporized fuel,and air. After a short period of time following injection, ig-nition occurs in the gaseous mixture, resulting in the rapidexpansion of the package. Therefore, more fuel dropsFigure12. Schematic of the package combustion processevaporate, and more fresh air entrains into the package.The vaporized fuel mixes with fresh air and combustionproducts as the spray continues to burn.
Air Entralnment Expansion & Air Entralnment
Injection Evaporation & Mixing
Fuel Ignition & Combustion
Evapolation Mixing & Combustion
Mixing & Combustion
Figure 12: Schematic of the mass system during combus-tion
Figure13 shows two possible combustion processesfor each package. Case A is called evaporation-rate-controlled combustion, while Case B is called theentrainment-rate-controlled combustion. When ignitionoccurs, the combustion mixture that is prepared before ig-nition burns in a small increment of time. The fuel-burningrate in each package is calculated by assuming stoichio-metric combustion. When there is enough air in the pack-age to burn all of the vaporized fuel, there are combustionproducts, liquid fuel and fresh air remaining in the pack-
age after combustion (Case A in Figure13). In the nextsmall increment of time, more fuel drops evaporate andfresher air entrains into the package. At this point, if theamount of air in the package is enough to burn all thevaporized fuel at the stoichiometric condition, the samecombustion process (Case A) is repeated. If the amountof air is not enough to burn all the vaporized fuel, how-ever, the fuel-burning rate is dictated by the amount of airpresent (Case B in Figure13). Therefore, the combustionprocesses in each package always proceed under one ofthe conditions shown in Figure13.
The heat release rate in the combustion chamber is calcu-lated by summing the heat release of each package. Thecylinder pressure and bulk-gas temperature in the cylin-der are then calculated. Since the time history of temper-ature, vaporized fuel, air and combustion products in eachpackage are known, the equilibrium concentrations of gascomposition in each package can be calculated. The con-centration of NOx is calculated by using the extended Zel-dovich mechanism. The formation of soot is calculated byassuming first-order reaction of fuel vapor. The oxidationof carbon is calculated by assuming second-order reac-tion between carbon and oxygen.
: Liquid Fuel: Vaporized Fuel: Air: Products
(A) (B)
Controlled by Air Entrainment Rate
Controlled by Air Fuel Evaporation Rate
(A) (B)
Injection
Ignition Combustion
Valve OpenComplete Combustion Incomplete Combustion
Figure 13: Schematic of the package combustion process
HIDECS/NCGA SIMULATION EXAMPLE
OVERALL The HIDECS can deal with several types ofdiesel engines. In this simulation, the specification of thetarget diesel engine is summarized in Table1.
In this engine used in a simulation, the fuel injection startsat -5.0 ATDC degree and the injection is lasted for 18degrees. The total amount of fuel injection is constant,but the shape of the fuel injection can be changed. Thisshape of the fuel injection is a design variable in this sim-ulation.
The HIDECS can derive several characteristics of en-gines. In this simulation, SFC, the amount of NOx andthe amount of Soot are focused.
6
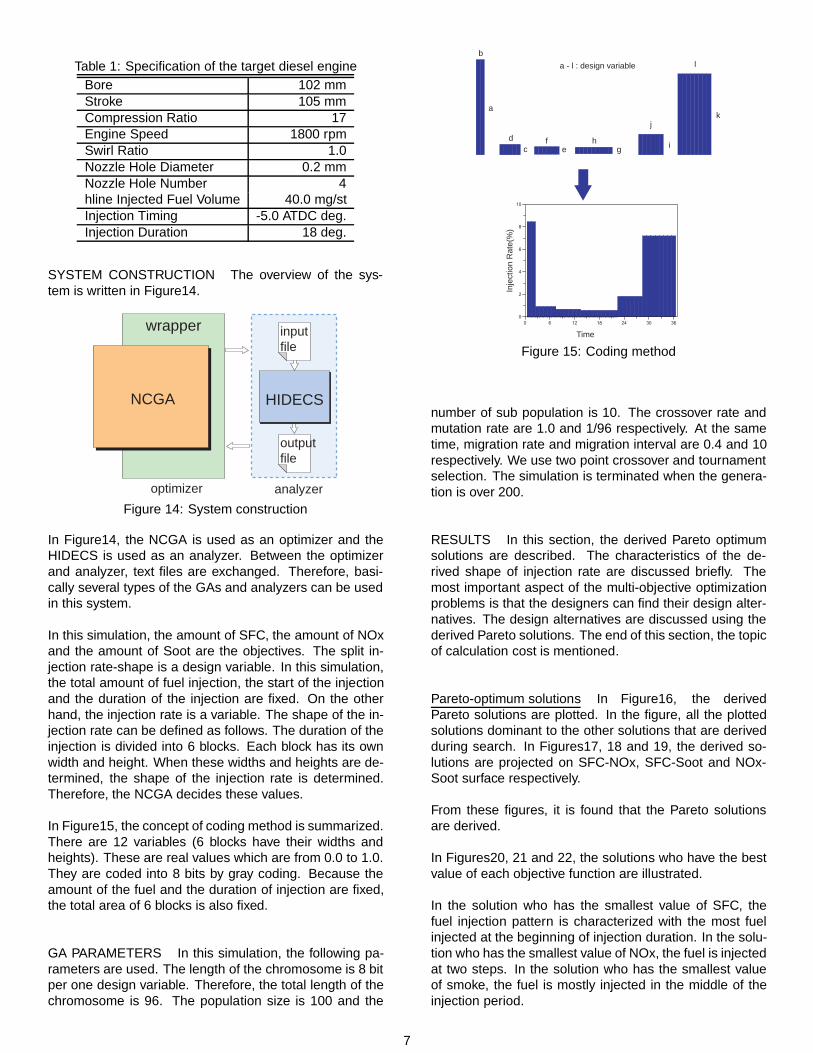
Table 1: Specification of the target diesel engineBore 102 mmStroke 105 mmCompression Ratio 17Engine Speed 1800 rpmSwirl Ratio 1.0Nozzle Hole Diameter 0.2 mmNozzle Hole Number 4hline Injected Fuel Volume 40.0 mg/stInjection Timing -5.0 ATDC deg.Injection Duration 18 deg.
SYSTEM CONSTRUCTION The overview of the sys-tem is written in Figure14.
NCGA
wrapper
HIDECS
inputfile
outputfile
optimizer analyzerFigure 14: System construction
In Figure14, the NCGA is used as an optimizer and theHIDECS is used as an analyzer. Between the optimizerand analyzer, text files are exchanged. Therefore, basi-cally several types of the GAs and analyzers can be usedin this system.
In this simulation, the amount of SFC, the amount of NOxand the amount of Soot are the objectives. The split in-jection rate-shape is a design variable. In this simulation,the total amount of fuel injection, the start of the injectionand the duration of the injection are fixed. On the otherhand, the injection rate is a variable. The shape of the in-jection rate can be defined as follows. The duration of theinjection is divided into 6 blocks. Each block has its ownwidth and height. When these widths and heights are de-termined, the shape of the injection rate is determined.Therefore, the NCGA decides these values.
In Figure15, the concept of coding method is summarized.There are 12 variables (6 blocks have their widths andheights). These are real values which are from 0.0 to 1.0.They are coded into 8 bits by gray coding. Because theamount of the fuel and the duration of injection are fixed,the total area of 6 blocks is also fixed.
GA PARAMETERS In this simulation, the following pa-rameters are used. The length of the chromosome is 8 bitper one design variable. Therefore, the total length of thechromosome is 96. The population size is 100 and the
a
b
cd
ef
gh i
jk
la - l : design variable
Time
Inje
ctio
n R
ate(
%)
Figure 15: Coding method
number of sub population is 10. The crossover rate andmutation rate are 1.0 and 1/96 respectively. At the sametime, migration rate and migration interval are 0.4 and 10respectively. We use two point crossover and tournamentselection. The simulation is terminated when the genera-tion is over 200.
RESULTS In this section, the derived Pareto optimumsolutions are described. The characteristics of the de-rived shape of injection rate are discussed briefly. Themost important aspect of the multi-objective optimizationproblems is that the designers can find their design alter-natives. The design alternatives are discussed using thederived Pareto solutions. The end of this section, the topicof calculation cost is mentioned.
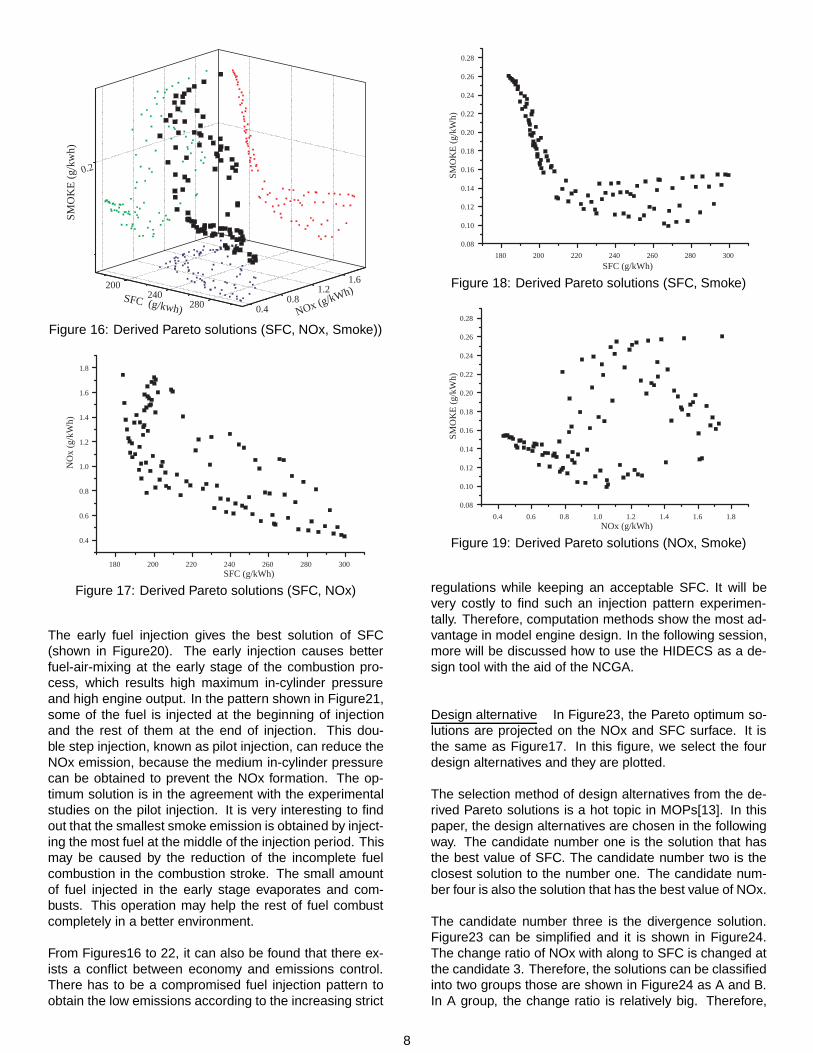
Pareto-optimum solutions In Figure16, the derivedPareto solutions are plotted. In the figure, all the plottedsolutions dominant to the other solutions that are derivedduring search. In Figures17, 18 and 19, the derived so-lutions are projected on SFC-NOx, SFC-Soot and NOx-Soot surface respectively.
From these figures, it is found that the Pareto solutionsare derived.
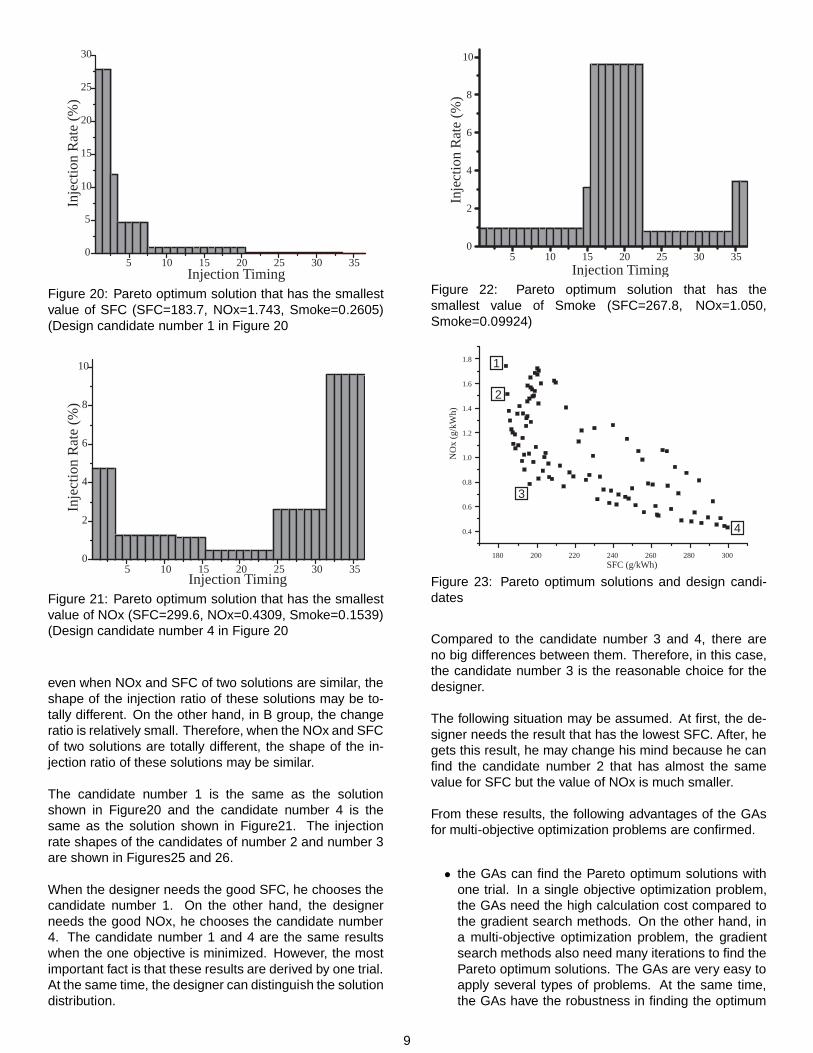
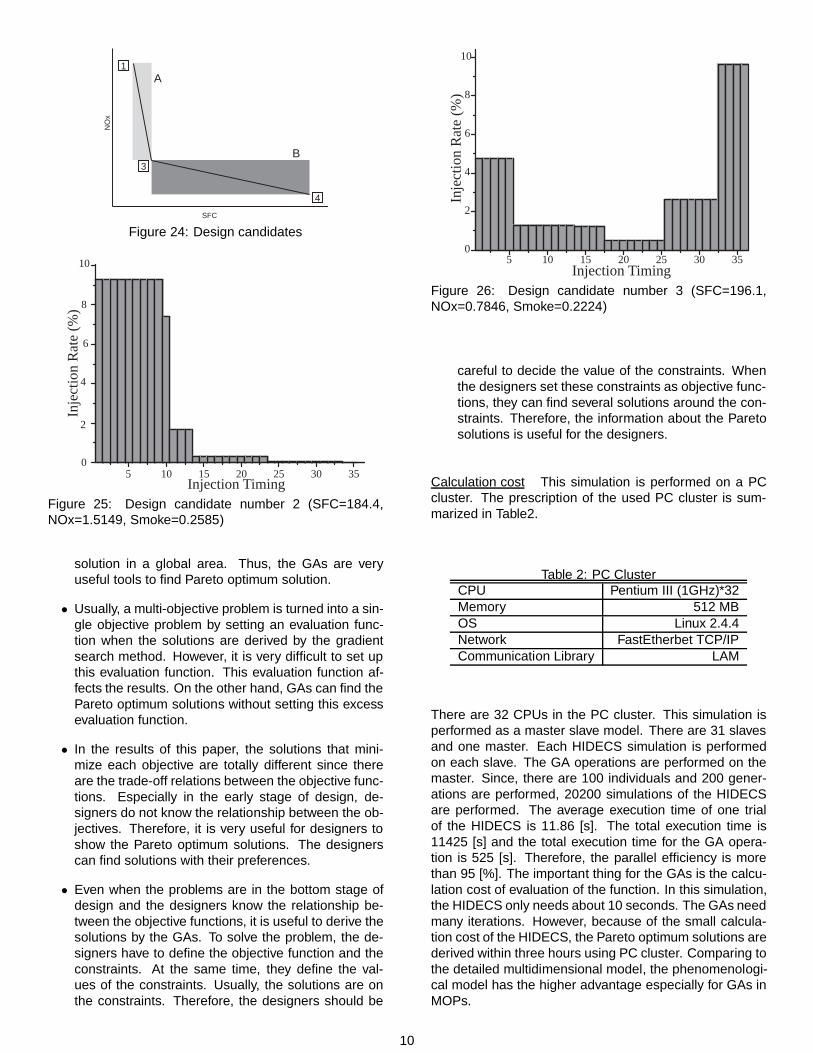
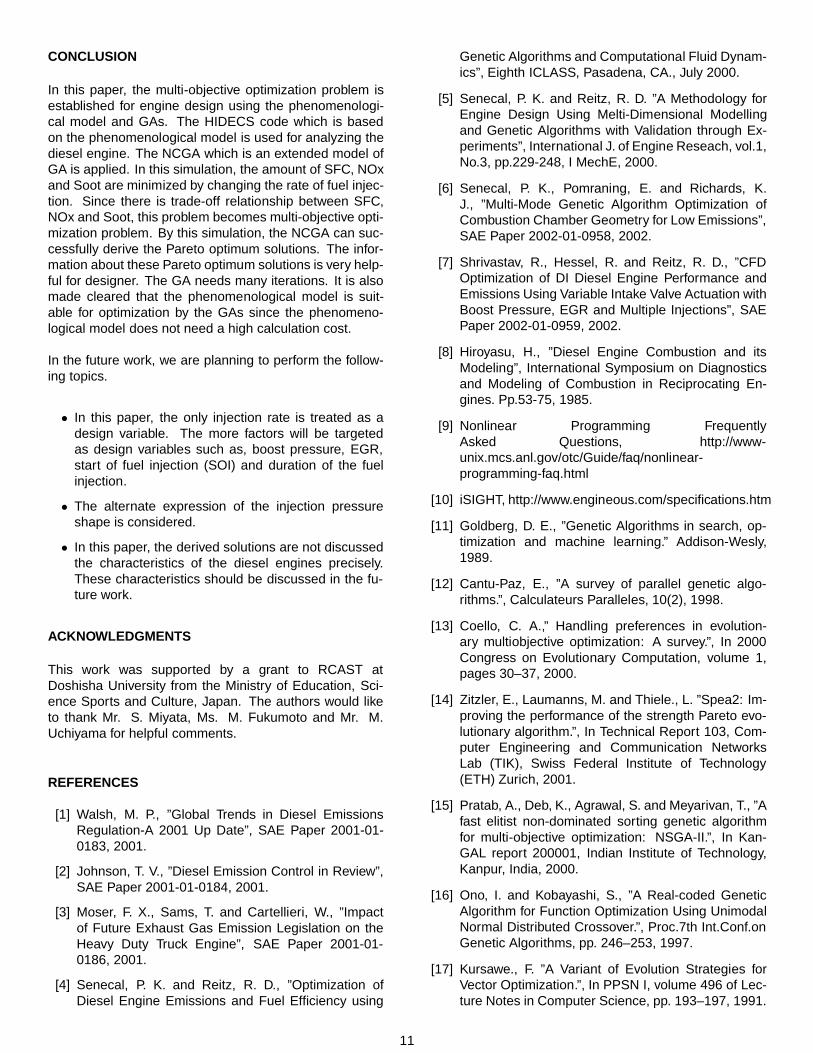
In Figures20, 21 and 22, the solutions who have the bestvalue of each objective function are illustrated.
In the solution who has the smallest value of SFC, thefuel injection pattern is characterized with the most fuelinjected at the beginning of injection duration. In the solu-tion who has the smallest value of NOx, the fuel is injectedat two steps. In the solution who has the smallest valueof smoke, the fuel is mostly injected in the middle of theinjection period.
7
200240
280
0.2
0.40.8
1.21.6
NOx (g/kWh)
SMO
KE
(g/k
wh)
SFC (g/kwh)
Figure 16: Derived Pareto solutions (SFC, NOx, Smoke))
180 200 220 240 260 280 300
0.4
0.6
0.8
1.0
1.2
1.4
1.6
1.8
NO
x (g
/kW
h)
SFC (g/kWh)
Figure 17: Derived Pareto solutions (SFC, NOx)
The early fuel injection gives the best solution of SFC(shown in Figure20). The early injection causes betterfuel-air-mixing at the early stage of the combustion pro-cess, which results high maximum in-cylinder pressureand high engine output. In the pattern shown in Figure21,some of the fuel is injected at the beginning of injectionand the rest of them at the end of injection. This dou-ble step injection, known as pilot injection, can reduce theNOx emission, because the medium in-cylinder pressurecan be obtained to prevent the NOx formation. The op-timum solution is in the agreement with the experimentalstudies on the pilot injection. It is very interesting to findout that the smallest smoke emission is obtained by inject-ing the most fuel at the middle of the injection period. Thismay be caused by the reduction of the incomplete fuelcombustion in the combustion stroke. The small amountof fuel injected in the early stage evaporates and com-busts. This operation may help the rest of fuel combustcompletely in a better environment.
From Figures16 to 22, it can also be found that there ex-ists a conflict between economy and emissions control.There has to be a compromised fuel injection pattern toobtain the low emissions according to the increasing strict
180 200 220 240 260 280 3000.08
0.10
0.12
0.14
0.16
0.18
0.20
0.22
0.24
0.26
0.28
SMO
KE
(g/k
Wh)
SFC (g/kWh)
Figure 18: Derived Pareto solutions (SFC, Smoke)
0.4 0.6 0.8 1.0 1.2 1.4 1.6 1.80.08
0.10
0.12
0.14
0.16
0.18
0.20
0.22
0.24
0.26
0.28
SMO
KE
(g/k
Wh)
NOx (g/kWh)
Figure 19: Derived Pareto solutions (NOx, Smoke)
regulations while keeping an acceptable SFC. It will bevery costly to find such an injection pattern experimen-tally. Therefore, computation methods show the most ad-vantage in model engine design. In the following session,more will be discussed how to use the HIDECS as a de-sign tool with the aid of the NCGA.
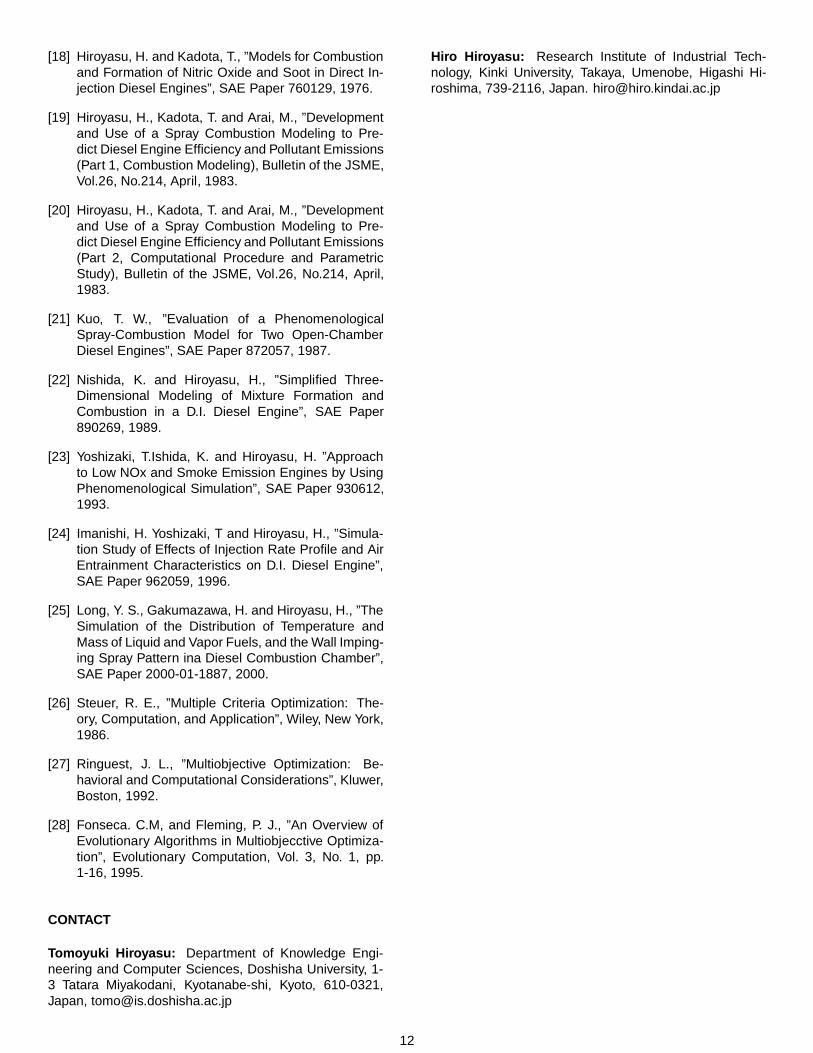
Design alternative In Figure23, the Pareto optimum so-lutions are projected on the NOx and SFC surface. It isthe same as Figure17. In this figure, we select the fourdesign alternatives and they are plotted.
The selection method of design alternatives from the de-rived Pareto solutions is a hot topic in MOPs[13]. In thispaper, the design alternatives are chosen in the followingway. The candidate number one is the solution that hasthe best value of SFC. The candidate number two is theclosest solution to the number one. The candidate num-ber four is also the solution that has the best value of NOx.
The candidate number three is the divergence solution.Figure23 can be simplified and it is shown in Figure24.The change ratio of NOx with along to SFC is changed atthe candidate 3. Therefore, the solutions can be classifiedinto two groups those are shown in Figure24 as A and B.In A group, the change ratio is relatively big. Therefore,
8
5 10 15 20 25 30 350
5
10
15
20
25
30
Inje
ctio
n R
ate
(%)
Injection TimingFigure 20: Pareto optimum solution that has the smallestvalue of SFC (SFC=183.7, NOx=1.743, Smoke=0.2605)(Design candidate number 1 in Figure 20
5 10 15 20 25 30 350
2
4
6
8
10
Inje
ctio
n R
ate
(%)
Injection TimingFigure 21: Pareto optimum solution that has the smallestvalue of NOx (SFC=299.6, NOx=0.4309, Smoke=0.1539)(Design candidate number 4 in Figure 20
even when NOx and SFC of two solutions are similar, theshape of the injection ratio of these solutions may be to-tally different. On the other hand, in B group, the changeratio is relatively small. Therefore, when the NOx and SFCof two solutions are totally different, the shape of the in-jection ratio of these solutions may be similar.
The candidate number 1 is the same as the solutionshown in Figure20 and the candidate number 4 is thesame as the solution shown in Figure21. The injectionrate shapes of the candidates of number 2 and number 3are shown in Figures25 and 26.
When the designer needs the good SFC, he chooses thecandidate number 1. On the other hand, the designerneeds the good NOx, he chooses the candidate number4. The candidate number 1 and 4 are the same resultswhen the one objective is minimized. However, the mostimportant fact is that these results are derived by one trial.At the same time, the designer can distinguish the solutiondistribution.
5 10 15 20 25 30 350
2
4
6
8
10
Inje
ctio
n R
ate
(%)
Injection TimingFigure 22: Pareto optimum solution that has thesmallest value of Smoke (SFC=267.8, NOx=1.050,Smoke=0.09924)
180 200 220 240 260 280 300
0.4
0.6
0.8
1.0
1.2
1.4
1.6
1.8
NO
x (g
/kW
h)
SFC (g/kWh)
1
2
3
4
Figure 23: Pareto optimum solutions and design candi-dates
Compared to the candidate number 3 and 4, there areno big differences between them. Therefore, in this case,the candidate number 3 is the reasonable choice for thedesigner.
The following situation may be assumed. At first, the de-signer needs the result that has the lowest SFC. After, hegets this result, he may change his mind because he canfind the candidate number 2 that has almost the samevalue for SFC but the value of NOx is much smaller.
From these results, the following advantages of the GAsfor multi-objective optimization problems are confirmed.
• the GAs can find the Pareto optimum solutions withone trial. In a single objective optimization problem,the GAs need the high calculation cost compared tothe gradient search methods. On the other hand, ina multi-objective optimization problem, the gradientsearch methods also need many iterations to find thePareto optimum solutions. The GAs are very easy toapply several types of problems. At the same time,the GAs have the robustness in finding the optimum
9
NO
x
SFC
1
3
4
A
B
Figure 24: Design candidates
Inje
ctio
n R
ate
(%)
Injection Timing0
2
4
6
8
10
5 10 15 20 25 30 35
Figure 25: Design candidate number 2 (SFC=184.4,NOx=1.5149, Smoke=0.2585)
solution in a global area. Thus, the GAs are veryuseful tools to find Pareto optimum solution.
• Usually, a multi-objective problem is turned into a sin-gle objective problem by setting an evaluation func-tion when the solutions are derived by the gradientsearch method. However, it is very difficult to set upthis evaluation function. This evaluation function af-fects the results. On the other hand, GAs can find thePareto optimum solutions without setting this excessevaluation function.
• In the results of this paper, the solutions that mini-mize each objective are totally different since thereare the trade-off relations between the objective func-tions. Especially in the early stage of design, de-signers do not know the relationship between the ob-jectives. Therefore, it is very useful for designers toshow the Pareto optimum solutions. The designerscan find solutions with their preferences.
• Even when the problems are in the bottom stage ofdesign and the designers know the relationship be-tween the objective functions, it is useful to derive thesolutions by the GAs. To solve the problem, the de-signers have to define the objective function and theconstraints. At the same time, they define the val-ues of the constraints. Usually, the solutions are onthe constraints. Therefore, the designers should be
5 10 15 20 25 30 350
2
4
6
8
10
Inje
ctio
n R
ate
(%)
Injection TimingFigure 26: Design candidate number 3 (SFC=196.1,NOx=0.7846, Smoke=0.2224)
careful to decide the value of the constraints. Whenthe designers set these constraints as objective func-tions, they can find several solutions around the con-straints. Therefore, the information about the Paretosolutions is useful for the designers.
Calculation cost This simulation is performed on a PCcluster. The prescription of the used PC cluster is sum-marized in Table2.
Table 2: PC ClusterCPU Pentium III (1GHz)*32Memory 512 MBOS Linux 2.4.4Network FastEtherbet TCP/IPCommunication Library LAM
There are 32 CPUs in the PC cluster. This simulation isperformed as a master slave model. There are 31 slavesand one master. Each HIDECS simulation is performedon each slave. The GA operations are performed on themaster. Since, there are 100 individuals and 200 gener-ations are performed, 20200 simulations of the HIDECSare performed. The average execution time of one trialof the HIDECS is 11.86 [s]. The total execution time is11425 [s] and the total execution time for the GA opera-tion is 525 [s]. Therefore, the parallel efficiency is morethan 95 [%]. The important thing for the GAs is the calcu-lation cost of evaluation of the function. In this simulation,the HIDECS only needs about 10 seconds. The GAs needmany iterations. However, because of the small calcula-tion cost of the HIDECS, the Pareto optimum solutions arederived within three hours using PC cluster. Comparing tothe detailed multidimensional model, the phenomenologi-cal model has the higher advantage especially for GAs inMOPs.
10
CONCLUSION
In this paper, the multi-objective optimization problem isestablished for engine design using the phenomenologi-cal model and GAs. The HIDECS code which is basedon the phenomenological model is used for analyzing thediesel engine. The NCGA which is an extended model ofGA is applied. In this simulation, the amount of SFC, NOxand Soot are minimized by changing the rate of fuel injec-tion. Since there is trade-off relationship between SFC,NOx and Soot, this problem becomes multi-objective opti-mization problem. By this simulation, the NCGA can suc-cessfully derive the Pareto optimum solutions. The infor-mation about these Pareto optimum solutions is very help-ful for designer. The GA needs many iterations. It is alsomade cleared that the phenomenological model is suit-able for optimization by the GAs since the phenomeno-logical model does not need a high calculation cost.
In the future work, we are planning to perform the follow-ing topics.
• In this paper, the only injection rate is treated as adesign variable. The more factors will be targetedas design variables such as, boost pressure, EGR,start of fuel injection (SOI) and duration of the fuelinjection.
• The alternate expression of the injection pressureshape is considered.
• In this paper, the derived solutions are not discussedthe characteristics of the diesel engines precisely.These characteristics should be discussed in the fu-ture work.
ACKNOWLEDGMENTS
This work was supported by a grant to RCAST atDoshisha University from the Ministry of Education, Sci-ence Sports and Culture, Japan. The authors would liketo thank Mr. S. Miyata, Ms. M. Fukumoto and Mr. M.Uchiyama for helpful comments.
REFERENCES
[1] Walsh, M. P., ”Global Trends in Diesel EmissionsRegulation-A 2001 Up Date”, SAE Paper 2001-01-0183, 2001.
[2] Johnson, T. V., ”Diesel Emission Control in Review”,SAE Paper 2001-01-0184, 2001.
[3] Moser, F. X., Sams, T. and Cartellieri, W., ”Impactof Future Exhaust Gas Emission Legislation on theHeavy Duty Truck Engine”, SAE Paper 2001-01-0186, 2001.
[4] Senecal, P. K. and Reitz, R. D., ”Optimization ofDiesel Engine Emissions and Fuel Efficiency using
Genetic Algorithms and Computational Fluid Dynam-ics”, Eighth ICLASS, Pasadena, CA., July 2000.
[5] Senecal, P. K. and Reitz, R. D. ”A Methodology forEngine Design Using Melti-Dimensional Modellingand Genetic Algorithms with Validation through Ex-periments”, International J. of Engine Reseach, vol.1,No.3, pp.229-248, I MechE, 2000.
[6] Senecal, P. K., Pomraning, E. and Richards, K.J., ”Multi-Mode Genetic Algorithm Optimization ofCombustion Chamber Geometry for Low Emissions”,SAE Paper 2002-01-0958, 2002.
[7] Shrivastav, R., Hessel, R. and Reitz, R. D., ”CFDOptimization of DI Diesel Engine Performance andEmissions Using Variable Intake Valve Actuation withBoost Pressure, EGR and Multiple Injections”, SAEPaper 2002-01-0959, 2002.
[8] Hiroyasu, H., ”Diesel Engine Combustion and itsModeling”, International Symposium on Diagnosticsand Modeling of Combustion in Reciprocating En-gines. Pp.53-75, 1985.
[9] Nonlinear Programming FrequentlyAsked Questions, http://www-unix.mcs.anl.gov/otc/Guide/faq/nonlinear-programming-faq.html
[10] iSIGHT, http://www.engineous.com/specifications.htm
[11] Goldberg, D. E., ”Genetic Algorithms in search, op-timization and machine learning.” Addison-Wesly,1989.
[12] Cantu-Paz, E., ”A survey of parallel genetic algo-rithms.”, Calculateurs Paralleles, 10(2), 1998.
[13] Coello, C. A.,” Handling preferences in evolution-ary multiobjective optimization: A survey.”, In 2000Congress on Evolutionary Computation, volume 1,pages 30–37, 2000.
[14] Zitzler, E., Laumanns, M. and Thiele., L. ”Spea2: Im-proving the performance of the strength Pareto evo-lutionary algorithm.”, In Technical Report 103, Com-puter Engineering and Communication NetworksLab (TIK), Swiss Federal Institute of Technology(ETH) Zurich, 2001.
[15] Pratab, A., Deb, K., Agrawal, S. and Meyarivan, T., ”Afast elitist non-dominated sorting genetic algorithmfor multi-objective optimization: NSGA-II.”, In Kan-GAL report 200001, Indian Institute of Technology,Kanpur, India, 2000.
[16] Ono, I. and Kobayashi, S., ”A Real-coded GeneticAlgorithm for Function Optimization Using UnimodalNormal Distributed Crossover.”, Proc.7th Int.Conf.onGenetic Algorithms, pp. 246–253, 1997.
[17] Kursawe., F. ”A Variant of Evolution Strategies forVector Optimization.”, In PPSN I, volume 496 of Lec-ture Notes in Computer Science, pp. 193–197, 1991.
11
[18] Hiroyasu, H. and Kadota, T., ”Models for Combustionand Formation of Nitric Oxide and Soot in Direct In-jection Diesel Engines”, SAE Paper 760129, 1976.
[19] Hiroyasu, H., Kadota, T. and Arai, M., ”Developmentand Use of a Spray Combustion Modeling to Pre-dict Diesel Engine Efficiency and Pollutant Emissions(Part 1, Combustion Modeling), Bulletin of the JSME,Vol.26, No.214, April, 1983.
[20] Hiroyasu, H., Kadota, T. and Arai, M., ”Developmentand Use of a Spray Combustion Modeling to Pre-dict Diesel Engine Efficiency and Pollutant Emissions(Part 2, Computational Procedure and ParametricStudy), Bulletin of the JSME, Vol.26, No.214, April,1983.
[21] Kuo, T. W., ”Evaluation of a PhenomenologicalSpray-Combustion Model for Two Open-ChamberDiesel Engines”, SAE Paper 872057, 1987.
[22] Nishida, K. and Hiroyasu, H., ”Simplified Three-Dimensional Modeling of Mixture Formation andCombustion in a D.I. Diesel Engine”, SAE Paper890269, 1989.
[23] Yoshizaki, T.Ishida, K. and Hiroyasu, H. ”Approachto Low NOx and Smoke Emission Engines by UsingPhenomenological Simulation”, SAE Paper 930612,1993.
[24] Imanishi, H. Yoshizaki, T and Hiroyasu, H., ”Simula-tion Study of Effects of Injection Rate Profile and AirEntrainment Characteristics on D.I. Diesel Engine”,SAE Paper 962059, 1996.
[25] Long, Y. S., Gakumazawa, H. and Hiroyasu, H., ”TheSimulation of the Distribution of Temperature andMass of Liquid and Vapor Fuels, and the Wall Imping-ing Spray Pattern ina Diesel Combustion Chamber”,SAE Paper 2000-01-1887, 2000.
[26] Steuer, R. E., ”Multiple Criteria Optimization: The-ory, Computation, and Application”, Wiley, New York,1986.
[27] Ringuest, J. L., ”Multiobjective Optimization: Be-havioral and Computational Considerations”, Kluwer,Boston, 1992.
[28] Fonseca. C.M, and Fleming, P. J., ”An Overview ofEvolutionary Algorithms in Multiobjecctive Optimiza-tion”, Evolutionary Computation, Vol. 3, No. 1, pp.1-16, 1995.
CONTACT
Tomoyuki Hiroyasu: Department of Knowledge Engi-neering and Computer Sciences, Doshisha University, 1-3 Tatara Miyakodani, Kyotanabe-shi, Kyoto, 610-0321,Japan, [email protected]
Hiro Hiroyasu: Research Institute of Industrial Tech-nology, Kinki University, Takaya, Umenobe, Higashi Hi-roshima, 739-2116, Japan. [email protected]
12