multi-criteria decision model inference and application in ... · my supervisor arthur meulstee...
TRANSCRIPT

Multi-criteria decision model inference and
application in information security risk
classification
Computational Economics
Erasmus School of Economics
Erasmus University Rotterdam
Master Thesis
Author:
Jeroen van der Meer
312413
Supervisors:
Tommi Tervonen (EUR)
Arthur Meulstee (Ernst & Young)
Yingqian Zhang (EUR)
August 14, 2012

1

Abstract
In this thesis a method for risk classification in the information security domain is described.
Using a set of classification examples, an ELECTRE TRI multi-criteria decision aid model
is constructed. This model is capable of classifying organizations in risk classes based on
company characteristics and results of technical assessment. The construction process of this
model consisted of gathering the classification examples, determining the criteria to measure
the performance of the organizations on, and solving a mixed integer program capable of
eliciting the parameters for the ELECTRE TRI model. The resulting model is implemented
as a web application that allows security experts at Ernst & Young, who have assisted in the
overall process, to make more confident conclusions about the risk level of their clients.
2

Acknowledgement
First and foremost I offer my sincerest gratitude to my supervisors Tommi Tervonen and
Yingqian Zhang, who have given me great support in my research. Special thanks go to
my supervisor Arthur Meulstee from Ernst & Young, and all my other colleagues during my
internship at the firm, who were always willing to make time to help me in writing this thesis.
I very much appreciate the opportunity they have given me to conduct my research at their
company. Without them, the research presented in this thesis would not have been possible.
Also, I would like to thank Olivier Cailloux for his help with implementing his work. Last,
but definitely not least, super special thanks go to my parents and brother, because without
them, this thesis would definitely never have seen the light of day. I hope you will enjoy
reading this thesis, and that it may help you in whatever way possible.
3
Contents
1 Introduction 6
1.1 Problem statement . . . . . . . . . . . . . . . . . . . . . . . . . . . . . . . . . 7
1.2 Research questions . . . . . . . . . . . . . . . . . . . . . . . . . . . . . . . . . 7
1.3 Scope . . . . . . . . . . . . . . . . . . . . . . . . . . . . . . . . . . . . . . . . 8
1.4 Motivation . . . . . . . . . . . . . . . . . . . . . . . . . . . . . . . . . . . . . 9
1.5 Structure . . . . . . . . . . . . . . . . . . . . . . . . . . . . . . . . . . . . . . 10
1.6 Background . . . . . . . . . . . . . . . . . . . . . . . . . . . . . . . . . . . . . 10
1.6.1 Defining information . . . . . . . . . . . . . . . . . . . . . . . . . . . . 10
1.6.2 Defining information security . . . . . . . . . . . . . . . . . . . . . . . 12
1.6.3 Risk management . . . . . . . . . . . . . . . . . . . . . . . . . . . . . 13
1.6.4 IT risk management . . . . . . . . . . . . . . . . . . . . . . . . . . . . 15
1.6.5 Cybercrime . . . . . . . . . . . . . . . . . . . . . . . . . . . . . . . . . 18
2 Methodology 21
2.1 Statistical classification . . . . . . . . . . . . . . . . . . . . . . . . . . . . . . 21
2.2 Multi-criteria decision aid . . . . . . . . . . . . . . . . . . . . . . . . . . . . . 22
2.2.1 Defining multi-criteria decision aid . . . . . . . . . . . . . . . . . . . . 22
2.2.2 Outranking methods . . . . . . . . . . . . . . . . . . . . . . . . . . . . 24
2.2.3 ELECTRE TRI elicitation methods . . . . . . . . . . . . . . . . . . . 28
2.2.4 MCDA in information security . . . . . . . . . . . . . . . . . . . . . . 30
2.3 Model building . . . . . . . . . . . . . . . . . . . . . . . . . . . . . . . . . . . 30
2.3.1 Mathematical properties . . . . . . . . . . . . . . . . . . . . . . . . . . 31
4

2.3.2 Inferring the model . . . . . . . . . . . . . . . . . . . . . . . . . . . . . 33
3 Case study 37
3.1 Data collection . . . . . . . . . . . . . . . . . . . . . . . . . . . . . . . . . . . 37
3.1.1 Attack & penetration reports . . . . . . . . . . . . . . . . . . . . . . . 38
3.1.2 Variable selection . . . . . . . . . . . . . . . . . . . . . . . . . . . . . . 41
3.2 ELECTRE TRI model elicitation . . . . . . . . . . . . . . . . . . . . . . . . . 45
3.3 Testing the performance of the ELECTRE TRI model . . . . . . . . . . . . . 46
4 Model implementation 50
4.1 Model input . . . . . . . . . . . . . . . . . . . . . . . . . . . . . . . . . . . . . 51
4.2 Outranking procedure . . . . . . . . . . . . . . . . . . . . . . . . . . . . . . . 52
4.3 Model output . . . . . . . . . . . . . . . . . . . . . . . . . . . . . . . . . . . . 52
5 Conclusion 55
5.1 Research questions . . . . . . . . . . . . . . . . . . . . . . . . . . . . . . . . . 56
5.2 Future work . . . . . . . . . . . . . . . . . . . . . . . . . . . . . . . . . . . . . 57
6 Bibliography 59
A Input data 63
5

Chapter 1
Introduction
Information has become one of most important assets of organizations. Protecting this as-
set from unauthorized access, use, disclosure, disruption, modification, perusal, inspection,
recording or destruction is of vital importance. However, many challenges in the field of infor-
mation security still exist. In current times, organizations require access to their information
from anywhere at any time more than ever before to remain competitive. This has led to a
rise of applications and information flows.
With the increased need to have better information access, organizations have increased
their web presence, and have adopted new technologies such as cloud computing and mobile
devices. However, the dependency on these new technologies and higher level of connectivity
create new risks. What happens when one of these systems fail to operate? And how do you
manage all these information flows going in and out of the organization?
In addition to organizations realizing the value of their information, so do the people who
do not have the best intentions for these organizations. Many criminals have focused their
activities on gaining access to intellectual property, trade secrets, customer data, etc. A lot
of incidents have been reported in recent news of organizations throughout the world that
were the victim of information theft, which have often resulted in huge financial losses and
have severely damaged the organization’s reputation. [5, 10]
The reported incidents have also shown that attacks have become more sophisticated, and
not just initiated by script kiddies just seeking to cause havoc. The attacks we see today are
6
initiated by groups, sometimes even state-sponsored, who have a very specific target with
a very specific purpose in mind, better known as Advanced Persistent Threats. [36] A well
known example is the computer worm Stuxnet, which was designed to target specific Siemens
supervisory control and data acquisition (SCADA) systems in Iran. Many security experts
agree, based on the sophisticated nature of the attack, that such a virus could only have been
developed with “nation-wide support”. [11]
1.1 Problem statement
With the increased need of better access to information, and the sophisticated threats from
outside, organizations are constantly challenged by new risks. It is therefore important to
reduce the vulnerabilities that are present in the key assets of organizations. When dealing
with Advanced Persistent Threats, every vulnerability could be used to create a backdoor
into an organization. And with the large number of applications, systems and processes that
are used in organizations to work with the information, there is a chance of vulnerabilities
residing somewhere within these applications. Periodical tests on these applications, systems
and processes are therefore done by many organizations to test the effectiveness of their
information security.
While testing the information systems and IT infrastructures, technical scans are per-
formed to reveal the vulnerabilities in these systems. However, it is usually not very trivial to
pinpoint the indicators that could hint to vulnerabilities within the information security. This
is usually decided by the professional judgment of the security experts who are performing
the audit. The goal of this thesis is to understand how to draw a conclusion about the risks
that are associated to the found vulnerabilities.
1.2 Research questions
The previous section described the central problem of this thesis. The conclusion about the
risk level of an organization of organizations is generally done by the security experts, given
the result of a technical assessment. The following research question is formulated to model
7

the professional judgement of the security experts:
Can company characteristics and results of technical assessments be used to classify the risk
of cyber-security attacks?
The research question above remains difficult to answer as it contains a number of chal-
lenges. First, it is unknown which criteria play a role for the security expert for him or her
to draw a conclusion. Although it is relatively easy to verify what techniques are used in
this process, it is not trivial to gain insights in which specific details the security expert pays
attention to. Second, there are many ways to model the classification process. Selecting the
appropriate classification method therefore also requires special attention. Last, as with all
classification models, the quality of the model remains uncertain. After creating a model ca-
pable of assigning organizations to a risk level, a robustness analysis should reveal how much
the model is sensitive for small deviations. These three challenges are used to formulate the
three sub questions below to make it easier to draw a conclusion about the main research
question.
1. How can the assignment of organizations to the appropriate risk class be modeled?
2. What criteria influence the risk of cyber-security attacks?
3. How robust is the classification model?
1.3 Scope
During this study a model is constructed capable of assigning organizations to a risk class,
e.g., high risk, medium risk, or low risk, given a set of parameters describing the company
characteristics, and a set of parameters from a technical assessment on a web application.
This model should give organizations a clear insight into their risk of a cyber-security attack
and on what points their security measures can improve.
In order to effectively model the classification process of the security experts, some sim-
plifications must be made, granted that risk analysis is generally hard to quantify. [12] The
8

research question itself already narrows down the risk analysis to the use of company char-
acteristics and the results of technical assessments. This information is acquired during my
internship at Ernst & Young by having access to their repository of reports. From this repos-
itory, only the reports describing the results of the technical assessments of web applications
are used. With the increased connectivity discussed earlier in this chapter, web applications
have become a widely used communication method, but at the same time also creates a new
potential target for cyber-criminals. This makes web applications an interesting subject for
this study. Additionally, as technical assessments are diverse, selecting only the reports about
the technical assessments of web applications allows for easy comparison.
As the focus of this thesis is primarily on web application, this study does not try to
model the entire risk of cyber-security attacks of an organization. But despite the fact that
the available reports primarily contain information about the technical security measures,
they do form the basis of security for every organization.
1.4 Motivation
Constructing a model that can classify risks found within IT applications is both interesting
from a scientific perspective, as it is from a business perspective. First, by modeling the risk
classification performed by the security experts at Ernst & Young, it will give the organization
a good insight in their professional judgement. This will reveal which specific criteria play
a role, and which criterion is more important than others. Additionally, this model can
be implemented into a system capable of automating (parts of) the professional judgement
which can relieve the security experts of a part of their work. Given that Ernst & Young is
on the verve of increasing their efforts in data analysis to improve their services, this research
fits perfectly within their plans. And with the description in this thesis of constructing a
classification model, the model can be easily reconstructed based on new reports when the
initial model described in this study is no longer representative of the professional judgment
of the security experts.
Aside from the potential benefits for the security experts of Ernst & Young, an imple-
mentation of the classification model constructed in this thesis will allow organizations to
9

get a quick insight into the quality of their security measures. The classification is an easy
to understand result for managements who are responsible for the security measures of their
organization. Additionally, the model can give an insight into which security measures need
the most attention to reduce their risk against cyber-security attacks.
1.5 Structure
This thesis is divided into six chapters, including this introductory chapter. The next chapter
contains an overview of the methodology used to conduct the research described in this
thesis. This chapter is followed by a description of applying the classification theory on a
real case to develop a classification model. The fourth chapter contains a description of
the implementation of the classification model in an application that can be used to easily
perform the classification procedure in the future. This thesis is then followed by a conclusion
in which an answer to the main research question is constructed. Last, the sixth and final
chapter contains an overview of the literature that was used in this research.
1.6 Background
In order to formulate an answer to the research questions, an understanding of the background
of the problem is required. First, information, the asset that should be protected, is discussed.
This is followed by an overview of information security. Third, the role of risk management
within an organization, of which information security is part of, is described. Next, the focus
is on a specific part of risk management: IT risk management, because IT plays a prominent
role in the central problem of this thesis. Last, an overview of current day cybercrime is
given.
1.6.1 Defining information
Information can be interpreted in many different ways. Depending on the field you’re work-
ing in, information can have a different meaning. It is therefore difficult to create a generally
accepted definition of information. The word information comes from the Latin verb “infor-
10

mare”, which means “to give form to the mind”. In other words, one might thus say that
information is about understanding. Over the past centuries, the English word “information”
has formed its own meaning. The Oxford English Dictionary has defined information as:
“facts provided or learned about something or someone, or what is conveyed or
represented by a particular arrangement or sequence of things.”
The first part of this definition is somewhat in line with the Latin origin of the word
information, as it describes that information allows for learning and thus understanding. One
might also say that information primarily encapsulates knowledge, based on the first part of
the definition. The latter part of the definition gives a much broader view on information
and mainly describes how information can be transmitted and stored. This is extensively
researched in the field of information theory. [35] The fact that information theory has
formed an entire field in modern day science, and the size of this field, gives a hint about
how important information has become. Over the past decades, information has become
increasingly important in our everyday lives. This is reflected by the fact that historians
have coined the current era of human society as the Information Age. [4] As information has
become such an important good, it is not surprising that much effort is put into securing this
valuable asset. This is made apparent in the definition of information in ISO/IEC 27002, a
code of practice for information security management:
“Information is an asset that, like other important business assets, is essential to
an organizations business and consequently needs to be suitably protected.”
This definition is much more narrow than the definition from the Oxford English Dictio-
nary, but it does describe the importance of information from a business point of view. As
this is also the point of view for this thesis, we are primarily interested in this approach. The
information that an organization has can give it a competitive edge needed to outperform
their competitors. Examples of valuable information to an organization could be customer
data, new product information, trade secrets, etc. And with the rise of the internet, the
amount of information has grown immensely. Managing all this information has proved to
be a daunting task for organizations. In response, many information systems have been
11

developed to aid in this information management process. Examples of such systems are
transaction processing systems, decision support systems, knowledge management systems,
and database management systems. With the large volume of information organizations are
coping with, the demand for good protection of information is increasing. The next parts of
this section go deeper into information security.
1.6.2 Defining information security
Like information, information security is a broad term that can be interpreted in many dif-
ferent ways. It is therefore not surprising that there are different definitions available. The
Code of Laws of the United States of America has defined information security as follows:
“The term “information security” means protecting information and information
systems from unauthorized access, use, disclosure, disruption, modification, or
destruction in order to provide–
• confidentiality, which means preserving authorized restrictions on access and
disclosure, including means for protecting personal privacy and proprietary
information;
• integrity, which means guarding against improper information modification
or destruction, and includes ensuring information nonrepudiation and au-
thenticity; and
• availability, which means ensuring timely and reliable access to and use of
information.”
Based on this definition, we can conclude that the goal of information security is to pro-
vide integrity, confidentiality and availability of information. This is done by protecting it
from unauthorized access, use, disclosure, disruption, modification or destruction. Integrity,
confidentiality and availability are known as the classical core principles of information secu-
rity, or CIA principles. In this case CIA does not refer to the Central Intelligence Agency, a
civilian intelligence agency of the United States government, but is used as an acronym for
12

the three core principles of information security. When taking the definition of information
security in ISO/IEC 27002, these principles are also present:
“[Information security is] preservation of confidentiality, integrity and availability
of information; in addition, other properties, such as authenticity, accountability,
non-repudiation, and reliability can also be involved.”
This definition is less verbose than the definition from the Code of Laws of the United
States of America, as it does not explicitly specifies the threats information security is con-
cerned about. However, it does extend the list of principles of information security. There has
been much debate about extending the three core principles, but no consensus has yet been
reached on which principles to add to this list. Another example of extending the CIA prin-
ciples is the Parkerian Hexad, which adds the properties possession (or control), authenticity
and utility. [30] Protecting possession refers to ensuring complete ownership over all instances
of the information. Protecting authenticity means ensuring validity of the claim of origin of
the information. Protecting utility means preserving the usefulness of the information. Al-
though no definite set of accepted principles is available, as different people and organizations
have invented their own, they do give an idea about the objective of information security.
What is also apparent when analyzing the above definitions, is that information security is
all about protecting information from information security incidents. This is especially clear
in the definition from the Code of Laws of the United States of America. Protecting against
incidents is also a property of risk management, which is usually part of an organization to
manage the risks the organization is facing. It is therefore not surprising that information
security is closely related to risk management. The next part of this section goes deeper into
risk management.
1.6.3 Risk management
Taking risks is one of the fundamental drives behind our modern capitalistic society. On the
other hand, there are also risks that organizations would rather not have experience with, such
as natural disasters, legal liabilities, or attacks from adversaries. By having well-documented
13

plans and procedures in place, organizations can take action against the risks they face. This
is done through risk management.
The Oxford English Dictionary defines a risk as “a situation involving exposure to dan-
ger.” In order for managers to make decisions about the risks organizations are facing, more
information about risks is required. This is usually done through a risk analysis. [23, 20, 12] A
risk analysis is initiated by assessing the assets of the organization, followed by an analysis of
the threats, vulnerabilities, and security risk. The assessment of the assets will aid in scoping
the risk analysis. Subsequently, by determining the value of the assets, the possible counter-
measures can also be determined. In fact, it does not make sense to have countermeasures in
place for protecting an asset with a lower value. After the assets have been identified and val-
ued, the focus is put on identifying the threats. Threats are undesired events that can damage
an organizational asset. Examples of threats are errors, fraud, or sabotage. These are caused
by threat agents, such employees, hackers, but also nature can be a threat agent. In fact,
earthquakes are significant threats in many geographical areas, such as the San Francisco Bay
area and Japan. Next, an assessment of the vulnerabilities within the organizational system
is made. These could be ill-defined policies, a hole in a fence, or a misconfigured router. Last,
the security risk is determined. This is a loss that an asset will occur when a vulnerability is
exploited by a threat.
Organizations often try to quantify risks by calculating the expected loss due to an inci-
dent. This is done to gather insights into the risks an organization is facing. Many methods
have been proposed to quantify risks. [12, 39] A simple example of such is given in Equation
1.1: [23]
Risk = Likelihood× Impact, (1.1)
where Likelihood denotes the probability of an incident occurring, and Impact the result
of an unwanted incident. The latter can be compared to the security risk, the final assessed
element of a risk analysis. It is however not always trivial how to quantify risks. [12, 39]
After assessing the different risks an organization faces, decisions can be made about
them. Depending on the Likelihood and Impact, different actions can be taken. When both
14

variables are low, the organization could decide to accept the risk. When the Likelihood
remains low, but the Impact is high, a decision could be to transfer the risk. This could be
done by taking an insurance. When the situation is reversed, so when Likelihood is high
and Impact is low, the organization can choose to reduce the risk. This could be done by
taking countermeasures. Last, in the case when both Likelihood and Impact are high, the
organization can choose to avoid the risk altogether. [20]
1.6.4 IT risk management
As organizations are increasingly dependent on information technology (IT) for managing
their information, a shift in risk management has taken place. A lot resources are now spent
at managing IT risks. Different methods have been proposed to manage IT risks. [37] An IT
risk can be defined as: [17]
“the potential that a given threat will exploit vulnerabilities of an asset or group
of assets and thereby cause harm to the organization. It is measured in terms of
a combination of the probability of an event and its consequence.”
The latter part of the definition is closely related to Equation 1.1, where Likelihood refers
to the probability of an event, and Impact to the consequence of the event. However, the first
part of the definition also hints towards a more detailed risk equation with the mentioning of
threats and vulnerabilities. These two elements are also part of the risk analysis as we saw
earlier. Based on this information, we can reformulate the risk equation of Equation 1.1 to:
[20, 37]
Risk = Threat× V ulnerability × Impact. (1.2)
Now that we understand what IT risks are, the question that remains is how organizations
should cope with these risks. As noted earlier, many risk management and IT risk manage-
ment methods exist. Among these are several methods proposed by international bodies such
as the International Organization for Standardization (ISO), International Electrotechnical
Commission (IEC) and Information Systems Audit and Control Association (ISACA). The
most notable methods are discussed in the remainder of this subsection.
15

Risk IT and COBIT
ISACA’s Risk IT framework ties IT risk to enterprise risk management and aids in making
well-informed decisions about the extent of the risk, the risk appetite and the risk tolerance
of the organization. [16] Risk appetite and risk tolerance describe the attitude towards risk
of an organization. [20] Furthermore, the framework aims to make organizations understand
how to respond to the risk. To meet these goals, the Risk IT framework provides a set of
governance practices for risk management, an end-to-end process framework for successful IT
risk management, and a generic list of common, potentially adverse, IT-related risk scenarios
that could impact the realization of business objectives. The framework is complemented
with tools and techniques to understand concrete risks to business operations, as opposed to
generic checklists of controls or compliance requirements.
The Risk IT framework is closely related to COBIT, another framework developed by
ISACA. [18] It assists organizations in achieving their objectives for the governance and man-
agement of IT. COBIT is thus much broader than Risk IT, as it focusses on risk management
in general. However, as of COBIT 5, the Risk IT framework is actually fully incorporated
into the COBIT framework.
ISO/IEC 27001 and ISO/IEC 27002
Besides ISACA, also the ISO, together with the IEC, has worked on developing a set of guide-
lines for managing IT risk, and information security in particular. Earlier in this section, we
saw the ISO/IEC 27002 code of practice for information security management. This is an
example of the many information security standards that are available to aid organizations
in improving their information security. Many organizations have adopted this or similar
standards as part of their information security management, which can be used as founda-
tion for understanding managerial obstacles, modifying managerial strategies and predicting
managerial effectiveness. [15] ISO/IEC 27002 specifies a set of commonly accepted goals of
information security management. These are laid out in eleven clauses, each describing a
component of information security management:
1. Security policy
16

2. Organizing information security
3. Asset management
4. Human resources security
5. Physical and environmental security
6. Communications and operations management
7. Access control
8. Information systems acquisition, development and maintainable
9. Information security incident management
10. Business continuity management
11. Compliance
An organization’s information security management is usually implemented in an infor-
mation security management system. The specifications of establishing, implementing, oper-
ating, monitoring, reviewing, maintaining and improving a documented information security
management system within the context of the organizations overall business risks are formally
laid out in the ISO/IEC 27001. According to the specification, an information security man-
agement system documentation should contain nine points. The first point should contain the
statements of the information security management system policy and objectives. This point
is followed by the scope of the information security management system. Subsequently, the
documentation should contain a description of the procedures and controls in support of the
information security management system. In addition to this description, a description of the
risk assessment methodology should be formulated. This is followed by the risk assessment
report and the risk treatment plan. In order to ensure the the effective planning, operation
and control of its information security processes, several procedures must be documented.
The documentation is then concluded by records required by this International Standard,
and the Statement of Applicability.
17

By combining both the ideas of information security management with the implementa-
tion of a information security management system, organizations can ensure their ability to
operate. [3] However, one is never able to completely eliminate all risks. Especially with the
rise of the internet, and the increased connectivity, organizations are increasingly suffering
from cybercrime. In the next part of this section, we will be taking a closer look at this
growing threat.
1.6.5 Cybercrime
As stated earlier, we live in an era in which information plays a central role. As an effect,
the value of information has also increased. This is not only the case for organizations, but
also for criminals. Cyber-criminals have evolved from simple script kiddies to real criminals.
However, unlike with other types of criminality, organizations hesitate to report this type of
criminality to the authorities. Only 28 percent of affected companies in the United States of
America have reported incidents to law enforcement in 2010. [5] The most used argument
was the believe that law enforcement could not help in the matter, followed by the fact that
incidents were too small to report, and the argument that negative publicity would hurt the
organization’s image. Because of this, governments are not always able to publish official
figures about the size of cybercrime. Truth is that cybercrime is still an important issue for
organizations. This is reflected by the fact that 72 percent of organizations see an increasing
level of risk due to increased external threats. [10] As the main focus of this thesis lies on
attacks on web applications, the remainder of this section will focus on this topic.
Web application security
Since the Web 2.0 phenomenon the amount of interactive web applications has increased
tremendous. These pose much higher risk than static websites, as they are generally connected
to other systems, e.g. a database. This makes it an interesting target for cyber-criminals.
As a response, the Open Web Application Security Project (OWASP) was launched in 2001.
This charity organization, backed by many high profile companies from all around the world,
focusses on improving the security of web applications. Part of their work is their research
18
on the most critical web application security risks. [40] The ten most critical web application
security risks are listed as follows:
Injection Injection flaws occur when an attacker is able to trick the web application into
executing malicious code, enabling the attacker the implemented access controls. SQL
injections are a common example of injection flaws. These flaws allow the hacker to
send custom commands to the database of the web application.
Cross-Site Scripting (XSS) Similar to injection flaws, XSS flaws occur when the attack is
able to sneak through malicious code. Instead of executing the code on an underlying
system, XSS attacks target the victim’s web browser to hijack user sessions, deface web
sites, or redirect the user to malicious sites.
Broken authentication and session management Web application often allow users to
have a personal account. The associated authentication and session management func-
tions often contain flaws, allowing attackers to take the identity of another user.
Insecure direct object references Access rules which indicate whether or not a user is
allowed to access to an object is often implemented incorrectly. By manipulating the
reference to objects that the user is allowed to access, unauthorized access to other
objects can sometimes be obtained.
Cross-Site Request Forgery (CSRF) A CSRF attack allows the attacker to execute a
request on a web application the victim is currently logged in to.
Security misconfiguration The web applications should run on a secure foundation of
frameworks, application server, web server, database server, and platform. The security
settings must be configured correctly, and the software must be kept up to date.
Insecure cryptographic storage Sensitive information, such as passwords and credit cards,
must be stored protected. In case the information falls into the wrong hands, the users
can face credit card fraud or identity theft if the data is stored unprotected.
Failure to restrict URL access Similar to insecure direct object references, URLs can be
manipulated to gain access to circumvent access controls.
19

Insufficient transport layer protection Sometimes sensitive data, such as credit cards,
is sent to web applications. In order to protect confidentiality and integrity, this net-
work data should be encrypted. However, this is sometimes neglected, or implemented
incorrectly.
Unvalidated redirects and forwards Web application sometimes redirect users to other
pages. This redirection can however be manipulated to redirect users to other websites
instead to phishing or malware websites.
The above ten most critical web application security risks give a good overview of risks
that can be identified in web applications. However, this list does not enumerate the most
common weaknesses. Instead, they are ordered by risk level. Using Equation 1.2 we can
formulate this as:
RiskXSS > RiskCSRF . (1.3)
In order to prepare against these risks, many organizations choose to simulate an attack
from malicious outsiders, also known as an attack & penetration test. During such a test, the
tester makes an analysis of all systems in order to try to find a vulnerability. This could be a
vulnerability listed in OWASP ten most critical web application security risks. When having
found such a vulnerability, the tester tries to use it to perform unauthorized actions on the
web application. [21]
20

Chapter 2
Methodology
After having researched the background of information security in the previous chapter, this
chapter contains an overview of several possible classification methods. First, an analysis of
several statistical classification methods is made, followed by a description of several multi-
criteria decision aid methods. Last, a model is constructed for classifying organizations into
risk classes based on several characteristics.
2.1 Statistical classification
In statistical classification the predefined sub-population, or class, to which a new observation
belongs to is identified. [27] Classification methods should not be confused with clustering
methods. In clustering, the observations are grouped such that each group contains similar
observations. However, these groups are not predefined. In classification, the primary goal
is to understand the properties on which the observations are assigned to a specific class.
In this part several machine learning classification methods are discussed. First, k-nearest
neighbors, followed by artificial neural networks and concluded by support vector machines.
The k-nearest neighbors algorithm is one of the simplest examples of classification. It
starts with having a training set containing a number of observations that have been assigned
to a specific class. Any new observation is assigned to the class that is most common among
its k nearest neighbors. The value of k is chosen beforehand. This can be done using various
methods. Calculating the distance between the observations is also something one should
21

consider when using k-nearest neighbors, as several heuristics and techniques are available for
this purpose. Most commonly used are the Euclidean distance and the Manhattan distance.
[7]
A more advanced classification method is the artificial neural network. The method is
based on biological neural networks and tries to learn the relationship between inputs and
outputs. [25, 34] Artificial neural networks can be performed both supervised and unsuper-
vised. For this thesis, with the availability of test data, the primary interest goes to the
supervised form of artificial neural networks. A popular type of an artificial neural network
for classification is the perceptron, [31] capable of linear classification. The multi-layered
perceptron is capable of non-linear classification. [14]
Another interpretation of a perceptron is given in the support vector machines method.
[6] This method treats each data point as a p-dimensional vector. The objective is then to
construct a p-dimensional hyperplane to separate the vectors from each other that do not
belong in the same class.
2.2 Multi-criteria decision aid
Despite the fact that the formulation of the main research question asks for a risk classification
method, multi-criteria decision aid methods also prove to be interesting candidates. The
classification process can also be considered a decision problem. The classification of the risk
that an organization faces to cyber-security attacks is in fact a decision made by the security
experts. This section provides an overview of the different relevant multi-criteria decision
aid methods. First, a general overview and definition of multi-criteria decision aid is given.
This is followed by an analysis of different multi-criteria decision aid methods found in the
literature. Last, this section is concluded by an overview of how multi-criteria decision aid
has been used in the context of information security.
2.2.1 Defining multi-criteria decision aid
Multi-criteria decision aid is a sub-discipline of operations research that can be used by
decision makers as a tool during the decision process for problems which require different
22

points of view. [38] In this type of problems, there is a set of alternatives (e.g. options or
actions) to choose from. These alternatives are evaluated based on a set of criteria. A simple
example of a multi-criteria decision problem could be the selection of a new computer. All
the available models represent the alternatives in the decision problem. To pick out the best
computer, one has to evaluate and compare the different computer models. This could be
done based on the brand, price, hardware, delivery time, etc. This set of criteria is different
for each consumer and some criteria are more important to the consumer than others. For
instance, someone who has a particular favor for a specific brand might be more prepared to
pay a higher price for a computer of that brand, than for a very similar computer of another
brand. Multi-criteria decision aid methods can be used to model this decision making process.
[33]
The multi-criteria decision aid methods are traditionally divided into three families. First,
we consider multi-attribute utility theory. This family consists of methods that aim to con-
struct a utility function that can be used to rank the different options from best to worst.
Second, the outranking methods aim to identify the options that are better than other op-
tions. Third, the interactive methods, consists of methods that alternate between computa-
tional steps and dialogue with the decision maker in order to gradually revise and improve
the decision model. Despite the fact that multi-attribute utility theory can also be used for
sorting, we will focus on the outranking and interactive methods, because they provide rules
that are easier to explain.
As the field of multi-criteria decision aid matured, new types of methods arose. This called
for a new categorization to replace the traditionally three families introduced in the previous
paragraph. [19] First, multiobjective optimization, which focuses on optimizing two or more
conflicting objectives subject to certain constraints. Second, value-focused approaches, which
deal with describing the decision maker’s preferences. Third, outranking methods, similar
to what is discussed in the previous paragraph, are constructive ways of building prefer-
ences. Last, disaggregation methods, aim at inferring a preference model from given global
preferences.
23

2.2.2 Outranking methods
The main idea behind the outranking methods is to compute which alternatives are better,
or at least as good as, the other alternatives. For instance, one would like to know which of
the three alternatives a, b and c is the best, it is not necessary to create a complete ranking
of the three alternatives. In fact, if a is better than both b and c, it is irrelevant to know if
b is better than c or vice versa. A more formal definition definition of outranking is given
as follows: An outranking relation is a binary relation S defined in A such that aSb if, given
what is known about the decision maker’s preferences and given the quality of the valuation
of the actions and natures of the problem, there are enough arguments to decide that a is at
least as good as b, while there is no essential reason to refute that statement. [32]
ELECTRE TRI model
The ELECTRE family is a well-known family of methods based on the outranking relation.
Out of the ELECTRE family, the ELECTRE TRI method has become one of the most suc-
cessful and applied sorting method in the field of multi-criteria decision aid. [42] ELECTRE
TRI tries to assign the alternatives by comparing them with the profiles of the categories.
These profiles define the limits of the categories. The assignment is performed by building a
fuzzy outranking relation. This means that the alternatives are assigned to a category if it
is at least as good as the profile based on a sufficient set of profiles, and is not significantly
worse on any other criterion. The comparison between the criteria of the alternatives and
the profiles is done by taking into account preference and indifference of a decision maker for
the criteria. After computing the fuzzy relation between the alternatives and the profiles, the
relation is made crisp using a pre-defined cutting level to assign them to a specific category.
Using the ELECTRE TRI model, organizations can be assigned to a risk class based
on the variables listed in the previous chapters. Given the fact that ELECTRE TRI is a
decision aid method, an organization is treated as an alternative a, an element of the set
A. The name “alternative” reflects the fact that the goal of decision aid methods is to
choose a solution for a specific problem. Despite that the ELECTRE TRI is exploited for
a classification problem, meaning that we shall not choose between the organizations, the
24

Figure 2.1: The relation between the profiles b1, . . . , bk−1 and the risk classes c1, . . . , ck.
term “alternative” is maintained for consistency with the related multi-criteria decision aid
literature. The alternatives are classified by comparing the performance of the alternative to
the performance requirements of the available classes. The performance of alternative a is
measured based on the variables that have been selected in the previous chapter. We refer
to these variables as criteria. The performance of alternative a on criterion gj is reflected by
gj(a), where j ∈ J , and J ∈ {1, 2, . . . , n}.
In this thesis, the alternative a is assigned to one of the three risk classes: low risk, medium
risk or high risk. Therefore, in this research k = 3. The classes are separated by a set of
profiles B = {b1, . . . , bh, . . . , bk−1}. These profiles act as a performance requirement for the
classes. Each profile bh defines a set of values for the criteria that serve as an upper limit for
class ch and a lower limit for class ch+1. These profiles are used to assign the alternatives
to one of the classes. The performance of alternative a on the criteria is compared to the
performance of the profiles B to determine which class alternative a belongs to. Figure 2.1
depicts the relation between the profiles and classes.
25

The outranking relation
The comparisons between alternative a and profile bk is done using the outranking relation.
The outranking relation between alternative a and profile bh, denoted as �, is tested by
comparing the performance of the criteria. The performance of alternative a on a criterion gj
is given as gj(a). This could be the amount of SQL injections found for a. So if gj(a) ≥ gj(bh),
we can say that a � bh (a outranks bh) based on criterion j, or more specifically
Cj(a, bh) =
1 if gj(a) ≥ gj(bh),
0 otherwise.
(2.1)
Equation 2.1 forms the basis of the outranking relation between alternative a and bh.
However, in some cases a small difference between gj(a) and gj(bh) could be considered
insignificant. When comparing large quantities, a difference of a single unit is generally not
interesting. For instance, when a decision maker is made to choose between two options
by comparing them based on one criterion, the decision maker might be indifferent when
having to decide between the two options. To overcome this issue, the indifference threshold
qj(bh) is introduced to the ELECTRE TRI model, specifying the largest difference between
alternative a and profile bh for the decision maker to remain indifferent based on criterion
j. Additionally, the decision maker might specify a preference threshold pj(bh), defining the
difference between a and bh which makes that the decision maker has a clear preference of
alternative a over profile bh. However, a � bh only holds when alternative a outperforms
profile bh on a majority of criteria. The fraction of criteria that must be in favor of a for it
to outperform profile bh is defined by λ, which is a cutting level such that λ ∈ [0.5, 1]. Using
λ, the outranking relation between a and bh can be defined as
1
|J |∑j∈J
Cj(a, bh) ≥ λ. (2.2)
Equation 2.2 compares the performance of a to bh based on all criteria j ∈ J , where |J |
reflects the cardinality of the set J . It calculates the percentage of criteria on which alternative
a outperforms profile bh. However, some criteria might be considered more important than
other criteria by the decision maker. To include this fact, a weight wj for each criterion j is
26

introduced that represents the relative importance of criterion j. Additionally, the decision
maker might want to forbid alternative a to be assigned to a specific class given a certain
performance for a criterion. This veto information for criterion j can be described using the
veto threshold vj . Using the weight information, Equation 2.2 can be extended to
∑j∈J
wjCj(a, bh) ≥ λ, (2.3)
∑j∈J
wj = 1. (2.4)
The new outranking function in Equation 2.3 still uses the binary outranking function
Cj(a, bh) to compare alternative a with profile bh based on criterion gj . However, the new
outranking function now multiplies that binary outcome with the weight wj for criterion gj .
The weights are defined such that wj ∈ [0, 1], and all weights combined equal 1. Using this,
Equation 2.3 can be rewritten as
σj(a, bh) =
wj if Cj(a, bh) = 1,
0 otherwise.
(2.5)
Utilizing σj(a, bh) to determine whether alternative a outranks profile bj based on criterion
gj , the definite outranking function can be defined as
∑j∈J
σj(a, bh) ≥ λ. (2.6)
The assignment procedure
Using Equation 2.6, alternatives can be compared against the profiles. This comparison can
be done either through a optimistic or pessimistic procedure. The optimistic procedure starts
by assigning alternative a to the first category: c1 (“low risk” in this case). Subsequently, a
is compared against profile b1. If a � b1, alternative a will be assigned to class c2. It is then
compared to the next profiles, until profile bh � a. Alternative a then remains assigned to
class ch. The pessimistic procedure starts by assigning a to ck. Alternative a is then assigned
to class ch+1 if a � bh.
27

Table 2.1: An overview of the parameters of the ELECTRE TRI method.
Name Description
a ∈ A Alternative
{c1, . . . , ch, . . . , ck} Classes
{b1, . . . , bh, . . . , bk−1} Profiles
{gj | j ∈ J} Criterion
{wj | j ∈ J} Criterion weight
J = {1, 2, . . . , n} Criteria indices
gj(. . .) Criterion performance
Cj(a, bh) ∈ {0, 1} Outranking result
σj(a, bh) ∈ [0, 1] Weighted outranking result
λ ∈ [0.5, 1] Majority threshold
This assignment procedure disregards the veto, preference and indifference thresholds.
We have chosen for this simplified version of the ELECTRE TRI model because the decision
makers have specified that they do not utilize such variables during their decision making
process. Without these three variables, the model also becomes less complicated, making the
model generation less difficult. The definite set of variables that are used in the ELECTRE
TRI model are given in Table 2.1. The next section will give a description of how the values
of these variables are derived when having a set of assignment examples.
2.2.3 ELECTRE TRI elicitation methods
Elicitation of the decision model parameters from the decision maker can be difficult in most
cases. The interactive methods try to overcome this problem by having the decision maker
become more involved during the elaboration of the solution. Although in every decision aid
method there is some interaction with the decision maker, for the interactive methods this
interaction is the core principal.
[29] proposed a method to infer the parameters from the decision maker for an ELECTRE
TRI model. Instead of asking the decision maker for these parameter values, the decision
28

maker provides a set of assignment examples of alternatives for which the decision maker has
a clear preference. These assignments could be examples of cases that can be easily assigned
to a category. The values of the parameters are then inferred using a certain form of regression
on the assignment examples. The resulting ELECTRE TRI model should be able to assign
the examples the same way as the decision maker did. If not, the decision maker may either fix
values for some model parameters or revise the assignment examples. This interactive process
continues until the difference between the assignments made by ELECTRE TRI model and
the assignments made by the decision are minimized. This optimization problem is a nonlinear
programming problem.
In order to simplify the approach of [29], the subproblem of determining the weights of the
ELECTRE TRI model is considered in [28]. In this new approach, the nonlinear optimization
problem is reduced to a linear optimization problem.
[8] proposed a method to obtain robust assignment conclusions by having the decision
maker provide constraints on one or more ELECTRE TRI parameters instead of crisp values.
This is especially useful when elicitation of parameters from a group of decision makers in
which each has his or her own ideas about the parameter values. The ELECTRE TRI model
is then determined by first computing the best and worst categories for each alternative. The
idea is then that the alternative belongs between these best and worse categories. Therefore,
when the best and worst categories coincide, this means the model is capable of assigning
the alternative to one single category. Based on how the model assigns the alternatives, the
decision maker can revise the constraints given earlier for the ELECTRE TRI parameters.
This process in repeated until the decision maker is satisfied with the model.
[9] proposed an approach that combines the methods of [29] and [8]. This combined ap-
proach allows decision makers to provide either assignment examples, as in [29], or constraints
on the parameter values, as in [8]. Based on this information, an ELECTRE TRI model is
computed. The decision maker is then provided with a combination of parameter values that
best describe the provided information, the range of categories to which each alternative can
be assigned to, the categories in these ranges to which ELECTRE TRI assigns each alterna-
tive, the best and worst case assignments for each alternative, and the parameter values for
29

each category that lead to the assignment of any alternative to that category. Based on this
information, the decision maker can add, delete or modify a constraint. This process is re-
peated until the decision maker is satisfied with the assignments performed by the ELECTRE
TRI model.
2.2.4 MCDA in information security
Multi-criteria decision aid methods can be applied to any kind of decision problem. However,
for this thesis it is particular interesting to also focus on multi-criteria decision aid methods
used in decision problems regarding information security. An example is given in a case study
for the Taiwanese government. [41] In 2002, the government had issued a set of information
security controls which all major government departments had to comply with. In order to
get an understanding of which controls had the highest priority in their organization, the
employees responsible for the compliance with the new information security controls ranked
the controls using multi-criteria decision aid. This allowed them to start with the compliance
of the most important controls, while ending with the least important.
2.3 Model building
Given that a multi-criteria decision aid model gives results that are easier to explain than
statistical classification methods, we have chosen to go with a multi-criteria decision aid
approach. More specifically, an ELECTRE TRI model will be built, as there are several model
elicitation methods available in the literature for ELECTRE TRI models of which most of
these require little computational power. This section goes into the details of the ELECTRE
TRI model and how to construct an ELECTRE TRI model to classify the organizations
risk level. First, the mathematical properties of the ELECTRE TRI model are discussed.
Second, the inference procedure to infer the ELECTRE TRI model are presented to conclude
this chapter and to provide an answer to the first sub question: How can the assignment of
organizations to the appropriate risk class be modeled?
30
2.3.1 Mathematical properties
In order to use the ELECTRE TRI model, the parameters of the model for the specific
problem are required. Asking the values of the parameters directly from the decision makers
might not always give the desired result. The values might either be imprecise, guesses, or it
might be difficult for the decision maker to give any value at all. Much research has been done
on eliciting the values for the ELECTRE TRI model using alternative methods, as described
in the previous section. Given the availability of historical data, the required variables can
be inferred from the classification decisions made in these examples.
Given the problem at hand, we are interested in eliciting the profiles to derive the as-
signment rules. Additionally, we want to infer the importance weights and λ cutting level.
Based on these requirements, a method specifically for eliciting the ELECTRE TRI category
limits has been selected. [2] The advantage of this method over the other available methods
is that it is capable of eliciting an ELECTRE TRI model based on only a set of assignment
examples, containing the performances of the examples on a set of criteria, and the classes to
which the examples are assigned to. It does not require any information about the profiles or
λ cutting value, like the other available methods. The assignment examples are represented
as A∗ = (P,E), where P is an m × n matrix containing the performance information of m
assignment examples for n criteria, and E is a vector containing the assignments, specifying
to which class each assignment example is assigned to by the decision makers, as depicted in
Equations 2.7 and 2.8 respectively.
31

P =
g1(a1) g2(a1) . . . gn−1(a1) gn(a1)
g1(a2) g2(a2) . . . gn−1(a2) gn(a2)
......
. . ....
...
g1(am−1) g2(am−1) . . . gn−1(am−1) gn(am−1)
g1(am) g2(am) . . . gn−1(am) gn(am)
(2.7)
E =
(a1 → cw)
(a2 → cx)
...
(am−1 → cy)
(am → cz)
(2.8)
Deriving the profiles, criteria weights and λ threshold from the assignment examples A∗
is performed using a linear program (LP). [2] However, due to the numerical imprecisions
and redundancy that is present in the presented LP, an optimized LP is used instead. [1]
In addition to the ELECTRE TRI variables in Table 2.1 the LP features a slack variable
s, together with the sets δj and Mj , respectively the maximum and minimum performance
difference between any two different performances on criterion j, and an arbitrary small
number δλ which is set to 0.001, as described in the report. The slack variable s is introduced
in the LP in order to maximize the separation between the sum of support and the majority
thresholds. In fact, the objective function of the LP is to maximize the value of s. The
sets Mj and δj were added to transform strict inequalities to large inequalities, where δj =
|gj(ai)−gj(aj)|k+1 , and Mj = max(gj) − min(gj) + kδj . Additionally, to decrease the number of
constraints, the optimized LP does not consider all possible pairs (a, bh) for all k− 1 profiles,
but only the pairs (a, bh−1) and (a, bh) for each assignment (a→ ch) ∈ E. More specifically,
S ={
(a, bh−1), ∀(a→ ch) ∈ E, h ≥ 2},
S ={
(a, bh),∀(a→ ch) ∈ E, h ≤ k − 1},
S = S ∪ S.
32

Using these variables, the necessary constraints for the LP from [1] can be constructed as
in Equation 2.9. The formulation of the constraints presented in this thesis is slightly different
from the original formulation, because it allowed for an easier implementation and to remain
consistent with the formulations and variable names used in this thesis. Additionally, the
original LP allowed multiple decision makers to have different assignment examples. Given
that the decision makers in this research had reached a consensus about the assignment exam-
ples, this feature was left out from the LP presented in this thesis to increase the performance
of the inference procedure. However, the meaning of the constraints and their effects are still
identical to those of the original LP formulation.
∑j∈J
wj = 1
gj(bh−1)− gj(bh) ≤ −δj ∀j ∈ J, 2 ≤ h ≤ k − 1
1
Mj + δjgj(a)− 1
Mj + δjgj(bh)− Cj(a, bh) ≤ − δj
Mj + δj∀(a, bh) ∈ S, j ∈ J
Cj(a, bh)− 1
Mj + δjgj(a) +
1
Mj + δjgj(bh) +
1
Mj + δjδj ≤ 1 ∀(a, bh) ∈ S, j ∈ J
Cj(a, bh) + wj − σj(a, bh) ≤ 1 ∀(a, bh) ∈ S, j ∈ J
σj(a, bh)− Cj(a, bh) ≤ 0 ∀(a, bh) ∈ S, j ∈ J
σj(a, bh)− wj ≤ 0 ∀(a, bh) ∈ S, j ∈ J∑j∈J
σj(a, bh)− λ− s ≥ 0 ∀(a, bh) ∈ S
∑j∈J
σj(a, bh)− λ+ s ≤ −δλ ∀(a, bh) ∈ S
(2.9)
2.3.2 Inferring the model
Using the assignment examples A∗ and the LP introduced in the previous section, the neces-
sary variables for the classification rules can be inferred. This can be done by solving the LP.
Given that Cj(a, bh) gives a binary outcome (Cj(a, bh) ∈ {0, 1}), the linear program is in fact
a mixed integer program (MIP). All other variables are continuous.
Given the number of constraints, variables and alternatives, solving the MIP manually is
33

infeasible. However, many software solutions are available for solving large-scale mixed integer
programs. Popular examples of such are AIMMS1, IBM ILOG CPLEX Optimization Studio2
and MATLAB3. The problem with these examples is that they are proprietary. Fortunately,
there are also free open source alternatives, such as GLPK (GNU Linear Programming Kit)4.
GLPK is capable of solving linear programs using the revised simplex method [24] and the
primal-dual interior point method for non-integer problems [26]. For mixed integer programs,
the branch and bound algorithm is used [22], together with Gomory’s mixed integer cuts
[13]. Aside from its LP/MIP solver, GLPK contains an application programming interface
(API) which allows GLPK to be integrated with other applications. As a result, many
wrappers for other programming languages have been published, such as wrappers for Java,
Python, Perl and R. From these wrappers, we have chosen Rglpk, an interface to GLPK for
R, the programming language for statistical computing.5 Given Rglpk’s high-level interface
to the GLPK package and R’s matrix manipulation capabilities, which will be useful for
implementing the MIP, Rglpk is a perfect solution for solving the MIP. Additionally, both R
and Rglpk are free and open source.
Rglpk requires the MIP to be encoded in matrix form, much like the tableau for the simplex
algorithm for solving LPs. The input takes the form of (O,d, r,o), where O is a matrix
that contains the coefficients for all variables in the MIP for each constraint, d is a vector
containing the direction of the constraints (i.e., <, ≤, >, ≥ or =), r is a vector containing the
right hand side of the constraints, and c contains the coefficients for the objective function.
The matrix O is an m × n matrix, where m is the number of constraints, and n is the
number of variables in the MIP. To fill O with the coefficient values, the constraints must
be reformulated such that each variable presented in the MIP is included in each constraint.
This forces each constraint to have the same number of variables. To deal with the variables
that were initially not part of the constraint, their coefficient can simply be set to 0 in O.
Additionally, each constraint containing a variable with indices must be constructed as many
1http://www.aimms.com/2http://www-01.ibm.com/software/integration/optimization/cplex-optimization-studio/3http://www.mathworks.com/products/matlab/4http://www.gnu.org/software/glpk/5http://cran.r-project.org/web/packages/Rglpk/index.html
34
times for all possible combinations for the indices as defined in the constraints.
Initially the number of constraints m = 9, given that there are nine constraints defined
in the MIP in Equation 2.9. However, given that the second constraint should hold for all
j ∈ J and 2 ≤ h ≤ k − 1, the constraint requires |J | × (k − 2) instances. A similar argument
applies for the remaining seven constraints. An exception is the first constraint, which only
considers wj for all j ∈ J . This constraint can be entirely represented by one row in O.
The initial number of variables n = 7, given the number of variables in the MIP. These are
s, λ, wj , gj(a), gj(bh), Cj(a, bh), and σj(a, bh). The variables δj and Mj are not considered,
as they can be calculated using the criteria performances and thus do not need to be inferred
by the MIP. Similarly, δλ is not considered, because it is kept constant at 0.001. However,
the actual value for n depends on the number of criteria, classes and alternatives. This is
different for each case.
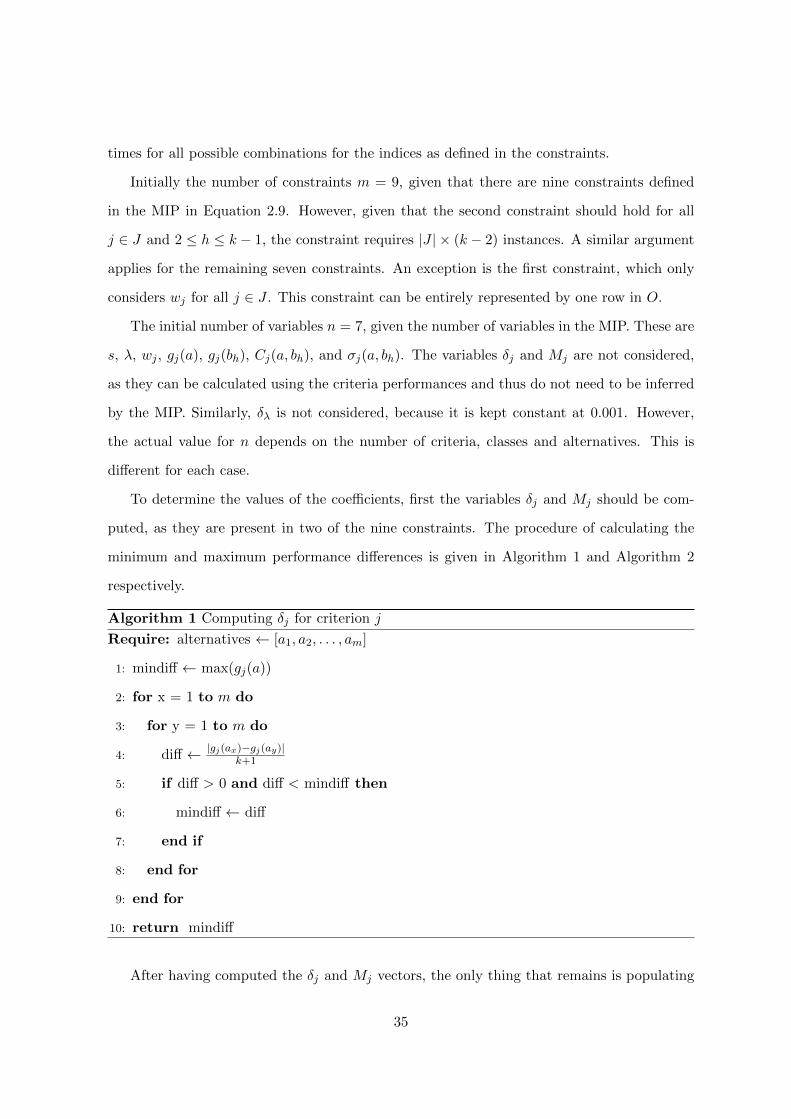
To determine the values of the coefficients, first the variables δj and Mj should be com-
puted, as they are present in two of the nine constraints. The procedure of calculating the
minimum and maximum performance differences is given in Algorithm 1 and Algorithm 2
respectively.
Algorithm 1 Computing δj for criterion j
Require: alternatives ← [a1, a2, . . . , am]
1: mindiff ← max(gj(a))
2: for x = 1 to m do
3: for y = 1 to m do
4: diff ← |gj(ax)−gj(ay)|k+1
5: if diff > 0 and diff < mindiff then
6: mindiff ← diff
7: end if
8: end for
9: end for
10: return mindiff
After having computed the δj and Mj vectors, the only thing that remains is populating
35

Algorithm 2 Computing Mj for criterion j
Require: alternatives ← [a1, a2, . . . , am]
1: Mj ← max(gj(a)
)− min
(gj(a)
)+ k × δj
2: return Mj
the O matrix with the coefficients according to the constraints in the MIP in Equation 2.9.
Similarly, the d, r and o vectors can be derived from the MIP. A full implementation of the
MIP in R using the Rglpk package is made available at https://github.com/jeroenvdmeer/
master-thesis. This implementation is used in the next chapter for the case study, in which
the multi-criteria decision aid model is put into practice to classify organizations into risk
classes based on the results of technical assessments and company information. By having
this method of eliciting an ELECTRE TRI multi-criteria decision aid model concludes the
answer to our first subquestion: How can the assignment of organizations to the appropriate
risk class be modeled?
36

Chapter 3
Case study
Using the ELECTRE TRI elicitation procedure, we will construct a model to classify organiza-
tion into risk classes based on technical assessments and information about the organization.
First, we will focus on the second sub question: What criteria influence the risk of cyber-
security attacks? Second, using this information, we will elicit the ELECTRE TRI model.
Last, this ELECTRE TRI model will be tested on a new and unseen organization to answer
the third and final sub question: How robust is the classification model?
3.1 Data collection
During my internship at Ernst & Young, I had access to a number of reports about the
information security assessment of several organizations. From these information security
assessments, only the reports that describe the results of the external attack & penetration
tests on web applications are selected, as this thesis focusses on web applications. The names
of the organizations for which the external attack & penetration tests are performed, or
anything that could be used to identify the organization, are stripped from the reports for
this thesis in order to preserve the privacy of these organizations.
The data collection process consists of two parts. In the first part the attack & pene-
tration test reports are analyzed. During this analysis the individual steps of an external
attack & penetration test are examined. These steps eventually lead to the risk level that
the organization is assigned to. In the second part of the data collection process the most
37

important steps of the attack & penetration test reports are selected. These will be used in
the following chapters. The selection procedure is performed based on a number of interviews
with the security experts of Ernst & Young.
3.1.1 Attack & penetration reports
The attack & penetration reports gathered for this thesis all describe an attack & penetration
test performed for a specific client. These tests are conducted on one or more web applications
that fall under the control of the client. The reports range from 2001 till 2011. During this
decade, the structure of the reports have changed significantly, but the methodology of the
attack & penetration tests have not changed much. The goal of the attack & penetration
tests is, while starting with very little information about the target web application, to gather
more information in order to identify and exploit a weak spot. The procedure consists of five
phases. First, information about the target systems is gathered. This is followed by checking
which services are running on the actives systems. This is done by scanning the ports of
the actives systems. Third, more information about the software and its version is gathered.
Fourth, vulnerabilities in the services are searched for. Last, when vulnerabilities are found,
they are tried to be exploited.
The attack & penetration test is initiated with a series of queries to gather information
about the target systems, such as information about the ownership of the IP addresses and
the domain names. This can become a vulnerability when the IP addresses or the domain
names are owned by third parties. In that case the organization might suffer from problems of
this third party, such as bankruptcy. Another option where the ownership of the IP addresses
or domain names could be a threat is when these are registered to a specific employee of the
organization. This employee could become a target of attackers, or the organization could
have a problem when this employee leaves.
Aside from information about the ownership of the IP addresses and domain names,
Domain Name System (DNS) servers might also expose interesting information about other
systems connected to the target system. Using DNS, domain names can be translated to
IP addresses. This is done on a nameserver. These nameservers can also be used to get an
38

overview of all the connected systems that are bound to a specific domain name. This is done
by performing a zone transfer. However, most nameservers are configured to not allow zone
transfers. In such a case, the nameserver can also be scanned for common systems.
From the list of systems that have been identified, a subset is made by selecting only the
active systems. This can by checking which ports on the systems respond to a request. More
information about the services that are running on these ports is then gathered. This can be
a web server, mail server, etc. In order to identify what software and which version is running,
data is gathered from these services. This is called banner retrieval. This can be data such as
login prompts, error messages or anything that can hint towards the use of specific software
or a specific version of that software.
After having collected all the relevant information about the systems that are exposed on
the internet, the intrusion phase is initiated. The purpose of this phase is to find vulnerabilities
in the identified systems and software to attack and penetrate the target web application.
Examples of vulnerabilities in web applications could be anything from the OWASP Top 10,
as is described in the previous chapter. However, this could also be done via vulnerabilities in
other services. It is a creative process that can be done with the help of automated software,
but also manual work. After one or more exploitable vulnerabilities are found, the attack &
penetration test is concluded by trying to exploit the vulnerabilities that were found.
The attack & penetration reports describe many of these tests, and can serve as a basis
for constructing the classification model. A subset of twenty tests have been analyzed. The
results are displayed in Table 3.1. In this table, the 22 variables that were present in these tests
are laid out, together with their range. In case of a numerical variable, the range consist of
the lowest observed value until the highest observed value. For the string variables (variables
2, 3 and 8) the possible values are listed. Variable 5 can either be an integer, or can contain
the value “Not allowed” in case zone transfers are disabled on the tested nameservers of the
target web application.
39

Table 3.1: An analysis of the variables in a subset of twenty attack & penetration reports.
# Variable Range
Information gathering
1 Number of systems [1, 151]
2 Ownership IP address {“Third party”, “Employee”, “Organization”}
3 Ownership domain names {“Third party”, “Employee”, “Organization”}
4 Reverse DNS [0, 110]
5 Zone transfer “Not allowed” or [0, 110]
6 DNS scanner [0, 31]
Port scanning
7 Open ports [1, 242]
8 IDS/IPS installed {“Yes”, “No”}
Banner retrieval found
9 Web servers [0, 159]
10 Mail server [0, 11]
11 Firewall [0, 15]
12 File server [0, 3]
OWASP Top 10 web application vulnerabilities found
13 Injection [0, 2]
14 Cross-site scripting [0, 4]
15 Broken authentication [0, 2]
16 Insecure direct object references [0, 2]
17 Cross-site request forgery [0, 2]
18 Security misconfiguration [0, 11]
19 Insecure cryptographic storage [0, 2]
20 Failure to restrict URL access [0, 1]
21 Insufficient transport layer protection [0, 5]
22 Unvalidated redirects and forwards [0, 1]
40

3.1.2 Variable selection
The variables in Table 3.1 were extracted directly from the attack & penetration reports.
However, not all variables might be of influence on the risk of a cyber-security attack. In
order to get a better insight in the variables and how these could have an influence on the
risk of a cyber-security attack, several security experts of Ernst & Young who are familiar
with the attack & penetration reports have been interviewed. Using these results, the list of
variables in Table 3.1 have been revised. The revised list of variables is presented in Table
3.2 on page 44.
Interview security expert 1
During the interview of the first security expert it quickly became clear that not all variables
might have the same level of influence as others. For example, the security expert explained
that the variables listed as the information gathering variables in Table 3.1 are interesting in
the sense that they reveal a lot of information about the target web application. However,
finding a lot of information only makes the remaining steps of the attack & penetration tests
easier. It does not necessarily hints towards a vulnerability. On the other hand, when a lot of
information can be found during this phase, it could give an indication that the organization
knows little about information security.
Contrary to the information gathering variables, the numbers of open ports can give
a good indication about the possible existence of dangerous vulnerabilities. When specific
ports are open, important systems could be exposed to the internet, which is most of the
time unnecessary. The security expert advised to not consider the total amount of open
ports found, but instead only consider the number of open ports on the active systems. Some
servers with a lot of open ports might not be used actively, such as a test server. Additionally,
the security expert advised to list the most dangerous ports to have open and only check for
those. For instance, a web server running a web application usually has port 80 open, the
default port for web servers. This is not very interesting. It is more interesting to know if the
system has opened ports for remote access services, such as SSH or WebDAV. The numbers
about the open ports should also be in relation to the total numbers of tested servers. When
41

an attack & penetration test targets fifty servers, it is obvious that a larger total amount of
open ports is found than for test on only one server.
Regarding the banner retrieval, the security expert advised to focus on the information
found about the outdated software. It is interesting to know what software is running on the
servers, but it makes it more interesting when the installed version of this software is out of
date. Software is generally also updated with security patches. So when outdated software
is found, it could be the case that this version still contains unpatched vulnerabilities that
could be used later in the exploiting phase.
The security expert concludes that the OWASP Top 10 vulnerabilities are the most impor-
tant to focus on when focussing on web applications. The security expert recalls that during
his work, this is where most of the serious issues are found. However, this is also where most
of the work is put into, as searching for these vulnerabilities is mostly performed manually.
Interview security expert 2
The second security expert pointed out that ownership of the IP addresses and domain names
has become a less interesting variable as the organizations who manage this information have
reduced the amount of information that is made public. Also the associated risk is limited.
However, the security expert does note that organizations that have taken care to reduce
the information about the ownership of the IP addresses and domain names themselves do
show that they are aware of the associated risks. The same argument applies for the other
information gathering variables. Although they do not pose a big risk, they can give an
indication of the security awareness that is present in the organization.
Like the previous security expert, the importance of the port scan and the banner retrieval
variables is reflected in this interview. The security expert also advised to consider the amount
of open ports relative to the number of systems that were targeted in the test, instead of the
total amount of open ports found during the test. In its current form it is not possible to
compare the results with each other. Additionally, the security expert notes that adding
banner retrieval for telnet and SSH services is advised.
The security expert explained that the conclusion about the risk level not only depends
42

on the selected technical variables, but also by judging how important the target application
is for the organization. Additionally, some organizations work with sensitive data more than
others. An incident with an application of those organizations have a higher impact than
with organizations that process less sensitive data. The security expert explained that this
is related to the branch of organizations. In general, organizations operating in the financial
market are faced with a higher impact than organization in other markets, such as nonprofit
organizations.
Interview security expert 3
In line with that the second security expert told, the third security expert noted that despite
the emphasis on technical properties of the evaluated systems in the reports, the business pro-
cess of which the evaluated system belongs to should also be taken into account. He suggested
adding a variable that describes the importance of the evaluated systems for the business con-
tinuity of the organization, and the impact that a successful attack on this application could
have.
Revised list of variables
After the interviews with three security experts, it seemed unreasonable to continue working
with the initial set of variables presented in Table 3.1 on page 40. The revised set of variables
is presented in Table 3.2. First, as advised by security expert 3, a risk level was added that
indicates how critical the tested web application is for the organization. This risk level was
assigned by the security experts for each attack & penetration test on a scale from 1 till 5,
where 1 indicates that the web application is least critical to the organization, and 5 indicates
that the organization heavily relies on the application. Second, the amount of dangerous open
ports is measured, instead of total number of open ports. For this research, the ports 445,
SSH, telnet, NetBIOS and SMB are regarded as the most dangerous ports, as suggested by
the security experts. Additionally, the total number of open dangerous ports is divided by
the number of servers tested. Third, the presence of an Intrusion Detection System (IDS) or
Intrusion Protection System (IPS) is considered. Fourth, only the outdated software from the
43

Table 3.2: The variables from the attack & penetration reports that will be used throughout
this thesis.
# Variable Range
1 Risk level of web application [1, 5]
2 Dangerous open ports per server N
3 Availability of an IDS/IPS [0, 1]
4 Outdated software N
5 Injection vulnerabilities N
6 Cross-site scripting vulnerabilities N
7 Security misconfiguration N
banner retrieval is considered. The remaining three variables are selected from the OWASP
Top 10 web application vulnerabilities as they are the easiest to check with minimal manual
labor, and are three of the most significant vulnerabilities from the OWASP Top 10.
Going back to the risk equation in Equation 1.2, the first variable in Table 3.2 can be
mapped to the Impact variable, whereas the other six variables in Table 3.2 represent the
Vulnerability variable. As the attack & penetration reports contain little information about
the threats that the organizations suffered from at the time the reports were written, the
Threat variable is assumed to always be 1. This would imply that all organizations are
always under the threat of a cyber-attack. This is, given the large amount of cyber-attacks
each day, not an unrealistic assumption.
Using the variables selected in this section, an answer to the second sub question (What
criteria influence the risk of cyber-security attacks? ) has been constructed. With these
variables and the data from the attack & penetration results, the elicitation of the ELECTRE
TRI model can begin.
44

Table 3.3: The resulting variables for the optimal classification model.
λ w1 w2 w3 w4 w5 w6 w7
0.5005 0.2 0.2 0 0.2 0.2 0 0.2
Table 3.4: The minimum requirements for risk level Medium.
g1 g2 g3 g4 g5 g6 g7
1.25 1.25 0.25 0.25 0.25 1.25 1.25
Table 3.5: The minimum requirements for risk level High.
g1 g2 g3 g4 g5 g6 g7
2.25 4.25 0.5 1.25 0.5 2.25 2.25
3.2 ELECTRE TRI model elicitation
Using the available assignment examples and having identified the criteria that influence the
risk of cyber-security attacks, an ELECTRE TRI model can be inferred. For this purpose,
the R program that is available at https://github.com/jeroenvdmeer/master-thesis has
been utilized. This program is an implementation of the procedure described in Section 2.3.2
and is capable of inferring the profiles, criteria weights, and λ cutting level needed for our
classification model. The assignment examples are available in Appendix A. The results are
given in Tables 3.3, 3.4 and 3.5.
The profiles, criteria weights, and λ-cutting level obtained using the described elicitation
procedure can be used in an ELECTRE TRI model for assigning new alternatives to either
of the three risk classes. The weights w1, w2, . . ., w7 in Table 3.3 describe the relative
importance of the seven criteria presented in Table 3.2. From solving the MIP is appears that
g3 (Availability of an IDS/IPS) and g6 (Cross-site scripting vulnerabilities) actually have no
influence on the classification at all, despite the results of the three interviews with the three
security experts in the previous section, given their weight level of 0. This means there is
no significant difference found in the performance on these criteria between the assignment
examples in the different classes. The remaining five criteria equally divide the pie, resulting
in weights of exactly 0.2 for g1, g2, g4, g5, and g7. This means each of the five remaining criteria
are equally important in the classification process.
45

The profile values are laid out in Tables 3.4 and 3.5. The values in Table 3.4 describe the
minimum performance requirements for new alternatives to be assigned to c2, the Medium
risk class. Similarly, the results in Table 3.5 describe the performance requirements for new
alternatives to be classified in c3, the High risk class. Given the λ-cutting level of 0.5005, this
means that three of the latter five criteria are enough to classify an alternative in either of
the three classes. For instance, if an alterative has a performance of 3 on all criteria, it is
assigned to c3 (High), because it outperforms profile b2 on criteria g1, g2 and g7. The sum of
the weights of these three criteria is 0.2× 3 = 0.6, which is higher than the λ-cutting level of
0.5005.
An overview of the final model is presented in Fig. 3.1. This figure depicts the seven
criteria, together with the profile values that separates the classes c1 (Low), c2 (Medium) and
c3 (High). The criteria g3 and g6 appear differently from the other criteria, because solving
the MIP has revealed that their presence have no influence on the classification.
Aside from the classification of new alternatives that the values in Tables 3.3, 3.4 and
3.5 allow, they also serve a different purpose. By having the values for all seven criteria
identified in the previous chapter, they provide a simple understanding of the fundamental
thought process of the security experts at Ernst & Young. Using the ELECTRE TRI model,
it is also much easier to explain why one organization suffers from less risk than another
organization. Additionally, the model can also be used to explain how to reduce the risk that
a web application suffers from after it has been classified using the ELECTRE TRI model.
This becomes more evident when having the ELECTRE TRI model implemented using the
elicitation results from the assignment examples. The process of implementing this model is
explained in the next chapter.
3.3 Testing the performance of the ELECTRE TRI model
Having the ELECTRE TRI model elicited, we can not say anything about its quality without
evaluating its performance. For this, we have taken never before seen data from a attack &
penetration test of an organization, have it classified by the ELECTRE TRI model, and have
a security expert familiar with the data evaluate the classification result. The performance
46

Figure 3.1: A schematic overview of the final ELECTRE TRI model.
47

Table 3.6: The performance results of the organization used for evaluation.
Criterion Performance
g1 Risk level of web application 5
g2 Dangerous open ports per server 0
g4 Outdated software 0
g5 Injection vulnerabilities 1
g7 Security misconfiguration 4
of the organization is presented in Table 3.6. During this evaluation, an answer to the third
and final sub question is constructed: How robust is the classification model?
Given that the organization has stored a significant amount of personal data about Dutch
citizens in their web applications and the associated loss of goodwill if something were to
happen to this data, the initial risk level of this organization was set to the highest value: 5.
Given the large amount of systems that were part of the scope of this attack & penetration
test, the dangerous open ports and outdated software per server was 0, despite that some
issues were found. However, there was one SQL injection found that allowed for manipula-
tion of data stored in one of the databases. Aside from the SQL injection, several security
misconfigurations were also identified. Using the model depicted in Fig. 3.1, the risk class to
which this organization should be assigned can be determined.
Given that the implemented ELECTRE TRI approach utilizes the pessimistic outranking
procedure, the performance of this organization should first be compared to profile bk−1. [2]
In the model presented in this thesis, this is b2. By comparing the performances in Table 3.6
with profile b2 in Table 3.5, it can be concluded that this organization outranks profile b2 on
three criteria. Given that these criteria all have importance weights of 0.2, the sum of the
weights (0.2×3 = 0.6) is greater than the λ cutting level (0.5005). Therefore, the organization
should be assigned to the risk class High. This is confirmed by a security expert who has
worked on this attack & penetration test. His response to the classification result: “This
risk associated with this organization is definitely high. Given the size of the organization,
the sensitive data that it has about Dutch citizens, and the issues that we found during our
48

technical assessments, there is no other classification result possible.” With this conclusion,
it can be confirmed that the model presented in this chapter is indeed capable of generating
accurate results that reflects the professional judgement of the security experts at Ernst &
Young.
49

Chapter 4
Model implementation
Having the ELECTRE TRI parameters elicited in the previous chapter, the ELECTRE TRI
model is complete and can be used to classify new web applications into either of the three risk
classes. To make the use of the model more convenient, we have implemented the model as
a web application available at http://xhack.me/jeroenscriptie/, as depicted in Fig. 4.1.
Having the model implemented as a web application makes the classification process easier,
because it no longer requires the decision maker to do the calculations of the ELECTRE TRI
outranking manually for each new alternative. The implementation process is described in
this chapter.
We have chosen to implement the ELECTRE TRI model as a web application, because
the available computer languages for creating web applications allow for easy development of
user interfaces compared to the solutions for creating desktop applications. Additionally, web
applications can run on any machine with a web browser and an internet connection, without
any installation required. The user interface is expressed using a combination of HTML and
CSS, whereas for implementing the ELECTRE TRI model with the outranking algorithm,
JavaScript was selected. JavaScript also has the advantage that it can easily interact and
modify the user interface, allowing for a much richer user experience for the decision maker.
In order to avoid confusion with the web applications that are to be classified, our web
application that has implemented the ELECTRE TRI model will be referred to as the model
implementation from here on. In the remainder of this section, the input for the model
50

Figure 4.1: A screenshot of the model implementation.
implementation, the ELECTRE TRI outranking algorithm for the classification, and the
output of the model implementation is discussed.
4.1 Model input
In order to initiate the classification process of an origanization, the ELECTRE TRI model
requires a number of variables. Alongside of the ELECTRE TRI parameter variables that
were elicited in the previous chapter, the model requires the performance levels of the web
application that is to be classified, as defined in Table 3.2 on page 44. Criteria g3 and g6
are excluded, because their weights were 0 in Table 3.3. For each of these five criteria, the
model implementation has an input field that allow input values as defined by the ranges in
Table 3.2. Note that because the performance of the criteria can only be integers, the profile
values have been rounded up. For instance, 0.5 dangerous open ports in impossible. Similarly,
you can not find 1.75 security misconfigurations. Using the performance variables of the web
application, the outranking procedure is initiated.
51
4.2 Outranking procedure
In order to assign an organization into one of the three risk classes, the performance variables
are compared against the profiles that separate the three classes, as described in Section
2.2.2. The implemented outranking procedure takes the pessimistic approach. A detailed
overview of the pessimistic outranking procedure is given in Algorithm 3. This algorithm
consists of five main steps. First, it takes the values of the input fields (line 1). Second, it
iterates through both profiles and sets the variable sum to 0, starting with the last profile, as
is required in the pessimistic approach (lines 2–3). Third, for each profile, it iterates through
all criteria (line 4). Fourth, it checks for each criteria whether the input value for the new
web application outperforms the current profile. For each criterion that is outperformed,
the weight of this criterion is added to the sum variable (lines 5–7). Fifth, if a majority
of the criteria outperforms the profile, the organization is assigned to the appropriate class.
Otherwise, the organization is assigned to the first class: Low (lines 9–13). The lambda
variable describes what a majority is, as described in Equation 2.6 on page 27.
4.3 Model output
Based on the results of the outrank procedure described in the previous section, the model
implementation displays the class in which the organization belongs to, according to the
ELECTRE TRI model. Aside from the end result, the ELECTRE TRI model has the in-
teresting property that it allows the decision maker to understand why a web application is
assigned to a specific class in comparison to statistical classification methods. By visualizing
Fig. 3.1 next to the input fields, as can be seen in Fig. 4.1, the classification results becomes
evident. This visualization displays per criterion which class the organization should be as-
signed to. This allows the decision maker to easily pinpoint which criteria the organization
should focus on in order to reduce its risk against cyber-security attacks. For instance, the
example in Fig. 4.1 displays the results for a web application with a risk level of 4 out of 5.
This indicates that the web application is vital for the business continuity of the organization.
By combining this with the fact that the web application also has an SQL vulnerability, the
52

Algorithm 3 The ELECTRE TRI pessimistic outranking procedure.
Require: classes ← [c1, c2, c3]
Require: profiles ← [[2, 2, 1, 1, 2], [3, 5, 2, 1, 3]]
Require: weights ← [0.2, 0.2, 0.2, 0.2, 0.2]
Require: lambda ← 0.5005
1: input ← [x1, x2, x3, x4, x5]
2: for i = length(profiles) to 1 do
3: sum ← 0
4: for j = 1 to length(profiles[i]) do
5: if input[j] ≥ profiles[i][j] then
6: sum ← sum + weights[j]
7: end if
8: end for
9: if sum ≥ lambda then
10: return classes[i + 1]
11: end if
12: end for
13: return classes[1]
53

organization is said have a high risk against cyber-security attacks. Because the risk level
is probably not easily reduced, the organization should first focus on fixing the SQL vulner-
ability. Additionally, because of the many security misconfigurations that also present, the
organization will likely be classified as Medium risk after the SQL vulnerability is taken care
of. Therefore, to be promoted to the Low risk level, the security misconfigurations should be
fixed next.
54

Chapter 5
Conclusion
In this thesis an answer was constructed for the main research question Can company char-
acteristics and results of technical assessments be used to classify the risk of cyber-security
attacks? The research was initiated by analyzing the reports about attack & penetration tests
performed by Ernst & Young. These reports described how a technical assessment was per-
formed on a web application. During this analysis and interviews with three security experts
of Ernst & Young, seven most important criteria were identified for assessing the risk that an
organization faces based on the attack & penetration test on one of their web applications.
Also, using the data in the attack & penetration reports, a multi-criteria decision aid model
was constructed for assessing the risk of an organizations. For this purpose, an ELECTRE
TRI model was chosen and inferred using a mixed integer program. Subsequently, this model
was implemented as a web application for a more user-friendly experience in future use.
The resulting model has a number of interesting properties. It gives a better understanding
of how the security experts at Ernst & Young approach the risk assessment of their clients after
an attack & penetration test. Using the identified criteria and the profiles of the ELECTRE
TRI model, their professional judgement for this classification task is unfolded. This approach
also fits perfectly into the plans of Ernst & Young to increase their efforts in data analysis
to improve their services. Using this model, the security experts can give a quicker and more
confident opinion about the risk of becoming a victim of a cyber-security attack, because the
ELECTRE TRI model constructed during this research is based on the knowledge embedded
55

inside the attack & penetration reports.
In addition to the advantages this model offers to the security experts of Ernst & Young, it
also makes it for organizations much easier to understand why they are classified in a certain
risk category using the profiles, weights and λ cutting level. For instance, an organization
can see on which criteria it performs worst. This information can also be used to prioritize
the hardening of the different information security measures.
Last, this thesis contributes to the field of multi-criteria decision aid, by employing an
ELECTRE TRI model for an information security problem. This approach is unique for
as far as we know. Additionally, most published articles proposing linear programs or mix
integer programs do not include sufficient technical details to enable easy implementation
of the mathematic program. In this thesis the required technical details are given to easily
reproduce the acquired results in addition to the complete source code of the application
developed for solving the mixed integer program to infer the ELECTRE TRI model.
In the next section the main research question and its sub questions are discussed in more
detail, followed by a section in which a number of approaches for future research are proposed.
5.1 Research questions
The central question in this thesis, “Can company characteristics and results of technical
assessment be used to classify the risk of cyber-security attacks?,” was split into three sub
questions. First, the question “How can the assignment of organizations to the appropriate
risk class be modeled?” was discussed in Chapter 2. In this chapter, several classification
techniques were described ranging from statistical classification to multi-criteria decision aid
methods. The latter seemed the most fitting technique for the problem at hand, given that
results from multi-criteria decision aid methods are very transparent. More specifically, the
profiles and weights of the ELECTRE TRI model explicitly define the differences between
classes, making it easy to explain the classification results. Chapter 2 is concluded with a
section specifying a mixed integer program to infer an ELECTRE TRI multi-criteria decision
aid model for the classification problem.
The second sub question, “What criteria influence the risk of cyber-security attacks?”
56

is discussed in Chapter 3, which discussed the specific case at hand. In this chapter, the
process of deriving the relevant criteria to measure organizations is described. This is done
by analyzing several attack & penetration reports from Ernst & Young, together with three
interviews with security experts working at the firm. This resulted in a list of criteria that were
to be used for building the ELECTRE TRI model. This model was built upon 27 assignment
examples, which were derived from attack & penetration reports dating from 2004 till 2012.
The elicitation procedure resulted in eliciting the importance weights for the criteria, the
profile values that serve as boundary values between the three classes, and a λ cutting level,
which defines how many criteria must be met for a new alternative to be assigned to a specific
class.
The third and last sub question, “How robust is the classification model?”, was also
discussed in Chapter 3 and was part of the case study. For the evaluation of the model, never
before seen data was used to verify whether or not the model produced accurate results. The
classification results were verified with a security expert from Ernst & Young, who concluded
that the results were accurate and reflected their opinion about the risk of cyber-security
attacks of the organization.
Using the results of the three sub questions, it can be concluded that company characteris-
tics and results of technical assessment can indeed be used to classify the risk of cyber-security
attacks of an organization. An example of such method is given in the form of the ELECTRE
TRI model that was inferred in this thesis. This model, which takes the performance of the
organization based on five criteria, is implemented as a web application for further use within
Ernst & Young by its security experts. It allows them to make a confident conclusion about
the risk of cyber-security attacks of its future clients.
5.2 Future work
Utilizing the knowledge gained from this research as a basis, more research opportunities
become evident. After analyzing the criteria that we identified in Chapter 3, it becomes
clear that the focus is mainly on the results of the technical assessments, and less on the
soft controls, such as defined in ISO 27001. The reason for this choice was the fact that
57

these criteria were easily quantifiable and were therefore more easy to compare between
different organizations. However, assessing information security is more than just technical
assessments, so extending the model presented in this thesis with soft controls might increase
the accuracy of the model.
Aside from extending the model with more soft controls, future work directions can also
be created by transforming the model presented in this thesis for different purposes. An
example of such is to create a ranking of organizations based on their risk level. Additionally,
modeling the classification process can also be used to evaluate the attack & penetration
process. For instance, by constructing the model, it became clear that two of the initial seven
criteria were not important at all for the classification. This information could be used to
determine whether or not the efforts that are put into measuring these criteria during the
attack & penetration process could be scaled down to reduce costs.
58

Chapter 6
Bibliography
[1] O. Cailloux. Dealing with numerical imprecision in mathematical programs for Electre
Tri models disaggregation . Technical Report 2012-02, Laboratoire Gnie Industriel, cole
Centrale Paris, mar 2012. Cahiers de recherche 2012-02.
[2] O. Cailloux, P. Meyer, and V. Mousseau. Eliciting ELECTRE TRI category limits for a
group of decision makers. European Journal of Operational Research, 2012.
[3] A. Calder and S. Watkins. IT Governance: A Manager’s Guide to Data Security and
ISO 27001/ISO 27002. Kogan Page Ltd, 2008.
[4] M. Castells. The Rise of the Network Society: The Information Age: Economy, Society,
and Culture Volume I, volume 12. Wiley-Blackwell, 2011.
[5] Computer Security Institute. 2010/2011 CSI Computer Crime and Security Survey. CSI
Computer Crime and Security Survey. Computer Security Institute, 2010.
[6] C. Cortes and V. Vapnik. Support-vector networks. Machine learning, 20(3):273–297,
1995.
[7] M. Deza and E. Deza. Encyclopedia of distances. Springer Verlag, 2009.
[8] L. Dias and J. Clımaco. ELECTRE TRI for groups with imprecise information on
parameter values. Group Decision and Negotiation, 9(5):355–377, 2000.
59

[9] L. Dias, V. Mousseau, J. Figueira, and J. Climaco. An aggregation/disaggregation ap-
proach to obtain robust conclusions with ELECTRE TRI. European Journal of Opera-
tional Research, 138(2):332–348, 2002.
[10] Ernst & Young. Into the cloud, out of the fog. Global Information Security Survey. Ernst
& Young, 2011.
[11] N. Falliere, L. Murchu, and E. Chien. W32.Stuxnet Dossier. White paper, Symantec
Corp., Security Response, 2011.
[12] L. Galway. Quantitative Risk Analysis for Project Management. A Critical Review, 2004.
[13] R. Gomory. An algorithm for the mixed integer problem. Technical report, DTIC
Document, 1960.
[14] S. Haikin. Neural Networks: A Comprehensive Foundation. 1998.
[15] K. Hong, Y. Chi, L. Chao, and J. Tang. An integrated system theory of information
security management. Information Management & Computer Security, 11(5):243–248,
2003.
[16] ISACA. The Risk IT Framework. Information Systems Audit and Control Association,
2009.
[17] ISO/IEC. ISO/IEC 27005:2008 Information technology – Security techniques – Infor-
mation security risk management. ISO/IEC, 2011.
[18] IT Governance Institute. COBIT 4.1. Information Systems Audit and Control Associa-
tion, 2007.
[19] E. Jacquet-Lagreze and Y. Siskos. Preference disaggregation: 20 years of MCDA expe-
rience. European Journal of Operational Research, 130(2):233–245, 2001.
[20] A. Jones and D. Ashenden. Risk management for computer security: Protecting your
network and information assets. Elsevier Butterworth-Heinemann, 2005.
60
[21] T. Klevinsky, S. Laliberte, and A. Gupta. Hack IT: Security through penetration testing.
Addison-Wesley Professional, 2002.
[22] A. Land and A. Doig. An automatic method of solving discrete programming problems.
Econometrica: Journal of the Econometric Society, pages 497–520, 1960.
[23] D. Landoll. The Security Risk Assessment Handbook: A Complete Guide for Performing
Security Risk Assessments. Taylor & Francis Group, 2010.
[24] I. Maros. Computational techniques of the simplex method, volume 61. Springer, 2003.
[25] W. McCulloch and W. Pitts. A logical calculus of the ideas immanent in nervous activity.
Bulletin of mathematical biology, 5(4):115–133, 1943.
[26] S. Mehrotra. On the implementation of a primal-dual interior point method. SIAM
Journal on Optimization, 2(4):575–601, 1992.
[27] D. Michie, D. J. Spiegelhalter, and C. Taylor. Machine Learning, Neural and Statistical
Classification. Ellis Horwood, 1994.
[28] V. Mousseau, J. Figueira, and J. Naux. Using assignment examples to infer weights for
ELECTRE TRI method: Some experimental results. European Journal of Operational
Research, 130(2):263–275, 2001.
[29] V. Mousseau and R. Slowinski. Inferring an ELECTRE TRI model from assignment
examples. Journal of Global Optimization, 12(2):157–174, 1998.
[30] D. Parker. Fighting computer crime. Scribner, 1983.
[31] F. Rosenblatt. The perceptron: A probabilistic model for information storage and orga-
nization in the brain. Psychological review, 65(6):386, 1958.
[32] B. Roy. Criteres multiples et modelisation des preferences: L’apport des relations de
surclassement. Cahiers de l’UER Sciences des organisations de l’Universite Paris IX-
Dauphine. Universite Paris-Dauphine, 1973.
[33] B. Roy. Methodologie multicritere d’aide a la decision. Economica, 1985.
61

[34] D. Rumelhart and J. McClelland. Parallel distributed processing: Psychological and
biological models, volume 2. 1986.
[35] C. Shannon and W. Weaver. The mathematical theory of communication. Number v. 1
in The Mathematical Theory of Communication. University of Illinois Press, 1949.
[36] A. Smith and N. Toppel. Case study: Using security awareness to combat the advanced
persistent threat. In 13th Colloquium for Information Systems Security Education, 2009.
[37] J. Vacca. Computer and information security handbook. Morgan Kaufmann series in
computer security. Elsevier, 2009.
[38] P. Vincke. Multicriteria Decision-aid. John Wiley & Sons Inc., Chichester, West Sussex,
England, 1992.
[39] D. Vose. Risk Analysis: A Quantitative Guide. Wiley, 2008.
[40] J. Williams and D. Wichers. OWASP Top 10 – 2010. The Open Web Application
Security Project, 2010.
[41] O. Yang, H. Shieh, J. Leu, G. Tzeng, et al. A VIKOR-based multiple criteria decision
method for improving information security risk. International Journal of Information
Technology & Decision Making, 8(2):267–287, 2009.
[42] B. Yu. Aide multicritere a la decision dans le cadre de la problematique du tri: concepts,
methodes et applications. Universite Paris-Dauphine, 1992.
62

Appendix A
Input data
Table A.1: The performances of the organizations used as input for the MIP.
g1 g2 g∗3 g4 g5 g6 g7 Assigned class
1 0 0 0 0 0 1 Low
1 0 1 2 0 0 4 Low
2 0 1 0 0 0 1 Low
3 0 0 0 0 0 1 Low
3 0 1 1 0 0 0 Low
1 0 0 3 0 2 2 Low
1 0 1 0 0 0 2 Low
2 0 1 0 0 0 1 Low
3 0 1 0 0 1 2 Low
1 0 0 1 0 0 0 Low
2 1 1 1 0 0 0 Low
1 0 1 1 0 1 2 Low
4 4 1 1 0 0 6 Medium
2 0 0 2 0 1 6 Medium
1 2 1 2 0 2 2 Medium
Continued on next page
63

Table A.1 – Continued from previous page
g1 g2 g∗3 g4 g5 g6 g7 Assigned class
2 0 0 1 0 1 5 Medium
3 0 1 1 0 2 7 Medium
3 0 1 1 0 1 3 Medium
3 2 0 1 0 2 5 Medium
2 0 1 1 0 0 5 Medium
5 0 1 2 0 4 11 High
4 0 1 1 1 1 3 High
4 0 1 2 0 0 6 High
3 0 1 1 1 1 8 High
5 0 1 0 2 1 6 High
4 21 1 0 0 0 5 High
4 0 1 1 1 1 4 High
* Note that criterion g3 (Availability of an IDS/IPS) is encoded as follows for ease of
implementation:
g3(a) =
0 if an IDS or IPS is available,
1 otherwise.
64