multi-channel collagen gel (mccg) as a biomaterial …...ii abstract m ulti-channel collagen gel...
TRANSCRIPT

Instructions for use
Title Multi-channel Collagen Gel (MCCG) as a Biomaterial Scaffold for Tissue Engineering
Author(s) KOH, Isabel Siew Yin
Citation 北海道大学. 博士(生命科学) 甲第13385号
Issue Date 2018-12-25
DOI 10.14943/doctoral.k13385
Doc URL http://hdl.handle.net/2115/72354
Type theses (doctoral)
File Information KOH_Isabel_Siew_Yin.pdf
Hokkaido University Collection of Scholarly and Academic Papers : HUSCAP

Multi-channel Collagen Gel (MCCG)
as a Biomaterial Scaffold for Tissue Engineering
組織工学のための生体材料足場としての
マルチチャンネルコラーゲンゲル(MCCG)
Transdisciplinary Life Science Course,
Graduate School of Life Science, Hokkaido University
KOH Isabel Siew Yin
Laboratory of Tissue and Polymer Sciences

i
Acknowledgements
First thanks must, of course, go to Prof. Naoki Sasaki, Prof. Akimasa Fukui, and Prof. Kazuya Furusawa for accepting me into their laboratory to pursue my doctoral studies, and to Prof. Hisashi Haga who “adopted” me into his laboratory after the other professors moved on to the next phases of their lives. Thank you for all the support, guidance, and for answering endless questions.
I would also like to thank the lab members from both the old and new laboratory, with whom I had many fun times which kept me sane throughout my studies. The discussions we had have certainly helped me in my research, and the “weird” Japanese that I picked up will probably be useful someday. Special thanks goes to Saki Yahata for helping me to settle into life in Japan when I first arrived, and to our secretary Aotsuka-san who gave me tremendous help and support, especially during the final stages of this doctoral course.
To family and friends outside of the laboratory, thank you to everyone for lending their ears during hard times, even though more often than not you probably have no clue what I am going on about. Having time to unwind whether with church friends, at Taekwondo, or hanging out with Star Trek buddies Sylvain and Daniel have kept me rooted, and the never-ending positive encouragement and advice have greatly helped me to push through and not give up.

ii
Abstract
Multi-channel collagen gel (MCCG) is prepared simply by dialyzing a phosphate buffer solution (gelation PBS) against collagen solution, and the phase separation of collagen solution yields a porous anisotropic hydrogel. The anisotropic property of the MCCG is supplied by the arrangement of collagen fibres parallel to the circumference of the channel lumen, and perpendicular to the axis of the channel. The aim of this dissertation was to explore the potential of MCCG as a biomaterial for tissue engineering.
The MCCG presents a porous hydrogel scaffold onto which cells may be seeded or encapsulated within to achieve a 3D culture system. In chapter 3, these seeding methods were tested using single cells and cell spheroids, and it was observed that kidney epithelial cells adhered to the surface of the channels when seeded, but formed cysts with a hollow cavity when encapsulated within the collagen matrix. Furthermore, PC12 cells encapsulated in normal collagen gel (COL) extended more neurites and grew in larger aggregates compared to those in MCCG. These findings suggest that even though various methods have been proposed for 3D culture systems, there still exists differences that affect the way cells behave.
Cell encapsulation techniques typically utilizes the concept of phase separation of a cell-containing polymer solution. In chapter 4, the movement of fluorescent particles, used as models of cells, in a phase-separating collagen solution was investigated. The formation of COL proceeds by nucleation and growth (NG) phase separation, while that of MCCG proceeds by spinodal decomposition (SD) phase separation, providing an opportunity to study both types of phase separation simultaneously. The particles were observed to move downwards in COL, and were homogeneously distributed. On the other hand, the particles in MCCG were observed to move mainly sideways and upwards, and were distributed in the collagen matrix region and not in the channels. It was found that the particles do not move in the same way as the phase-separating collagen, but rather is thought to be driven by the movement of water.
The alignment of collagen fibres and the restriction of available collagen-rich regions by the presence of the channels in MCCG make it a prospect for neural tissue engineering, given that the guidance of neurite growth is an important criteria for neural guidance conduits. In chapter 5, the alignment of collagen fibres in MCCG was investigated, and it was shown that the extension of PC12 cell neurites were significantly guided in MCCG compared to COL. It was also suggested that the MCCGs prepared with different ionic concentrations in this study, though having different degrees of collagen fibre alignment, were all within the threshold fibre alignment range required for contact guidance of neurites.
Overall, the simple experiments conducted in this dissertation point to the potential applications of MCCG as a scaffold in 3D culture systems and tissue engineering, as well as a tool for studying phase separation processes with relevance to the extracellular matrix (ECM), of which collagen is a major component. Nevertheless, further comprehensive studies are required to fully understand the intricate details about the properties of the MCCG and its formation mechanism.

Table of Contents
Acknowledgements ……………………………………………...……. i
Abstract ………………………………………………………………… ii
Chapter 1 Introduction 1.1 Scaffolds in Tissue Engineering ……………………………….. 1 - 2 1.2 Multi-channel Collagen Gel (MCCG) …………………………. 3 - 4 1.3 Phase Separation in COL and MCCG …………………………. 5 - 9 1.4 Research Objectives ……………………………………………… 10 1.5 References …………………………………………………… 11 - 12
Chapter 2 General Materials and Methods 2.1 Hydrogel Preparation – Horizontal Method ………………………. 13 2.2 Hydrogel Preparation – Vertical Method …………………………. 14 2.3 Cell Culture ……………………………………………………….. 14 2.4 Cell Seeding – Cells Seeded on Channel Surface …………………. 15 2.5 Cell Seeding – Cells Encapsulated in Hydrogel …………………... 15 2.6 Fluoresbrite Microspheres in Fluorescent Collagen Solution ……... 15 2.7 Fixation and Immunostaining …………………………………….. 16 2.8 Confocal Microscopy ……………………………………………... 16 2.9 Statistical Analysis ………………………………………………... 16
Chapter 3 Cell Seeding Methods in MCCG 3.1 Introduction ………………………………………………………. 17 3.2 Kidney Single Cells – Seeded and Encapsulated …………….. 18 - 19 3.3 PC12 Single Cells and Spheroids – Encapsulated ……………. 19 - 20 3.4 Summary and Conclusion ………………………………………… 21 3.5 References ………………………………………………………... 21

Chapter 4 The Movement of Particles during the Phase Separation Process 4.1 Introduction …………………………………………………. 22 - 24 4.2 Movement of Particles in NG and SD ………………………. 25 - 26 4.3 Rate of Channel Formation in MCCG ……………………..... 27 - 29 4.4 Velocity of Particles in COL and MCCG …………………… 30 - 32 4.5 Movement of Water and Particles …………………………… 33 - 34 4.6 Summary and Conclusion ………………………………………... 35 4.7 References …………………………………………………… 35 - 36
Chapter 5 Guided Neurite Extension in MCCG 5.1 Introduction …………………………………………………... 37 - 38 5.2 Determination of Collagen Fibre Alignment by CRM ………. 38 - 40 5.3 Neurite Growth in COL vs. MCCG …………………………... 41 - 43 5.4 MCCGs Prepared with Different NaCl Concentrations ……… 44 - 48 5.5 Neurite Growth in MCCGs with Different NaCl Concentrations ………………………………………………………………... 49 - 50 5.6 Summary and Conclusion ………………………………………… 51 5.7 References ………………………………………………….… 51 - 52
Chapter 6 Summary and Conclusion ……………………… 53 - 55

Chapter 1 Introduction 1
Chapter 1. Introduction 1.1 Scaffolds in Tissue Engineering Foreign materials have been used as medical tools meant to interact with the biological system long before the term “biomaterial” was coined, in forms such as seashells used as dental implants by the Mayan people, and linen sutures to close large wounds by the Egyptians (Ratner et al., 2013a). It is most likely that in those days, any readily available material that appears most likely to conform to the desired function was used. Today, meticulous studies are carried out to engineer fit-for-purpose materials, and the study of biomaterials and its applications as medical devices has expanded vastly to encompass not only a wide range of natural and synthetic materials (reviewed by Chan & Mooney 2008), but also a variety of manufacturing methods (reviewed by Subia, Kundu, and Kundu 2010) and designs to give rise to various materials that satisfy the requirements or desired properties of its intended purpose such as biocompatibility, biodegradability, mechanical properties, and scaffold architecture (O’Brien, 2011).
The field shows no sign of slowing down, as the search for the ideal combinations of materials, design, and properties to engineer replicas of native tissues for regenerative applications continues. The obvious first step in tissue engineering is to create a basic support scaffold onto which cells can attach, grow, and function. Decellularisation of cadaveric organs by perfusing them with detergents retains the intricate 3D anatomical structure of the native organ, and the acellular scaffold can then be re-seeded with cells. Organs such as kidney (Sullivan et al., 2012), lung (Petersen et al., 2010), and heart (Ott et al., 2008) of animal origin have been regenerated using this method, but several issues remain concerning the method, such as immunogenic risks, clinical grade reproducibility, and appropriate sources of organs and cells for recellularisation (Song and Ott, 2011).
Although currently lacking the level of intricate details of native tissues that can be obtained using decellularisation techniques, artificial scaffolds can be created in sterile laboratory settings in large quantities and under standard conditions. The design principles of artificial scaffolds are typically based on what nature has already designed. Many of the tissues and organs in the human body are porous in nature – for example, the spongy structure in cancellous bones, the alveoli or air sacs in lungs, the luminal villi in intestines and renal tubules in kidneys, and the lobules of liver. Albeit on different scales and with different structures, these porous features in most cases serve the purpose of increasing the efficiency of nutrient, waste, and gas transport in the tissues, by increasing the surface area to volume ratio. Hence, a porous design is often preferred for biomaterial scaffolds to improve mass transport into engineered tissue, as well as increase the surface area for cell adherence and tissue ingrowth into the scaffold (Ratner et al., 2013b).
Electrospinning, particle leaching, and gas foaming techniques are relatively simple and commonly used to achieve porous structures, whereas rapid prototyping or solid free-form (SFF) fabrication methods, which include 3D printing and stereolithography, offer great control and customisability but requires specialist knowledge of design software.
Chapter 1 Introduction 2
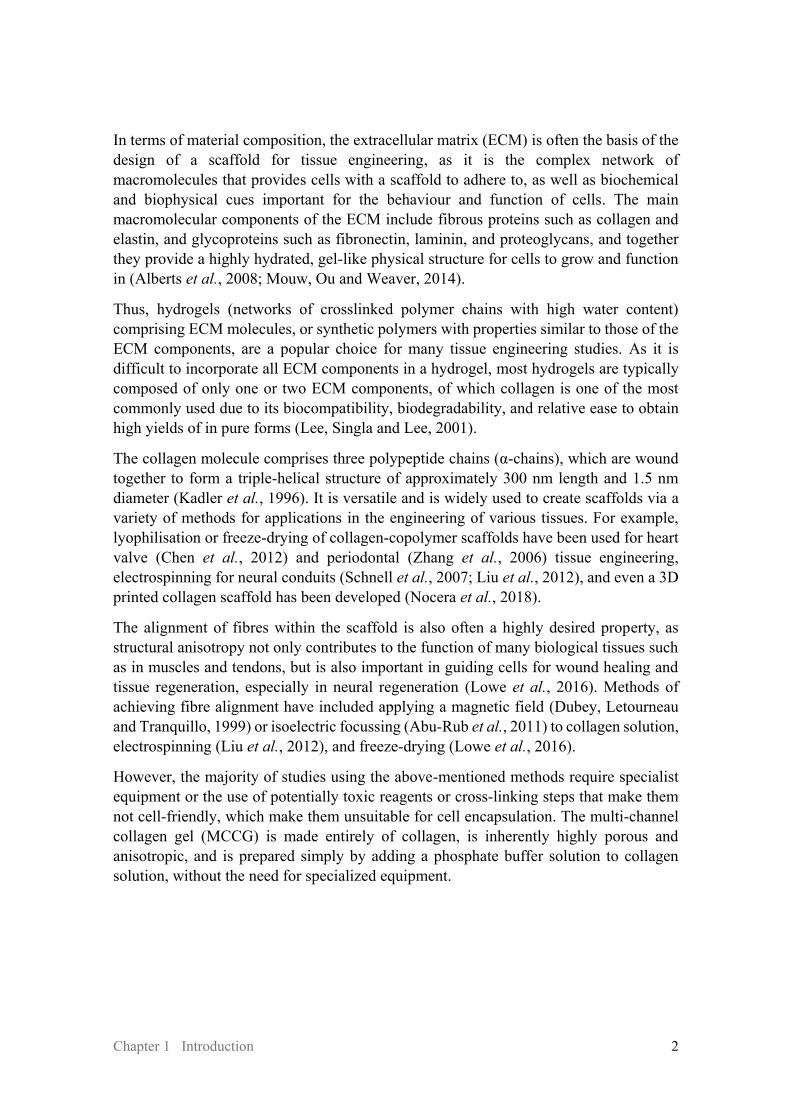
In terms of material composition, the extracellular matrix (ECM) is often the basis of the design of a scaffold for tissue engineering, as it is the complex network of macromolecules that provides cells with a scaffold to adhere to, as well as biochemical and biophysical cues important for the behaviour and function of cells. The main macromolecular components of the ECM include fibrous proteins such as collagen and elastin, and glycoproteins such as fibronectin, laminin, and proteoglycans, and together they provide a highly hydrated, gel-like physical structure for cells to grow and function in (Alberts et al., 2008; Mouw, Ou and Weaver, 2014).
Thus, hydrogels (networks of crosslinked polymer chains with high water content) comprising ECM molecules, or synthetic polymers with properties similar to those of the ECM components, are a popular choice for many tissue engineering studies. As it is difficult to incorporate all ECM components in a hydrogel, most hydrogels are typically composed of only one or two ECM components, of which collagen is one of the most commonly used due to its biocompatibility, biodegradability, and relative ease to obtain high yields of in pure forms (Lee, Singla and Lee, 2001).
The collagen molecule comprises three polypeptide chains (α-chains), which are wound together to form a triple-helical structure of approximately 300 nm length and 1.5 nm diameter (Kadler et al., 1996). It is versatile and is widely used to create scaffolds via a variety of methods for applications in the engineering of various tissues. For example, lyophilisation or freeze-drying of collagen-copolymer scaffolds have been used for heart valve (Chen et al., 2012) and periodontal (Zhang et al., 2006) tissue engineering, electrospinning for neural conduits (Schnell et al., 2007; Liu et al., 2012), and even a 3D printed collagen scaffold has been developed (Nocera et al., 2018).
The alignment of fibres within the scaffold is also often a highly desired property, as structural anisotropy not only contributes to the function of many biological tissues such as in muscles and tendons, but is also important in guiding cells for wound healing and tissue regeneration, especially in neural regeneration (Lowe et al., 2016). Methods of achieving fibre alignment have included applying a magnetic field (Dubey, Letourneau and Tranquillo, 1999) or isoelectric focussing (Abu-Rub et al., 2011) to collagen solution, electrospinning (Liu et al., 2012), and freeze-drying (Lowe et al., 2016).
However, the majority of studies using the above-mentioned methods require specialist equipment or the use of potentially toxic reagents or cross-linking steps that make them not cell-friendly, which make them unsuitable for cell encapsulation. The multi-channel collagen gel (MCCG) is made entirely of collagen, is inherently highly porous and anisotropic, and is prepared simply by adding a phosphate buffer solution to collagen solution, without the need for specialized equipment.

Chapter 1 Introduction 3
1.2 Multi-channel Collagen Gel (MCCG) Collagen hydrogels are commonly prepared by neutralizing the collagen solution and inducing a phase separation process, in which the collagen solution separates into a polymer-rich phase and a solvent-rich phase. The multi-channel collagen gel (MCCG) is similarly prepared simply by diffusing a phosphate buffer solution (gelation PBS; 20 mM Na2HPO4, 13 mM KH2PO4, pH ~7.14) into atelocollagen solution (5 mg/mL collagen in 1 mM HCl solvent, pH 3.0), yielding a collagen hydrogel with a high density of channels running through the gel from the “top” of the gel where the gelation begins. The diffusion of ions from the gelation PBS into the collagen solution, and that of ions out of the collagen solution into the gelation PBS neutralizes the collagen solution, and induces the collagen molecules to self-assemble into collagen fibrils (Furusawa et al., 2012). The polymerization and formation of a network of collagen fibres arrests the spinodal decomposition phase separation of the collagen solution, resulting in a hydrogel with a collagen-rich region (collagen matrix) and collagen-poor regions (channels) (Figure 1.1).
Figure 1.1 Formation of MCCG from collagen solution. Dialyzing acidic collagen solution against neutral gelation PBS induces the phase separation and gelation of collagen solution, giving rise to the multi-channel structure of MCCG.
At a glance, the MCCG appears to be isotropic under normal light due to the orderly structure of the channels. However, the MCCG has been shown to possess optical anisotropy – viewed under polarized light, the gel shows varying light intensities when rotated in different directions (Figure 1.2a, b) – and this anisotropic property is thought to be attributed to the parallel manner in which collagen fibres align circumferentially around the interface between the channel lumen and the collagen matrix region (Furusawa et al., 2012; Hanazaki et al., 2013). This parallel arrangement was also observed in confocal reflectance microscopy (CRM) images showing collagen fibres near the interface. The high intensity in the vertical direction in FFT images of cropped regions near the interface confirmed that the fibres are aligned parallel to the circumference of the channel lumen when viewed from the top, and perpendicular to the channel axis when viewed from the side (Figure 1.2c). The properties of MCCG – the multi-channel structures and aligned collagen fibres – can be attributed to the phase separation process.

Chapter 1 Introduction 4
Figure 1.2 Anisotropy and collagen fibre alignment of MCCG. (a) It had been shown that under natural light (A), the macroscopic multi-channel structure of the MCCG can be observed from the side view, and under polarized light (B, C), the MCCG showed birefringence – the gel transmitted different intensities of light when rotated at different angles. (b) From the top view of the gels, normal collagen gels (COL, right column) appear isotropic under natural, polarized, and circular polarized light. On the other hand, MCCG (left column) displayed birefringent properties near the edges of the channel lumen when viewed under polarized and circular polarized light. (c) CRM images showed that the collagen fibres in the cropped region (white rectangle) are aligned parallel to each other. This was confirmed in FFT output generated from the cropped images, showing high intensity in the vertical direction, which reflects a high degree of alignment in the horizontal direction in real space images. This supports the view that collagen fibres are arranged parallel to the channel circumference (top view), and perpendicular to the channel axis (side view). These observations show that the collagen fibres, particularly near the matrix-channel interface, are aligned parallel to the circumference of the channel lumen.

Chapter 1 Introduction 5
1.3 Phase Separation in COL and MCCG When a polymer solution that was initially in a miscible and stable state is subjected to certain changes in conditions (for example, a change in temperature or pH), the system becomes less stable, and the polymer and solvent begin to separate into a polymer-rich (solvent-poor) phase and a polymer-poor (solvent-rich) phase; in the case of collagen solution, the polymer-rich phase is the resulting collagen gel. If the solution is brought into a metastable state, where the system is stable to small fluctuations but unstable to large fluctuations, it undergoes phase separation via nucleation and growth (NG). Nuclei of the polymer are formed, which grow larger and larger as more and more polymer aggregate to the nuclei. On the other hand, if the solution is brought into an unstable state, where the system is unstable to even infinitesimally small changes, the solution phase separates via spinodal decomposition (SD). Bicontinuous regions that are polymer-rich and polymer-poor are formed, and as the phase separation proceeds, more and more polymers are added to the polymer-rich regions. If phase separation is allowed to proceed fully, two distinct phases of polymer and solvent are formed eventually. (Figure 1.3) (Bates, 1991; van de Witte et al., 1996; Favvas and Mitropoulos, 2008) In the formation of collagen hydrogels, the process of phase separation is arrested (pinned) by the formation of collagen fibre networks, preventing phase separation from proceeding further to the end and thus “locking in” the partially phase separated structure in the final architecture of the hydrogel.
Figure 1.3 Types of phase separation. Phase separation is triggered by a change in thermodynamic stability of the polymer-solvent mixture, for example by a change in temperature or pH. If the change results in a metastable state, the mixture phase separates by nucleation and growth (NG), which is characterized by the formation and growth of nuclei of the polymer. If the mixture because unstable after change is induced, the mixture undergoes phase separation via spinodal decomposition (SD), which is characterized by the formation of bicontinuous polymer-rich and polymer-poor regions which grow larger with time.

Chapter 1 Introduction 6
Reagents that have been used to prepare collagen gels without channel structures (referred to as COL hereafter) include NaOH-KH2PO4 by Wood and Keech, Ham’s F-12 by Forgacs et al., and DMEM in our own studies, and it has been reported that the formation of COL proceeds by NG (Wood and Keech, 1960; Forgacs et al., 2003), whereas the formation of MCCG by gelation PBS proceeds by SD (Furusawa et al., 2012, 2015). The difference in the type of phase separation induced is thought to be dependent on the ionic strength of the gelation solution (Table 1.1) that triggers the thermodynamic change – higher ionic strength leads to NG phase separation, whereas lower ionic strength leads to SD phase separation. Therefore, in this dissertation, DMEM was used to prepare COL and gelation PBS used to prepare MCCG.
Table 1.1 Composition and ionic strengths of gelation solutions. Ionic strength was calculated using the equation I = ½ ∑ci zi2, where ci is the ionic concentration in units of molarity (mol L-1 or mol dm-3, M) and zi is the number of charges on the ion.
Gelation PBS DMEM (Wako) Ham’s F-12 (Gibco) Na2HPO4 20 mM 1 mM
KH2PO4 13 mM
NaH2PO4 0.9 mM
CaCl2 1.8 mM 0.3 mM KCl 5.4 mM 3 mM NaCl 110 mM 130 mM NaHCO3 44 mM 14 mM
MgSO4 0.8 mM
MgCl2 0.6 mM Ionic strength, I 0.073 0.119 0.152
The differences in the formation mechanism of COL and MCCG are illustrated and described in detail in Figures 1.4 and 1.5, respectively, but essentially, homogenous COL is formed by the NG phase separation of collagen solution, and the multi-channel architecture of MCCG arises from the SD phase separation of collagen solution into collagen-rich (matrix) and collagen-poor (channel) regions.

Chapter 1 Introduction 7
Figure 1.4 Through nucleation and growth (NG) phase separation, a homogenous collagen hydrogel (COL) is formed. Top and side view columns show representations of collagen molecules (thin red lines) and polymerized fibres (thick blue lines) in the xy and xz planes, respectively. Before gelation is induced (t0), collagen molecules are homogenously distributed throughout the solution. After gelation is induced by the addition of DMEM (t1), numerous nuclei of collagen fibres are formed as the collagen molecules are polymerized. As gelation proceeds (t2), the nuclei grows in size by the further polymerization of collagen to the nuclei, and the branches also intersect with one another. Eventually, at the end of gelation (t3), a homogenous network of collagen fibres is obtained.

Chapter 1 Introduction 8
Figure 1.5 Through spinodal decomposition (SD) phase separation, a multi-channel collagen hydrogel (MCCG) is formed. Top and side view columns show representations of collagen molecules (thin red lines) and polymerized fibres (thick blue lines) in the xy and xz planes, respectively. Before gelation is induced (t0), collagen molecules are homogenously distributed throughout the solution. After gelation is induced by the addition of gelation PBS (t1), numerous regions with low concentrations of collagen (grey areas) are formed, with the collagen fibres arranged around the circumference of these regions. As gelation proceeds (t2), the diluted regions continue to grow in size, and collagen molecules continue to polymerize in the concentrated regions, forming the channel structures seen in MCCG. Eventually, at the end of gelation (t3), a hydrogel with a collagen matrix interspersed with numerous channel structures is obtained. The alignment of collagen fibres parallel to one another is a result of the most effective arrangement to minimize the high surface free energy caused by the high number of matrix-channel interfaces. The increase in channel size from the top to bottom of is thought to be due to the preference of collagen molecules in the collagen solution to move towards regions of high collagen molecule concentration (matrix region) and polymerize with the collagen fibre network.

Chapter 1 Introduction 9
The SD phase separation that yields MCCG creates a high number of matrix-channel interfaces, leading to a high surface free energy. In order to most effectively minimize this free energy, an arrangement of fibres parallel to the circumference of the channel is the preferred conformation (Figure 1.6). As there are no interfaces formed within COL and the surface free energy is sufficiently low, there is no need for the alignment of collagen fibres. Hence, the fibres in COL are randomly polymerized.
Figure 1.6 Alignment of collagen fibres at the interface of MCCG channels. In COL, the surface free energy is low as there are no interfaces formed within the hydrogel. Hence, the fibres in COL are not aligned. In MCCG, the high number of matrix-channel interfaces increases the surface free energy of the gel, and the most effective arrangement of collagen fibres to minimize this free energy is in parallel to the surface of the channel lumen. Hence, the fibres in MCCG are highly aligned near the interface of the channel and matrix.
The channels in MCCG are not uniform in size throughout the length (increasing z-value in the direction of gelation from the point where gelation begins) of the gel, but rather increase in size from the top to the bottom of the gel. Furthermore, the density (number) of channels decreases from the top to the bottom. This was thought to be due to the smaller channels being absorbed by larger channels, as in Ostwald ripening (Furusawa et al., 2012). However, this could potentially also be explained by the preference of collagen molecules to move from collagen solution towards the polymerized collagen network (matrix) region. This would result in an increase in concentration of collagen in the polymer-rich region, and subsequently an increase in size of the polymer-poor (channel) region.

Chapter 1 Introduction 10
1.4 Research Objectives In this dissertation, the MCCG is studied for its potential applications in 3D cell culture, neural tissue engineering, and in the study of the phase separation of a particle-containing mixture. The research objectives of this dissertation are outlined by chapter as below:
In Chapter 3, different methods of seeding cells in the MCCG were explored as potential 3D cell culture methods. It is now well established that traditional 2D cell culture systems do not fully replicate the native environment in which cells grow in the body. As such, various 3D culture methods have been developed, including seeding cells on a porous 3D biomaterial scaffold and encapsulating cells in hydrogels. The MCCG presents a biomaterial that could be used as a scaffold for 3D cell culture either by seeding cells in the channels, or by encapsulating cells in the hydrogel. In addition, cells could be seeded as single cells or as spheroids. Thus, various seeding methods with different cell types were investigated in this chapter.
In Chapter 4, fluorescent particles embedded in collagen solution were used to study the movement of particles during NG and SD phase separation. Phase separation is not only useful for the construction of scaffolds for tissue engineering, but is also implicated in compartmentalization in cells and the formation of the ECM. With cell encapsulation being combined with phase separation methods to develop 3D cell culture systems, it may be important to investigate what happens to the cells during the phase separation process. Although the effects of the presence of particles on phase separation have been reported, the movement of particles (or cells) within the phase-separating mixture during the phase separation process has not been investigated. Furthermore, there are currently no published studies in which both NG and SD were studied at the same time. The MCCG and COL could provide a model for the study of SD and NG phase separation. Thus, in this chapter, fluorescent microspheres were used to model cells, and their movements during phase separation were investigated using time-lapse microscopy.
In Chapter 5, the degree of collagen fibre alignment in COL and MCCG were quantified, and its effect in guiding neurite growth was investigated. In neural tissue engineering, the ability of a scaffold to guide the growth of neurites is an important property to have. The collagen fibre alignment of MCCG make it a prospective biomaterial for neural tissue engineering, as it is expected to be able to provide contact guidance to guide the growth pathway of neurites. Although the alignment of collagen fibres had been inferred, it has not been quantified. Thus, in this chapter, the degree of collagen fibre alignment in COL and MCCG hydrogels were quantified from CRM images, and the guidance of neurite growth investigated using PC12 as model neural cells.

Chapter 1 Introduction 11
1.5 References Abu-Rub, M. T. et al. (2011) ‘Nano-textured self-assembled aligned collagen hydrogels promote directional neurite guidance and overcome inhibition by myelin associated glycoprotein’, Soft Matter, 7(6), p. 2770. doi: 10.1039/c0sm01062f.
Alberts, B. et al. (2008) ‘Chapter 19: Cell Junctions, Cell Adhesion, and the Extracellular Matrix’, in Molecular Biology of the Cell. 5th edn. Garland Science, pp. 1131–1204.
Bates, F. S. (1991) ‘Polymer-Polymer Phase Behavior’, Science, 251(4996), pp. 898–905. doi: 10.1126/science.251.4996.898.
Chan, G. and Mooney, D. J. (2008) ‘New materials for tissue engineering: towards greater control over the biological response’, Trends in Biotechnology, 26(7), pp. 382–392. doi: 10.1016/j.tibtech.2008.03.011.
Chen, Q. et al. (2012) ‘Collagen-Based Scaffolds for Potential Application of Heart Valve Tissue Engineering’, Journal of Tissue Science & Engineering, S11, pp. 3–8. doi: 10.4172/2157-7552.S11-003.
Dubey, N., Letourneau, P. C. and Tranquillo, R. T. (1999) ‘Guided Neurite Elongation and Schwann Cell Invasion into Magnetically Aligned Collagen in Simulated Peripheral Nerve Regeneration’, Experimental Neurology, 158(2), pp. 338–350. doi: 10.1006/exnr.1999.7095.
Favvas, E. P. and Mitropoulos, A. C. (2008) ‘What is spinodal decomposition?’, Journal of Engineering Science and Technology Review, 1, pp. 25–27.
Forgacs, G. et al. (2003) ‘Assembly of collagen matrices as a phase transition revealed by structural and rheologic studies.’, Biophysical Journal, 84, pp. 1272–1280. doi: 10.1016/S0006-3495(03)74942-X.
Furusawa, K. et al. (2012) ‘Studies on the formation mechanism and the structure of the anisotropic collagen gel prepared by dialysis-induced anisotropic gelation’, Biomacromolecules, 13(1), pp. 29–39. doi: 10.1021/bm200869p.
Furusawa, K. et al. (2015) ‘Application of Multichannel Collagen Gels in Construction of Epithelial Lumen-like Engineered Tissues’, ACS Biomaterials Science and Engineering, 1(7), pp. 539–548. doi: 10.1021/acsbiomaterials.5b00003.
Hanazaki, Y. et al. (2013) ‘Multiscale analysis of changes in an anisotropic collagen gel structure by culturing osteoblasts’, ACS Applied Materials and Interfaces, 5(13), pp. 5937–5946. doi: 10.1021/am303254e.
Kadler, K. E. et al. (1996) ‘Collagen fibril formation’, Biochemical Journal, 316, pp. 1–11. doi: 10.1042/bj3160001.
Lee, C. H., Singla, A. and Lee, Y. (2001) ‘Biomedical applications of collagen’, International Journal of Pharmaceutics, 221(1–2), pp. 1–22. doi: 10.1016/S0378-5173(01)00691-3.
Liu, T. et al. (2012) ‘Nanofibrous Collagen Nerve Conduits for Spinal Cord Repair’, Tissue Engineering Part A, 18(9–10), pp. 1057–1066. doi: 10.1089/ten.tea.2011.0430.
Lowe, C. J. et al. (2016) ‘Production of Highly Aligned Collagen Scaffolds by Freeze-drying of Self-assembled, Fibrillar Collagen Gels’, ACS Biomaterials Science and Engineering, 2(4), pp. 643–651. doi: 10.1021/acsbiomaterials.6b00036.

Chapter 1 Introduction 12
Mouw, J. K., Ou, G. and Weaver, V. M. (2014) ‘Extracellular matrix assembly: a multiscale deconstruction’, Nature Reviews Molecular Cell Biology, 15(12), pp. 771–785. doi: 10.1038/nrm3902.
Nocera, A. D. et al. (2018) ‘Development of 3D printed fibrillar collagen scaffold for tissue engineering’, Biomedical Microdevices. Biomedical Microdevices, 20(2), pp. 1–13. doi: 10.1007/s10544-018-0270-z.
O’Brien, F. J. (2011) ‘Biomaterials & scaffolds for tissue engineering’, Materials Today. Elsevier Ltd, 14(3), pp. 88–95. doi: 10.1016/S1369-7021(11)70058-X.
Ott, H. C. et al. (2008) ‘Perfusion-decellularized matrix: using nature’s platform to engineer a bioartificial heart’, Nature Medicine, 14(2), pp. 213–221. doi: 10.1038/nm1684.
Petersen, T. H. et al. (2010) ‘Tissue-Engineered Lungs for in Vivo Implantation’, Science, 329(5991), pp. 538–541. doi: 10.1126/science.1189345.
Ratner, B. D. et al. (2013a) ‘A History of Biomaterials’, in Biomaterials Science - An Introduction to Materials in Medicine. 3rd edn. Elsevier, pp. xli–liii.
Ratner, B. D. et al. (2013b) ‘Chapter 1.2.15 Textured and Porous Materials’, in Biomaterials Science - An Introduction to Materials in Medicine. 3rd edn. Elsevier, pp. 321–331.
Schnell, E. et al. (2007) ‘Guidance of glial cell migration and axonal growth on electrospun nanofibers of poly-ε-caprolactone and a collagen/poly-ε-caprolactone blend’, Biomaterials, 28(19), pp. 3012–3025. doi: 10.1016/j.biomaterials.2007.03.009.
Song, J. J. and Ott, H. C. (2011) ‘Organ engineering based on decellularized matrix scaffolds’, Trends in Molecular Medicine. Elsevier Ltd, 17(8), pp. 424–432. doi: 10.1016/j.molmed.2011.03.005.
Subia, B., Kundu, J. and Kundu, S. C. (2010) ‘Biomaterial Scaffold Fabrication Techniques for Potential Tissue Engineering Applications’, in Tissue Engineering. InTech, pp. 141–159.
Sullivan, D. C. et al. (2012) ‘Decellularization methods of porcine kidneys for whole organ engineering using a high-throughput system’, Biomaterials. Elsevier Ltd, 33(31), pp. 7756–7764. doi: 10.1016/j.biomaterials.2012.07.023.
van de Witte, P. et al. (1996) ‘Phase separation processes in polymer solutions in relation to membrane formation’, Journal of Membrane Science, 117, pp. 1–31. doi: 10.1016/0376-7388(96)00088-9.
Wood, G. C. and Keech, M. K. (1960) ‘The formation of fibrils from collagen solutions 1. The effect of experimental conditions: kinetic and electron-microscope studies’, Biochemical Journal, 75(3), pp. 588–598. doi: 10.1042/bj0750588.
Zhang, Y. et al. (2006) ‘Novel chitosan/collagen scaffold containing transforming growth factor-β1 DNA for periodontal tissue engineering’, Biochemical and Biophysical Research Communications, 344(1), pp. 362–369. doi: 10.1016/j.bbrc.2006.03.106.

Chapter 2 General Materials and Methods 13
Chapter 2. General Materials and Methods 2.1 Hydrogel Preparation – Horizontal Method To prepare horizontal collagen hydrogels, a silicone mould and an 8 mm x 8 mm glass coverslip were used to create a 5 mm (l) x 6 mm (w) chamber in a culture dish, and 5 mg/ml AteloCell IPC-50 collagen solution (KOKEN) was pipetted into the chamber space. Gelation solution was then slowly and carefully added to the open side of the chamber to initiate gelation, before filling the culture dish to cover the whole setup. The gelation solution for preparing normal collagen gel (COL) was low glucose DMEM (Wako), whereas that for multi-channel collagen gel (MCCG) was a phosphate buffer solution (gelation PBS; 20 mM Na2HPO4, 13 mM KH2PO4). (Figure 2.1a) For top-view imaging, 2 mm-thick silicone moulds were used, and for side-view imaging, 1 mm-thick moulds were used.
To prepare COL with channel structures to enable cells to be seeded in the gel, the same chamber as described above was set up, but with 4 gold wires of 0.1 mm (Nilaco Corporation) placed in the collagen solution before the addition of gelation solution (Figure 2.1b).
To prepare MCCGs with different ionic concentrations, a stock solution of 100 mM NaCl in 1 mM HCl (for dilution in collagen solution) or in MilliQ (for dilution in gelation PBS) was first prepared, and then diluted in the collagen solution and the gelation PBS to achieve the required concentration of NaCl.
After the moulds have been set up, they were left at room temperature (20 °C) overnight for the collagen solution to gelate completely, and then washed twice with PBS (-) (2.3 mM KCl, 1.5 mM KH2PO4, 8.4 mM Na2HPO4, and 137 mM NaCl, pH 7.4) to remove residual gelation solution.
Figure 2.1 Horizontal hydrogel preparation set-up. (a) Normal collagen gel (COL) is prepared by gelating with DMEM, and multi-channel collagen gel (MCCG) is prepared by gelating with gelation PBS. (b) COL with channel structures can be prepared by placing gold wires in the collagen solution before adding DMEM to induce gelation.

Chapter 2 General Materials and Methods 14
2.2 Hydrogel Preparation – Vertical Method To prepare vertical collagen hydrogels, a silicone mould with a cut hole of 6 mm diameter was used to create a chamber in a culture dish. Collagen solution was placed in the chamber, and a dialysis membrane placed over the solution. Another layer of silicone mould was placed on top of the dialysis membrane to hold it in place, before gelation solution was added from the top. Gelation was allowed to take place for 30 min at room temperature. After gelation, the samples were washed twice with PBS (-), and then incubated in DMEM for a few hours to facilitate easy removal of the dialysis membrane.
Figure 2.2 Vertical hydrogel preparation set-up. Normal collagen gel (COL) is prepared by gelating with DMEM, and multi-channel collagen gel (MCCG) is prepared by gelating with gelation PBS.
2.3 Cell Culture All cell work was performed under aseptic conditions in a clean bench, and cells were cultured in a humidified incubator at 37 °C, 5% CO2 unless otherwise stated.
PC12 (rat pheochromocytoma) cells were obtained from Riken Cell Bank (Tsukuba, Japan). Cells were cultured on dishes coated with 0.3 mg/mL Cellmatrix Type I-A (Nitta Gelatin Inc.). Growth medium consisted of low glucose DMEM (Wako) supplemented with 10% fetal bovine serum (FBS, Biowest), 10% horse serum (Biowest), and 1% penicillin-streptomycin (Wako). Growth medium was exchanged every 2-3 days, and cells were sub-cultured when they reached 80% confluency. TrypLE Express Enzyme (Gibco) was used to detach cells. Differentiation medium was prepared by adding 100 ng/ml mouse NGF 7S (Alomone Labs) to growth medium. Differentiation was initiated from day 1 after seeding cells, and medium exchanged every day.
A6 (xenopus laevis kidney) cells were cultured in T-25 culture flasks, with growth medium consisting of 50% Leibovitz’s L-15 medium (Gibco), 40% MilliQ water, 10% FBS, and 1% penicillin-streptomycin. Cells were cultured in a 25 °C incubator with a beaker of water, and growth medium was exchanged every 2-3 days. Cells were sub-cultured when they reached 80% confluency, with 0.25% Trypsin-EDTA used to detach cells.
MDCK (Madin-Darby Canine Kidney) cells were obtained from RIKEN cell bank (Ibaraki, Japan). Growth medium consisted of low glucose DMEM supplemented with 10% fetal bovine serum and 1% penicillin-streptomycin. Growth medium was exchanged every 2-3 days, and cells were sub-cultured when they reached 80% confluency. TrypLE was used to detach cells.
For spheroids, 1×10⁶ cells were seeded in a petri dish and cultured on a shaker for 2 days. The spheroids were collected in a Falcon tube and allowed to sediment, before replacing the supernatant with fresh medium. PC12 spheroids were differentiated for 5 days prior to use.

Chapter 2 General Materials and Methods 15
2.4 Cell Seeding – Cells Seeded on Channel Surface Horizontal method: The gels were incubated with growth medium at cell culture conditions for at least 30 min before seeding. The coverslips, wires, and moulds were first removed, and about 1 mm of the gel was cut off on both ends (the “top” and “bottom”) using a scalpel to ensure that the opening of the channels are wide enough for cells to enter. Growth medium containing 1x10⁶ cells/gel was added the dish, and the medium pipetted up and down 10 times near the channel opening on both sides to encourage the cells to enter the channels. The samples were then incubated on a shaker at cell culture conditions overnight. The next day, the samples were detached from the culture dish and transferred to a 12-well plate, with one sample per well.
Vertical method: To open the channels of the MCCG to enable cells to enter the channels, 1 mg/ml collagenase (Wako) dissolved in HBSS (+) (Nacalai Tesque) was added to the top of the gel, and incubated at 37 °C for 25 min. After collagenase treatment, the gel was washed three times with PBS (-), followed by 5 mM EDTA dissolved in PBS (-), then incubated in EDTA overnight to ensure collagenase reaction is completely inhibited. The gel was washed three times and incubated with PBS (-) overnight to remove excess EDTA. Growth medium containing 1x10⁶ cells/gel was then added to the top of the gel, and the samples incubated at cell culture conditions for 30 min, before growth medium was added to fill the dish.
2.5 Cell Seeding – Cells Encapsulated in Hydrogel To prepare gels with encapsulated cells, the collagen solution was first mixed with 2.8 M glycerol dissolved in 1 mM HCl at a ratio of 9:1, with the final concentration of each component being 4.5 mg/ml collagen and 0.28 M glycerol (Wako). Glycerol was added to reduce damage to cells, by ensuring a similar osmotic pressure in the collagen solution as that in cells. The collagen-glycerol mixture was then mixed by inversion, and centrifuged at 3000 rpm for 10 min to remove gas bubbles. Gelation PBS was also prepared with 194 mM glycerol added to achieve ~280 mOsm osmotic pressure.
Cells were re-suspended in the collagen-glycerol mixture at a cell density of 1x10⁶ cells/ml, with the mixing done by shaking the tube instead of pipetting to reduce shear stress on the cells. For the horizontal method, the cell-containing mixture was placed in a 3 mm (l) x 6 mm (w) chamber created as above in section 2.1, and gelation was allowed to take place for about 1.5 hr until gelation is complete. The vertical method was prepared with the same procedure as above in section 2.2. After gelation, the gelation solution was exchanged for growth medium and the samples were cultured in cell culture conditions.
2.6 Fluoresbrite Microspheres in Fluorescent Collagen Solution Immunofluorescence-labelled collagen solution was first prepared by mixing collagen solution with collagen primary antibody COL1A1 (D-13) goat polyclonal IgG (Santa Cruz Biotechnology) at 1:250 dilution ratio and secondary antibody Alexa Fluor 633 rabbit anti-goat IgG (Life Technologies) at 1:1000 dilution ratio. The mixture was mixed by vortex, and then spun down to remove gas bubbles. Fluoresbrite Plain YG microspheres (Polyscience, Inc) of 0.5 microns (d = 0.538 μm) were diluted 1:1000 with 1 mM HCl prior to use, while that of 6 microns (d = 5.73 μm) were used as is. The microspheres were added to the fluorescently labelled collagen solution at the desired particle density, and mixed by pipetting the mixture up and down several times.
Chapter 2 General Materials and Methods 16
2.7 Fixation and Immunostaining For cell-containing gels, the samples were washed twice with PBS (-) at the end of the culture period, before fixing with 4% paraformaldehyde (PFA) overnight at 4 °C. After fixation, the samples were blocked with 1% BSA for 1 hr, and immune-labelled with the collagen primary antibody COL1A1 (D-13) goat polyclonal IgG (Santa Cruz Biotechnology) diluted 200-fold in 1% BSA overnight 4 °C. Then, the samples were permeabilized with 0.5% Triton X-100 for 1 hr, and blocked with 1% BSA for 1 hr. Samples were then stained with secondary antibody Alexa Fluor 633 rabbit anti-goat IgG (Life Technologies) diluted 400-fold, SYTOX Blue nucleic acid stain (Life Technologies) diluted 400-fold, and 1 unit/ml filamentous actin (F-actin) Alexa Fluor 488 phalloidin (Life Technologies) in 1% BSA with 0.1% Triton X-100 for 6 hr. All steps were carried out at room temperature unless otherwise stated, and the samples were washed three times with PBS (-) between each step.
Samples without cells were simply fixed with 4% PFA overnight at 4 °C and washed three times with PBS (-) after fixation. For top view imaging, the gels were cut into 2 mm length sections, perpendicular to the growth direction of the gel. Flipping the gel onto its thickness edge enables top view images to be obtained.
2.8 Confocal Microscopy Confocal microscopy for data analysis were performed using Leica TCS-SP5 with HeNe-633 (red), Ar-488 (green), and Ar-458 (blue) lasers. Table 2.1 lists the photodetector, spectral range, and colour representation used to observe collagen, nuclei, F-actin, and microspheres. Table 2.1 Confocal microscopy settings. Photodetector Wavelength (nm) Colour CRM collagen HyD 635 – 727 Red CLSM collagen HyD 642 – 727 Red SYTOX Blue-labelled nuclei HyD 463 – 488 Blue Alexa Fluor 488 phalloidin-labelled F-actin HyD 515 – 551 Green Fluoresbrite microspheres PMT 464 – 511 Indigo
To view samples, a silicone mould was placed on a glass coverslip and filled with PBS (-). The sample was then placed in the PBS (-) and gently pressed down so that the sample sinks to the bottom of the chamber. The z-position just above the glass coverslip was set as z = 0 μm.
2.9 Statistical Analysis Two-tailed student’s t-test was used to determine if the differences between 2 sets of data were significant. Where 3 or more sets of data were being compared, one-way ANOVA was first performed for all data, followed by post-hoc Tukey’s test between all pair combinations. Differences were taken to be significant if p < 0.05. Error bars on graphs represent the standard error of the mean (SEM).

Chapter 3 Cell Seeding Methods in MCCG 17
Chapter 3. Cell Seeding Methods in MCCG 3.1 Introduction Ever since researchers realized that the traditional methods of culturing cells on plain glass or plastic dishes do not fully recapitulate the native environment in which cells grow, many studies have been made to recreate in vitro a method to mimic the three-dimensional (3D) nature of the extracellular matrix (ECM). Some of these attempts have included coating the cell culture surface with ECM factors such as collagen, micro-patterning features on the culture surface, and culturing cells on, or sandwiched between, layers of ECM hydrogels (Duval et al. 2017). Nevertheless, these methods are still considered to be two-dimensional (2D), as the cells are still grown in a flat monolayer.
Various 3D culture systems have been proposed to create an environment in which cells are surrounded by ECM and other cells in all directions. These include seeding cells on porous 3D scaffolds, encapsulating cells in hydrogels, as well as culturing cells as spheroids as opposed to single cells (Fennema et al. 2013; Edmondson et al. 2014).
However, these methods often have their drawbacks. The processes to create porous scaffolds are often not cell-friendly, and therefore it is not viable to encapsulate cells in these. Cells that are seeded on scaffolds are also not entirely surrounded by ECM components or other cells, as the parts of a cell that is not in contact with the scaffold is in effect being bathed by culture medium or air. On the other hand, methods in which cells may be encapsulated in a hydrogel often do not yield a porous scaffold, and are usually disadvantaged by issues like cell death in the inner regions of the gel due to inefficient transport of oxygen, nutrients, and waste. In addition, the healthy growth of cell spheroids is limited by their sizes if vascular systems are not introduced into the spheroids, as the cells in the core suffer from lack of nutrient and oxygen supply.
The multi-channel collagen gel (MCCG) is a porous hydrogel scaffold, and combined with the mild conditions in which the gels can be prepared, presents a method to encapsulate cells in a porous hydrogel. It was expected that the cells seeded with different methods may exhibit different morphologies due to the cues that they receive from their environmental conditions. For example, cells that have contact with other cells may have different morphologies compared to those that are isolated within the collagen matrix.
In this chapter, different methods of seeding cells in the MCCG are tested out – seeding cells in the channels of MCCG, and encapsulating cells within the hydrogel. Seeding cells directly on the channels is a popular method for 3D cell culture, but cells are not surrounded on all sides by ECM or other cells. On the other hand, encapsulating cells within the hydrogel usually isolates single cells from contact with other cells. Therefore, in this chapter, encapsulating cells either as single cells or as spheroids was also tested out as a method of seeding cells in COL and MCCG hydrogels.

Chapter 3 Cell Seeding Methods in MCCG 18
3.2 Kidney Single Cells – Seeded and Encapsulated A6 xenopus laevis kidney cells were seeded in the channels of MCCG prepared by the vertical method according to the protocol in Chapter 2.2 and 2.4, whereas Madin-Darby Canine Kidney (MDCK) cells were encapsulated in MCCG according to Chapter 2.5. Figures 3.1 and 3.2 show A6 cells seeded in the channels and MDCK cells encapsulated in the hydrogel, respectively, at Day 14. The seeded A6 cells can be seen to adhere along the surface of the channels, creating a lumen-like structure typical of kidney cells. This agrees with a previous study that showed MDCK cells creating a lumen-like structure when seeded in MCCG (Furusawa et al. 2015). On the other hand, MDCK cells encapsulated in MCCG form a cyst-like structure with a hollow cavity, which is likely a result of cell death as is thought to be the mechanism by which tubules are formed when encapsulated in gels (Martín-Belmonte et al. 2008; Marciano 2017).
These results highlight the effects of the culture environment on the behaviour of cell growth. Although both seeding on a scaffold and encapsulation in a hydrogel/scaffold are thought to represent 3D culture systems, the cells line the channel surface in one and form a cyst in the other. The differences in cell behaviour is likely due to the fact that in the seeded method, the cells are adhered only on the surface of the collagen matrix, whereas in the encapsulated method, the cells are surrounded on all sides by the collagen matrix.
Given the importance of establishing polarity in epithelial cells, it is conceivable that cells adhered on the surface of the channel can easily establish apical and basal polarity as one side of the cell is exposed to the channel lumen while the other is attached to the collagen. On the other hand, encapsulated cells may have to resort to forming a cyst in order to establish an apical and basal side, as their surroundings are the same on all sides.
Figure 3.1 CLSM images of A6 cells seeded in the channels of MCCG. (a) The cells adhere to the surface of the channel lumen, forming lumen-like tubular structures, as seen from the x-z and y-z planes. (b) High magnification images showing cells lining the surface edges of the channel. Scalebar = 100 μm.

Chapter 3 Cell Seeding Methods in MCCG 19
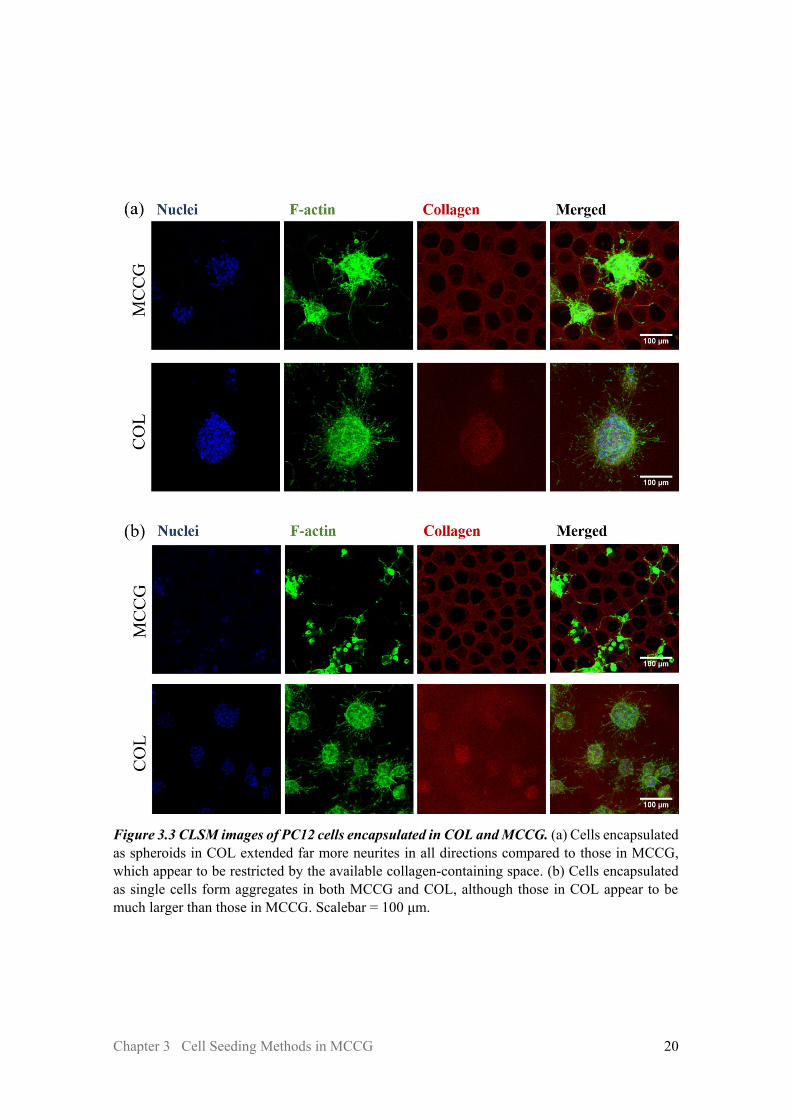
Figure 3.2 CLSM images of MDCK cells encapsulated in MCCG. (a) The cells entrapped in the collagen matrix form a cyst with a hollow cavity. (b) Nuclei are seen only on the outer edges of the cyst, indicating that the cyst is hollow on the inside. Scalebar = (a) 40 μm, (b) 100 μm. 3.3 PC12 Single Cells and Spheroids – Encapsulated PC12 rat adrenal medulla pheochromocytoma cells which extend neurite-like processes upon differentiation with nerve growth factor (NGF) were encapsulated as spheroids or as single cells in MCCG and normal collagen gel (COL).
Figure 3.3a shows the cells encapsulated as spheroids, and Figure 3.3b shows the cells encapsulated as single cells after 7 days of culture. In both cases, a much higher number of neurites were seen to extend from the cells encapsulated in COL compared to those in MCCG, which is likely due to the restriction of available collagen-containing space available by the channels in MCCG. Neurites in COL may extend in any direction, while those in MCCG prefer to extend in regions with collagen onto which they can adhere. This may have implications that MCCG could be used to guide the growth direction of neurites, and this is investigated in Chapter 5.
Although the single cells eventually aggregate or proliferate into clusters of cells, the aggregates in COL appear to be much larger than those in MCCG. This may again be due to the restriction of collagen-available space in MCCG. If the cells aggregate by migrating towards one another, it is unlikely that they would traverse across the channel lumen, but rather go around it. Similarly, it is unlikely that cells would proliferate into the “empty” channel region, as there is less support to adhere to.
Unlike the spheroids which were differentiated for 5 days prior to encapsulation, differentiation in single cells were only initiated on day 1 after encapsulation. Even so, they were able to undergo differentiation, showing that the NGF was able to penetrate the collagen hydrogel to reach the encapsulated cells.
Chapter 3 Cell Seeding Methods in MCCG 20
Figure 3.3 CLSM images of PC12 cells encapsulated in COL and MCCG. (a) Cells encapsulated as spheroids in COL extended far more neurites in all directions compared to those in MCCG, which appear to be restricted by the available collagen-containing space. (b) Cells encapsulated as single cells form aggregates in both MCCG and COL, although those in COL appear to be much larger than those in MCCG. Scalebar = 100 μm.

Chapter 3 Cell Seeding Methods in MCCG 21
3.4 Summary and Conclusion In this chapter, various methods to replicate a 3D culture system were tested out using MCCG, including seeding cells in the channels and encapsulating cells in the hydrogel. Differences in cell growth despite both systems being considered “3D” indicate that cells may behave differently when attached to the surface or in bulk. In addition, it appears as though restriction of growth space by the presence of channel lumen in MCCG also affects the growth behaviour of cells. Nevertheless, further studies investigating the relationship between the environmental cues and the mechanisms that lead to these differences are required to fully evaluate the importance of the influence of culture methods and cell behaviour.
3.5 References Duval, K. et al., 2017. Modeling Physiological Events in 2D vs. 3D Cell Culture. Physiology,
32(4), pp.266–277.
Edmondson, R. et al., 2014. Three-Dimensional Cell Culture Systems and Their Applications in Drug Discovery and Cell-Based Biosensors. ASSAY and Drug Development Technologies, 12(4), pp.207–218.
Fennema, E. et al., 2013. Spheroid culture as a tool for creating 3D complex tissues. Trends in Biotechnology, 31(2), pp.108–115.
Furusawa, K. et al., 2015. Application of Multichannel Collagen Gels in Construction of Epithelial Lumen-like Engineered Tissues. ACS Biomaterials Science and Engineering, 1(7), pp.539–548.
Marciano, D.K., 2017. A Holey Pursuit: Lumen formation in the Developing Kidney. Pediatric Nephrology, 32(1), pp.7–20.
Martín-Belmonte, F. et al., 2008. Cell-Polarity Dynamics Controls the Mechanism of Lumen Formation in Epithelial Morphogenesis. Current Biology, 18(7), pp.507–513.

Chapter 4 The Movement of Particles during the Phase Separation Process 22
Chapter 4. The Movement of Particles during the Phase Separation Process
4.1 Introduction The concept of phase separation is often applied in industrial applications such as in membrane formation for oily wastewater filtration uses (Li et al., 2006; Yi et al., 2011), as well as in biomaterial engineering such as in making hydrogels (for example, Pourjavadi & Kurdtabar 2007; Rose et al. 2017) or porous scaffolds (for example, Mi et al. 2015; Biswas et al. 2017). Phase separation is also thought to occur in nature, as the process in which non-membranous bodies such as centrosomes, P bodies, and nucleolus are compartmentalized in the cell cytoplasm (Hyman, Weber and Jülicher, 2014; Alberti, 2017). In addition, it has been suggested that phase separation may be involved in the dynamic motions of the extracellular matrix (ECM) during developmental morphogenesis (Newman et al., 2004; Loganathan et al., 2016).
Studies have shown that the presence of particles within the phase-separating mixture has an effect on the kinetics of phase separation. It has been reported that the nucleation and growth (NG) gelation of collagen matrices is accelerated in the presence of polystyrene latex beads (Forgacs et al., 2003; Newman et al., 2004), whereas silica particles inhibited or slowed down the spinodal decomposition (SD) phase separation of starch and gum mixture (Phisarnchananan, 2015). Furthermore, it has been suggested through simulation models that the final pattern and structure of mixtures phase separated via SD is affected by the presence of particles (Ghosh et al., 2017).
However, the movement of particles or cells in phase-separating mixtures has not been investigated. Given that cell-encapsulated hydrogels are being employed for use in tissue engineering (for example, Suri & Schmidt 2010; Yahata et al. 2017) or as 3D cell culture systems (for example, Wang et al. 2010; Huang et al. 2013), and that the phase separation of particle-containing collagen solution has been proposed as a model for developmental mesenchymal tissue to study matrix-driven translocation (Newman et al., 2004), it could be useful to gain an insight into how particles or cells behave during the phase separation process of a mixture. In addition, studies of phase separation to date typically only focus on either NG or SD only, and not concurrently.
Therefore, in this chapter, the aim was to investigate the behaviour of fluorescent particles of different sizes and density in NG and SD, using normal collagen (COL) and multi-channel collagen gel (MCCG), respectively. Particles of 6 μm were used to model cells (a red blood cell, for example, has a diameter of about 6-8 μm), and 0.5 μm were used to model molecules (a collagen molecule, for example, has a diameter of about 0.3 μm), in order to study if the movement of these particles are differently affected by the type of phase separation, or whether they have an influence on the rate of phase separation.

Chapter 4 The Movement of Particles during the Phase Separation Process 23
The hypothesis was that the particles will flow in the same direction as the movement of collagen molecules as phase separation occurs. The movement of collagen molecules was predicted based on the suggestion of the movement of components in a phase-separating solution by Favvas (Favvas and Mitropoulos, 2008), and summarized in Figure 4.1. Briefly, molecules is an NG phase-separating mixture move from regions of high solute concentration to low concentration regions, whereas those in an SD phase-separating mixture move from low to high concentration regions.
Figure 4.1 The movement of solutes during nucleation and growth (NG) and spinodal decomposition (SD) phase separation. Induced changes, such as changes in temperature or pH, can bring a stable system into a metastable or unstable state, and the flow of solute molecules (represented by blue dots) in these situations are different. Before any change is induced, the molecules are evenly distributed throughout the system.
(a) In the metastable state, a nucleus of the molecule forms, creating a region of low molecule concentration around it (the nucleus is considered to have essentially zero concentration). As molecules flow from high concentration to low concentration regions, the nucleus increases in size as more molecules are added to it. Thus, the characteristics in the metastable system are the formation of nuclei, and a downhill diffusion of molecules.
(b) In the unstable system, the induced change creates regions of high and low molecule concentration. As the movement of the molecules is from low concentration to high concentration regions, the concentrated region becomes more concentrated, and the diluted region becomes more dilute. Hence, the characteristics of spinodal decomposition are the formation of regions with alternating high and low concentration of molecules, and an uphill diffusion of molecules.

Chapter 4 The Movement of Particles during the Phase Separation Process 24
The expected movement of collagen molecules, viewed from the side of the gel, during the phase separation of COL (NG) and MCCG (SD) is illustrated in Figure 4.2. In COL, as gelation is induced and nuclei of collagen fibres form, collagen molecules move upwards from high concentration region in the collagen solution to the low collagen molecule concentration region around the nuclei to add to the polymerized collagen fibres. In MCCG, the collagen molecules also move upwards, but towards the collagen-matrix regions with high concentration of collagen, and not towards the channel regions which have low collagen concentration. Therefore, collagen molecules in the path of a forming channel are thought to move sideways and upwards towards the matrix region.
Thus, it was predicted that the particles in collagen solution would move upwards in COL and sideways and upwards in MCCG, following the movement of collagen molecules.
Figure 4.2 Movement of collagen molecules during NG and SD phase separation. At t0 before gelation is induced, the collagen molecules (thin red lines) are evenly distributed. After gelation is induced at t1 in COL, collagen fibres (thick blue lines) form nuclei which have effectively zero concentration of collagen molecules around them. Therefore, collagen molecules from the collagen solution move upwards towards the polymerized collagen fibres. In MCCG, alternating regions of high and low concentration of collagen fibres are formed, and the collagen molecules move towards regions with high fibre concentration (collagen matrix) and not towards low fibre regions (channels). Hence, the movement of collagen molecules in the path of a channel moves sideways and upwards.

Chapter 4 The Movement of Particles during the Phase Separation Process 25
4.2 Movement of Particles in NG and SD Immunofluorescence-labelled collagen solution mixed with Fluoresbrite microspheres was prepared as in Chapter 2.6, and placed in a 1 mm (l) x 6 mm (w) x 1 mm (h) chamber prepared as in Chapter 2.1 in a 35-mm glass-bottom dish. Time-lapse CLSM images were obtained at z = 100 μm (z = 0 μm was set as the position of the cover glass) using a 20x objective lens at 1 s intervals after gelation solution was added. The zoom factor for the experiments with 6 μm microspheres was 1.7, and 4.0 for the experiments with 0.5 μm microspheres.
Figure 4.3 shows sequential images of the gelation of COL and MCCG with 6 μm microspheres. It was observed that microspheres in COL are homogeneously distributed, whereas those in MCCG are distributed in the collagen matrix and not in the channels. During the gelation of COL, the microspheres appear to be moved downwards before finally coming to a relatively stable position after a very slight upward movement. On the other hand, during the gelation of MCCG, the microspheres, particularly those in the path of a channel being formed, are initially pushed downwards, then moved sideways and upwards, and eventually stay relatively stable on the edge of the channel lumen.
The initial downward movements of the particles observed in both COL and MCCG may have been due to the expanding collagen network being formed as gelation proceeds from the top to bottom of the image, and the upward movements at a later time in the gelation process is likely to signal the polymerization of collagen molecules to the formed network.
However, while the overall movement of the microspheres in MCCG appear to follow that of the movement of collagen molecules (sideways and upwards), those in COL appear to move in a direction opposite to that of collagen molecules (downwards instead of upwards). Thus, it seems that the particles do not flow in the same direction as collagen molecules during phase separation. The rate of channel formation, which is limited by collagen molecule movement, and the velocity of particle movement were analysed in order to confirm this. It could be said that if the rates of the movement of collagen molecule and microspheres are similar, collagen and microspheres may be moving together. On the other hand, if their rates are vastly different, the movement of microspheres are likely to be driven by another factor.

Chapter 4 The Movement of Particles during the Phase Separation Process 26
Figure 4.3 CLSM time-lapse sequence of the phase separation of COL and MCCG. Collagen is shown in red, and 6 μm microspheres shown in white. The sequence shows snapshots of the phase separation process at 30 s intervals, with the last image showing the tracked pathways of the particles. (a) In COL, the particles remain homogeneously distributed throughout the gel, and their movements are in a downward motion in the direction of gelation. (b) In MCCG, the particles are concentrated in the collagen matrix region away from the channels, and their movements are largely in a sideways and upwards motion, away from path of a forming channel and into the matrix region.

Chapter 4 The Movement of Particles during the Phase Separation Process 27
4.3 Rate of Channel Formation in MCCG The assumption was made that the movement of the frontline of the channel being formed in MCCG phase separation represents the movement of collagen molecules. The rate of channel formation was determined from the time-lapse images of immunofluorescence labelled collagen. For 6 μm diameter microspheres, the densities investigated were 0.25, 0.5, and 1.0 x 10⁸ microspheres/mL; for those of 0.5 μm diameter, the densities were 1, 2 and 4 x 10⁸ microspheres/mL. n = 3 for each condition. As it was difficult to determine where the frontline is by eye, the collagen intensity profile of a 20 μm wide rectangle within the channel was plotted, and the frontline determined as the point where a large increase in intensity is observed (Figure 4.4). The distance from the top (defined as the side where gelation is induced) to the frontline of the channel lumen was measured, with t = 0 being the point where the channel lumen first appears, and the rate of channel formation was calculated as the gradient of the distance/time line. Phase separation or gelation of COL could not be tracked by the same method as there are no channels in COL, and the intensity profile of collagen is distorted by the fluorescence from the microspheres.
Figure 4.4 Method of determining channel formation. (a) The frontline of the channel was determined from CLSM images of immuno-labelled collagen (red), by using the intensity profile of a 20 μm wide rectangle (yellow) within the channel structure (black). (b) The distance from the top, x, was measured as the distance from the top (the side where gelation is initiated) to the point where a sudden large increase in intensity is observed.
In MCCGs with 6 µm microspheres, a high number of particles (1.00x10⁸ particles/mL) appears to increase the rate of SD phase separation, although this is only statistically significant when compared to the condition with no particles (Figure 4.5a). On the other hand, 0.5 µm microspheres had no effect on the rate of channel formation (Figure 4.5b). Comparing the same density of particles with different sizes also revealed that 6 µm microspheres significantly increased the rate of channel formation compared to that of 0.5 µm (Figure 4.5c). From these, it could be inferred that particles of 0.5 µm diameter, at least up to 4.00x10⁸ particles/mL, and particles of 6 µm diameter up to 0.50x10⁸ particles/mL, do not have a significant effect on the movement of collagen molecules.

Chapter 4 The Movement of Particles during the Phase Separation Process 28
Figure 4.5 Rate of channel formation in MCCG. (a) The presence of 6 μm microspheres appear to increase the rate of channel formation in MCCG, but a significant difference is seen only with a density of 1.00x10⁸ particles/mL. (b) With 0.5 μm microspheres, the density of particles do not appear to have an effect on the rate of channel formation. (c) Comparing the rate of channel formation for particles of the same density, it was found that 6 µm microspheres significantly increased the rate of channel formation compared to that of 0.5 µm. Error bars show standard error of the mean (SEM); n = 3. * denotes a significance of p<0.05 by Tukey’s post hoc test performed between pairs after performing one-way ANOVA on the groups.

Chapter 4 The Movement of Particles during the Phase Separation Process 29
In a study on the effects of particles on the SD phase separation of corn starch, it was reported that silica particles of 0.04 μm and 6 μm diameters slowed down or inhibited the phase separation (Phisarnchananan, 2015). However, in this study, polystyrene-based latex particles of the similar diameters did not appear to inhibit nor affect the SD phase separation of MCCG.
There may be some factors that could explain the discrepancies in the two results. Firstly, the phase separation of corn starch and collagen solution may have different dynamics even if both proceed by SD. Furthermore, different particles may affect the phase separation differently, as the interaction between the polymer and particles depend on their surface composition. In the corn starch study, while the food-grade silica 6 μm diameter particles were untreated, the 0.04 μm particles were fumed silica particles with varying hydrophobicity. And in this study, the polystyrene microspheres are thought to contain charged groups that behave similarly to heparin (Newman et al., 2004).
Secondly, the concentration of polymer and particles investigated may also be a factor for the discrepancy. In the corn starch study, 2 wt.% starch was used with 0.5 wt.% , 0.7 wt.%, and 1 wt.% for the 6 μm particles, and 0.5 wt.%, and 1 wt.% for the 0.04 μm particles. In this study, less than 0.5 wt.% collagen was used with 0.3 wt.% (0.25x10⁸ particles/mL), 0.6 wt.% (0.5x10⁸ particles/mL), and 1.2 wt.% (1x10⁸ particles/mL) for the 6 μm particles, and 0.0007 wt.% (1x10⁸ particles/mL), 0.0014 wt.% (2x10⁸ particles/mL), and 0.0028 wt.% (4x10⁸ particles/mL) for the 0.5 μm particles. The higher concentration of polymer in the starch study may have made it more sensitive to the effects of the presence of particles, as there would be a higher number of interactions between polymer and particles.
Newman et al. had reported that the presence of 0.3x10⁶ particles/mL of 6 μm polystyrene microspheres accelerated the NG phase separation of collagen solution, but little effects were seen above 3x10⁶ particles/mL (Newman et al., 2004). In this study of SD phase separation, more than 0.25x10⁸ particles/mL were used, but there still appears to be an acceleration in phase separation. This could be due to a difference in the way particles affect the different types of phase separation, but may also simply be due to a difference in the methods of tracking the phase separation process.
Nevertheless, as it appears that the effect on the movement of collagen molecules by the presence of the microspheres is not significant (with the exception of 0.25x10⁸ particles/mL of 6 μm microspheres), the rate of channel formation can be compared with the velocity of particles to determine if they move at similar rates during phase separation.

Chapter 4 The Movement of Particles during the Phase Separation Process 30
4.4 Velocity of Particles in COL and MCCG The movement of 12 particles per sample were tracked by measuring the displacement of the particles from the start to end of the time-lapse sequences. As some microspheres appeared or disappeared from view into or out of the z plane throughout the sequence, only particles that could be tracked through the whole sequence on the xy plane were considered. The displacement of the particles were measured every 5 s, and the velocity was taken as the gradient of the displacement-time graph. To consolidate the data, the time at which each microspheres experienced the highest velocity was taken to be t = 0, as this was assumed to be when phase separation or gelation is taking place.
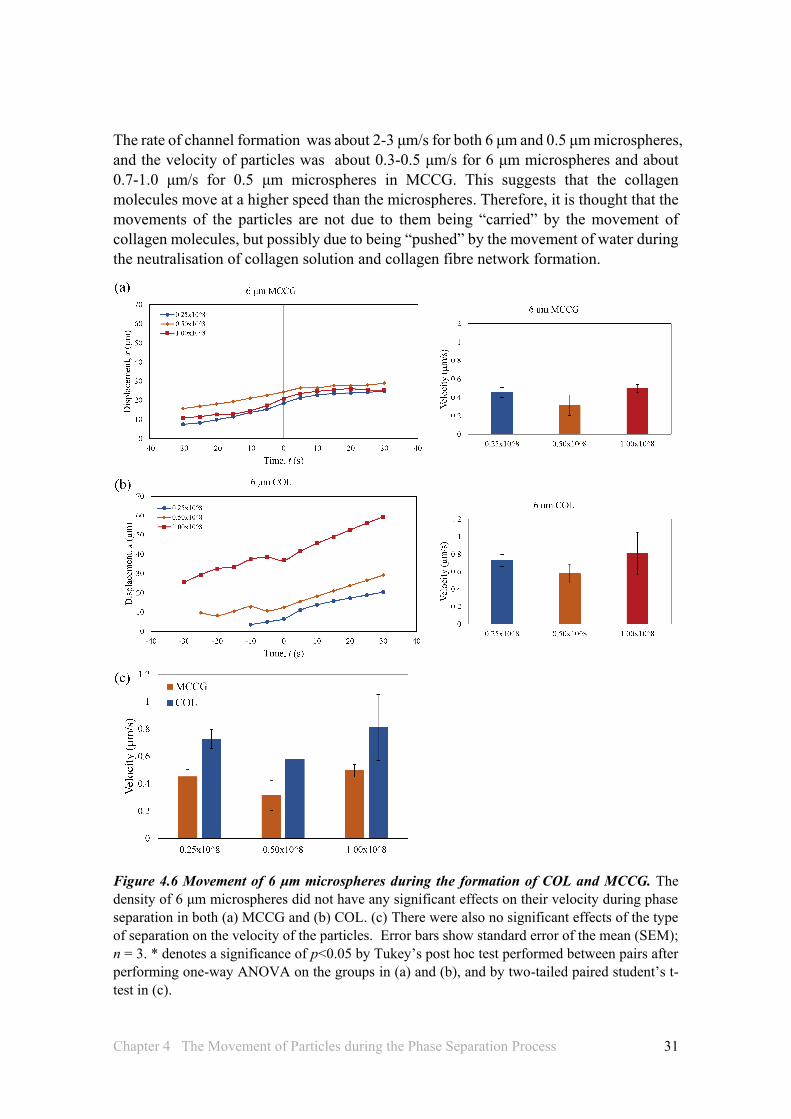
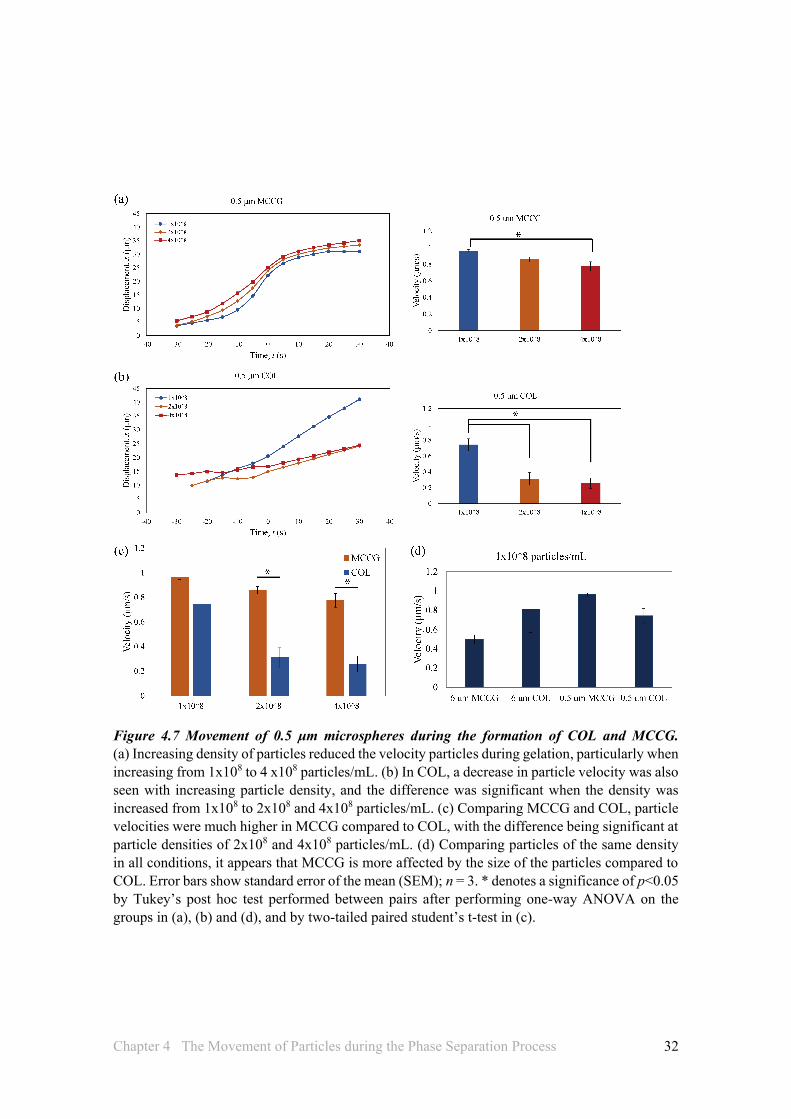
The density of particles that were 6 μm in diameter did not have any significant effects on their velocity during phase separation in both MCCG and COL (Figures 4.6a, b), and the type of separation also had no effect on the velocity of the particles (Figure 4.6c). On the other hand, increasing densities of particles of 0.5 μm diameter reduced the velocity of particles, particularly when the density is increased from 1x10⁸ to 4 x10⁸ particles/mL in MCCG (Figure 4.7a), and from 1x10⁸ to 2x10⁸ and 4x10⁸ particles/mL in COL (Figure 4.7b). Furthermore, the velocity of particles during SD phase separation in MCCG were higher than those in NG phase separation of COL, and significantly so at particle densities of 2x10⁸ and 4x10⁸ particles/mL.
It is most likely that the size of the particles has an effect on its behaviour in the phase separation process. The length of a collagen molecule is about 0.3 μm. Hence, particles of 0.5 μm diameter, which are more similar in size to collagen molecules and an order of magnitude smaller than those of 6 μm, are more likely to be affected by the movement of collagen or other forces driving their movement, as smaller particles would offer lesser resistance to the movement of other forces.
Another interesting observation was that, with the 6 μm microspheres, the velocities of the particles tended to be higher in COL compared to MCCG, whereas with the 0.5 μm microspheres, the velocities in MCCG were higher compared to that in COL (Figures 4.6c and 4.7c). This may suggest that SD and NG are sensitive to particles of different sizes, and this may also be reflected in the result of Fig 4.5c, where it was found that with particles of the same density but different size, the rates of channel formation were significantly different between no particles and 6 μm, but not between no particles and 0.5 μm. Or it may be that the total volume occupied by the particles affects the phase separation of the solution. For example, in MCCG, since the particles are pushed towards and concentrate in the collagen matrix regions, larger particles would occupy more space and this could affect the movement of collagen molecules or particles. Although no significant differences were observed when comparing particles of the same density in all conditions (Figure 4.7d), it does appear that MCCG is more affected by the size of the particles compared to COL, as the difference between 6 μm and 0.5 μm in MCCG is quite large compared to the difference in COL.
Chapter 4 The Movement of Particles during the Phase Separation Process 31
The rate of channel formation was about 2-3 μm/s for both 6 μm and 0.5 μm microspheres, and the velocity of particles was about 0.3-0.5 μm/s for 6 μm microspheres and about 0.7-1.0 μm/s for 0.5 μm microspheres in MCCG. This suggests that the collagen molecules move at a higher speed than the microspheres. Therefore, it is thought that the movements of the particles are not due to them being “carried” by the movement of collagen molecules, but possibly due to being “pushed” by the movement of water during the neutralisation of collagen solution and collagen fibre network formation.
Figure 4.6 Movement of 6 μm microspheres during the formation of COL and MCCG. The density of 6 μm microspheres did not have any significant effects on their velocity during phase separation in both (a) MCCG and (b) COL. (c) There were also no significant effects of the type of separation on the velocity of the particles. Error bars show standard error of the mean (SEM); n = 3. * denotes a significance of p<0.05 by Tukey’s post hoc test performed between pairs after performing one-way ANOVA on the groups in (a) and (b), and by two-tailed paired student’s t-test in (c).
Chapter 4 The Movement of Particles during the Phase Separation Process 32
Figure 4.7 Movement of 0.5 μm microspheres during the formation of COL and MCCG. (a) Increasing density of particles reduced the velocity particles during gelation, particularly when increasing from 1x10⁸ to 4 x10⁸ particles/mL. (b) In COL, a decrease in particle velocity was also seen with increasing particle density, and the difference was significant when the density was increased from 1x10⁸ to 2x10⁸ and 4x10⁸ particles/mL. (c) Comparing MCCG and COL, particle velocities were much higher in MCCG compared to COL, with the difference being significant at particle densities of 2x10⁸ and 4x10⁸ particles/mL. (d) Comparing particles of the same density in all conditions, it appears that MCCG is more affected by the size of the particles compared to COL. Error bars show standard error of the mean (SEM); n = 3. * denotes a significance of p<0.05 by Tukey’s post hoc test performed between pairs after performing one-way ANOVA on the groups in (a), (b) and (d), and by two-tailed paired student’s t-test in (c).

Chapter 4 The Movement of Particles during the Phase Separation Process 33
4.5 Movement of Water and Particles The solvent of the collagen solution is 1 mM HCl, and it can be assumed that the majority of the solvent is made up of water. As with the movement of molecules described in section 4.1, the movement of water molecules in the metastable (NG) system is thought to be from high concentration to low concentration regions (downhill diffusion), and the movement in the unstable (SD) system is from low concentration to high concentration regions (uphill diffusion).
Regions with high solute content have low water content, and vice versa. Prior to phase separation, the concentration of water throughout the collagen solution is homogeneous, as is that of collagen molecules. In COL, the formation of nuclei in NG phase separation leads to a low concentration of collagen molecules, and subsequently high concentration of water, in the phase-separated region. (Figure 4.8a). The movement of water in COL is therefore in a downward motion from high water concentration to low water concentration region, which is the collagen solution.
The SD phase separation of MCCG creates a more complicated picture. As the collagen solution separates into collagen-rich (matrix) and collagen-poor (channel) regions, the matrix region with high collagen concentration has low water concentration, and the channel region with low collagen concentration has a high concentration of water, relative to one another. However the concentration of collagen molecules is the lowest at the frontline of phase separation or channel formation, as the collagen solution is being neutralized and collagen molecules are being polymerized to collagen fibres. Therefore, the concentration of water highest at the frontline, whereas the collagen-molecule containing collagen solution has the lowest concentration of water. As the movement of water in the MCCG is from low water concentration to high water concentration regions, the flow of water is thought to be from the matrix to the channel, downward towards the frontline, and then back up to the frontline once it has passed the frontline and into the collagen solution with low water concentration (Figure 4.8b).
The direction of these movements of water in both COL and MCCG are in alignment with those of the movement of the microspheres. Hence, it is postulated that the movement of particles in a phase-separating mixture is driven by the movement of water in the solution.

Chapter 4 The Movement of Particles during the Phase Separation Process 34
Figure 4.8 Movement of water during the formation of COL and MCCG. Regions of high collagen molecules concentration have low concentrations of water, and vice versa. (a) In COL, the formation of nuclei leads to a low concentration of collagen, and high concentration of water in the phase separated regions. Movement of water in the metastable system is from high concentration to low concentration, and so the movement is in a downward motion. (b) In MCCG, the concentration of water is relatively low in the collagen matrix region, and relatively high in the channel regions, but is at its highest at the frontline of channel formation and lowest in the collagen solution. Movement of water in the unstable system is from low concentration to high concentration, and so the flow of water is from the matrix to the channel, then downwards towards the frontline, and back up to the frontline once it has passed into the collagen solution with low concentration water.
Chapter 4 The Movement of Particles during the Phase Separation Process 35
4.6 Summary and Conclusion In this chapter, it was shown that particles embedded in collagen solution behaved differently during gelation depending on the type of phase separation. In COL, which undergoes NG phase separation, the particles move downwards before being arrested in the collagen network. In MCCG, which undergoes SD phase separation, the particles move sideways and upwards to the edge of the channel structure. While it was originally hypothesized that the particles would follow the movement of the collagen molecules as collagen solution phase separates, the results here indicate that this is not the case.
This was further confirmed when the rate of channel formation, which is assumed to equal the rate of collagen molecule movement, was compared with the rate of particle movement. The velocity of particles was about an order of magnitude lower than that of collagen molecules, which suggests that they are not moving together.
The movement of water was suggested as a possible driving force of the movement of particles, as the movement of water molecules in the NG and SD systems concur with the direction of movement of the particles.
Nevertheless, further studies are required to fully understand the behaviour of particles on phase separation, as well as the effects of phase separation on particle movement. In particular, it would be interesting to further investigate the result of the different particle size affecting phase separation in opposite ways (Figures 4.6c and 4.7c).
4.7 References Alberti, S. (2017) ‘Phase separation in biology’, Current Biology, pp. R1097–R1102. doi: 10.1016/j.cub.2017.08.069.
Biswas, D. P. et al. (2017) ‘Combining mechanical foaming and thermally induced phase separation to generate chitosan scaffolds for soft tissue engineering’, Journal of Biomaterials Science, Polymer Edition. Taylor & Francis, 28(2), pp. 207–226. doi: 10.1080/09205063.2016.1262164.
Favvas, E. P. and Mitropoulos, A. C. (2008) ‘What is spinodal decomposition?’, Journal of Engineering Science and Technology Review, 1, pp. 25–27.
Forgacs, G. et al. (2003) ‘Assembly of collagen matrices as a phase transition revealed by structural and rheologic studies.’, Biophysical Journal, 84, pp. 1272–1280. doi: 10.1016/S0006-3495(03)74942-X.
Ghosh, S. et al. (2017) ‘Particles with selective wetting affect spinodal decomposition microstructures’, Phys. Chem. Chem. Phys. Royal Society of Chemistry, 19(23), pp. 15424–15432. doi: 10.1039/C7CP01816A.
Huang, H. et al. (2013) ‘Peptide Hydrogelation and Cell Encapsulation for 3D Culture of MCF-7 Breast Cancer Cells’, PLoS ONE, 8(3), p. e59482. doi: 10.1371/journal.pone.0059482.
Hyman, A. A., Weber, C. A. and Jülicher, F. (2014) ‘Liquid-Liquid Phase Separation in Biology’, Annual Review of Cell and Developmental Biology, 30, pp. 39–58. doi: 10.1146/annurev-cellbio-100913-013325.

Chapter 4 The Movement of Particles during the Phase Separation Process 36
Li, Y. S. et al. (2006) ‘Treatment of oily wastewater by organic–inorganic composite tubular ultrafiltration (UF) membranes’, Desalination, 196, pp. 76–83. doi: 10.1016/j.desal.2005.11.021.
Loganathan, R. et al. (2016) ‘Extracellular matrix motion and early morphogenesis’, Development, 143, pp. 2056–2065. doi: 10.1242/dev.127886.
Mi, H.-Y., Jing, X. and Turng, L.-S. (2015) ‘Fabrication of porous synthetic polymer scaffolds for tissue engineering’, Journal of Cellular Plastics, 51(2), pp. 165–196. doi: 10.1177/0021955X14531002.
Newman, S. A. et al. (2004) ‘Phase transformations in a model mesenchymal tissue’, Physical Biology, 1(2), pp. 100–109. doi: 10.1088/1478-3967/1/2/006.
Phisarnchananan, N. (2015) The Effect of Particles on the Phase Separation of Waxy Corn Starch plus Galactomannan gums. University of Leeds.
Pourjavadi, A. and Kurdtabar, M. (2007) ‘Collagen-based highly porous hydrogel without any porogen: Synthesis and characteristics’, European Polymer Journal, 43(3), pp. 877–889. doi: 10.1016/j.eurpolymj.2006.12.020.
Rose, J. C. et al. (2017) ‘Nerve Cells Decide to Orient inside an Injectable Hydrogel with Minimal Structural Guidance’, Nano Letters, 17(6), pp. 3782–3791. doi: 10.1021/acs.nanolett.7b01123.
Suri, S. and Schmidt, C. E. (2010) ‘Cell-Laden Hydrogel Constructs of Hyaluronic Acid, Collagen, and Laminin for Neural Tissue Engineering’, Tissue Engineering Part A, 16(5), pp. 1703–1716. doi: 10.1089/ten.tea.2009.0381.
Wang, X. et al. (2010) ‘A complex 3D human tissue culture system based on mammary stromal cells and silk scaffolds for modeling breast morphogenesis and function’, Biomaterials, 31(14), pp. 3920–3929. doi: 10.1016/j.biomaterials.2010.01.118.
Yahata, S. et al. (2017) ‘Effects of three-dimensional culture of mouse calvaria-derived osteoblastic cells in a collagen gel with a multichannel structure on the morphogenesis behaviors of engineered bone tissues’, ACS Biomaterials Science & Engineering, p. acsbiomaterials.7b00190. doi: 10.1021/acsbiomaterials.7b00190.
Yi, X. S. et al. (2011) ‘The influence of important factors on ultrafiltration of oil/water emulsion using PVDF membrane modified by nano-sized TiO2/Al2O3’, Desalination, 281, pp. 179–184. doi: 10.1016/j.desal.2011.07.056.
Chapter 5 Guided Neurite Extension in MCCG 37
Chapter 5. Guided Neurite Extension in MCCG
5.1 Introduction The extracellular matrix (ECM) not only provides a scaffold structure for cells to adhere and grow on, but also serves as the substrate on which cells migrate. For example, although most cells are relatively stationary as part of a tissue under normal circumstances, in the event of tissue damage, fibroblasts, macrophages, and other cells mobilize to the site of injury by crawling along the ECM (Bray, 2001). The ECM also contributes to the development of the central nervous system (CNS) during embryogenesis, providing an adhesive surface onto which growth cones adhere to and are guided to form the intricate and precise networks of the nervous system (Burnside and Bradbury, 2014).
It is widely thought that the interaction between cells and the surface onto which they adhere has an effect on the growth and behaviour of the cells, and therefore cells can be directed to grow along certain pathways by manipulating the surface that they come into contact with. This phenomena of contact guidance can be exploited to control the alignment and direction of elongation of neuronal cells, such as by presenting cells with the features that they are most likely to adhere to – given the option of regular tissue culture dish or tissue culture dish coated with collagen or polyornithine, the growth cones of cells isolated from the dorsal root ganglia (DRG) of chick embryo were observed to preferentially elongate along the coated substrates, suggesting that neural cells prefer to grow on surfaces onto which they adhere most strongly to (Letourneau, 1975). Further control can be achieved by introducing order in the substrate. For example, it was shown that, on surfaces containing parallel-aligned versus non-aligned collagen fibres, the neurites extending from neurospheres of human white matter stem cell–derived neurons (hNSCs) grew parallel along the collagen fibres on the aligned surface, but extended in a radial manner on the non-aligned surface (Lanfer et al., 2010).
Another approach to exert contact guidance is by providing structural barriers or contact points which would confine the cells to grow in a certain direction. It was reported that rat glial cells and differentiated murine neural progenitor cells (mNPCs) grew and extended neurites along grooved substrates with alternate ridge and valley regions (also called gratings), although this is dependent on factors such as the height and width of the ridges/valleys, as well as the spacing between features (Webb et al., 1995; Chua et al., 2014). Pillar-like structures, and micro-channels of different sizes and spacing width, have also been shown to direct the neurite growth of rat and murine neurons, and PC12 cells, respectively (Mahoney et al., 2005; Micholt et al., 2013).
These methods of controlling the elongation of neurites through contact guidance are also often applied in neural tissue engineering to create scaffolds that may be able to guide the regeneration of neurons across nerve gaps resulting from injury. Hydrogels fabricated using isoelectric-aligned collagen solution (Abu-Rub et al., 2011), and polyethylene glycol (PEG)-based hydrogels with aligned embedded microgels that function as non-adherent cell barriers (Rose et al., 2017) have been shown to direct the growth of rat and chicken embryonic DRG explants, respectively. In addition, collagen hydrogels containing aligned poly(ɛ-caprolactone-co-ethyl ethylene phosphate) (PCLEEP) nanofibers (Milbreta et al., 2016) and functionalized multi-channel collagen conduits with parallel collagen fibres lining the channels (Yao et al., 2013) have been reported to improve axonal regeneration after spinal cord injury in rat models.

Chapter 5 Guided Neurite Extension in MCCG 38
The multi-channel collagen gel (MCCG) possess three features that could potentially contribute to contact guidance of neurites: (i) alignment of collagen fibres, (ii) confinement of the neurites to narrow collagen regions by the high density of channels, and (iii) the preferred adherence of cells/neurites to the collagen wall, since there is very little collagen available in the channel lumen. Furthermore, the MCCG is made entirely out of collagen, is easy to prepare without the use of potentially harmful reagents, and no specialty equipment is required to produce it. These make the MCCG a potentially useful candidate as a biomaterial for neural tissue engineering.
Thus, the main aim of this chapter was to investigate the potential of MCCG in guiding the growth of neurites as compared to normal collagen gel (COL), and to identify the feature that contributes to this guidance. In order to do this, the degree of collagen fibre alignment in COL and MCCG were first determined, and the growth of the neurites of PC12 cells in both types of gels were compared. As there have not been any study in which the factors of fibre alignment, confinement, and preferred adherence have been investigated concurrently, MCCGs prepared with different NaCl (ionic) concentrations, which were predicted to possess different fibre alignment and channel density properties, were used to infer the most plausible factor that contributes to the guidance of neurite growth in MCCG.
5.2 Determination of Collagen Fibre Alignment by CRM The MCCG had been shown, using polarized light, to possess birefringence property around the lumen of the channels, indicating that the topography around the channel surface is anisotropic. Based on this, it was inferred that this anisotropic property was due to the collagen fibres being aligned circumferentially near the edges of the channel lumen. (Furusawa et al., 2012; Hanazaki et al., 2013) However, the alignment of collagen fibres had not been quantified. Thus, in this study, confocal reflectance microscopy (CRM) was employed to image collagen fibres near the channel lumen, and the images analysed to determine the alignment factor.
CRM makes use of the intrinsic reflected or back-scattered light of a material without fluorescence staining, and can provide qualitative and quantitative information on its microstructural property (Voytik-Harbin, Rajwa and Robinson, 2001). CRM has been used to visualize collagen fibres in studies investigating the structural and mechanical properties of collagen gels, as well as collagen fibrilogenesis (Brightman et al., 2000; Yang, Leone and Kaufman, 2009; Tran-Ba et al., 2017).
The alignment factor, Af, which was defined as:
= ∫ ( , ) ( )
∫ ( , ) (1)
was proposed as a method to quantitatively reflect the order or alignment in 2D scattering images (Walker and Wagner, 1996), and has been used to determine the orientation of fibrils in an alginate gel (Maki et al., 2011). ϕ = 0 is defined as the alignment direction, and I (q, ϕ) the scattered intensity composed of the separable functions: magnitude of the scattering vector, q, and direction of the planar angle, ϕ. In order to define alignment as +1 for alignment in the horizontal (x-axis) direction, -1 for alignment in the vertical (y-axis) direction, and 0 for zero or partial alignment, the multiple of I (q, ϕ) and cos (2ϕ) is taken to isolate the dominant contribution of asymmetry (non-alignment). In other words, the formula gives the fraction of measured intensity that is aligned in the horizontal (> 0) or vertical direction (< 0).

Chapter 5 Guided Neurite Extension in MCCG 39
MCCG and COL of 2 mm thickness were prepared using the horizontal method as in Chapter 2.1. The gels were cut horizontally to obtain sections that were 2 mm in length, and each section was then flipped onto its thickness side to obtain top view images as follows: 63x objective lens was used with a zoom factor of 1.7, and images were taken at 10 µm-volume stacks from z = 10 µm to z = 20 µm with a step size of 4.99 µm. Prior to capturing images, the samples were oriented so that the collagen fibres in the field of view were parallel to the x-axis. Two images were taken for each sample, and n = 6. For data analysis, a 30 µm x 10 µm window was cropped near the interface between the channel and collagen matrix. The cropped image was converted to 8-bit, and a fast Fourier transform (FFT) image generated. The radial sum of the FFT image intensity (I) from 0 - 360° (ϕ) was obtained using the ImageJ Oval Profile plugin, and the alignment factor, Af, calculated using equation (1) above. An Af value of 0 indicates no preference in the direction of fibre alignment (isotropic), a value of +1 indicates that all fibres are aligned vertically, and a value of -1 indicates that the fibres are aligned horizontally.
Collagen fibres can be observed from the CRM images of MCCG and COL, and it can be seen that the fibres in COL appear to be random in orientation, whereas that of MCCG are almost all aligned parallel to one another (Figure 5.1a). From the FFT images generated from the region cropped close to the channel, COL appears to be isotropic, whereas MCCG is anisotropic, suggesting that the collagen fibres in COL have no preferred orientation, while that in MCCG are preferentially aligned in the horizontal direction in real space. This is supported by the plot of the radial summation of intensities from 0 - 360°, where the relatively uniform height of the peaks in COL is indicative of random fibre alignment, while the two large peaks at 90° and 270° in MCCG indicate a high degree of alignment (Figure 5.1b). The calculated Af for COL was -0.00974, which is significantly closer to 0 than that for MCCG, which was -0.0338 (Figure 5.1c). These results clearly show that the collagen fibres in MCCG are highly aligned near the channel surface, and those in COL are not. A schematic representation of the alignment of collagen fibres in MCCG is depicted in Figure 5.1d, showing the fibres aligned parallel to the channel lumen surface and perpendicular to the channel axis, and it was predicted that the neurites would adhere to and be guided by the path of this collagen fibre alignment.

Chapter 5 Guided Neurite Extension in MCCG 40
Figure 5.1 Collagen fibre alignment in COL and MCCG. (a) CRM images of COL and MCCG showing the collagen fibres in the gel. The fibres in COL appear to be oriented randomly, whereas those in MCCG appear to be aligned parallel to one another. The intensity in the FFT output of the cropped region of COL is relatively uniform, whereas the FFT of MCCG shows a high intensity in the vertical direction, which translates to high intensity in the horizontal direction in real space image. This suggests that COL is isotropic, and while MCCG is anisotropic with a preferred direction of orientation. (b) The sum of the radial intensity of the FFT images were measured from ϕ = 0 to 360°. The relatively uniform heights of the normalized intensity peaks in COL is indicative of randomly oriented fibres, whereas the two peaks at 90° and 270° in MCCG indicate preferred alignment in the horizontal direction. (c) Alignment factor, Af, values of COL (-0.00974) was significantly closer to 0 than that of MCCG (-0.0338), confirming that COL is isotropic, and that the fibres in MCCG have a degree of alignment. (d) Schematic representation of the arrangement of collagen fibres in a channel. The results support the view that the fibres (red dash lines) are aligned parallel to the circumference of the channel, and perpendicular to the axis of the channel (blue arrow). Error bars show standard error of the mean (SEM); n = 3. Statistical significance was determined by two-tailed paired student’s t-test, and * denotes a significance of p<0.05. Scalebar = 20 μm.

Chapter 5 Guided Neurite Extension in MCCG 41
5.3 Neurite Growth in COL vs. MCCG As MCCG possess some of the features that may contribute to contact guidance, it was postulated that it may have the potential to guide the growth direction of neurite extensions. To investigate this, rat adrenal medulla pheochromocytoma PC12 cells, which extend neurite-like processes when treated with nerve growth factor (NGF), were used as model neural cells.
From preliminary experiments with PC12 cells seeded from the top in MCCG prepared by the vertical method in Chapter 2.2, it was observed that the majority of the neurites of differentiated PC12 cells extended along the circumference of the channel lumen (Figure 5.2a). From the side view of cells seeded in MCCG prepared using the horizontal method in Chapter 2.1, the neurites were seen to elongate into the collagen matrix in a manner perpendicular to the axis of the channel (Figure 5.2b). These results appear to support the hypothesis that the neurites would extend along the path laid down by the collagen fibres.
Figure 5.2 Neurite-like processes of PC12 cells seeded in MCCG. (a) Top view of cells seeded in the vertical method MCCG revealed that most neurites extend along the channel surface. (b) Side view of cells seeded in the horizontal method MCCG shows the neurites extending perpendicular to the axis of the channel (direction shown by blue arrow), and parallel along the path of collagen fibre (shown by yellow arrow). Scalebar = 100 μm.
To analyse the straightness of the neurites and the angles at which they extend into the collagen matrix relative to the channels, CLSM images of the side view of COL and MCCG with cells seeded in the channels were obtained as follows: 10x objective lens was used with a zoom factor of 4.0, and images were taken at 10 µm-volume stacks with a step size of 1.5 µm from z = 0 to 60 µm. Images were obtained near the top half of the gels where the channels of MCCG are narrower, as the cells were more concentrated in this region due to the channels being narrower and closer to the inlet. Three sets of images were taken for each sample, and n = 3.

Chapter 5 Guided Neurite Extension in MCCG 42
It could be observed that the cells are contained in the channel region (Ch), and extend their processes into the collagen matrix region (CM), and that the neurites in MCCG appear to grow in a more ordered manner compared to those in COL (Figure 5.3a). The angles at which the neurite-like processes extend out of the channels into the gel matrix region relative to the channel structure (θ), the contour length of the process (L), and its end-to-end length (R) were measured using Image J (Figure 5.3b). Only processes whose entire length from channel surface to growth cone can be observed were measured. The straightness of the processes was calculated as the ratio of L/R, with a ratio of 1 indicating that the processes are completely straight, and the higher the ratio, the less straight the process is.
From these analyses, it was confirmed that the neurites in MCCG grew in a straighter manner compared to those in COL, with a straightness value of 1.0267 for MCCG and 1.065 for COL (Figure 5.3c). The angles at which the neurites extend from the channels also indicate that the neurites follow the path laid out by the collagen fibres, as most neurites extend at a 90 ° angle from the channels of MCCG, whereas those in COL are distributed over a wider range of angles (Figure 5.3d, e). The results here thus show that the processes in MCCG extend straight into the collagen region in a manner perpendicular to the channel axis, whereas those in COL extend in a more disorderly and varied manner, indicating that the growth of the neurite-like processes are highly guided in MCCG.
Thus, it appears that the high degree of collagen alignment in MCCG led to the higher guidance of neurite growth compared to that in COL. However, the density of channels should be considered as a factor that may have contributed to this difference. With a low channel density in COL, the cells may be free to extend their neurites in any direction. On the other hand, the channels in MCCG may have acted as a barrier that confined the neurites to grow in narrower regions. In order to further investigate the factors that contribute to neurite growth guidance in MCCG, MCCGs with different channel properties were studied.

Chapter 5 Guided Neurite Extension in MCCG 43
Figure 5.3 Straightness and angle at which PC12 neurite-like processes extend from the channels of COL and MCCG. (a) CLSM images showing the extension of neurites of cells in the channel region (Ch) into the collagen matrix region (CM). (b) The angle at which the neurites extend from the channel was taken as the angle between the growth cone of the neurite and the channel, and the straightness was calculated as the ratio of contour length, L against end-to-end length, R, of the neurite. (c) The neurites in MCCG grew in a significantly straighter manner compared to that of COL. (d) Most of the neurites in MCCG extended perpendicular to the channel axis, whereas those in COL were distributed over a wider range of angles. (e) The standard deviation of the frequency distribution showed that the difference in distribution of angles between COL and MCCG was significant. Error bars show standard error of the mean (SEM); n = 3. Statistical significance was determined by two-tailed paired student’s t-test, and * denotes a significance of p<0.05. Scalebar = 100 μm.

Chapter 5 Guided Neurite Extension in MCCG 44
5.4 MCCGs Prepared with Different NaCl Concentrations Other than the difference in degree of collagen fibre alignment, another key difference between COL and MCCG is the number of channels in the gel. Due to limitations of available tools, it was only possible to replicate 4 channels in the COL, while the MCCG inherently possesses a much higher density of channels. As the growth of neurites may also be guided by the confinement of growth space such as by using grating, pillar-like structures, or microchannels, it should be investigated whether the spacing between the channels of COL and MCCG may have contributed to the difference in degree of neurite guidance.
As it was not possible to replicate a similar density of channels in COL, MCCGs with different channel densities were used for this study instead. It had been reported previously that the addition of NaCl affects the phase behaviour of collagen solution, resulting in MCCGs with different architecture – increasing the concentration of NaCl led to an increase in channel diameter and a decrease in the number of channels (Furusawa et al., 2015). Although temperature had also been shown to be a parameter to control MCCG architecture (Hanazaki et al., 2013), this method was not chosen because it is difficult to regulate temperature under aseptic conditions (Furusawa et al., 2015). Altering the ionic concentration of collagen solution also has an effect on the rate of collagen fibrilogenesis (Wood and Keech, 1960), which is likely to have an effect on the collagen fibre alignment. Therefore, in this study, the density of channels, the spacing between adjacent channels, and the degree of collagen fibre alignment of MCCGs prepared with different NaCl concentrations were studied.
The MCCGs were prepared as in section 3.2 above, but with the addition of NaCl in both the collagen solution and gelation PBS. The gels were cut at various points along the length to investigate the characteristics of the gel at different depths, with z = 0 mm defined as the origin of the gel formation. For the determination of the number of channels, diameter of channels, total area of channels, and the spacing between channels, CRM top view images were obtained as follows: 5x objective lens was used with a zoom factor of 1.7, and images were taken at 10 µm-volume stacks with a step size of 4.99 µm (Figure 5.4a).
At all NaCl concentrations, the number of channels and diameter of channels decreased and increased, respectively, with increasing depth (Figures 5.4b, c). This pattern is similar to that reported in the previous study, and also indicates that at increasing depths, these values do not reach a plateau. There were no significant differences in the number of channels between the MCCGs prepared at different NaCl concentrations at z = 1 mm and z = 3 mm, but the difference between 1 mM and 3 mM NaCl at z = 2 mm and z = 4 mm were significant, as was that of 2 mM and 3 mM at z = 2 mm. At z greater than 2 mm, there were no differences in the diameter of channels between the different MCCGs, but at z = 1 mm, the diameters in 0 mM and 1 mM were significantly different to those of 3 mM. Thus, it would appear that, in general, there is not much structural differences between the MCCGs prepared with different NaCl concentrations in terms of the number and size of the channels. Nevertheless, these may not fully represent the channel density of the MCCG, as all visible channels were counted for the number of channels, including those cut off at the edges of the image, but only the diameters of whole channels were measured.

Chapter 5 Guided Neurite Extension in MCCG 45
Figure 5.4 Characterisation of MCCGs prepared with different NaCl concentrations. (a) CRM images showing the top view of MCCGs prepared with 0 mM NaCl, 1 mM NaCl, 2 mM NaCl, and 3 mM NaCl, at various depths of the gel. The black regions are the channels, and the red regions are the collagen matrix. (b) The number of channels decreased with increasing depth in all conditions, as (c) the diameter of the channels increased. Error bars show standard error of the mean (SEM); n = 6. * denotes a significance of p<0.05 by Tukey’s post hoc test performed between pairs after performing one-way ANOVA on the groups. Scalebar = 200 μm.

Chapter 5 Guided Neurite Extension in MCCG 46
Instead, it may be more appropriate to consider the total area occupied by the channels (Figure 5.5a), and to determine the density of channels by taking the ratio of the area occupied by channels to that occupied by the collagen matrix (Figure 5.5b). At all depths, the density of channels of 3 mM NaCl was significantly lower than those of other NaCl concentrations, whilst a significant difference was observed between 1 mM and 2 mM at z = 2 mm and z = 3 mm, and between 0 mM and 1 mM at z = 3 mm only. These results imply that the channels in 3 mM NaCl MCCG are spread out further from one another, as less space is occupied by channels in 3 mM NaCl despite there being no difference in the diameter of channels between the different conditions. The spacing between channels was calculated by measuring the distance between the centres of mass of two channels, and subtracting the radii of the channels from this. Measuring the spacing between adjacent channels (Figure 5.5c), it was found that the spacing between channels was significantly higher in 3 mM NaCl at all depths between 2 mM NaCl and 3 mM NaCl, and at z = 2 mm and z = 4 mm between 1 mM NaCl and 3 mM NaCl.
Figure 5.5 Channel density and spacing between channels of MCCGs prepared with different NaCl concentrations. (a) At all depths, the total area occupied by channels was significantly lower in 3 mM NaCl compared to the other conditions, and a similar trend was reflected in (b) the density of channels in MCCG, which was taken to be the ratio of channel area to collagen matrix area. (c) The spacing between adjacent channels, calculated as the distance between the centres of masses of the channels minus their radii, were about 40-100 µm. Error bars show standard error of the mean (SEM); n = 6. * denotes a significance of p<0.05 by Tukey’s post hoc test performed between pairs after performing one-way ANOVA on the groups.

Chapter 5 Guided Neurite Extension in MCCG 47
The two factors that may contribute to neurite growth guidance via the limitation of growth space by the presence of the channel walls are the width of the space between channels, and the proximity of the cells to the channel wall. Microchannel widths of 20-30 μm were shown to have the most significant effect in guiding neurites to grow parallel to the channel wall, while neurites in 40-60 μm wide channels were guided only if they came into contact with the walls (Mahoney et al., 2005). In the MCCGs, the space between adjacent channels were larger than 40 μm, which means that the guidance in MCCG is most likely not due to confinement by the high density of channels, and so the neurites have to come into contact with the channel walls to have its growth affected by the contact guidance.
However, since the cells are seeded directly onto the channels, all cells are already in contact with the channel wall from the beginning. Therefore, contact guidance by proximity to a channel wall also does not explain the difference in degree of neurite guidance between COL and MCCG, because neurites in COL did not grow as straight or in as orderly a manner as those in MCCG, even though the cells are already in contact with the channel wall in both cases.
Thus, the more possible explanation for the guidance of neurites by MCCG is that it is due to the alignment of collagen fibres in MCCG. As changes in ionic concentration is also likely to have an effect on the alignment of collagen fibres, the alignment factor for the MCCGs prepared with different NaCl concentration was also investigated. Analysis of collagen fibre alignment was performed as above in section 5.2 above, but with a zoom factor of 4.0 (Figure 5.6a). Two images were taken for each sample, and n = 6.
All samples of MCCG had an alignment factor with negative values (Figure 5.6b), indicating that the majority of collagen fibres are preferentially oriented in the horizontal direction. The difference in Af values between 0 mM NaCl MCCG in the experiment in section 5.2 (-0.034 in Figure 5.1c), and that in this study of MCCGs with different NaCl concentrations (-0.016 in Figure 5.6b) may have been due to the difference in resolution of the images, as zoom factors of 1.7 and 4.0 were used to obtain the respective images. Indeed, when the fibre alignment of COL was analysed from ZF 4.0 images, the Af value was -0.0063, compared to the value of -0.00974 for ZF 1.7 images.
At z = 1 mm and z = 2 mm, the degree of alignment in 1 mM NaCl was significantly higher than that of 2 mM and 3 mM NaCl, and at z = 3 mm and z = 4 mm, the 3 mM NaCl MCCG has significantly lower degree of alignment compared to all other conditions. From these results, it was predicted that the MCCG with 3 mM NaCl would have a lower guidance effect on the growth of neurites. Hence, the PC12 experiment was repeated with these MCCGs to further investigate the effects of collagen fibre alignment on neurite growth.

Chapter 5 Guided Neurite Extension in MCCG 48
Figure 5.6 Alignment factor of MCCGs prepared with different NaCl concentrations. (a) CRM images of collagen fibres at the matrix-channel interface between two channels in MCCGs prepared with 0 mM NaCl, 1 mM NaCl, 2 mM NaCl, and 3 mM NaCl, at various depths of the gel. The black regions are the channels, and the red regions are the collagen matrix. (b) All MCCGs had negative alignment factor values, indicating that the collagen fibres are aligned in a preferred direction. 3 mM NaCl had a lower degree of alignment compared to all the other conditions at almost all depths. Error bars show standard error of the mean (SEM); n = 6. * denotes a significance of p<0.05 by Tukey’s post hoc test performed between pairs after performing one-way ANOVA on the groups. Scalebar = 10 μm.
Chapter 5 Guided Neurite Extension in MCCG 49
5.5 Neurite Growth in MCCGs with Different NaCl Concentrations Figure 5.7a shows the CLSM results of the experiments with PC12 repeated in MCCGs prepared with different concentrations of NaCl. Although there exists differences in the structural properties of the MCCGs, no significant differences were found in the angles at which the neurites extend into the collagen matrix and their straightness (Figure 5.7b-d). Compared to COL, although the distribution of angles were not significantly different in the different MCCGs, the results indicate that the distributions of angles for MCCGs are narrower than that for MCCG. Furthermore, the neurites in all MCCGs were significantly straighter than those in COL. Therefore, guidance properties for the growth direction of PC12 neurite-like processes of MCCGs were superior to those for COL. However, these results appear to suggest that differences in the structural properties of MCCGs, such as the spacing between channels and the degree of alignment of collagen fibres, do not affect the ability of MCCGs to guide the growth direction of PC12 neurite-like processes. This was in contrast to the prediction that the lower alignment factor of 3 mM NaCl would lead to lower guidance effect of neurite growth.
This may have been due to a threshold effect in the degree of anisotropy required for neurite guidance. In a previous study investigating the degree of patterning on the guidance of PC12 cells, it was shown that, although neurite contact guidance increases with increasing directionality (higher anisotropy), there reached a threshold after which increased guiding cues did not offer much increase in neurite guidance. (Tonazzini et al., 2013). In addition, the study by Rose et al using microgels embedded in a hydrogel as structural barriers to guide the orientation of nerve cells also reported a threshold effect on the volume% of microgels required to see a guidance effect (Rose et al., 2017).
By applying the same method for obtaining alignment factor values on the images from the study of Tonazzini et al., approximate values that correspond to the degree of patterning can be obtained. The data extrapolated were approximately: 0.011 for 5.5 dB (no neurite guidance), 0.017 for 7.9 dB (threshold value), and 0.046 for 12.2 dB (high neurite guidance). The extrapolated values were positive in this case because of the vertical direction in which the patterns are oriented, in contrast to the horizontal direction in which collagen fibres are oriented in our studies. The Af results from section 5.2, where COL = -0.010 and MCCG = -0.034, appears to agree with these values, as the guidance of neurites in COL was significantly lower than that in MCCG.
In the study with MCCGs with different NaCl concentrations (section 5.4), the average Af values were: 0 mM = -0.016, 1 mM = -0.019, 2 mM = -0.016 and 3 mM = -0.012. The magnitude of these values were all above that for no neurite guidance in Tonazzini’s study, and except for 3 mM NaCl, were all close to the threshold value. Furthermore, the magnitude of the Af value of COL was 0.0063, which is well below the magnitude for no neurite guidance. Although it is difficult to directly compare data from different experiments due to many variables such as the materials and methods used and resolution of the images, these comparisons suggest that the alignment of fibres in MCCGs in this study are likely within the threshold range that exerts a guiding effect on neurites.

Chapter 5 Guided Neurite Extension in MCCG 50
Figure 5.7 Cells seeded in MCCGs with different NaCl concentrations. (a) CLSM images of PC12 cells seeded in the channels of MCCGs with different NaCl concentrations. Ch: channel lumen; CM: collagen matrix. (b, c) There were no significant differences in the angles at which the neurite-like processes of PC12 extended into the collagen matrix regions in all conditions, but (d) the growth processes of the neurites were significantly straighter in all MCCGs compared to COL. Error bars show standard error of the mean (SEM); n = 6. Statistical significance was determined by Tukey’s post hoc test performed between pairs after performing one-way ANOVA, p<0.05. Scalebar = 100 μm.
Chapter 5 Guided Neurite Extension in MCCG 51
5.6 Summary and Conclusion In this chapter, it was shown that the collagen fibres in MCCG are highly aligned around the circumference of the channels, whereas that of COL are randomly aligned. This high degree of fibre alignment is thought to be the factor that guides the neurite-like processes of PC12 cells to grow in a straight and orderly manner in MCCG. However, it appears that there is a threshold effect on the degree of alignment required for guidance of neurite growth, as all MCCGs prepared with different NaCl concentrations showed similar levels of neurite growth guidance despite having different structural properties including fibre alignment factor.
Although the bulk of the collagen in the nervous system is type IV collagen, type I collagen is more easily and readily available and has been used in many neural tissue engineering applications with success. Thus, the anisotropy of MCCG contributed by the alignment of collagen fibres makes it a potential biomaterial for neural tissue engineering applications, where the ability to control neurite growth is an important feature.
Further studies may be required to more fully understand the other properties of MCCG, such as mesh size and mechanical properties, but this study has shown that the architecture of MCCG can be controlled by changing the rate of fibrilogenesis such as by altering the ionic concentration of the system. Other factors such as pH, temperature, and the size of MCCG may also have an effect on how MCCG forms, further opening a wide array of possibilities with which properties of MCCG can be controlled.
5.7 References Abu-Rub, M. T. et al. (2011) ‘Nano-textured self-assembled aligned collagen hydrogels promote directional neurite guidance and overcome inhibition by myelin associated glycoprotein’, Soft Matter, 7(6), p. 2770. doi: 10.1039/c0sm01062f.
Bray, D. (2001) ‘Chapter 2: Migration of Cells Over Surfaces’, in Cell Movements: From Molecules to Motility. 2nd edn. Garland Publishing, pp. 17–28.
Brightman, A. et al. (2000) ‘Time-Lapse Confocal Reflection Microcopy of Collagen Fibrillogenesis and Extracellular Matrix Assembly In Vitro’, Biopolymers, 54(2000), pp. 222–234.
Burnside, E. R. and Bradbury, E. J. (2014) ‘Review: Manipulating the extracellular matrix and its role in brain and spinal cord plasticity and repair’, Neuropathology and Applied Neurobiology, 40(1), pp. 26–59. doi: 10.1111/nan.12114.
Chua, J. S. et al. (2014) ‘Extending neurites sense the depth of the underlying topography during neuronal differentiation and contact guidance’, Biomaterials. Elsevier Ltd, 35(27), pp. 7750–7761. doi: 10.1016/j.biomaterials.2014.06.008.
Furusawa, K. et al. (2012) ‘Studies on the formation mechanism and the structure of the anisotropic collagen gel prepared by dialysis-induced anisotropic gelation’, Biomacromolecules, 13(1), pp. 29–39. doi: 10.1021/bm200869p.
Furusawa, K. et al. (2015) ‘Application of Multichannel Collagen Gels in Construction of Epithelial Lumen-like Engineered Tissues’, ACS Biomaterials Science and Engineering, 1(7), pp. 539–548. doi: 10.1021/acsbiomaterials.5b00003.
Hanazaki, Y. et al. (2013) ‘Multiscale analysis of changes in an anisotropic collagen gel structure by culturing osteoblasts’, ACS Applied Materials and Interfaces, 5(13), pp. 5937–5946. doi: 10.1021/am303254e.

Chapter 5 Guided Neurite Extension in MCCG 52
Lanfer, B. et al. (2010) ‘Directed Growth of Adult Human White Matter Stem Cell–Derived Neurons on Aligned Fibrillar Collagen’, Tissue Engineering Part A, 16(4), pp. 1103–1113. doi: 10.1089/ten.tea.2009.0282.
Letourneau, P. C. (1975) ‘Cell-to-substratum adhesion and guidance of axonal elongation’, Developmental Biology, 44(1), pp. 92–101. doi: 10.1016/0012-1606(75)90379-6.
Mahoney, M. J. et al. (2005) ‘The influence of microchannels on neurite growth and architecture’, Biomaterials, 26(7), pp. 771–778. doi: 10.1016/j.biomaterials.2004.03.015.
Maki, Y. et al. (2011) ‘Anisotropic structure of calcium-induced alginate gels by optical and small-angle X-ray scattering measurements’, Biomacromolecules, 12(6), pp. 2145–2152. doi: 10.1021/bm200223p.
Micholt, L. et al. (2013) ‘Substrate Topography Determines Neuronal Polarization and Growth In Vitro’, PLoS ONE, 8(6), pp. 1–14. doi: 10.1371/journal.pone.0066170.
Milbreta, U. et al. (2016) ‘Three-Dimensional Nanofiber Hybrid Scaffold Directs and Enhances Axonal Regeneration after Spinal Cord Injury’, ACS Biomaterials Science and Engineering, 2(8), pp. 1319–1329. doi: 10.1021/acsbiomaterials.6b00248.
Rose, J. C. et al. (2017) ‘Nerve Cells Decide to Orient inside an Injectable Hydrogel with Minimal Structural Guidance’, Nano Letters, 17(6), pp. 3782–3791. doi: 10.1021/acs.nanolett.7b01123.
Tonazzini, I. et al. (2013) ‘Neuronal differentiation on anisotropic substrates and the influence of nanotopographical noise on neurite contact guidance’, Biomaterials. Elsevier Ltd, 34(25), pp. 6027–6036. doi: 10.1016/j.biomaterials.2013.04.039.
Tran-Ba, K. H. et al. (2017) ‘Confocal Rheology Probes the Structure and Mechanics of Collagen through the Sol-Gel Transition’, Biophysical Journal. Biophysical Society, 113(8), pp. 1882–1892. doi: 10.1016/j.bpj.2017.08.025.
Voytik-Harbin, S. L., Rajwa, B. and Robinson, J. P. (2001) ‘Chapter 27: Three-dimensional imaging of extracellular matrix and extracellular matrix-cell interactions.’, in Methods in cell biology. Academic Press, pp. 583–97. doi: 10.1016/S0091-679X(01)63031-0.
Walker, L. M. and Wagner, N. J. (1996) ‘SANS Analysis of the Molecular Order in Poly(γ-benzyl l-glutamate)/Deuterated Dimethylformamide (PBLG/d-DMF) under Shear and during Relaxation’, Macromolecules, 29(6), pp. 2298–2301. doi: 10.1021/ma951127p.
Webb, A. et al. (1995) ‘Guidance of oligodendrocytes and their progenitors by substratum topography.’, Journal of cell science, 108, pp. 2747–2760.
Wood, G. C. and Keech, M. K. (1960) ‘The formation of fibrils from collagen solutions 1. The effect of experimental conditions: kinetic and electron-microscope studies’, Biochemical Journal, 75(3), pp. 588–598. doi: 10.1042/bj0750588.
Yang, Y. L., Leone, L. M. and Kaufman, L. J. (2009) ‘Elastic moduli of collagen gels can be predicted from two-dimensional confocal microscopy’, Biophysical Journal. Biophysical Society, 97(7), pp. 2051–2060. doi: 10.1016/j.bpj.2009.07.035.
Yao, L. et al. (2013) ‘Improved axonal regeneration of transected spinal cord mediated by multichannel collagen conduits functionalized with neurotrophin-3 gene’, Gene Therapy. Nature Publishing Group, 20(12), pp. 1149–1157. doi: 10.1038/gt.2013.42.

Chapter 6 Summary and Conclusion 53
Chapter 6. Summary and Conclusion New biomaterials are constantly being developed for various applications ranging
from tissue engineering and regeneration, drug delivery, and clinical applications. The multi-channel collagen gel (MCCG) is one such biomaterial that was developed recently, and this dissertation aimed to gain a better understanding on the MCCG as well as its potential applications. The objectives were (i) to try out different methods of seeding cells in the MCCG in order to determine if the seeding methods have an effect on the behaviour of the cells, (ii) to study the movement of particles during the phase separation of collagen solution into gel in order to gain an understanding of the behaviour of cells during the gel formation process using the encapsulation seeding method, and (iii) to investigate if the aligned collagen fibres in MCCG are able to guide the growth pathway of neurite-like processes of PC12 model neural cells in order to ascertain the potential of MCCG as a biomaterial for neural tissue engineering.
In chapter 3, different seeding methods that have been used to culture cells three dimensionally were applied to the MCCG, namely seeding cells in on the surface of porous scaffolds, encapsulating cells in a hydrogel, and culturing cells as spheroids. The findings in these studies suggest that cells grow differently depending on the seeding method. Kidney epithelial cells seeded on the surface of the channels grew along the channel structure, whereas those embedded within the collagen matrix formed cysts with hollow cavities (Figure 6.1a). Comparisons were also made between cells seeded in MCCG and normal collagen gel with no multi-channel channel structures (COL). PC12 model neural cells encapsulated as spheroids and as single cells in MCCG extended less neurites than those in COL, and the cell aggregates formed by single cells in COL were much larger than those of MCCG (Figure 6.1b). Further studies may be required to understand the factors leading to these differences, but these observations implicate that it is possible to select the seeding method depending on the desired morphology or structure of engineered tissue.
Figure 6.1 Various seeding methods in collagen hydrogels. (a) Kidney epithelial cells seeded on the surface of MCCG channel grew along the channel surface, while encapsulated cells formed cysts with a hollow cavity. (b) PC12 cells encapsulated as spheroids in MCCG extended fewer neurite-like projections compared to those in COL, and cells encapsulated as single cells in MCCG formed smaller cell aggregates than those in COL.

Chapter 6 Summary and Conclusion 54
In chapter 4, the movement of particles during nucleation and growth (NG) and spinodal decomposition (SD) phase separation processes were investigated by tracking fluorescent microspheres in time-lapse images of the gelation of COL and MCCG, respectively. Particles in a solution undergoing NG in COL were observed to move homogeneously downwards, whereas those going through SD in MCCG were largely moved sideways and upwards to the edge of the channel structure. These movements did not appear to be in agreement with the movement of collagen molecules during phase separation, as was the original hypothesis. This was further confirmed by the finding that the rate of channel formation, which is assumed to equal the rate of collagen molecule movement, was an order of magnitude higher than the rate of particle movement, suggesting that the collagen molecules and particles were not moving together. Instead, it is thought that the movements of the particles in the phase-separating solution are driven by the movement of water (Figure 6.2). However, as there are currently not many studies published on the SD phase separation of collagen, further studies are required to better understand the mechanism of these phenomena. In particular, an interesting observation that NG and SD phase separations were affected differently by a difference in particle size could be worth further investigations to determine how various factors and their variations affect phase separation.
Figure 6.2 The movement of collagen, water, and particles during phase separation. (a) In nucleation and growth (NG) phase separation, molecules move from high concentration regions to low concentration regions. In a collagen solution, collagen molecules move towards the nuclei, whereas water molecules move away from the nuclei. (b) In spinodal decomposition (SD) phase separation, molecules move from low concentration regions to high concentration regions. In a collagen solution, collagen molecules move towards the collagen matrix region and not the channel region. On the other hand, the movement of water is in a convex-like movement from the matrix to the channel, then back up towards the matrix. The movement of the particles appear to coincide with those of the water molecules, and not with those of the collagen molecules, thus suggesting that the movement of the particles are driven by that of water during phase separation.

Chapter 6 Summary and Conclusion 55
In chapter 5, the degree of collagen fibre alignment in MCCG and COL was quantified using confocal reflectance microscopy (CRM) making use of the back-scattered light from collagen fibres. It was confirmed that the collagen fibres in MCCG are highly aligned around the circumference of the channel lumen, whereas those in COL are arranged randomly (Figure 6.3a). Using PC12 cells as model neural cells, it was shown that MCCG provided higher guidance for the growth direction of the neurite-like processes of PC12 cells (Figure 6.3b), and even those with lower degrees of collagen fibre alignment were able to provide this guidance. While these results show that MCCGs have some potential for use in neural tissue engineering, further studies on other properties such as mechanical properties as well as studies using actual neural cells should be carried out to confirm its suitability for such applications.
Figure 6.3 Collagen fibre alignment and the guidance of neurite growth. (a) Quantification of the degree of alignment of collagen fibres near the edges of the channel confirmed that the fibres in MCCG are highly aligned, whereas those in COL are not. (b) PC12 model neural cells seeded in the channels of COL and MCCG revealed that the collagen fibre alignment in MCCG provided guidance to the growth of their neurite-like processes, while those in COL had less guidance.
There is still much to study about the MCCG to fully understand its properties and potential applications, and what has been investigated in this dissertation is only the tip of the iceberg. Nevertheless, the MCCG possesses several qualities that are highly desirable in scaffolds for tissue engineering – high porosity with aligned fibres, and easy to prepare without the use of reagents that may be harmful to cells – which makes it a biomaterial worth studying.