multi-agent global macro-net models: new tools for macro-prudential policy 6 july 2015 athens...
TRANSCRIPT

Multi-Agent Global Macro-net Models: New Tools for Macro-Prudential Policy
6 July 2015
Athens University 12 Stochastic Finance Summer School
Sheri Markose (Economics Dept. University of Essex) [email protected]
The software used in network modelling was developed by Sheri Markose with Simone Giansante and Ali Rais Shaghaghi
Economics Department

Global Macro-Nets:Cross Border Imbalances and Within Country Sectoral Imbalances : Why Do We Need This ?
• 2007 financial crisis highlighted need to model interconnectedness of financial firms (Haldane,2009), non-financial private and public units, both nationally and globally, also transmission channels between financial and real side of economy.
• Equation driven mainstream models only have reduced form feedback methods to characterize global imbalances to do with current account, credit and capital account, carry trades and offshoring of production.
• Global consequences of large scale QE in US, UK and Euro-zone: Many BRICs and Switzerland, in particular, have countervailing strategies for currency appreciation from capital flight from advanced countries (see, Volz, 2012, Agenór and Pereira da Silva , 2011). Estimated at $1.040 -$0.9 Trillion
• Allen et. al. (2011) found “European banks had a surprisingly large exposure to US securitized asset markets”. The IMF (www.imf.org/external/pubs/ft/gfsr/2009/01/pdf/text.pdf) estimates that the banking systems of W. Europe had sustained a 50% equity capital loss (worth $1.6 trillion) from toxic and impaired Residential Mortgage Backed Securities (RMBS).

Within Country Sectoral Imbalance Between the Real and Financial Sectors
• In global dimension to sustainable growth, many have identified threats from the excessive growth of the financial sector (Stockhammer( 2004) , Rajan (2010), Philipon (2012), Moosa (2010), Schularik and Taylor ( 2012), Carvalho and Gabaix (2013 ))
• The Philips curve has become flat and GDP growth is instead positively correlated with leveraged asset prices
• The absence of inflation in the RPI index (why?) leaves conventional monetary policy powerless
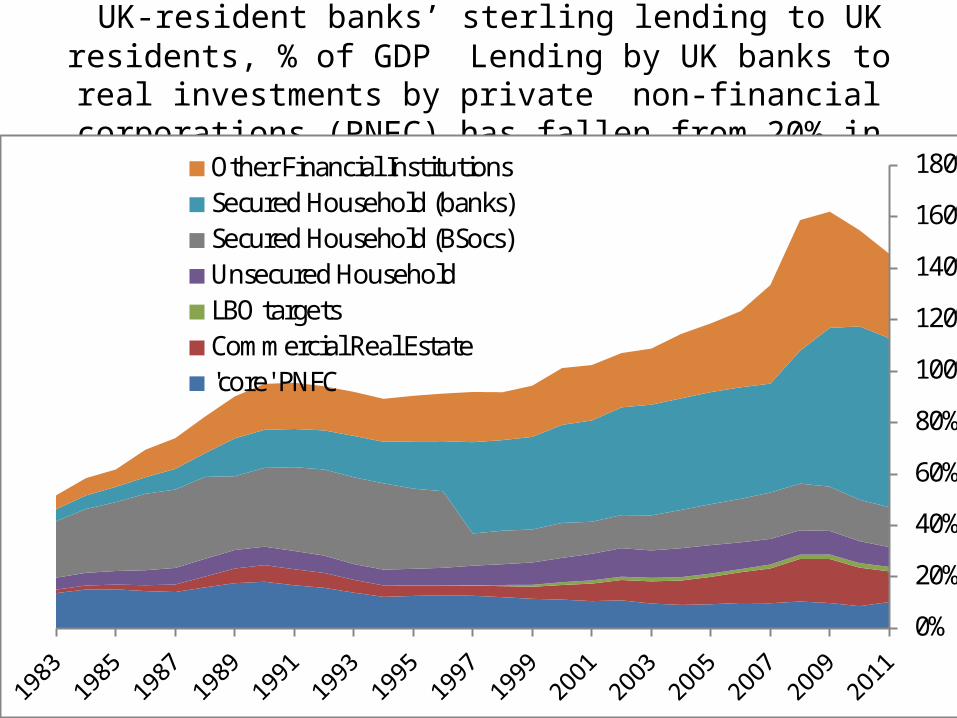
UK-resident banks’ sterling lending to UK residents, % of GDP Lending by UK banks to real investments by private non-financial corporations (PNFC) has fallen from 20% in
1989 to a pitiful 8%
0%
20%
40%
60%
80%
100%
120%
140%
160%
180%Other Financial InstitutionsSecured Household (banks)Secured Household (BSocs)Unsecured HouseholdLBO targetsCommercial Real Estate'core' PNFC
Markose (2012) Systemic Risk Measures in Networks Similar to Carvalho and Gabiax (2013) GDP Volatility Index
for Boom Bust
• C&G (2013) show that increases in their fundamental volatility in GDP index come from changes in shares of largest sectors in economies, rather than from their total factor productivity volatilities.
• C&G argue growth of finance sector as a ratio of GDP, relative to other sectors, which accelerated in late 2005 accounts for the end of Great Moderation. Low volatility in GDP in early 1980’s-mid1990’s due to decline in shares of energy and of heavy manufacturing industries starting in around 1983, making all industrial sectors to have relatively equal shares in terms of GDP.
• Contribution of finance sectors—Depository Institutions, Non-Depository Fls—to fundamental volatility increased tenfold from early 1980s to 2000s, with latest of these sharp movements occurring in mid-1990s and coinciding with rise of fundamental-volatility measure over 1990-2007 :0.44 for Non-Depository Financial Institutions and 0.19 for Depository ones.
Global macro-nets being pioneered by Castren and Rancan (2012) and
Markose et al (2012, 2013)• This framework combines cross border
exposures of banking systems of countries to the liabilities of different macroeconomic sectors of countries with the latter being constrained by the sectoral flow of funds within the countries (see, Castren and Kavounis, 2009, Barwell and Burrows, 2011).
• Main publicly available data source for global flows :BIS consolidated banking statistics. From 2010, BIS extended to include sectoral breakdowns within countries which in turn has to be embellished with the complete sectoral flows between the sectors of each of the national economies.

Adding an Additional Network Layer to Accommodate Off Shore Supply
Chains• Non- financial industrial sectors as described above will be modelled to yield supply chains or production networks. This global macro-net will be a major way in which the spread of real side imbalances and financial contagion within and across countries will increasingly be studied.
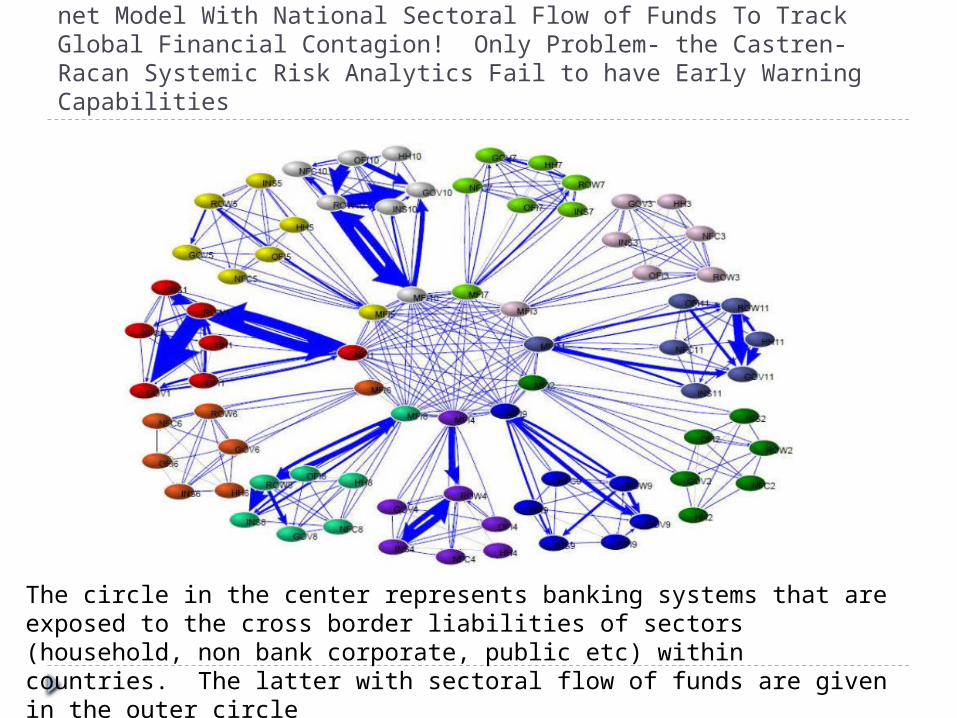
Castren and Racan (ECB 2012 WP) Phenomenal Global Macro-net Model With National Sectoral Flow of Funds To Track Global Financial Contagion! Only Problem- the Castren-Racan Systemic Risk Analytics Fail to have Early Warning Capabilities
The circle in the center represents banking systems that are exposed to the cross border liabilities of sectors (household, non bank corporate, public etc) within countries. The latter with sectoral flow of funds are given in the outer circle

2010 BIS 22 Reporting Banking Systems Macro Network: Sectorial Analysis
B = Banking Sector; NB = Non-Banking; PS = Public Sector ; NA = Non-Allocated

A Financial Intermediary is member of multiple financial markets (multi-layer networks) How to calculate its centrality across the different networks it is present ?Joint Eigen-vector centrality
Multi-Layer Network with common nodes in some layers ; m markets
Single network

Operationalizing SRI (Systemic Risk Index)metrics : What do we want from them ?
• (i) Capacity of SR metrics to provide early warning of potential system failure and the capacity to signal sudden shift in systemic importance of Fis
• (ii)The Role of regulatory capital and liquidity thresholds and SRIs: we recommend relevant points at which system distress is evaluated is before insolvency and system stability is determined at points when capital and/or liquidity thresholds are breached
• (iii)Significance of fixed point mappings for SRIs and systemic importance of FIs: In an important observation first made by Gauthier et al (2010), SRIs in relation to macro-prudential capital (and liquidity buffers) should be modelled in a fixed point framework. Systemic importance depends on other SI nodes in a fixed point; ditto for SRI itself.
• (iv)Analytical ex ante SRI metrics and ex post simulation based capital losses : Ex post SRI metrics based on the average (simulated) losses of capital from financial contagion process or algorithm typically like the Furfine (2003) or the Eisenberg-Noe ones. An ex ante SRI an application of an analytical result that can give prior conditions of system stability in terms of relevant structural parameters.
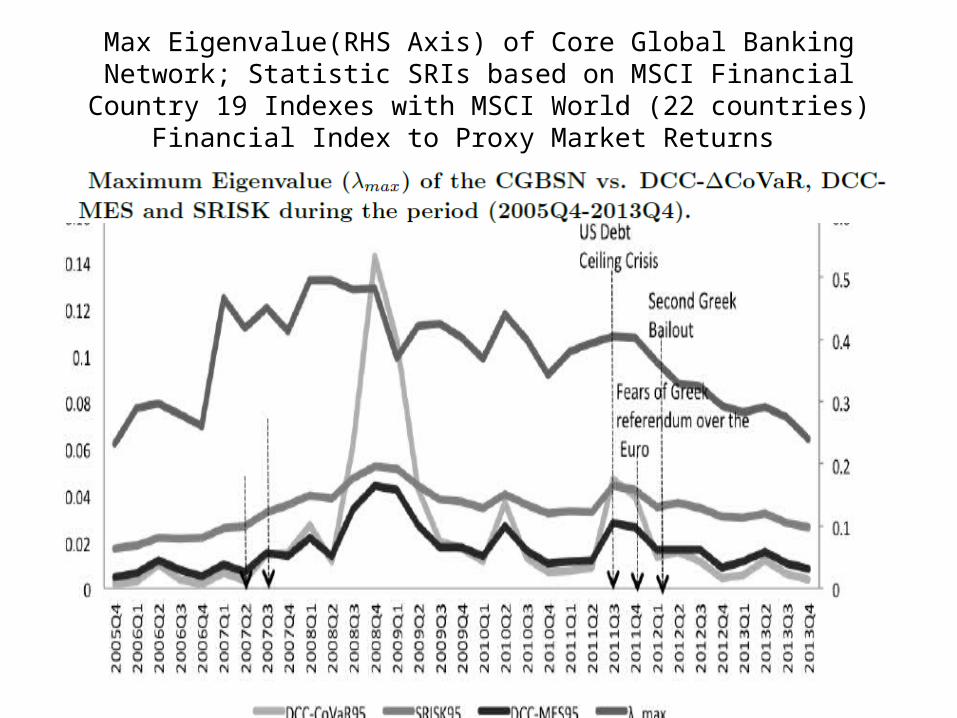
Max Eigenvalue(RHS Axis) of Core Global Banking Network; Statistic SRIs based on MSCI Financial Country 19 Indexes with MSCI World
(22 countries) Financial Index to Proxy Market Returns

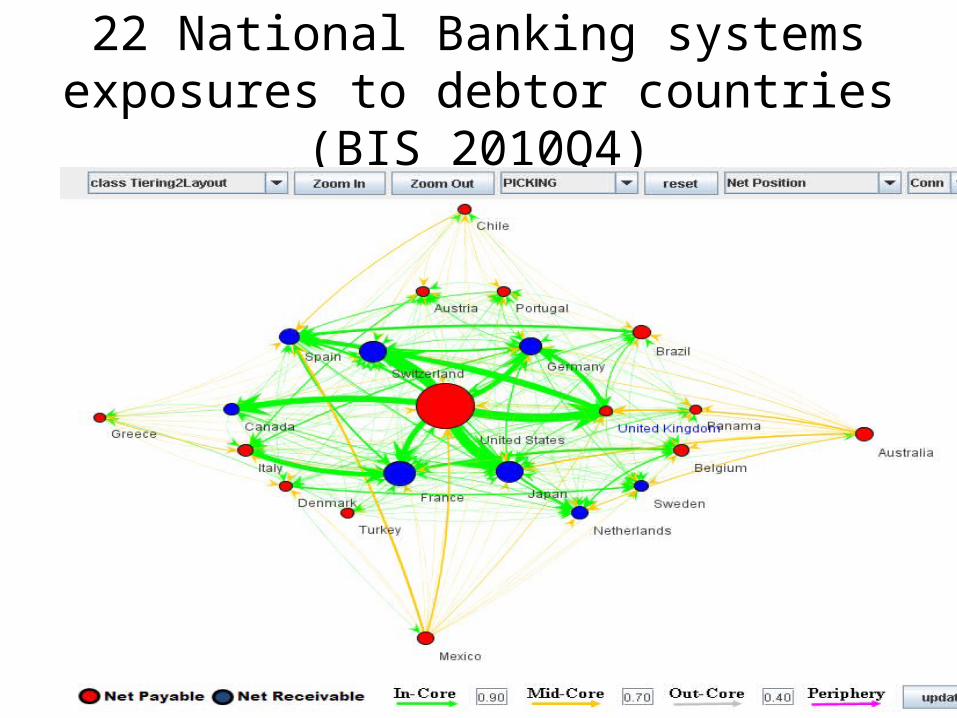
22 National Banking systems exposures to debtor countries (BIS
2010Q4)
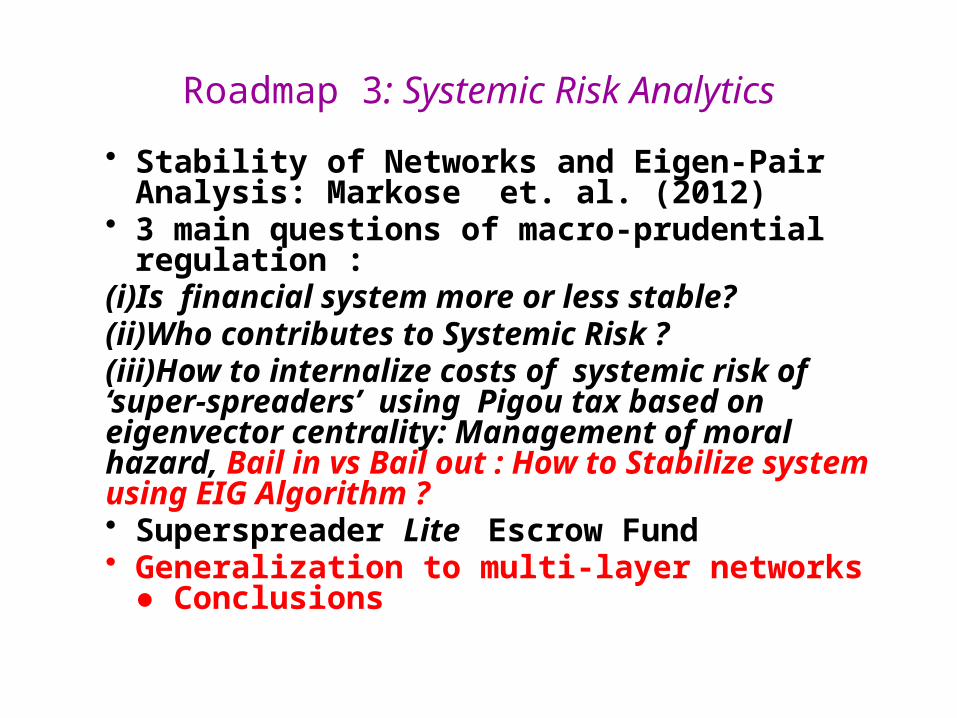
Roadmap 3: Systemic Risk Analytics
• Stability of Networks and Eigen-Pair Analysis: Markose et. al. (2012)
• 3 main questions of macro-prudential regulation :(i)Is financial system more or less stable? (ii)Who contributes to Systemic Risk ? (iii)How to internalize costs of systemic risk of ‘super-spreaders’ using Pigou tax based on eigenvector centrality: Management of moral hazard, Bail in vs Bail out : How to Stabilize system using EIG Algorithm ?• Superspreader Lite Escrow Fund• Generalization to multi-layer networks
● Conclusions

Financial network models to date have yielded mixed results : None about propagators of 2007 crisis (C:
Core; P Periphery (see Fricke and Lux (2012))

Stability Max Eigen value and Tipping Points as Function of Connectivity and Heterogeneity of Node Strength (standard deviation, sigma, of row sum) : From Table note that if sigma is 0, max eigenvalue (in red) or stability is not affected by increasing
connectivity; when sigma is very high a for the star, increasing connectivity reduces max eignenvalue; in the middle row when sigma is not too high, increasing c connectivity
increases instability or max eigenvalue.
Nod
e St
reng
th S
td
Connectivity
SIGMA
0.6
STAR 0.6
COPE-PHER UNBALANCE
0.53
COMPLETE HETEROG
0.5
0.3
RING UNBALANCE
0.53
CORE-PHER 0.64
COMPLETE UNBALANCE
0.57
0
RING 0.6
REGULAR 0.6
COMPLETE 0.6
17% 33% 50% C

Network Stability and Systemic Risk Measure: Why Does Network Structure Matter to Stability ?
lmax s< 1 Formula for network stability
• My work influenced by Robert May (1972, 1974)• Stability of a network system based on the
maximum eigenvalue lmaxof an appropriate dynamical system
• May gave a closed form solution for lmax in terms of 3 network parameters , C : Connectivity , number of nodes N and s Std Deviation of Node Strength : lmax= s All 3 network statistics cannot grow and the network remain stable. Eg a highly asymmetric network with high s such as core periphery, its connectivity has to be very low for it to be stable

Markose et. al. (2012a,b) Eigen Pair Analysis : Endogenous to contractual financial obligations and not on external shocks etc
Stress Test and Systemic Risk Metrics Monitoring Systemic Risk : Is the financial
system becoming more or less stable ? Monitor maximum Eigen-value of the ratio of
net liabilities to Tier 1 capital matrix Cause for concern if max eigen value is
greater than the fixed threshold/ratio of prefunded capital : Focus on policy relevant regulatory variable
Advantages: Certifiable and transparent contractual obligations; I do not think a FI can be held culpable for pre existing macro conditions or for unknowable losses from fire sales.
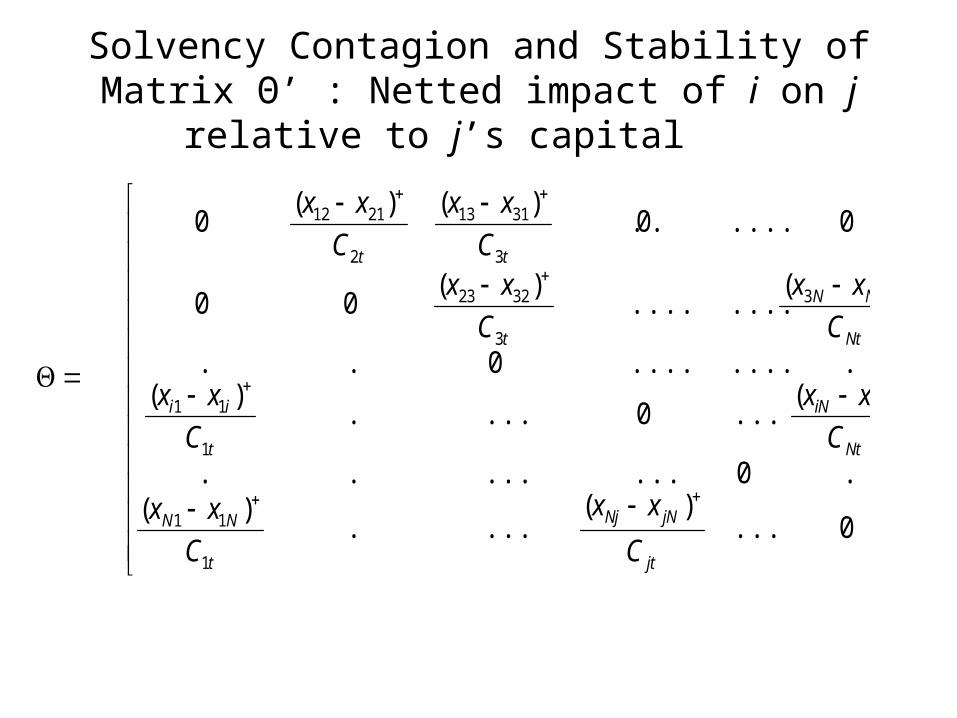
Solvency Contagion and Stability of Matrix Θ’ : Netted impact of i on j relative to j’s capital
)2(
0...)(
....)(
.0........
)(...0....
)(.........0..
)(........
)(00
0.....0.)()(
0
1
11
1
11
33
3
3223
3
3113
2
2112
jt
jNNj
t
NN
Nt
NiiN
t
ii
Nt
NN
t
tt
C
xx
C
xx
C
xx
C
xx
C
xx
C
xxC
xx
C
xx

From Epidemiology : Failure of i at q+1 determined by the criteria that losses exceed a predetermined
buffer ratio, r, of Tier 1 capital
•iq+1 = (1 - r) uiq+ (2)
(i)First term i’s own survival probability given by the capital Ciqit has remaining at q relative to initial capital Ci0, r is common cure rate and (1 -r) is rate of not surviving in the worst case scenario.
(ii) The sum of ‘infection rates’= sum of net liabilities of its j failed counterparties relative to its own capital is given by the term

Stability of the dynamical network system : Eigen Pair (λmax , v)
In matrix algebra dynamics of bank failures given by:
Ut +1 = [´ + (1- )I] Ut = Q Ut (3) I is identity matrix and is the % buffer
λmax is maximum eigenvalue of Θ
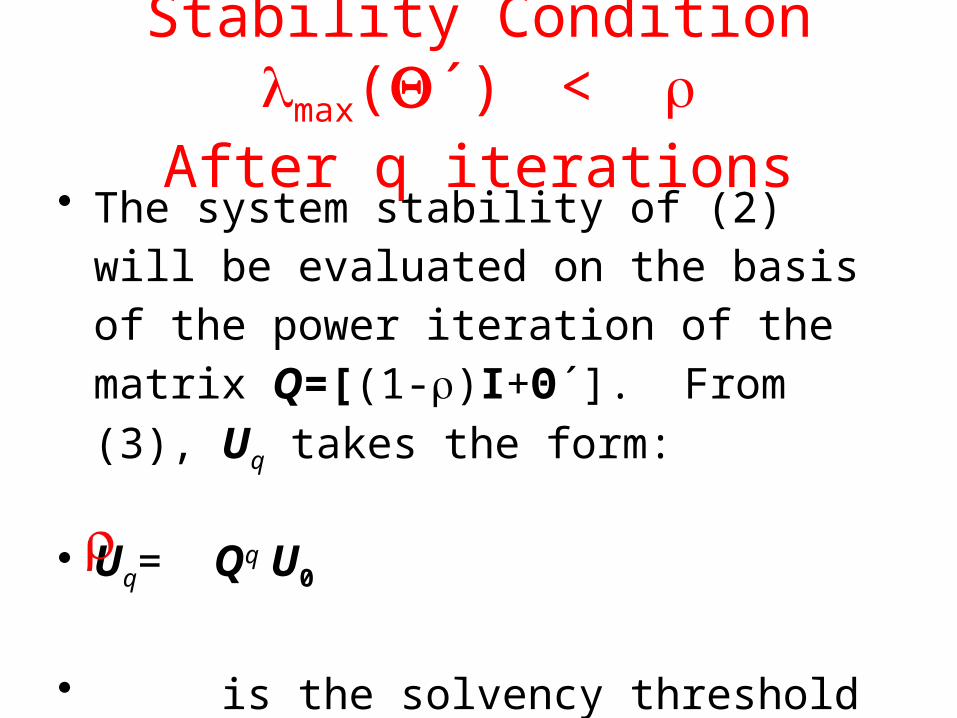
Stability Condition lmax(Q´) < rAfter q iterations
• The system stability of (2) will be evaluated on the basis of the power iteration of the matrix
Q=[(1-r)I+Θ´]. From (3), Uq takes the form:
• Uq= Qq U0
• is the solvency threshold in terms of Tier 1 capital (care should be taken if criteria is specified in terms of Basel IIRWA Capital Ratio)

• Stress Tests: Follow Furfine (2003) Algorithm
• Criteria of failure of a bank in the contagion analysis is based on the Basel rule that
(Tier 1 capital – LGD)/ RWA < 0.06 = TRWA.
• Here LGD is loss given default and the threshold for bank failure in terms of RWA is denoted as TRWA.
• However, as the practical aspects of insolvency requires recapitalization, it is important to see the equivalence of the above Basel rule with a Tier 1 capital threshold criteria (Tc) for failure :
• Tc = 1 - TRWA .
Basel II Criterion of Failure
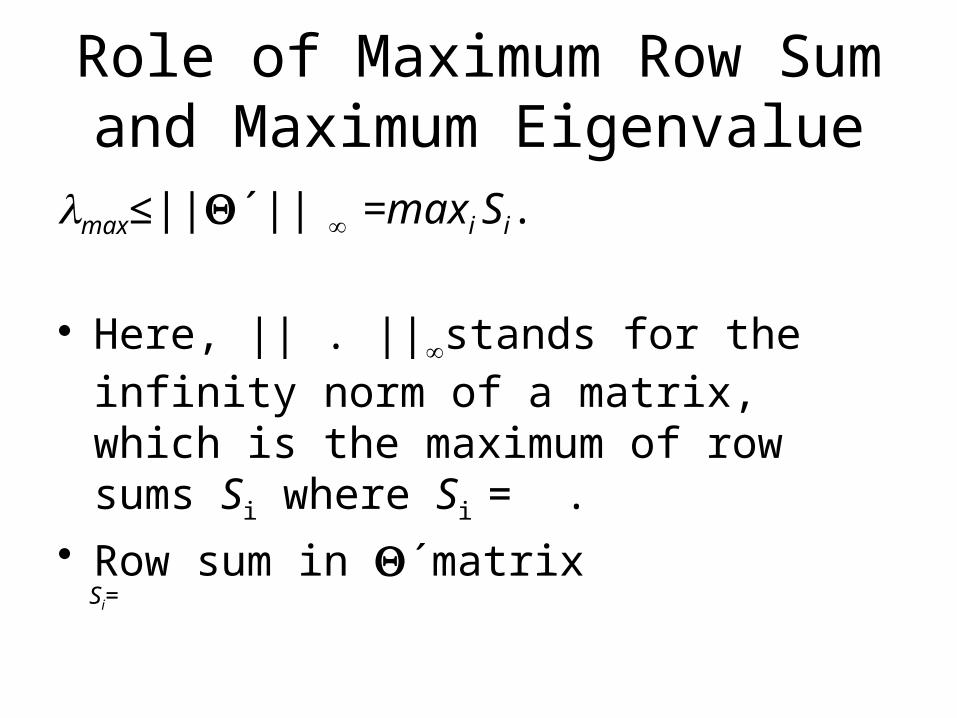
Role of Maximum Row Sum and Maximum Eigenvalue
lmax≤||Q´|| =maxi Si.
• Here, || . ||stands for the infinity norm of a matrix, which is the maximum of row sums Si where Si = .
• Row sum in Q´matrix
Si=
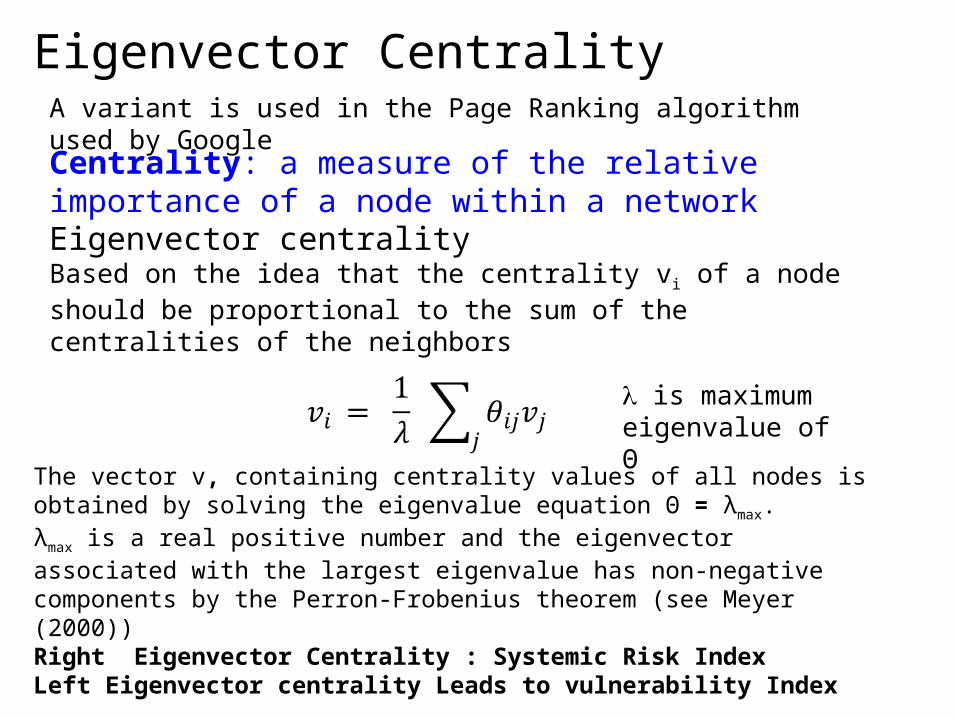
Eigenvector Centrality
Centrality: a measure of the relative importance of a node within a network
Eigenvector centralityBased on the idea that the centrality vi of a node should be proportional to the sum of the centralities of the neighbors
is maximum eigenvalue of Θ
A variant is used in the Page Ranking algorithm used by Google
The vector v, containing centrality values of all nodes is obtained by solving the eigenvalue equation Θ = λmax. λmax is a real positive number and the eigenvector associated with the largest eigenvalue has non-negative components by the Perron-Frobenius theorem (see Meyer (2000))Right Eigenvector Centrality : Systemic Risk Index Left Eigenvector centrality Leads to vulnerability Index

How Useful is the Eigen Vector Centrality Rank Order As a Proxy for Furfine Losses of Capital ?
Pearson Correlation in the Rank Order of Eigen vector centrality of bank and that of Furfine Capital Losses when bank fails as a ‘trigger’2011 Q1 Q2 Q3 Q4
Pearson Correlation 0.948 0.980 0.989 0.930
Scatter Plot of Pearson Correlation of 0.98993 in the Rank Order of Eigenvector centrality (EVC) and that of Furfine Losses (1 being the highest and 76 is lowest) Q3 2011
0 10 20 30 40 50 60 70 800
10
20
30
40
50
60
70
80
EVC rank order
Fu
rfin
e L
oss
es r
ank
ord
er
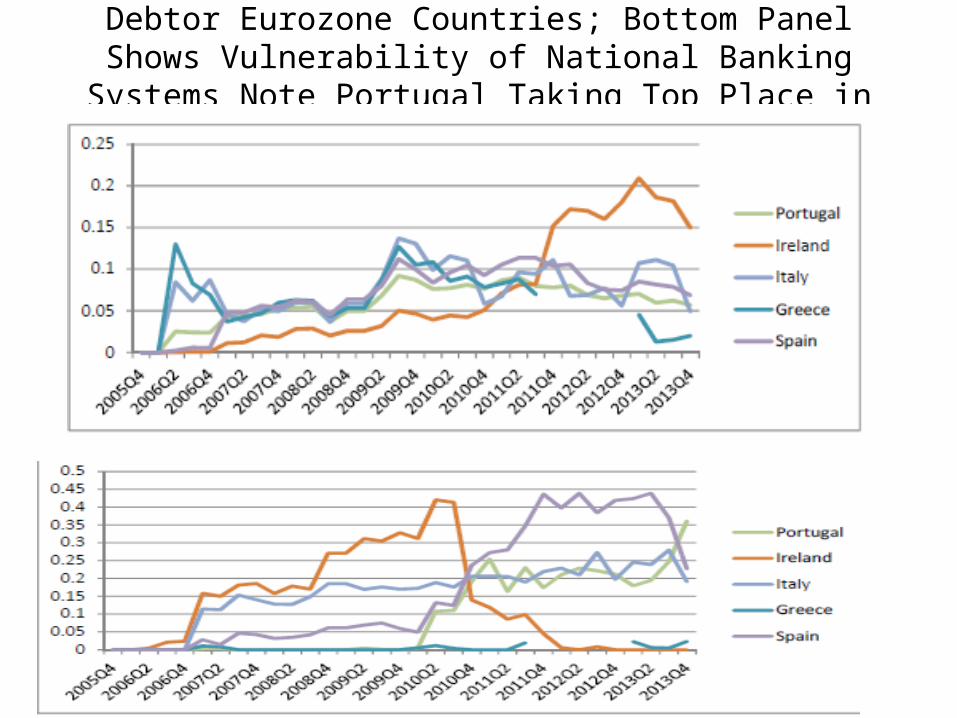
Top Panel Gives Systemic Importance of Debtor Eurozone Countries; Bottom Panel Shows Vulnerability of National
Banking Systems Note Portugal Taking Top Place in 2013
Concluding Remarks• Using network analysis, there is much scope in
relating systemic risk with sustainable GDP growth, viz. marrying macro-pru with GDP volatility
• In eigen-pair method, instability is caused by nodes that have high market share (taking the row sum) similar to the Carvalho and Gabaix measures of GDP volatility.
• Granularity can be added at the level of within country non financial sectors to assess if shrinkage of supply chains with offshoring is making national economies brittle

References:(1) Markose, S.M (2013) "Systemic Risk Analytics: A Data Driven Multi-Agent Financial Network (MAFN) Approach", Journal of Banking Regulation , Vol.14, 3/4, p.285-305, Special Issue on Regulatory Data and Systemic Risk Analytics.(2) Markose, S. (2012) “Systemic Risk From Global Financial Derivatives: A Network Analysis of Contagion and Its Mitigation With Super-Spreader Tax”, November, IMF Working Paper No. 12/282, (3) Markose, S., S. Giansante, and A. Shaghaghi, (2012), “Too Interconnected To Fail Financial Network of U.S. CDS Market: Topological Fragility and Systemic Risk”, Journal of Economic Behavior and Organization, Volume 83, Issue 3, August 2012, P627-646 http://www.sciencedirect.com/science/article/pii/S0167268112001254(3)Multi-Agent Financial Network (MAFN) Model of US Collateralized Debt Obligations (CDO): Regulatory Capital Arbitrage, Negative CDS Carry Trade and Systemic Risk Analysis, Sheri M. Markose, Bewaji Oluwasegun and Simone Giansante, Chapter in Simulation in Computational Finance and Economics: Tools and Emerging Applications Editor(s): Alexandrova-Kabadjova B., S. Martinez-Jaramillo, A. L. Garcia-Almanza, E. Tsang, IGI Global, August 2012.http://www.acefinmod.com/CDS1.html
