mta stakeholder work group - maryland department … work group • purpose of stakeholder work...
TRANSCRIPT
Summary Report
MTA Stakeholder Work Group
1
October, 2015
2
Stakeholder Work Group
• Purpose of Stakeholder Work Group • Stakeholder Work Group Outreach Meetings • Key Themes • Transit Priorities • MTA Overview of Baltimore Transit Services • Data Collection Efforts • Performance Website • Moving Forward
Focusing on Workforce and Customer Needs & Priorities
3
Purpose • To provide safe, efficient and reliable transit services across
Maryland with world class customer service. • To respond to 2015 Session Legislative Proposals and FY 2015
Operating Budget Language aimed at improving transit services. • To outreach to stakeholders to seek input on the transit service
needs of the business community and transit users in the region. • To identify opportunities to improve transit services in the region. • To develop performance data and post online by October 1, 2015. • To ensure that the concerns and recommendations of MTA’s
stakeholders are heard, understood, and implemented as appropriate.
4
Stakeholder Meetings
• Meeting #1 – June 24th Focusing on Business Needs • Meeting #2 – August 3rd Focusing on Transit Needs • Elected Official Meeting – August 10th • Meeting #3 – September 10th Focusing on Workforce and Customer Needs
and Priorities in the West Baltimore Region • Elected Official Facility Tour – September 22nd • Meeting #4 – September 28th Focusing on Workforce and Customer Needs
and Priorities in the East Baltimore Region • Over 400 Attendees at Four Stakeholder Work Group Meetings • Other Stakeholder Outreach & Participation:
– Transit Choices Meetings – City School Meetings – Other

5
Key Themes
• Increase Transit Reliability & Ridership – Provide a better, more reliable transit experience; affordable transit fares; cool, easily identifiable routes.
• Need Safe & Secure Transit – More shelters, lighting, and more of a police presence.
• Improve Transit Connections & Access to Jobs – Better connections to jobs, school, commerce, especially major employers in the region (consider Port of Baltimore, universities, hospitals, casino(s), Fort Meade, Arundel Mills, Sparrows Point, Annapolis, etc.).
• Improve Ease of Use; Transit Experience – Better integration and mapping; use universal fare cards, make transit easy to use, frequent, clean, better quality, with next bus info.
• Improve Flexibility and Efficiency of the Transit System – Consider the 24 hour needs, new travel patterns, and flex times.
• Improve the Buses – Add transit vehicles, announce stops, reduce bus crowding, ensure bus operators are polite, friendly, knowledgeable and well-trained.
6
Key Themes – Continued
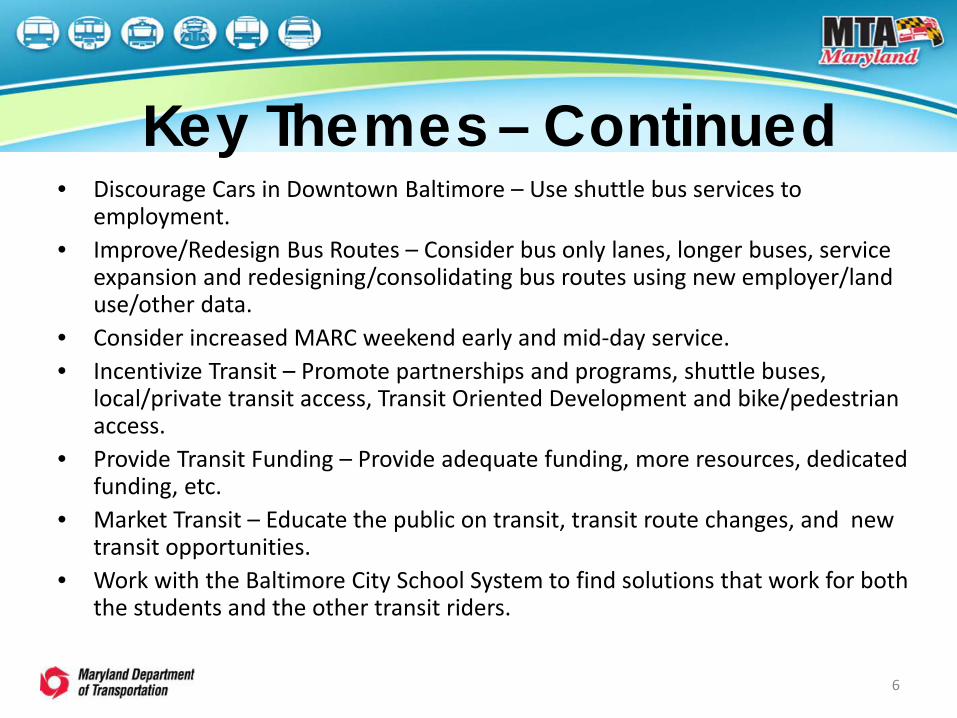
• Discourage Cars in Downtown Baltimore – Use shuttle bus services to employment.
• Improve/Redesign Bus Routes – Consider bus only lanes, longer buses, service expansion and redesigning/consolidating bus routes using new employer/land use/other data.
• Consider increased MARC weekend early and mid-day service. • Incentivize Transit – Promote partnerships and programs, shuttle buses,
local/private transit access, Transit Oriented Development and bike/pedestrian access.
• Provide Transit Funding – Provide adequate funding, more resources, dedicated funding, etc.
• Market Transit – Educate the public on transit, transit route changes, and new transit opportunities.
• Work with the Baltimore City School System to find solutions that work for both the students and the other transit riders.

7
MTA Transit Priorities
• Improve reliability of service (on-time performance) • Reduce overcrowding on buses • Improve vehicle speed • Decrease passenger trip times • Increase the percentage of population within walking distance of transit. • Increase the number of jobs accessible by transit by increasing service to major
regional job centers • Align the bus network with current and projected travel patterns and land use • Improve connections between bus lines and between bus and other transit • Improve suburb-to-suburb connections without creating lengthy routes through
downtown • Increase the number of passengers carried per hour • Reduce the operating cost per passenger • Improve bus stop amenities across the system through an adopt-a-stop program • Implement a robust and accurate real-time bus arrival application for smart phones,
etc.

8
Stakeholder Transit Priorities
#1 Improve reliability of service #2 Increase the number of jobs accessible by transit by increasing service to major regional job centers #3 Improve connections between bus lines and between bus and other transit #4 Reduce overcrowding on buses #5 Improve bus stop amenities #6 Decrease passenger trip times #6 Improve suburb-to-suburb connections without creating lengthy routes through downtown #6 Implement a robust and accurate real-time bus arrival application for smart phones, etc.

9
Scope of the MTA
• MTA is the 13th largest public rapid transit system* in the nation.
• Provides services 24/7 and operates over 1,350 vehicles during peak periods.
• Annual ridership: More than 113 million riders in FY2014.
• MTA employs over 3,300 people (3/4 of which are union employees).
• MTA has 3 unions: ATU Local 1300 (Operators and Maintenance), OPEI Local 2 (Schedule Makers, Clerks, and Accountants), and AFSCME Local 1859 (Sworn Police, Security Guards, and Fare Inspectors).
*APTA’s most recent ranking.
MTA’s mission is to provide safe, efficient and reliable transit services across Maryland with world class customer service.

10
Functions of the MTA • Operates throughout the State of Maryland, primarily in the Baltimore
metropolitan area:
o Local Bus, Metro Subway, Light Rail o MARC Train, Commuter Bus o Mobility paratransit services o Freight
• Contracts with Amtrak and Bombardier to operate MARC Train
• Commuter Bus outsourced to seven private companies throughout Maryland
• Mobility paratransit is a contracted service
• Provides funding and statewide support of Locally Operated Transit Systems (LOTS) in local jurisdictions in Maryland
• Liaison with WMATA in Montgomery and Prince George’s Counties

Local Bus Fiscal Year 2014 Total Annual Ridership 75,780,350
Average Weekday Ridership 245,121 # of Coaches 730 # of Revenue Miles Traveled 20,047,418 # of Revenue Hours Operated 1,738,160 Operating Cost per Revenue Mile $13.09
Buses debuted in Baltimore in 1909 Light Rail Fiscal year 2014 Total Annual Ridership 8,105,743
Average Weekday Ridership 25,183 # of Passenger Cars 53 # of Revenue Miles Traveled 3,102,718 # of Revenue Hours Operated 157,896 Operating Cost per Revenue Mile $14.45
Light Rail opened for service in 1992 Metro Rail Fiscal Year 2014 Total Annual Ridership 14,632,430
Average Weekday Ridership 47,322 # of Passenger Cars 100 # of Revenue Miles Traveled 5,044,282 # of Revenue Hours Operated 207,550 Operating Cost per Revenue Mile $12.08
Metro Subway opened for service in 1983 11
Core Service

12
MTA Bus
Bus Fiscal Year 2014 Total Annual Ridership 75,780,350 Average Weekday Ridership 245,121 # of Coaches 730 (363 Hybrid) # of Revenue Miles Traveled 20,047,418 # of Revenue Hours Operated 1,738,160
Bus Became publicly operated in 1971. Is the largest of MTA’s core modes operating in and around the Baltimore metropolitan area. Provides 66.5% of MTA’s total rides. Has 4 main Bus divisions and several support shops.
13
MTA Light Rail
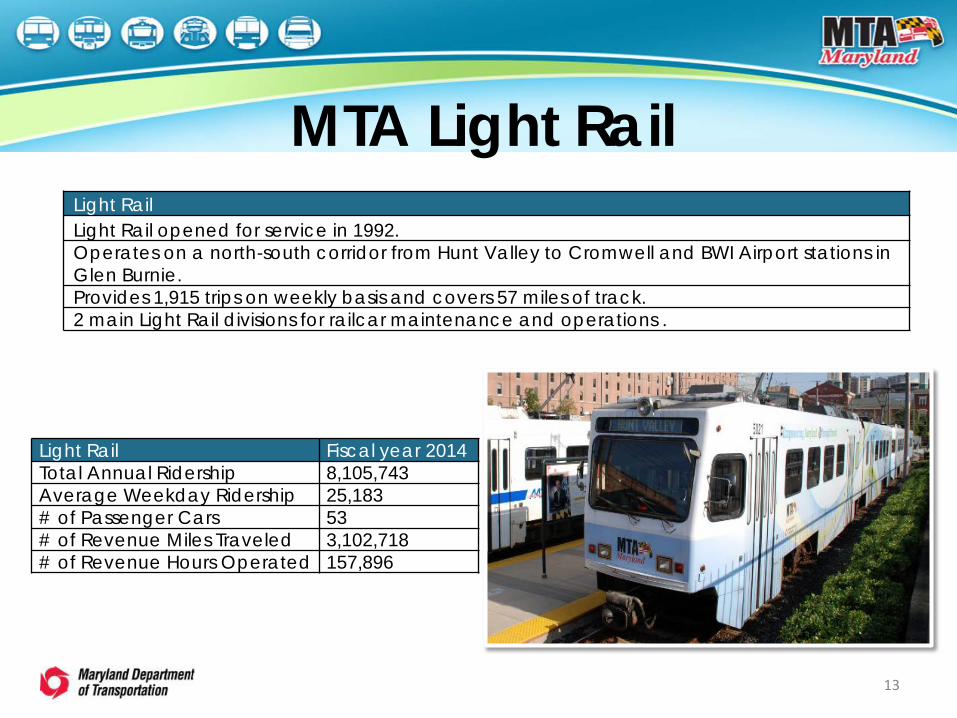
Light Rail Fiscal year 2014 Total Annual Ridership 8,105,743 Average Weekday Ridership 25,183 # of Passenger Cars 53 # of Revenue Miles Traveled 3,102,718 # of Revenue Hours Operated 157,896
Light Rail Light Rail opened for service in 1992. Operates on a north-south corridor from Hunt Valley to Cromwell and BWI Airport stations in Glen Burnie. Provides 1,915 trips on weekly basis and covers 57 miles of track. 2 main Light Rail divisions for railcar maintenance and operations .
14
MTA Metro Subway
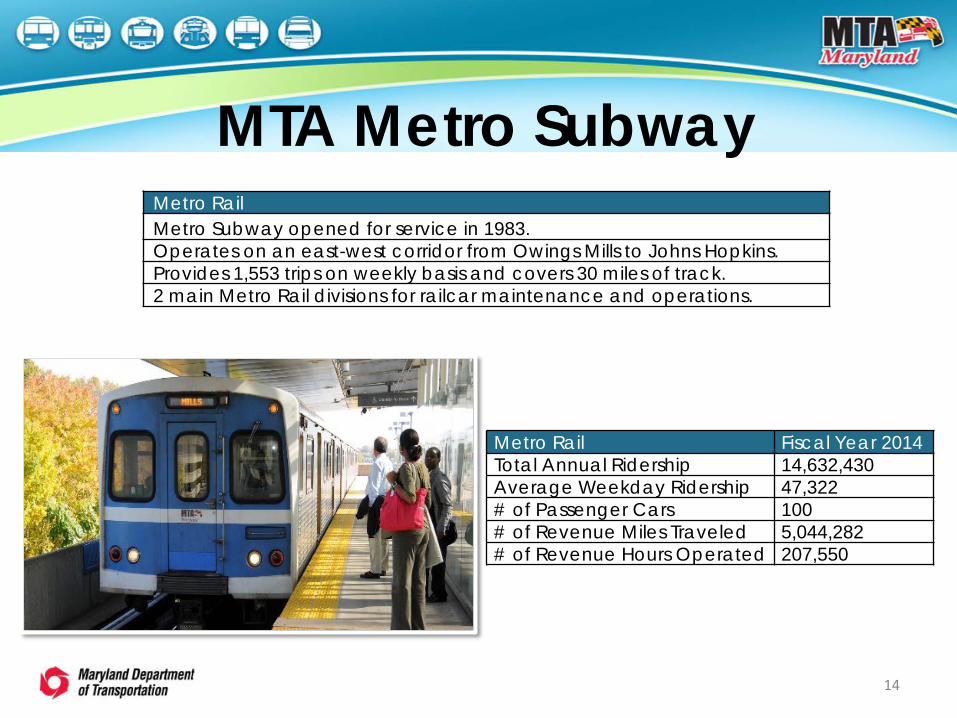
Metro Rail Fiscal Year 2014 Total Annual Ridership 14,632,430 Average Weekday Ridership 47,322 # of Passenger Cars 100 # of Revenue Miles Traveled 5,044,282 # of Revenue Hours Operated 207,550
Metro Rail Metro Subway opened for service in 1983. Operates on an east-west corridor from Owings Mills to Johns Hopkins. Provides 1,553 trips on weekly basis and covers 30 miles of track. 2 main Metro Rail divisions for railcar maintenance and operations.
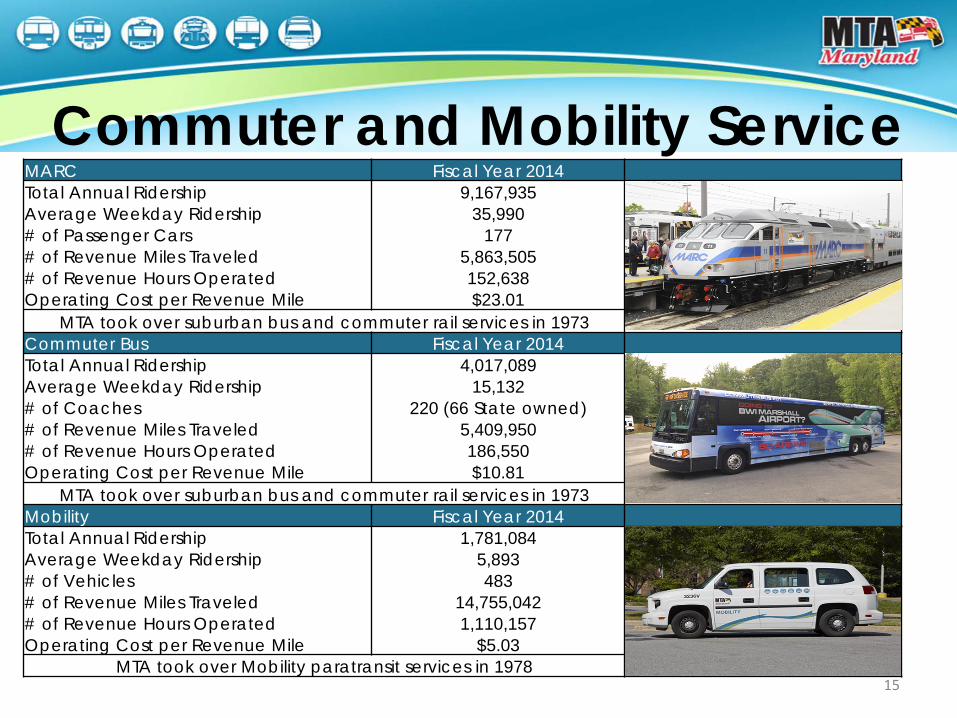
MARC Fiscal Year 2014 Total Annual Ridership 9,167,935
Average Weekday Ridership 35,990 # of Passenger Cars 177 # of Revenue Miles Traveled 5,863,505 # of Revenue Hours Operated 152,638 Operating Cost per Revenue Mile $23.01
MTA took over suburban bus and commuter rail services in 1973 Commuter Bus Fiscal Year 2014 Total Annual Ridership 4,017,089
Average Weekday Ridership 15,132 # of Coaches 220 (66 State owned) # of Revenue Miles Traveled 5,409,950 # of Revenue Hours Operated 186,550 Operating Cost per Revenue Mile $10.81
MTA took over suburban bus and commuter rail services in 1973 Mobility Fiscal Year 2014 Total Annual Ridership 1,781,084
Average Weekday Ridership 5,893 # of Vehicles 483 # of Revenue Miles Traveled 14,755,042 # of Revenue Hours Operated 1,110,157 Operating Cost per Revenue Mile $5.03
MTA took over Mobility paratransit services in 1978 15
Commuter and Mobility Service
16
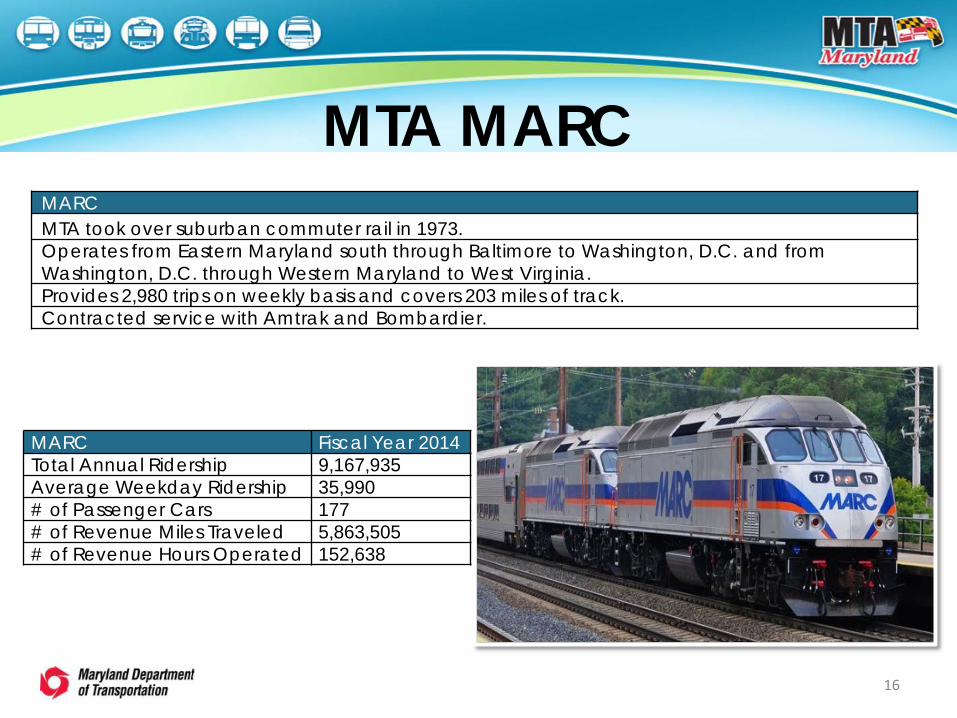
MTA MARC
MARC Fiscal Year 2014 Total Annual Ridership 9,167,935 Average Weekday Ridership 35,990 # of Passenger Cars 177 # of Revenue Miles Traveled 5,863,505 # of Revenue Hours Operated 152,638
MARC MTA took over suburban commuter rail in 1973. Operates from Eastern Maryland south through Baltimore to Washington, D.C. and from Washington, D.C. through Western Maryland to West Virginia. Provides 2,980 trips on weekly basis and covers 203 miles of track. Contracted service with Amtrak and Bombardier.

17
MTA Commuter Bus
Commuter Bus Fiscal Year 2014 Total Annual Ridership 4,017,089 Average Weekday Ridership 15,132
# of Coaches 220 (66 State owned)
# of Revenue Miles Traveled 5,409,950 # of Revenue Hours Operated 186,550
Commuter Bus MTA took over commuter bus services in 1973. Operates throughout Maryland with destinations to Baltimore to Washington, D.C. Provides 496 trips on weekly basis. Contracted service with multiple bus companies.

18
MTA Mobility
Mobility Fiscal Year 2014 Total Annual Ridership 1,781,084 Average Weekday Ridership 5,893 # of Vehicles 483 # of Revenue Miles Traveled 14,755,042 # of Revenue Hours Operated 1,110,157
Mobility MTA took over Mobility paratransit services in 1978. Operates within ¾ miles of fixed route network throughout the Baltimore metropolitan area. Provides 31,262 trips on weekly basis, scheduled on a as-needed basis. Contracted service with First Transit, MV and Veolia.
19
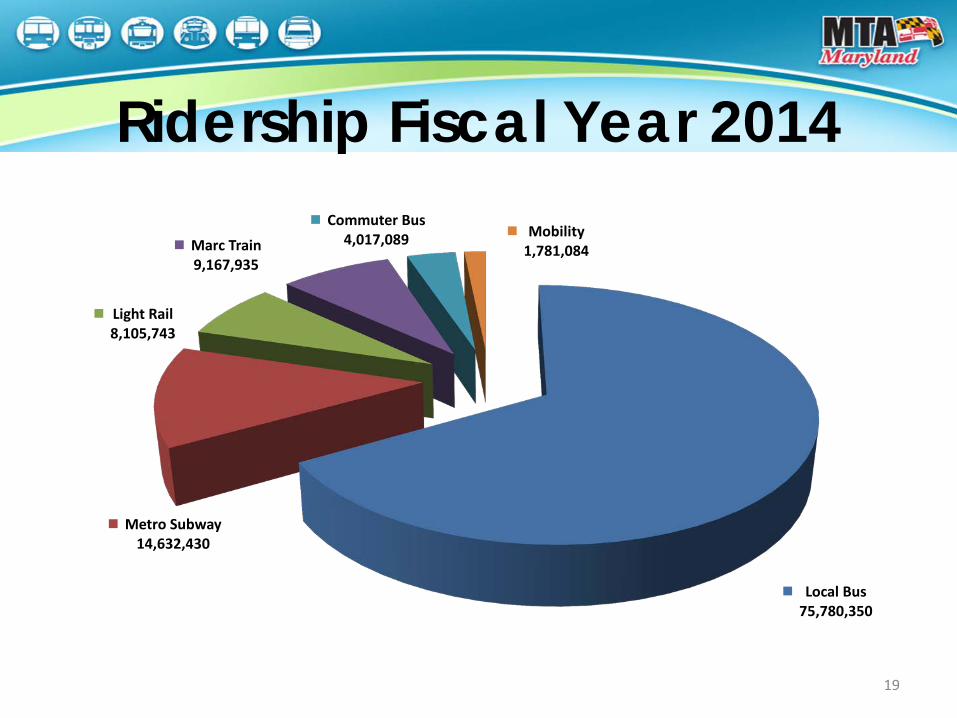
Ridership Fiscal Year 2014
Local Bus 75,780,350
Metro Subway 14,632,430
Light Rail 8,105,743
Marc Train 9,167,935
Commuter Bus 4,017,089 Mobility
1,781,084

20
Ridership Comparison
FY12 Total FY13 Total FY14 Total FY15 to date through May
Bus 79,535,067 80,070,751 75,780,350 72,126,255
Metro 15,364,164 15,208,352 14,632,430 12,834,813
Light Rail 8,539,996 8,647,381 8,105,743 7,054,350
Mobility 1,554,592 1,651,198 1,781,084 1,727,666
MARC 8,451,695 9,062,254 9,167,935 8,415,790
Commuter Bus 4,289,775 4,187,141 4,017,089 3,671,267
Total Annual Ridership 118,080,758 119,259,611 113,992,349 106,381,493

21
On-Time Performance FY12
Average FY13
Average FY14
Average FY15
Average Bus 82.7% 81.7% 80.8% 80.9% Metro 96.5% 97.2% 96.2% 95.4% Light Rail 96.1% 97.5% 95.9% 96.7%
Mobility 89.8% 89.4% 91.2% 87.2% MARC 92.6% 93.3% 92.0% 92.3%

22
• Fare recovery is the percent of operating cost recovered through revenue. • Transit modes to be reported are identified in Transportation Article, § 7-208(b)(2). • MTA uses gross expenses by mode and adjusts the expenses by including insurance, changes
in inventory levels, pro-rated share of administrative costs per the proportional size of that mode, and excludes paratransit expenses, past pension service liabilities, new services for the first 36 months of service, and capital costs.
• MTA uses gross revenue and adjusts the revenue to include passenger fares, advertising, lease and rental income and excludes paratransit and new services revenues for the first 36 months.
Farebox Recovery FY10 FY11 FY12 FY13 FY14
Bus* 30% 30% 29% 30% 26% Light Rail 17% 17% 16% 16% 16% Metro Rail 25% 26% 28% 26% 24% Core Service** 28% 28% 27% 27% 28% MARC 48% 50% 56% 55% 50% * Baltimore commuter bus service is included in the Bus recovery ratio under the budgetary basis
**Core service is Baltimore Local and Commuter Bus, Light Rail and Metro Subway

23
Data Collection Efforts • Internal: Performance Data
Daily On-Time Performance Report for All Modes Daily Absenteeism Report for All Modes Development of Dashboard for All Operations Managers
• External: Route & System Analysis Bus Network Improvement Project (BNIP) Data Bus Stop Optimization Project Stakeholder Collaboration:
Baltimore Metropolitan Council Maryland Department of Planning Baltimore City Department of Transportation Elected Officials MTA Bus Operators
24
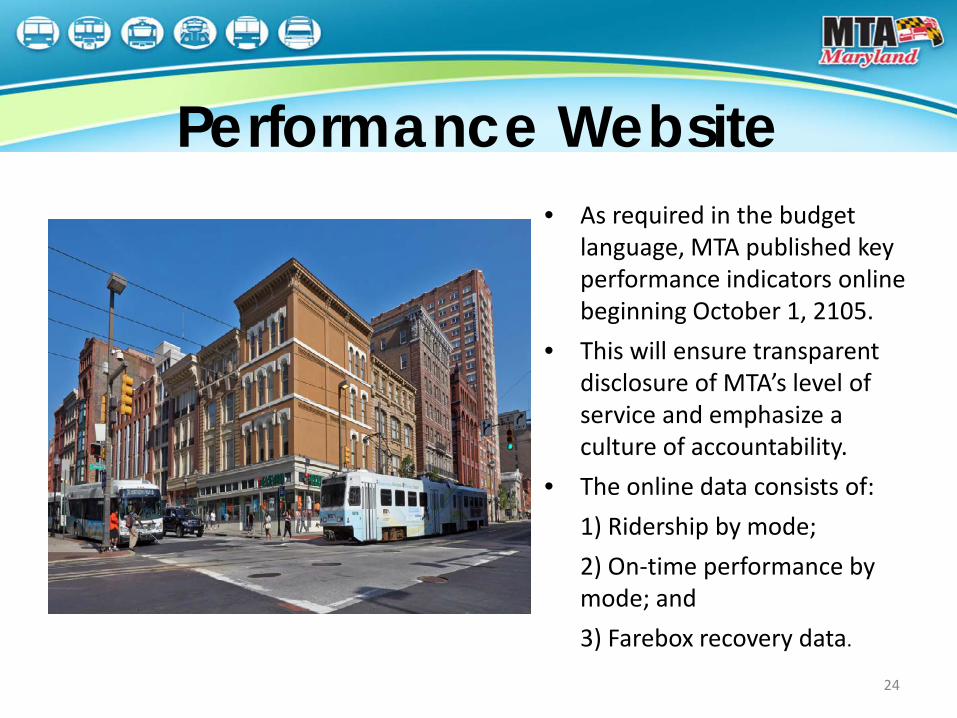
Performance Website • As required in the budget
language, MTA published key performance indicators online beginning October 1, 2105.
• This will ensure transparent disclosure of MTA’s level of service and emphasize a culture of accountability.
• The online data consists of: 1) Ridership by mode; 2) On-time performance by
mode; and 3) Farebox recovery data.

25
Ridership Metric Description: MTA ridership is based on unlinked passenger trips. Goal: Increase ridership on all MTA modes. Improvement Plan Elements: Continually enhance the customer experience by increasing on-time performance, improving the accuracy of real-time information, and providing world-class customer service. Focus on connecting more people to jobs and opportunities in the region by meeting the changing needs of new and current job centers and residential developments.

26
Ridership

27
Ridership

28
Ridership

29
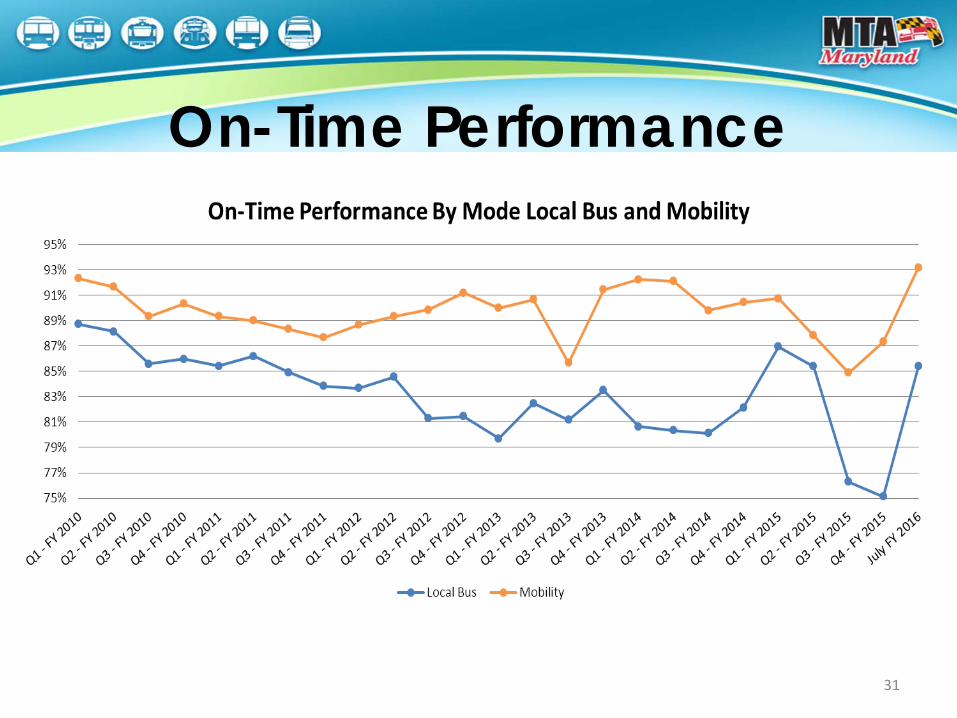
On-Time Performance Metric Description: On-time performance (OTP) rates measure the timeliness of MTA service. The overall percentages of on-time performance are the average performance across all modes for a given fiscal year. In regards to disparities in rates among the different operating modes it’s important to note several things: • Bus routes are impacted by external factors at a greater rate than rail
modes are (i.e. weather, road construction, accidents etc.). • Mobility services are required to wait a full 10 minutes at a stop where the
passenger is late or not present which in turn affects the entire scheduled route. Due to the individualized nature of the route, absences and lateness have a significantly greater impact than in other modes of transportation.

30
Improvement Plan: Improvements to Bus OTP will be the main focus in order to improve service for the largest number of riders. To improve OTP, MTA will be focusing on several areas, including: • Improvements to transit schedules to make them more realistic to operate
and in line with current ridership and traffic patterns. • Optimizing the placement of bus stops through MTA’s Bus Stop
Optimization Program. • Advancing the use of technology to better manage bus services in real-time
and use data to make future improvements.
On-Time Performance
31
On-Time Performance

32
On-Time Performance

33
Farebox Recovery Metric Description: Farebox recovery ratio is a metric that measures operating costs recovered through fares. This metric depends on fare prices, ridership levels, and operating costs such as: labor costs, fuel costs, and repair costs.
Goals: Achieve a farebox recovery ratio of at least 35% of the total operating costs for Bus, Light Rail, Metro and MARC (Maryland Transportation Article §7-208).
Plans: Fares for all MTA modes increased on June 25, 2016. The fare increase will contribute marginally to a higher farebox recovery ratio. By law Core Service fares can only increase every two years by the amount of CPI inflation.
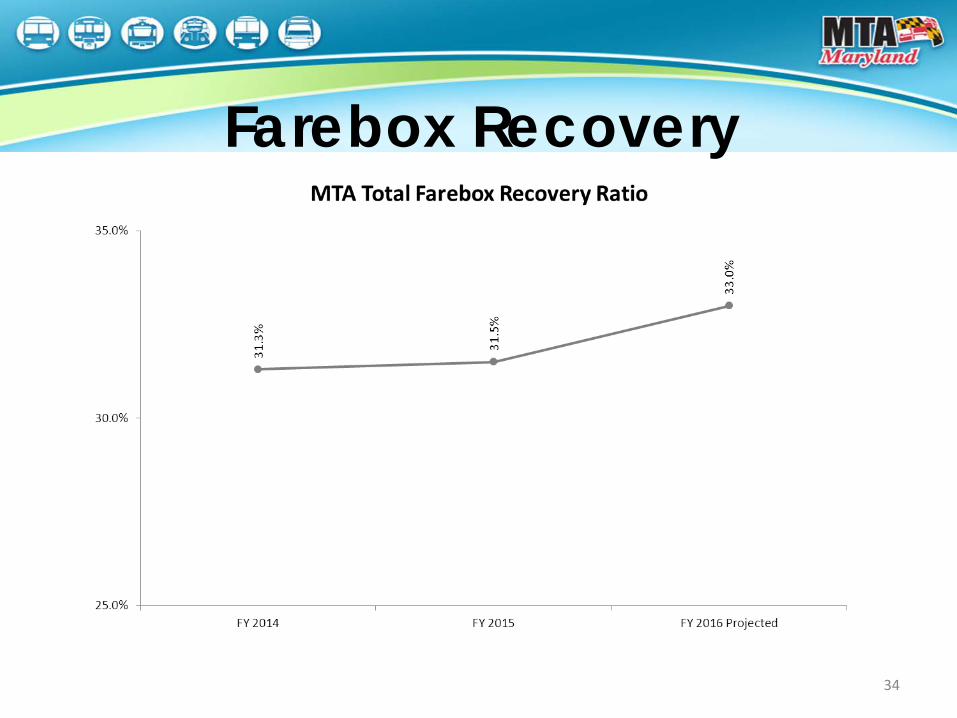
34
Farebox Recovery

35
Moving Forward • October 1, 2015 – Post Performance Website • Quarterly Updates of Performance Website • Assess Stakeholder Key Issues, Priorities and Needs • Assess Employment Nodes and Key Origins and
Destinations • Identify Baltimore Transit Improvements
– Determine Short, Mid and Long Term Improvements – Budget Short and Mid Term Improvements that Address
Stakeholder Priorities & Needs, as appropriate
• Implement Baltimore Transit Improvements

36
Contacts
Stakeholder Website: http://www.mdot.maryland.gov/MTAStakeholderGroup Performance Website: http://mta.maryland.gov/mta-performance-improvement
Mr. Philip Dacey, Director Office of Government Affairs Maryland Department of
Transportation 7201 Corporate Center Drive Hanover, MD 21076 410-865-1090 [email protected]
Jim Knighton Chief of Staff Maryland Transit Administration 6 St. Paul Street Baltimore, MD 21202 410-767-8769 [email protected]