mse working papers working paper 126/2015 … · investigating household preferences for restoring...
TRANSCRIPT

Suganya BalakumarSukanya Das
MADRAS SCHOOL OF ECONOMICSGandhi Mandapam Road
Chennai 600 025 India
October 2015
INVESTIGATING HOUSEHOLD PREFERENCES FOR
RESTORING PALLIKARANAI MARSH
MSE Working Papers
Recent Issues
* Working Paper 114/2015Price Rigidity, Inflation And The Distribution Of Relative Price ChangesSartaj Rasool Rather, S. Raja Sethu Durai and M. Ramachandran
* Working Paper 115/2015Money and Inflation: Evidence from P-Star ModelSunil Paul, Sartaj Rasool Rather and M. Ramachandran
* Working Paper 116/2015Determinants of Energy and Co2 Emission Intensities: A Study of Manufacturing Firms in IndiaSantosh K. Sahu and Deepanjali Mehta
* Working Paper 117/2015Impact of Water and Sanitation on Selected Water Borne Diseases in IndiaBrijesh C. Purohit
* Working Paper 118/2015Health Shocks and Inter-Generational Transmission of InequalitySowmya Dhanaraj
* Working Paper 119/2015Productivity, Energy Intensity and Output: A Unit Level Analysis of the Indian Manufacturing SectorSantosh K. Sahu and Himani Sharma
* Working Paper 120/2015Health Shocks and Coping Strategies: State Health Insurance Scheme of Andhra Pradesh, IndiaSowmya Dhanaraj
* Working Paper 121/2015Efficiency in Education Sector: A Case of Rajasthan State (India)Brijesh C Purohit
* Working Paper 122/2015Mergers and Acquisitions in the Indian Pharmaceutical SectorSantosh Kumar Sahu and Nitika Agarwal
* Working Paper 123/2015Analyzing the Water Footprint of Indian Dairy IndustryZareena B. Irfan and Mohana Mondal
* Working Paper 124/2015Recreational Value of Coastal and Marine Ecosystems in India: A Partial EstimatePranab Mukhopadhyay and Vanessa Da Costa
* Working Paper 125/2015Effect of Macroeconomic News Releases on Bond Yields in India China and JapanSreejata Banerjee and Divya Sinha
* Working papers are downloadable from MSE website http://www.mse.ac.in
$ Restricted circulation
WORKING PAPER 126/2015
i
Investigating Household Preferences for Restoring Pallikaranai Marsh
Suganya Balakumar Madras School of Economics
and
Sukanya Das Madras School of Economics

ii
WORKING PAPER 126/2015
October 2015
Price : Rs. 35
MADRAS SCHOOL OF ECONOMICS
Gandhi Mandapam Road
Chennai 600 025
India
Phone: 2230 0304/2230 0307/2235 2157
Fax : 2235 4847/2235 2155
Email : [email protected]
Website: www.mse.ac.in
iii
Investigating Household Preferences for Restoring Pallikaranai Marsh
Suganya Balakumar and Sukanya Das
Abstract
The study examines households’ willingness to pay for the conservation of Pallinkaranai marsh located in the south of Chennai, Tamil Nadu. A stated preference method, namely, Contingent Valuation method (CVM) over 213 households has been employed. The results reveal that farmers are willing to pay for the restoration of the marsh which provides higher level of water quality, recreational benefit and restorartion of flora and fauna. Keywords: Pallinkaranai, Contingent valuation, Chennai, bivariate probit
regression JEL Codes: Q510, C83, Q260
iv
ACKNOWLEDGEMENT
This research paper is a part of the Masters dissertation at Madras School of Economics during the period 2012-2014. We would also like to thank Dr. Paul Appasamy who reviewed the article and had provided his valuable insights and expertise that greatly assisted in modifying the paper.
Suganya Balakumar Sukanya Das

1
INTRODUCTION
The Economics of Ecosystem and Biodiversity For Water and Wetlands
(TEEB) defines “Wetlands are areas where the water table is at or near
the surface level, or the land is covered by shallow water.”
The Ramsar Convention defines wetlands as: “areas of marsh,
fen, peat land or water, whether natural or artificial, permanent or
temporary, with water that is static or flowing, fresh, brackish or salt,
including areas of marine water the depth of which at low tide does not
exceed six metres” (article 1.1). Moreover wetlands “may incorporate
riparian and coastal zones adjacent to the wetlands, and islands or
bodies of marine water deeper than six metres at low tide lying within
the wetlands” (article 2.1).
The Ramsar Classification of Wetland Types includes 42
types of wetlands, which belong to one of the three broad categories
(Ramsar Convention Secretariat, 2011):
• Inland wetlands;
• Marine/coastal wetlands;
• Human-made wetlands.
Human-made wetlands covered by the Ramsar Convention
include aquaculture, farm ponds, and permanently or temporarily
inundated agricultural land - such as rice paddies, salt pans, reservoirs,
gravel pits, sewage farms and canals.
There are a range of other wetland classifications used for
different purposes, based on hydrogeomorphology and/or vegetation
characteristics, such as :
• Marine (coastal wetlands, including coastal lagoons, rocky
shores and coral reefs); • Estuarine (including deltas, tidal marshes, and mangrove
swamps);
2
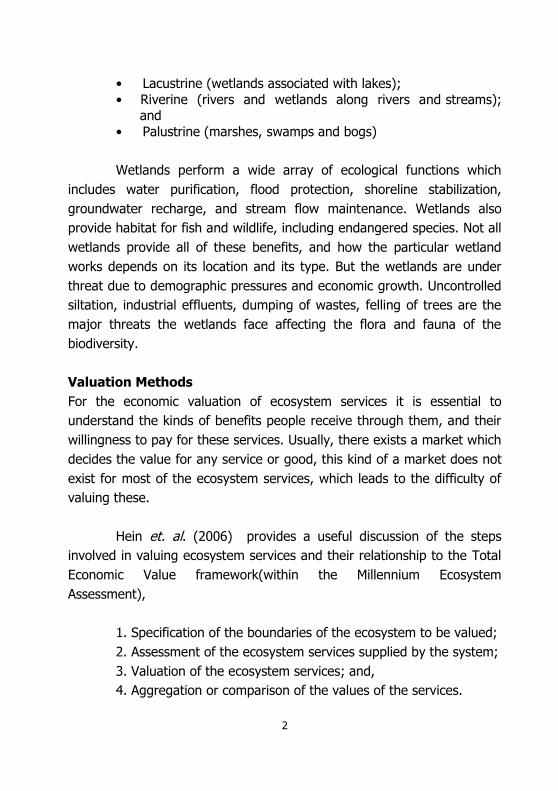
• Lacustrine (wetlands associated with lakes);
• Riverine (rivers and wetlands along rivers and streams); and
• Palustrine (marshes, swamps and bogs)
Wetlands perform a wide array of ecological functions which
includes water purification, flood protection, shoreline stabilization,
groundwater recharge, and stream flow maintenance. Wetlands also
provide habitat for fish and wildlife, including endangered species. Not all
wetlands provide all of these benefits, and how the particular wetland
works depends on its location and its type. But the wetlands are under
threat due to demographic pressures and economic growth. Uncontrolled
siltation, industrial effluents, dumping of wastes, felling of trees are the
major threats the wetlands face affecting the flora and fauna of the
biodiversity.
Valuation Methods
For the economic valuation of ecosystem services it is essential to
understand the kinds of benefits people receive through them, and their
willingness to pay for these services. Usually, there exists a market which
decides the value for any service or good, this kind of a market does not
exist for most of the ecosystem services, which leads to the difficulty of
valuing these.
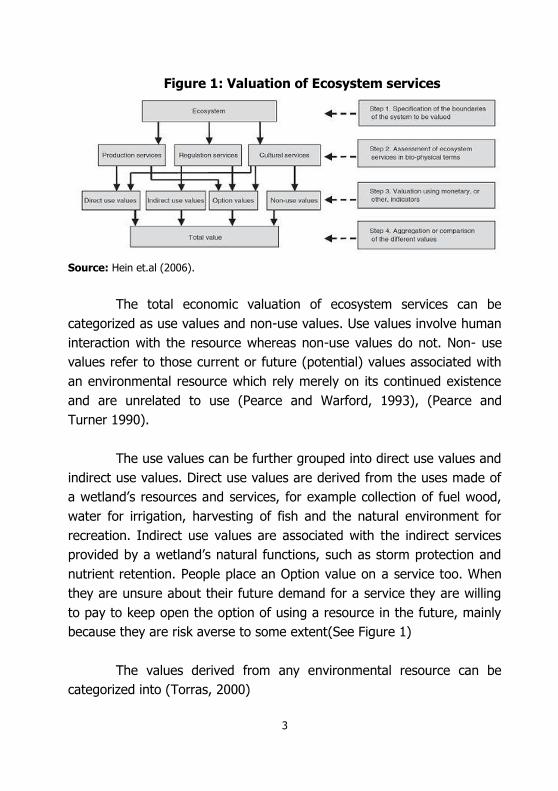
Hein et. al. (2006) provides a useful discussion of the steps
involved in valuing ecosystem services and their relationship to the Total
Economic Value framework(within the Millennium Ecosystem
Assessment),
1. Specification of the boundaries of the ecosystem to be valued;
2. Assessment of the ecosystem services supplied by the system;
3. Valuation of the ecosystem services; and,
4. Aggregation or comparison of the values of the services.
3
Figure 1: Valuation of Ecosystem services
Source: Hein et.al (2006).
The total economic valuation of ecosystem services can be
categorized as use values and non-use values. Use values involve human
interaction with the resource whereas non-use values do not. Non- use
values refer to those current or future (potential) values associated with
an environmental resource which rely merely on its continued existence
and are unrelated to use (Pearce and Warford, 1993), (Pearce and
Turner 1990).
The use values can be further grouped into direct use values and
indirect use values. Direct use values are derived from the uses made of
a wetland’s resources and services, for example collection of fuel wood,
water for irrigation, harvesting of fish and the natural environment for
recreation. Indirect use values are associated with the indirect services
provided by a wetland’s natural functions, such as storm protection and
nutrient retention. People place an Option value on a service too. When
they are unsure about their future demand for a service they are willing
to pay to keep open the option of using a resource in the future, mainly
because they are risk averse to some extent(See Figure 1)
The values derived from any environmental resource can be
categorized into (Torras, 2000)

4
• Direct use value which relates to the direct use of the resource
like timber, agriculture, fishing etc.
• Indirect use value is associated with benefits that individuals
experience indirectly, or as a consequence of the primary
function of a given resource.
• Option values refer to all use values (both direct and indirect)
that can be realized at some point in the future. In other
words, the option value is the value attributed to the
possibility of using the good in the future
• Existence Value originates from the utility that arises from the
simple perception of the existence, even in the absence of an
expected use (Walsh et. al., 1984; Brun, 2002)
The choice of valuation methods also involves choosing the
socio-cultural context which emerges from the understanding of what
values are, or should be, and how they should be elicited. Valuation
methods imply certain models of humans, nature and their interactions
and they define whether values are revealed, discovered or constructed
(Vatn and Bromley, 1994). Seen in this perspective, valuation methods
function as “value-articulating” institutions by defining a set of rules
concerning valuation processes (Jacobs, 1997). In other words, valuation
provides a tool for self-reflection, alerting the different groups of
stakeholders to the consequences of their choices and behaviour on
various dimensions of natural and human capital (Zavestoski, 2004). It
can therefore contribute to change the way in which societies manage
wetlands.
The following Table 1 lists the ecological functions of wetlands,
the economic good and services it provides and the valuation methods.

5
Table 1: Ecological Functions and Valuation Methods Of
Wetlands Ecological function Economic goods
and services
Value
type
Commonly used
valuation methods
Flood and flow control flood protection indirect use
Replacement cost Market prices
Opportunity cost Storm buffering Storm Protection Indire
ct use
Replacement cost
Production function
Sediment retention Storm Protection Indire
ct use
Replacement cost
Production function Ground water
recharge/ Discharge
Water supply Indire
ct use
Production function,
NFI Replacement cost Water quality maintenance/ nutrient
retention
Improved water quality Waste disposal
Indirect use
Direct use
CVM Replacement cost
Habitat and nursery for plant and plant
species
Commercial fishing and hunting
Direct use
Market prices, NFI
Recreational fishing and hunting
Direct use
TCM, CVM
Harvesting of natural materials
Direct use
Market prices
Energy resources Direct
use
Market prices
Biological diversity Appreciation of species
existence
Non -
use
CVM
Micro- climate stabilization
Climate stabilization Indirect use
Production function
Carbon sequestration Reduced global
warming
Indire
ct use
Replacement cost
Natural environment Amenity Recreational activities
Non - use
CVM
Appreciation of
uniqueness to culture/ heritage
Source: Branderi et. al. (2006).

6
BACKGROUND
Pallikaranai Marsh is a fresh water swamp located in the south of
Chennai, and covers an area of 50km2. The swamp is helpful in
recharging the aquifers of the region. It is one of the last few remaining
natural ecosystems in the city. The first known manipulation of this
system was the construction of the Buckingham canal in 1806; it was
devised as a navigation canal of 421.55 km length connecting Pedda
Ganjam in Andhra Pradesh and Marakanam in TamilNadu, mainly for the
purpose of ferrying salt.
The swamp faces major problems due to Disposal of partially
treated sewage. Water quality analysis within the marsh and the
adjoining water bodies had shown the presence of mercury, lead and
cadmium in quantities that were four times the permissible
levels.Gallons of water are being pumped out from the surrounding
area for commercial distribution, which is one of the causes of disease in
Pallikaranai. Spillover from Perungudi dump yard (On the Northern
side of the Pallavaram Radial road is in operation since 1987, under the
Chennai Corporation) and Alandur Municipal Corporation (On the
Eastern side of the Tambaram Velachery Main road) severely pollutes the
ground water and affects the Marsh’s fragile ecosystem. The total area
allotted for dumping solid waste was only 0.3km2 but at present more
than 3.4km2 have been used for this purpose. The area surrounding
Pallikaranai was originally fertile, agriculture land spreading over 250
km2. Constructions of educational and research institutes, the IT corridor
(South Chennai), the Mass Rapid Transport System (Sub – Urban trains)
of the Ministry of Railways, the National Institute of Ocean technology,
and the Centre for Wind Energy tecnology has resulted in rapid
degradation of the land. Also Frequent fires in the dump yard causes
atmospheric pollution and smog during the mornings. The fires also
affect the birds.

7
A forum called the Save Pallikaranai Marsh Forum was formed
after the floods of 2002. After continuous efforts by the forum and the
media the TamilNadu Pollution Control Board commissioned a study with
the objective of evolving short and long term measures for protecting the
marsh. This was a major milestone because the region was originally
declared as a wasteland. On 9 April 2007, 3.17km2 of the marsh was
declared a Reserve forest: This excludes the area that is being used as
the garbage disposal site. Decision regarding the closure of the
Perungudi dump yard (along with the Kodungaiyur dump yard in North
Chennai) has been made. Garbage from Chennai will be disposed of in
four places in Malaipattu, Minjur, Vallur and Kuthambakkam villages
where the corporation plans to set up waste management systems.
Figure 2 shows the enroachments that had occurred over the years of
the marsh.
LITERATURE REVIEW
In India, the recreational value of Khecheopalri, a lake situated in the
west district of Sikkim state, which has recreational, biodiversity and
sacredness values was assessed using the CVM. An Ordinary Least
Squares (OLS) regression was used to analyse the WTP (Maharana,
2000).
Another interesting study on Kabartal wetland, situated in
the upper Indo – Gangetic flood plains in Northern India, uses the
CVM to assess the willingness to accept a compensation of the local
people as an alternative to access the wetland. The WTA gave an
estimated mean value of US$27,500 per household over a period of 60
years. The referendum format used was open ended but based on a
response range schedule in order to avoid the high percentage of protest
bids (two schedules were used, one highest bid category for the non-
landholders and another lowest bid for the landholders category).
Respondents were asked to agree on a single bid value and then a final
8
question was posed asking why they could not accept less money. An
Ordinary Least Squares regression was used to analyse the WTA
(Ambastha, 2007).
A CVM study has been conducted in the Bhoj
wetland,Bhopal, Madhya Pradesh. The main threats to the Wetland have
mainly been identified are siltation, solid waste pollutants, sewerage,
Trapa cultivators, Encroachment, Weeds and eutrophication, Agricultural
waste and hospital Waste. The Contingent Valuation Method resulted
in two outcomes. One of these was a voluntary payment by the
people to the Bhoj Wetland Maintenance. The second payment vehicle
was a compulsory tax imposed upon the people of the city. An open-
ended bidding game was used and the respondents were asked a follow-
up question to their initial non-zero bid, which was a close-ended
question. This was followed by a question that mentioned the finite
income that they had and if they wanted to change the initial
figure given by them. This questionnaire format tried to avoid the
range biases by adding two follow up questions to the initial open ended
question, the first of which was a close-ended question based on the
answer to the initial open-ended question asked. In the questionnaire a
table detailing the amount to be asked in the first follow-up question,
based on the amount offered as the initial bid, was included. Two
regression equations were estimated for the model one for each
of the two payment vehicles used in the survey. The dependent
variable in the first equation is the Willingness-to pay voluntarily and in
the second equation the Willingness-to-pay in the form of a tax. Both of
these are then regressed on a vector of socio-economic variables such as
income and education level, as well as a number of dummy variables.
The Contingent Valuation study has assessed the median voluntary WTP
to is Rs.241 and the median WTP to be paid as tax is Rs.29.50 among
the 2, 01,116 households in the city (Verma,2001) An interesting study
done in 2001 included “payment time‟ as an additional factor. The aim of
9
the study was to estimating the aggregate WTP for Lake Mendota
in Wisconsin (Stumborg, 2001).
A study on Chandernagore municipality in West Bengal, along the
banks of the River Ganga which hosts a conventional sewage
treatment plant (STP), estimates the local public’s willingness to
pay (WTP) for improvements in the capacity and technology of the
sewage treatment plant. A cross sampling method was used the survey
and a choice experiment was designed with the assumption that the
observable utility function would follow a strictly additive form. The
results for the Conditional logit Model (CLM) are reported that treated
wastewater quantity and quality are significant factors in the choice
of a wastewater treatment programme, and ceteris paribus, these
two attributes increase the probability that a wastewater treatment
programme is selected. To calculate the WTP a CLM with interactions is
used . This model is used to calculate the value assigned by the
household to each wastewater treatment programme attribute. On
an average a household was willing to pay Rs 5.82 in monthly
municipal taxes to ensure that the wastewater is treated with
secondary treatment and the quality of the water discharged to the
river is high (Birol and Das, 2010).
The profile generation performed in this paper has been
inspired by two papers. A study by Ragu te al (2012) classifies the
sample into six profiles (based on Millet or Non- millet farmers,
Literate or Illiterate, and Organization participation or Non-
Organization participation). The results reveal that the millet farmers
and the non-millet farmers are willing to participate at higher
compensation levels in the initial bid price offered, but they are still WTA
a lower bid price than the initial compensation offered for both
MPVs and LPVs (Most Preferred Variety and Least Preferred Variety
Category). The results suggest that the contingent valuation
method used here seems to be an appropriate tool with which to reveal

10
farmer participation decisions regarding a millet conservation
programme. Another study by Das et. al. (2008) in West Bengal for
solid waste management uses Choice Experiment Method. The results
of this study reveal that even though there is significant heterogeneity
within the population residents sampled exhibit significant WTP to ensure
improvements in SWM services.
Though the CV method is used extensively the method has
its weakness too. People face difficulty placing a monetary value
on the ecosystem, mainly because of its many life sustaining
functions, the discount rate, and the potential irreversibility of
damages done to ecosystems. People also value the ecosystem for
aesthetic reasons that are difficult to measure. Also, few influential
members may dominate the focus group which may not provide with the
correct results. Another difficulty is that every individual’s WTP is
according to his or her income. The difference between WTP and WTA
needs to be examined in contingent valuation surveys. It is common that
people will be WTP a much smaller amount to preserve an ecosystem,
but they are WTA a much larger amount as compensation for damages to
the ecosystem.
METHODOLGY AND DATA SOURCES
The study involved a Contingent Valuation approach interviewing the
residents of the area, nature lovers and NGOs. In this project residents
were directly asked their willing to pay to protect the Pallikaranai Marsh.
Also Data on population and household statistics has been collected from
the Chennai Corporation and Kancheepuram Corporation. The results
reveal whether the residents are willing to pay a significant amount either
through a membership fee, lump sum donations or through an addition in
tax payment for the protection and up gradation of the Pallikaranai
Marsh.
11
Attributes
The main attributes for the study are the following:
1. Flora Of The Marsh - The plant diversity of the Marsh is enriched
by the presence of 2 species of grasses that are endemic to
peninsular India, viz. Cynodon barberi and Iseilema
anthephoroides. The Marsh is inhabited by about 102 varieties of
trees, shrubs, herbs, grasses and sedges.
2. Fauna Of The Marsh - Close to about a 113 species of birds
have been noticed in the Pallikaranai marsh, of which black –
winged stilt, pheasant tailed jacana, purple moorhen, little
grebe, open – billed stork, egrets and grey herons are resident
birds, it also includes the rare visiting species of House Swift,
Brahminy Kite, Magpie Robin, House sparrow, Red-whiskered
Bulbul and the Eurasian Thick knee. The marsh also provides
home to a large number of fishes, Crustaceans and Molluscans;
Mammals like the spotted Deer, Leaf-nosed Bat, Bandicoot and
house rat; and also reptiles and Amphibians. Also, there is an
incredible spurt in flamingo numbers at Pallikaranai, reported from
November 2012 to May 2013.
3. Waste Water Treatment - With most of the households in the
neighbourhood letting their water waste into the marsh, it has
been extremely polluted. The presence of the dump yard and the
effluents from it also contributes to it. The southern portion of the
Pallikaranai Marshland has already been notified as a Reserve land
under the Tamil Nadu Forest Act, 1882. Waste water treatment
must be considered very important as the polluted water
contaminates the ground water, and also results as serious health
issues to the people living in that region.
4. Tourism - With a lot of birds visiting the Marsh, people have taken
interest, and Tourism is on the raise at Pallikaranai Marsh. Certain
areas abutting the Pallikaranai marsh have been freed of human

12
intrusion (encroachments have been removed in parts of Ambedkar
Nagar). But the facilities for Tourism like bird watching and resting
has to be developed
5. Awareness - The awareness of the people in the locality about
the Pallikaranai Marsh is low. The aim of this dissertation is to
increase the level of awareness of the people.
Table 2 reports the status quo and future expected level of the attributes.
Table 2: Status-Quo Level and the Future Expected Level of the Attributes
Attributes Status – quo Alternative
1 Flora Low level High level
2 Fauna Low level High level
3 Waste Water Treatment Very little control Total control
4 Tourism Less facilities More facilities
5 Awareness Low High
Sample
The total sample size was aimed at 200. The survey results provided with
213 observations (185- Residents in the locality, 20-Nature lovers and
birdwatchers, 8-NGOs), and all 213 observations have been used in the
study. A random sampling method has been adopted on account of large
population in the region and unavailability of data based on income
levels. A pilot survey of 8 people with a rough questionnaire was
performed in October, 2013. The survey took place in the months of
December and January, 2013 focusing on the residents around the
Pallikaranai Marsh. The Survey methods included face to face interview,
online questionnaire and Social networking sites.
Questionnaire
Before every survey the respondents were given a brief introduction
about the Marsh, the history, its degradation and the renovation
happening over the years.
13
The aspects captured in the survey were:
1. Household demographics
2. Economic status
3. Awareness variables
4. Services provided
5. Dependence factors
6. Conservation attitude
7. Economic Valuation
Household demographics included information on respondent’s
Gender, Age, Education level, Occupation, Marital Status and Number of
Children. The economic status was captured by asking the respondents
their expenditures and income slabs. The Awareness variable captured
the awareness of the respondents with respect to the degradation of the
Marsh, Renovations of the Marsh, Knowledge about plant and animal
species etc. The next section questioned the Respondents on the
services provided by the Marsh – like recreational benefits,
aesthetic benefits and necessities – thereby assessing the Respondents
dependence on the Marsh. The Respondents willingness to conserve the
Marsh was captured in the fifth section. They were finally asked their
WTP Rs.50/ Rs.75 or Rs.100 per month as they moved from Scenario to
Scenario. The lower amount was fixed; the respondents were free to
choose their highest contribution amount.
EMPIRICAL RESULTS
Social, Economic and Demographic Characteristics of the
Sampled Households
The total sample of 213 households surveyed, constituted of 116 male
and 97 female. The survey results reveal that on an average the
households interviewed have been residents around the Pallikaranai
Marsh for 11 years. Most of the residents in the locality are temporary
14
residents, and a majority of them being a resident less than 15 years.
TABLE 3 reports the socio-economic characteristics of the households.
The average household head age is 46 years, and about 81
percent of the household heads have a university degree or above, while
19 percent of them have technical school education or less. Over 30
percent of the households have at least one child younger than 18 years
of age. In more than half the surveyed households the household head
works in service sector (52 percent) followed by being self-employed (20
percent), and 16 percent of the sample is students. Among the
respondents, 50 percent and 32 percent had completed Under graduate
and Post graduate level of education. Less that 20 percent of the
sampled population have education below the Under graduate level. In
analysis, the education has been categorized into 2 categories – Those
with School Education, and those with University Education. The average
household monthly expenditure is Rs. 32000, a large portion of it is spent
on food, followed by dwelling, and education and entertainment.

15
Table 3: Social, Economic and Demographic Characteristics
Characteristic Sample mean
(std. dev)
Years in locality 11.31 (6.60) Gender 0.54 (0.5)
Household size 2.82 (1.26) Household head age 46.46 (12.77)
Monthly food expenditure (in Rs) 10671.65 (5639.94)
Monthly expenditure (in Rs) 32044.7
(21607.83) Share of income spent on food 36.33 (17.61)
Number of children 0.77 (0.90)
Percentage
Household has a child<18 years of age = 1, 0 otherwise
30
Education level of household head Household head completed technical school or less =
1, 0 otherwise
18.8
Household head has a university degree or above = 1, 0 otherwise
81.2
Occupation of the household head
Employment in service sector = 1, 0 otherwise 51.6 Self-employed = 1, 0 otherwise 19.7
Pensioner = 1, 0 otherwise 6.6
Housewife = 1, 0 otherwise 6.1 Worker = 1, 0 otherwise 8.4
Student = 1,0 otherwise 16 Source: Pallikaranai marsh CVM survey (2013).
Awareness of Respondents
The awareness of the resident in the locality is very high, about 95
percent. A vast majority of the population feels that the Human
settlement and the Dump yard is the major cause of degradation of the
Marsh land (87 percent and 84 percent), it is mainly because of its very
close presence and the spillover to the marsh(See Table 4). 62 percent of

16
the residents feel that the constructions of building, roads and bridges in
the marsh area are the cause for the degradation, while 56 percent of
the residents consider the sewage discharge to be a major cause. The
respondents and the residents in the locality feel that the Pallikaranai
marsh is an important element of natural ecosystem, and provides high
recreational value and aesthetic value. Its importance for commercial
purpose and a necessity is negligible.
Table 4: Awareness of Respondents
Characteristic Percentage
Awareness of the residents
Aware of the problems 95.3
Aware of renovations - by the Forest department 65.7
Aware of renovations - by the NGOs 62.9
Major cause of degradation according to the residents
Dump yard 83.6
Human settlements 86.8
Construction 62.4
Sewage discharge 55.8
Importance of the Pallikaranai Marsh to the residents
Recreational value 47.4
Heritage value 39.9
Necessity (bathing, washing, agriculture, etc.) 4.7
Aesthetic value 40.8
Value addition 19.2
Important element of natural ecosystem 93.8
Commercial purpose (fishing) 6.1 Source: Pallikaranai marsh CVM survey (2013).

17
Willingness To Pay
The respondents were presented with three hypothetical scenarios of the
three attributes- water quality,range of recreational benefits and range of
aesthetic benefits. A double-bounded dichotomous bid was adoptedTable
5 shows the change in the scenarios of the attributes.
The survey results show that in spite of high the awareness
among the respondents only less than 50 percent of them were willing to
pay. It was also noted that about 90 percent of the respondents who
were willing to pay voted towards paying as a membership fee than as
an addition in tax payments or as a lumpsum donation.
Table 5: Measurement of Attributes
Scenarios Quality of Water
Recreational Benefits
(includes Tourism)
Aesthetic benefits
(includes Flora and Fauna)
Scenario A Low Low Low
Scenario B Moderate Low Low Scenario C High Moderate Moderate
Scenario D High High High
Scenario A depicts the current scenario, and Scenarios B, C, D
depicts the future expected scenarios. Source: Pallikaranai marsh CVM survey (2013).
18
RESULTS AND DISCUSSIONS
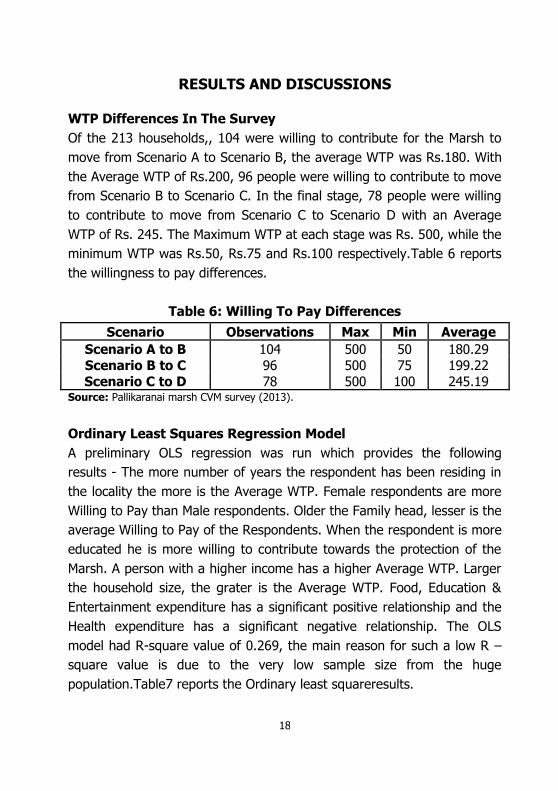
WTP Differences In The Survey
Of the 213 households,, 104 were willing to contribute for the Marsh to
move from Scenario A to Scenario B, the average WTP was Rs.180. With
the Average WTP of Rs.200, 96 people were willing to contribute to move
from Scenario B to Scenario C. In the final stage, 78 people were willing
to contribute to move from Scenario C to Scenario D with an Average
WTP of Rs. 245. The Maximum WTP at each stage was Rs. 500, while the
minimum WTP was Rs.50, Rs.75 and Rs.100 respectively.Table 6 reports
the willingness to pay differences.
Table 6: Willing To Pay Differences
Scenario Observations Max Min Average
Scenario A to B 104 500 50 180.29
Scenario B to C 96 500 75 199.22
Scenario C to D 78 500 100 245.19 Source: Pallikaranai marsh CVM survey (2013).
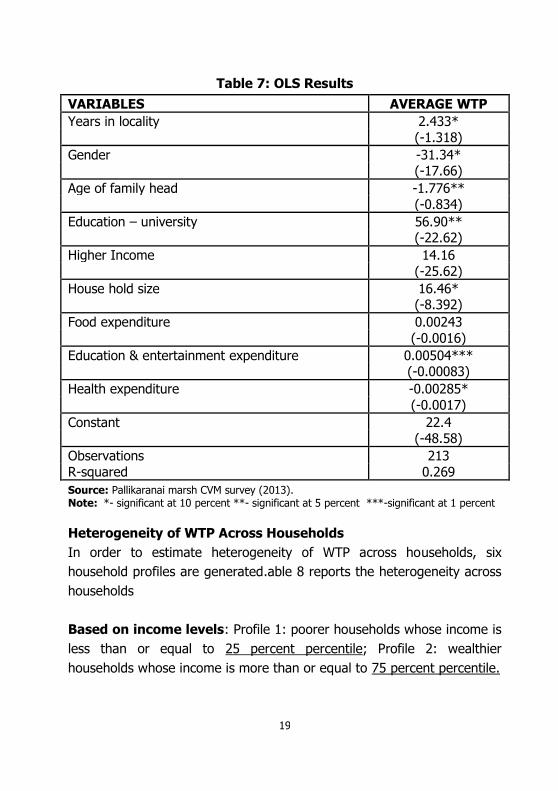
Ordinary Least Squares Regression Model
A preliminary OLS regression was run which provides the following
results - The more number of years the respondent has been residing in
the locality the more is the Average WTP. Female respondents are more
Willing to Pay than Male respondents. Older the Family head, lesser is the
average Willing to Pay of the Respondents. When the respondent is more
educated he is more willing to contribute towards the protection of the
Marsh. A person with a higher income has a higher Average WTP. Larger
the household size, the grater is the Average WTP. Food, Education &
Entertainment expenditure has a significant positive relationship and the
Health expenditure has a significant negative relationship. The OLS
model had R-square value of 0.269, the main reason for such a low R –
square value is due to the very low sample size from the huge
population.Table7 reports the Ordinary least squareresults.
19
Table 7: OLS Results
VARIABLES AVERAGE WTP
Years in locality 2.433*
(-1.318)
Gender -31.34* (-17.66)
Age of family head -1.776**
(-0.834)
Education – university 56.90** (-22.62)
Higher Income 14.16
(-25.62)
House hold size 16.46* (-8.392)
Food expenditure 0.00243
(-0.0016)
Education & entertainment expenditure 0.00504*** (-0.00083)
Health expenditure -0.00285*
(-0.0017)
Constant 22.4 (-48.58)
Observations 213
R-squared 0.269
Source: Pallikaranai marsh CVM survey (2013). Note: *- significant at 10 percent **- significant at 5 percent ***-significant at 1 percent
Heterogeneity of WTP Across Households
In order to estimate heterogeneity of WTP across households, six
household profiles are generated.able 8 reports the heterogeneity across
households
Based on income levels: Profile 1: poorer households whose income is
less than or equal to 25 percent percentile; Profile 2: wealthier
households whose income is more than or equal to 75 percent percentile.

20
Based on whether the households feels that the quality of the
environment has improved or not : Profile 3: Agrees that quality of
environment has improved; Profile 4: Disagrees that quality of
environment has improved.
Based on the educational level of the respondent: Profile 5:
Completed school level education; Profile 6: University level education
Table 8: Heterogeneity Across Households
Years in locality
Age of family
head
Respondent has
completed
university education
Employed Household size
Profile 1 11.15 46.35 74.07 percent 0.63 2.91
Profile 2 11.06 46.78 92.59 percent 0.74 2.76 Profile 3 13.21 44.1 75.86 percent 0.72 2.52
Profile 4 11.03 46.82 81.08 percent 0.68 2.93 Profile 5 10.9 42.63 0 percent 0.65 2.63
Profile 6 11.39 47.34 100 percent 0.68 1.26
Food
expenditure
Education and
entertainment expenditure
Health
expenditure
Observations
Profile 1 6509.26 981.48 2498.15 54
Profile 2 15462.96 14972.22 5300.93 54 Profile 3 10017.24 3206.90 4696.55 29
Profile 4 11091.22 5406.08 4451.69 148 Profile 5 9150.00 2737.50 4372.50 40
Profile 6 11023.12 5792.49 4725.15 173 Source: Pallikaranai marsh CVM survey (2013).
The Profiles reveal that - The respondents of all profiles have
lived in the locality for about 11 years. The age of the family head is
close to 44 years in all the profiles. 92 percent and 74 percent of the
richer and poorer households have completed university level
21
education showing a high level of education in the sample. 82 percent of
those respondents who disagree that the quality of environment has
improved is educated. 74 percent of the richer household respondents
are employed, while only 63 percent of the poorer household
respondents are employed. 68 percent of the respondents who disagree
that the quality of environment has improved is employed, and 72
percent of those respondents who agree that the quality of
environment has improved is employed.68 percent of the University
educated respondents are employed while 65 percent of the School
educated respondents are employed.
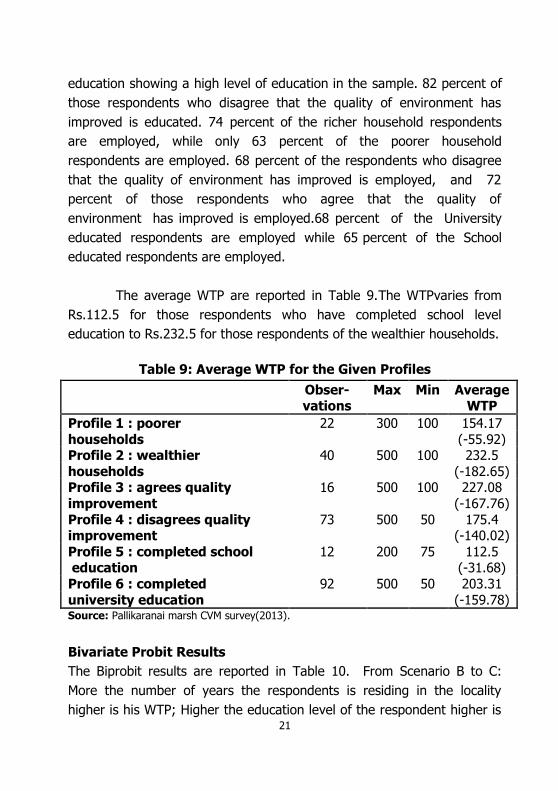
The average WTP are reported in Table 9.The WTPvaries from
Rs.112.5 for those respondents who have completed school level
education to Rs.232.5 for those respondents of the wealthier households.
Table 9: Average WTP for the Given Profiles
Obser-vations
Max Min Average WTP
Profile 1 : poorer
households
22 300 100 154.17
(-55.92) Profile 2 : wealthier
households
40 500 100 232.5
(-182.65) Profile 3 : agrees quality
improvement
16 500 100 227.08
(-167.76)
Profile 4 : disagrees quality improvement
73 500 50 175.4 (-140.02)
Profile 5 : completed school education
12 200 75 112.5 (-31.68)
Profile 6 : completed
university education
92 500 50 203.31
(-159.78) Source: Pallikaranai marsh CVM survey(2013).
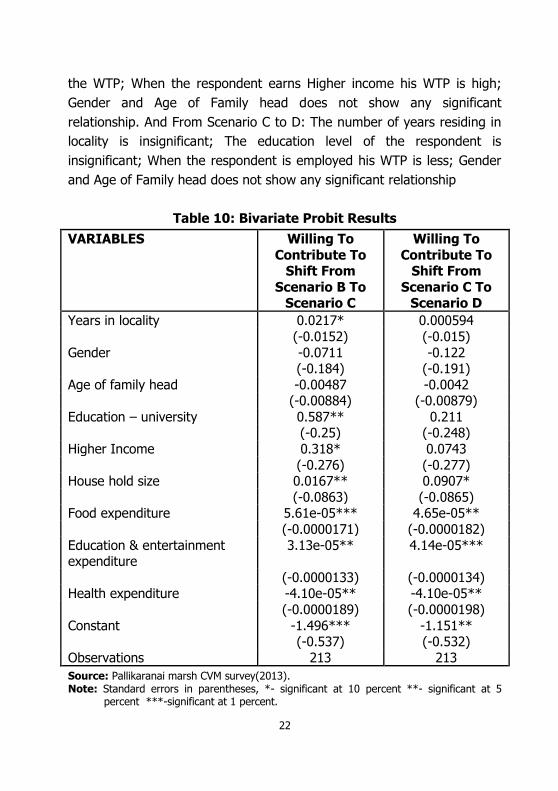
Bivariate Probit Results
The Biprobit results are reported in Table 10. From Scenario B to C:
More the number of years the respondents is residing in the locality
higher is his WTP; Higher the education level of the respondent higher is
22
the WTP; When the respondent earns Higher income his WTP is high;
Gender and Age of Family head does not show any significant
relationship. And From Scenario C to D: The number of years residing in
locality is insignificant; The education level of the respondent is
insignificant; When the respondent is employed his WTP is less; Gender
and Age of Family head does not show any significant relationship
Table 10: Bivariate Probit Results
VARIABLES Willing To
Contribute To Shift From
Scenario B To Scenario C
Willing To
Contribute To Shift From
Scenario C To Scenario D
Years in locality 0.0217* 0.000594
(-0.0152) (-0.015)
Gender -0.0711 -0.122 (-0.184) (-0.191)
Age of family head -0.00487 -0.0042 (-0.00884) (-0.00879)
Education – university 0.587** 0.211 (-0.25) (-0.248)
Higher Income 0.318* 0.0743
(-0.276) (-0.277) House hold size 0.0167** 0.0907*
(-0.0863) (-0.0865) Food expenditure 5.61e-05*** 4.65e-05**
(-0.0000171) (-0.0000182)
Education & entertainment expenditure
3.13e-05** 4.14e-05***
(-0.0000133) (-0.0000134) Health expenditure -4.10e-05** -4.10e-05**
(-0.0000189) (-0.0000198)
Constant -1.496*** -1.151** (-0.537) (-0.532)
Observations 213 213
Source: Pallikaranai marsh CVM survey(2013). Note: Standard errors in parentheses, *- significant at 10 percent **- significant at 5
percent ***-significant at 1 percent.
23
Cost Benefit Analysis
In order to perform a cost benefit analysis the costs and benefits have
been assess. The Data of total number of Households in the Wards
around the Pallikaranai Marsh has been collected from the Kanchipuram
Municipality. The costs incurred/planned costs has been collected form
the Forest Department, and the Benefits has been extrapolated from the
Average WTP of the Respondents.
Costs
In order to take up ecological restoration and conservation of Pallikaranai
wetlands, a scheme has been sanctioned, under State fund, at a cost of
Rs.15.75 crores over a period of five years from 2011-2012 to
2015-2016. The Government has spent a sum of Rs.5.17 crore for
carrying out the works during the year 2011-2012. During 2012-13,
works like habitat improvement, protection, research and
monitoring, publicity awareness etc. have been carried out at an outlay
of Rs.5.00 crores. It was proposed to implement the scheme at an outlay
of Rs.5.00 crores during 2013-2014
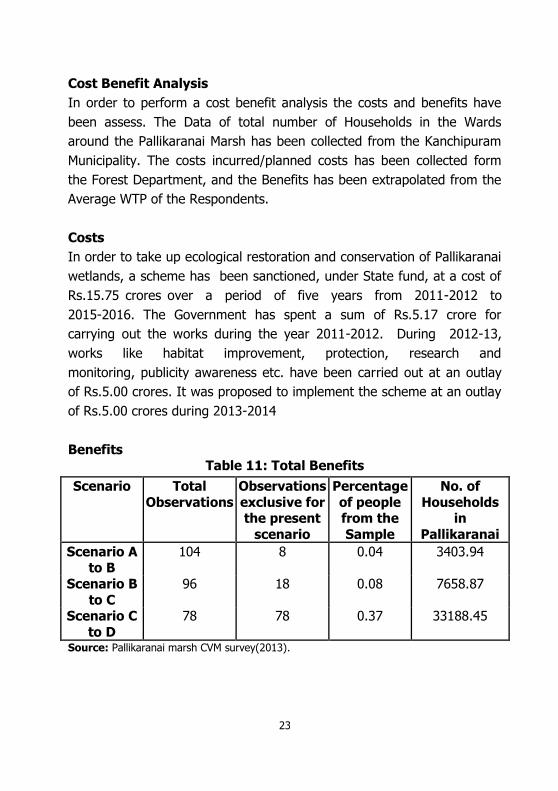
Benefits Table 11: Total Benefits
Scenario Total
Observations
Observations
exclusive for the present
scenario
Percentage
of people from the
Sample
No. of
Households in
Pallikaranai
Scenario A to B
104 8 0.04 3403.94
Scenario B
to C
96 18 0.08 7658.87
Scenario C
to D
78 78 0.37 33188.45
Source: Pallikaranai marsh CVM survey(2013).

24
Scenario Average (per
month)
Yearly =
Monthly * 12
Total Benefits =
No.of
households * Yearly WTP
Scenario A to B 180.29 2163.48 7364364.03
Scenario B to C 199.22 2390.64 18309608.72 Scenario C to D 245.19 2942.28 97649714.74
123323687.5 Source: Pallikaranai marsh CVM survey(2013). Note: *The total number of households in pallikaranai is 90630.
The project is expected to produce a net benefit of Rs. 12 crores,
for which the planned costs are only Rs. 5 crores. This gives a Net
Benefit of Rs.7 crores. This shows that, if feasible policies are made, the
Government can use the funds from the local people for speedy
renovation and improvement of the Marsh.
Table 12: Net Benefits
YEAR : 2013 – 14
Benefits From Wtp 12,33,23,687.5
Planned Costs 5,00,00,000
Net Benefit = Benefit – Cost 7,33,23,687.5
Source: Pallikaranai marsh CVM survey (2013).
Respondents Non Willingness To Pay
Of the surveyed 213 people, 109 of them were not willing to contribute
for the renovation and conservation of Marsh. Looking into the social,
economic and demographic characteristics of the households not willing
to pay, it reveals that these households’ characteristics are similar to that
of the rest.

25
Table 13: Social, Economic and Demographic Characteristics of
Respondents Not Willing to Pay
Characteristic Sample Mean
(std. dev)
Years in locality 10.95 (6.21)
Gender 0.59 (0.49) Household size 2.76 (1.33)
Household head age 46.05
(13.03) Monthly food expenditure (in Rs) 9206.42
(5663.89) Monthly expenditure (in Rs) 26794.95
(15914.6) Share of income spent on food 35.87
(17.42)
Number of children 0.76 (0.89) Percentage
Household has a child<18 years of age = 1, 0 otherwise 29 Education level of household head
Household head completed technical school or less = 1, 0
otherwise
26
Household head has a university degree or above = 1, 0
otherwise
74
Occupation of the household head
Employment in service sector = 1, 0 otherwise 53 Self-employed = 1, 0 otherwise 18
Pensioner = 1, 0 otherwise 8
Housewife = 1, 0 otherwise 6 Worker = 1, 0 otherwise 10
Student = 1,0 otherwise 14 Source: Pallikaranai marsh CVM survey (2013).
This brings out that the major reasons for them not willing to pay
lies in their psychological factors. The following figure explains that the
majority of people feel that the existing funds should be used efficiently,
and that the municipality will not use the contributions wisely. The other
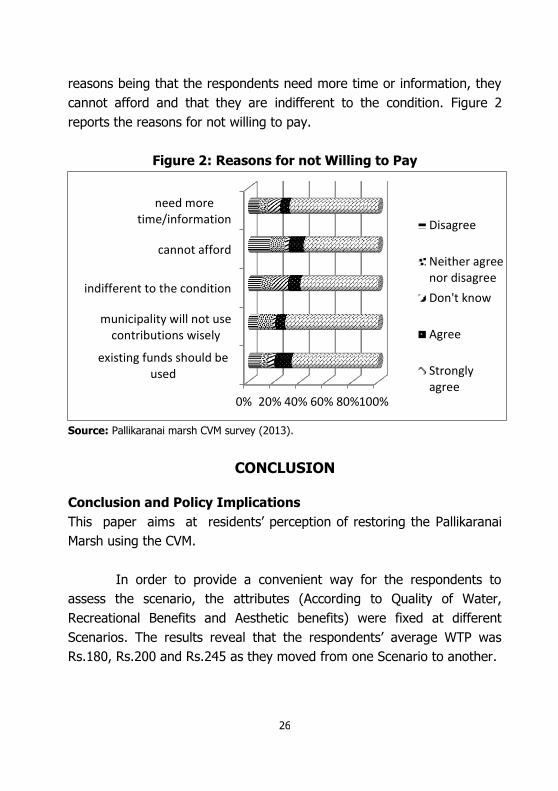
26
reasons being that the respondents need more time or information, they
cannot afford and that they are indifferent to the condition. Figure 2
reports the reasons for not willing to pay.
Figure 2: Reasons for not Willing to Pay
Source: Pallikaranai marsh CVM survey (2013).
CONCLUSION
Conclusion and Policy Implications
This paper aims at residents’ perception of restoring the Pallikaranai
Marsh using the CVM.
In order to provide a convenient way for the respondents to
assess the scenario, the attributes (According to Quality of Water,
Recreational Benefits and Aesthetic benefits) were fixed at different
Scenarios. The results reveal that the respondents’ average WTP was
Rs.180, Rs.200 and Rs.245 as they moved from one Scenario to another.
0% 20% 40% 60% 80%100%
existing funds should beused
municipality will not usecontributions wisely
indifferent to the condition
cannot afford
need moretime/information Disagree
Neither agreenor disagree
Don't know
Agree
Stronglyagree
27
The influence of the variables Years in locality, Gender, Age of
Family head, Household size, Education, Higher income and other
expenditures has been assessed using the OLS method and Bivariate
probit model. The heterogeneity across households has been capturing
using six profiles, and their average WTP assessed as well. A Bivariate
Probit regression is used to analyze the outcomes in two situations where
the household is willing to move from Scenario B to C, and where the
household is willing to move from Scenario C to D.
There are few drawbacks of the survey. First, a large majority of
the sample were from the middle and high income group, thereby not
providing adequate focus to the low income group. Second, the target
was mainly the residents around the Pallikaranai marsh; those who care
and work towards the conservation and renovation of the Marsh - Bird
watchers, nature lovers and NGOs- formed only a small part of sample.
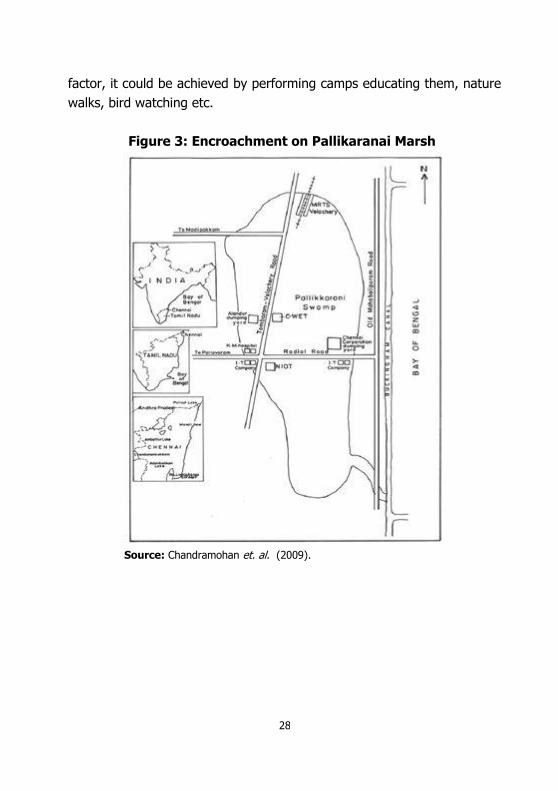
The residents in the locality of the Pallikaranai Marsh are aware
of the problems faced by the Marsh. Over the past few years there have
been conservation and renovation measures by the Government and the
NGOs. In order to take up ecological restoration and conservation of the
Marsh the government has sanctioned a State fund, at the cost of
Rs.15.75 crores, over a period of five years from 2011-12 to 2015-16.
The possible policy measure is for the government to involve the
people in the locality, and perform a community initiative in order to
restore the Marsh. Collection of membership fees, taxes and lump sum
donations seems a feasible measure only when the residents gain
confidence with the Government. A compulsory tax can be levied, but it
comes with its own drawbacks as well, the residents will never know if
the taxes are being used efficiently! Therefore the best measure is to
increase the awareness of the residents, and develop a sense of
belongingness for them towards the Marsh. Though it is a psychological
28
factor, it could be achieved by performing camps educating them, nature
walks, bird watching etc.
Figure 3: Encroachment on Pallikaranai Marsh
Source: Chandramohan et. al. (2009).
29
REFERENCES
Lartey, V. C., S. Antwi and E. K. Boadi (2013), “The Relationship Between Liquidity and Profitability af Listed Banks in Ghana”, International Journal of Business And Social Science, 4(3), March 2013, 48-56.
Ambastha, K., S. A. Hussain and R. Badola (2007), “Social and Economic Considerations on Conserving Wetlands Of Indo-Gangetic Plains: A Case Study of Kabartal Wetland, India”, The Environmentalist, 27(2), 261-273.
Baarsma, B. E. (2000), “Monetary Valuation of Environmental Goods: Alternatives to Contingent Valuation”, Tinbergen Institute Research, Series No. 220.
Edward, B., M. Acreman, and D. Knowler (1997), “Economic Valuation of Wetlands: A Guide for Policy Makers and Planners”, Ramsar Convention Bureau.
Birol, E., and S. Das (2010), “Estimating the Value of Improved Wastewater Treatment: The Case of River Ganga, India”, Journal of Environmental Management, 91(11): 2163-2171.
Brouwer, R., I. H. Langford, I. J. Bateman (1999), “A Meta-Analysis of Wetland Contingent Valuation Studies”, Regional Environmental Change, 1(1): 47-57.
Chandramohan, B. P., and D. Bharati (2009), “Role of Public Governance in the Conservation of Urban Wetland System: A Study of Pallikkaranai Marsh”, Proceedings of The Indian Society for Ecological Economics (INSEE), 5th Biennial Conference, Ahmedabad, India.
Das, S., E. Birol and R. N. Bhattacharya (2008), “Environmental Economy and Policy Research", Informing Efficient and Effective Solid Waste Management to Improve Local Environmental Quality and Public Health: Application of The
30
Choice Experiment Method in West Bengal, India”, University of Cambridge, Department Of Land Economics
Hanemann, W. M. (1994), “Valuing the Environment Through Contingent Valuation”, The Journal of Economic Perspectives, 8(4), 19-43.
Kling, C. L., D. J. Phaneuf, and J. Zhao (2012), “From Exxon to BP: Has Some Number Become Better Than No Number?”, The Journal of Economic Perspectives, 26(4), 3-26.
Maharana, I., S. C. Rai, and E. Sharma (2000), “Valuing Ecotourism In A Sacred Lake of The Sikkim Himalaya, India”, Environmental Conservation, 27(3), 269-277.
Markandya, A, “Economic Principles and Overview of Valuation Methods for Environmental Impacts: Development of the Czech Society in the European Union”, (Papers From the Conference Held On 21st-23rd October, 2004), Part V: Lectures in Non-Market Valuation Methods in The Environmental Area, Prague, Czech Republic.
Mishra, R. R., B. Rath, and H. Thatoi (2008), “Water Quality Assessment of Aquaculture Ponds Located in Bhitarkanika Mangrove Ecosystem, Orissa, India”, Turkish Journal Of Fisheries And Aquatic Sciences, 8(1).
Raghu, P. T., S. Das, and E. D. I. Oliver King (2012), “Use of Contingent Valuation to Assess Farmer Preference for On-Farm Conservation of Minor Millets: Case From South India”, 294-307.
Russi, D., P. T. Brink, A. Farmer, T. Badura, D. Coates, and J. Förster (2013), “The Economics of Ecosystems and Biodiversity for Water and Wetlands”, IEEP, London and Brussels.

31
Stumborg, B. E., K. A. Baerenklau, and R. C. Bishop, (2001), "Nonpoint Source Pollution and Present Values: A Contingent Valuation Study of Lake Mendota, “Review of Agricultural Economics”, 23(1), 120-132.
Venkatachalam, L. (2004), “The Contingent Valuation Method: A Review”, Environmental Impact Assessment Review, 24(1), 89-124.
Verma, M., N. Bakshi, and R. P. Nair (2001), Economic Valuation of Bhoj Wetland For Sustainable Use, Unpublished Project Report for World Bank Assistance to Government Of India, Environmental Management Capacity-Building. Bhopal: Indian Institute of Forest Management.

MSE Monographs
* Monograph 22/2012A Macro-Fiscal Modeling Framework for forecasting and Policy SimulationsD.K. Srivastava, K. R. Shanmugam and C.Bhujanga Rao
* Monograph 23/2012Green Economy – Indian PerspectiveK.S. Kavikumar, Ramprasad Sengupta, Maria Saleth, K.R.Ashok and R.Balasubramanian
* Monograph 24/2013Estimation and Forecast of Wood Demand and Supply in TamilanduK.S. Kavi Kumar, Brinda Viswanathan and Zareena Begum I
* Monograph 25/2013Enumeration of Crafts Persons in IndiaBrinda Viswanathan
* Monograph 26/2013Medical Tourism in India: Progress, Opportunities and ChallengesK.R.Shanmugam
* Monograph 27/2014Appraisal of Priority Sector Lending by Commercial Banks in IndiaC. Bhujanga Rao
* Monograph 28/2014Fiscal Instruments for Climate Friendly Industrial Development in Tamil NaduD.K. Srivastava, K.R. Shanmugam, K.S. Kavi Kumar and Madhuri Saripalle
* Monograph 29/2014Prevalence of Undernutrition and Evidence on Interventions: Challenges for IndiaBrinda Viswanathan.
* Monograph 30/2014Counting The Poor: Measurement And Other IssuesC. Rangarajan and S. Mahendra Dev
* Monograph 31/2015
Technology and Economy for National Development: Technology Leads to Nonlinear Growth
Dr. A. P. J. Abdul Kalam, Former President of India
* Monograph 32/2015
India and the International Financial System
Raghuram Rajan
* Mongraph 33/2015
Fourteenth Finance Commission: Continuity, Change and Way Forward
Y.V. Reddy
Suganya BalakumarSukanya Das
MADRAS SCHOOL OF ECONOMICSGandhi Mandapam Road
Chennai 600 025 India
October 2015
INVESTIGATING HOUSEHOLD PREFERENCES FOR
RESTORING PALLIKARANAI MARSH
MSE Working Papers
Recent Issues
* Working Paper 114/2015Price Rigidity, Inflation And The Distribution Of Relative Price ChangesSartaj Rasool Rather, S. Raja Sethu Durai and M. Ramachandran
* Working Paper 115/2015Money and Inflation: Evidence from P-Star ModelSunil Paul, Sartaj Rasool Rather and M. Ramachandran
* Working Paper 116/2015Determinants of Energy and Co2 Emission Intensities: A Study of Manufacturing Firms in IndiaSantosh K. Sahu and Deepanjali Mehta
* Working Paper 117/2015Impact of Water and Sanitation on Selected Water Borne Diseases in IndiaBrijesh C. Purohit
* Working Paper 118/2015Health Shocks and Inter-Generational Transmission of InequalitySowmya Dhanaraj
* Working Paper 119/2015Productivity, Energy Intensity and Output: A Unit Level Analysis of the Indian Manufacturing SectorSantosh K. Sahu and Himani Sharma
* Working Paper 120/2015Health Shocks and Coping Strategies: State Health Insurance Scheme of Andhra Pradesh, IndiaSowmya Dhanaraj
* Working Paper 121/2015Efficiency in Education Sector: A Case of Rajasthan State (India)Brijesh C Purohit
* Working Paper 122/2015Mergers and Acquisitions in the Indian Pharmaceutical SectorSantosh Kumar Sahu and Nitika Agarwal
* Working Paper 123/2015Analyzing the Water Footprint of Indian Dairy IndustryZareena B. Irfan and Mohana Mondal
* Working Paper 124/2015Recreational Value of Coastal and Marine Ecosystems in India: A Partial EstimatePranab Mukhopadhyay and Vanessa Da Costa
* Working Paper 125/2015Effect of Macroeconomic News Releases on Bond Yields in India China and JapanSreejata Banerjee and Divya Sinha
* Working papers are downloadable from MSE website http://www.mse.ac.in
$ Restricted circulation
WORKING PAPER 126/2015