msc research report 0706516r.pdf
TRANSCRIPT

University of the Witwatersrand
School of Geography, Archaeology and Environmental Studies
Climatology Research Group
Characterization and comparison of aeolian dust collected by horizontal
flux gauges and vertical deposit gauges
M. Sc. Research Report
Isaiah Sibanda
0706516R
Supervisor: Prof. S. Piketh
Climatology Research Group

ii
Preface There are many measurements that can be used to quantify dust concentrations. The use
of dust level measurements is suitable to the South African economy where finances for
instruments that measure continuously from the atmosphere are not usually available.
While Single Buckets will accumulate all dust, this does not establish dust emanating
from a given direction. Such open buckets are also subject to inaccuracies due to wind
conditions and other. This dissertation examines collection efficiencies of directional
horizontal flux gauges and non-directional deposit single bucket at higher wind speeds.
The single bucket is widely used in South Africa regardless of its flaws, and this
dissertation offers a cheaper directional dust monitoring alternative solution.
With respect to my writing this dissertation, I have been fortunate enough to be
surrounded by people who affected my motivation to write and finish this dissertation, in
a positive way.
My heartfelt thanks goes to Prof Stuart Piketh my supervisor, and Prof Harold Annegarn
who guided me with intelligence and expertise which, with each meeting shed more and
more light on my dissertation path. With persistence and patience, they challenged me to,
think, experiment and critically analyse.
I thank Prof. Mary Scholes for the support and encouragement she gave me throughout
the research and the NRF grant holder’s bursary she facilitated.
I am also grateful to the staff at Annegarn Environmental Research, for excellent
assistance and responsiveness to my technical needs during the dust-sampling period.
I would like to thank the staff at the Wits Physics Workshop who assisted me in
manufacturing the Modified Wedge Dust Flux Gauge (MWDFG).
I would like to thank the staff at Wits Glass Blowing Unit in the School of Chemistry
who assisted me in the manufacture of the Modified Wilson and Cooke Samplers.

iii
I would also like to thank Mr. Abe Seema, the Technician in the Wits Biology Electron
Microscopy Unit who helped me analyze the dust samples in the Scanning Electron
Microscope.
I would like to thank the staff at M&L Inspectorate laboratory for carrying out the
particle size analysis for the dust samples.
I am grateful for the thoughtful and creative support of my colleagues, who encouraged
the analysis from the beginning. Special thanks to Malusi Buthelezi who willingly and
cheerfully supported my efforts, and welcomed my unformulated ideas. The task would
have been much more difficult without their superb listening skills and their calm and
generous natures.
My wife Qinisile, my daughters Anele and Nonsikelelo whose understanding of my focus
on the dissertation was a gift to me.

iv
Abstract
Windblown dust is often a major nuisance problem faced in South African urban and near
urban areas due to the prevailing dry climatic conditions, extensive surface mining and
mineral processing. Dust deposit gauges single and double bucket are widely used in
South Africa to monitor fugitive dust. The use of bucket deposit gauges in areas where
predominant wind speeds are greater than 2 m.s-1, has yielded very poor collection
efficiency (typical recoveries being < 20%). A wedge dust flux gauge has been designed
and manufactured. The collection efficiency of the Modified Wedge Dust Flux Gauge
(MWDFG) is tested against a Single Bucket gauge and, modified Wilson and Cooke (flux
gauge) at Landau Colliery in Mpumalanga.
Scanning Electron Microscopy analysis of dust particles obtained from the four samplers,
exhibited six clusters of particulate morphology; irregular square, agglomerate, sphere,
floccule and column or stick. Based on their shape characteristics most of the samples of
the particles under investigation were probably soil and coal particles. The particle size
distribution analysis carried out on the dust samples had the MWDFG collecting the
largest fraction of particulate matter with 10µm diameter at 23 percent.
The MWDFG in this study recorded more dustfall rates than the other samplers at the
sampling site. The Modified Wedge Dust Flux Gauge recorded dustfall rates that were
within the INDUSTRIAL range while the other samplers recorded dustfall levels that
were within RESIDENTIAL range. The Single Bucket was commissioned at Landau
Colliery site RAMP 6 in August 2006, and has been recording dustfall rates in the
RESIDENTIAL range. The MWDFG during this study recorded dustfall rates in the
INDUSTRIAL range indicating that there are other dust sources from other wind
directions which the Single Bucket has been unable to collect over the years. The
predominant winds in the Witbank region are from the east and the Single Bucket was
installed in such a way that it records dust from the east. The Modified Wedge Dust Flux
Gauge should be used in combination with the bucket in Landau Colliery site RAMP 6 to

v
account for dust generated from others sources other than those located in the east.
Further dust collection efficient tests to the MWDFG at different locations and times
within Landau Colliery are required.
Declaration
I declare that this research report is my work, unaided work. It is submitted for the
Degree of Master of Sciences in Environmental Sciences in the University of the
Witwatersrand, Johannesburg. It has not been submitted before for any degree or
examination in any other University.
___________________________________________
(Signature of candidate)
________________day of______________________________2009

vi
Dedication
To my wife and daughters, without whom there would have been no journey. Thank you
for helping me keep the priorities straight and to maintain proper perspective

vii
Table of Contents
Preface .................................................................................................................................. ii
Declaration ............................................................................................................................ v
Dedication ............................................................................................................................ vi
CHAPTER ONE ..................................................................................................................... 1
Introduction ............................................................................................................................ 1
Study area ........................................................................................................................... 2
Research goals .................................................................................................................... 7
CHAPTER TWO .................................................................................................................... 9
Dust particles and their classification ................................................................................. 9 Impacts of particulate matter ............................................................................................ 11 Sources of dust ................................................................................................................. 14
Climatic conditions ........................................................................................................... 15 Figure 2.5 shows deposition of dust in the lee of topography obstacles due to flow divergence. Dust deposition is prevented on windward slopes where flow convergence and speed-up occurs.......................................................................................................... 20 Figure 2.5 Deposition of dust in the lee of topographic obstacles: after Pye (1987) . 20
Fugitive dust abatement .................................................................................................... 21 Dust monitoring ................................................................................................................ 22 Type of dust samplers ....................................................................................................... 23 Ambient air quality guidelines and standards................................................................... 29
CHAPTER THREE .............................................................................................................. 34
Methodology ......................................................................................................................... 34
Description of flux gauges ................................................................................................ 34 Sample preparation method and laboratory analysis ........................................................ 42 Microscopic analyses ........................................................................................................ 46 Particle size analysis ......................................................................................................... 48 Dust data presentation ...................................................................................................... 49
CHAPTER FOUR ................................................................................................................ 50
2007 Annual Average in Dustfall rates for the Single Bucket recorded at Schoongezicht mini-pit ............................................................................................................................. 50
Annual trends of dust fall rates for the Single Bucket recorded at Schoongezicht mini-pit .......................................................................................................................................... 51
Dustfall rates for the Single Bucket recorded at Schoongezicht mini-pit site RAMP 6 over January to December 2007 sampling period ............................................................ 52 Dustfall Rates recorded by the four samplers at Schoongezicht mini-pit site RAMP 6 during the March to April 2008 research period .............................................................. 53 Dustfall collection efficiencies of the four samplers under investigation ........................ 54
Regional climate and analysis of meteorological data ..................................................... 56 Dust morphology .............................................................................................................. 62 Particle size analysis for four dust samplers ..................................................................... 65 Discussion of results ......................................................................................................... 68 Dustfall rates recoreded by the four dust samples at Schoongezicht mini-pit site RAMP 6 during March to May 2008 ............................................................................................... 68 Particle size analysis of the dust samples ......................................................................... 69 Scanning electron microscopy analysis of the dust samples ............................................ 69

viii
CHAPTER FIVE .................................................................................................................. 70
Conclusion and Recommendations ...................................................................................... 70 References…………………………………………………………………………………….72
List of Figures
Figure 1.1 Locality map of Landau Colliery Schoongezicht Mini-pit dust monitoring Sites RAMP 6 and Mpondozankomo……………………….3
Figure 1.2: Photography of site RAMP 6 (North West) at Schoongezicht Mini-pit……………. ………………………………………...4 Figure 1.3: Photograph of Site Ramp 6 (South) at Schoongezicht Mini-pit………………………………………………………..4 Figure 1.4: Displacement of particle trajectories away from the gauge…………………...6 Figure 2.1: Idealized schematic of distribution of surface
area of an atmospheric aerosol. Principal modes, sources and particle formation and removal mechanisms are indicated. (After Seinfeld and Pandis, 1998)……………………………..10
Figure 2.2 The effect of lapse rate on plume type DALR signifies the dry adiabatic lapse rate (dashed line) and ELR the environmental lapse rate (solid line), after Pretorius et al (1986)…………………………………..17 Figure 2.3 Seasonal variations of the mean 800 hPa winds and contours……………….19 Figure 2.4 Modes of particle transportation by wind…………………………………… 20 Figure 2.5 Deposition of dust in the lee of topographic obstacles……………………….20 Figure 2.6 Photograph of frisbee depositional dust gauge………………………………25 Figure 2.7 Photograph of directional dust gauge………………………………………...26 Figure 2.8 Photograph of sticky pad cylinder and slide on DustScan unit……….............27 Figure 2.9 Schematic diagram of tapered element oscillating microbalance (TEOM)……………………………………………………………………….29 Figure 3.1: (a) Photograph and (b) construction scheme of Wedge Dust Flux Gauge……………………………………………………...36 Figure 3.2: Construction scheme of the (a) Modified Wedge
Dust Flux Gauge (MWDFG) (b) Dust deposit tray…………………………..37 Figure 3.3: Modified WDFG Sampler and the Single Bucket at Schoongezincht Mini-pit site RAMP 6……………………………………….39 Figure 3.4: MWDFG, MWAC N, MWAC D and the Single Bucket at Schoongezincht Mini-pit site RAMP 6……………………..40 Figure 3.5: Construction Scheme of the MWAC…………………………………………41 Figure 3.6: Single Bucket monitoring unit, showing sampling
bucket with bird ring and security clamp……………………………………..42 Figure 3.7: Photography of the Scanning Electron Microscopy used in the study housed at the Wits University in the biology department electron microscopy unit………………………………46 Figure 4.1: Comparison of annual average dust fall rates recorded
at each monitoring station in Schoongezincht Mini pit during January to December 2007 with pre-2007 rates……………………….50
Figure 4.2: Schoongezicht Mini-Pit temporal averaged dustfall recorded during the January to December 2007 period, compared to the long-term mean……………………………………………...51
ix
Figure 4.3: Dustfall rates at Site 6 (Ramp 6) during the September to December 2007……………………………………………………………..53 Figure 4.4: Comparison of monthly dustfall rates recorded at
Landau Colliery Schoongezicht Mini-pit site RAMP 6 by Single Bucket during the March to April 2008 with March to April 2007 sampling periods……………………………………….54
Figure 4.5: Period average wind rose for the January to October 2007 monitoring period Base on wind field data from the SAWS station in Witbank………………………………..58
Figure 4.6: Monthly wind rose for Witbank for the period of January to June 2007………………………………………………………….59 Figure 4.7: Monthly wind rose for Witbank for the period of
July to October 2007………………………………………………………….60 Figure 4.8: Monthly wind rose for Witbank for the period of March to April 2008…………………………………………………………..61 Figure 4.9: Monthly wind rose for Witbank for the period of May to June 2008……………………………………………………………..62 Figure 4.10: SEM images of dust particles collected by MWDFG (a) irregular square (b) irregular square and flocule, (c) irregular square and agglomerate, (d) cylindrical (e) irregular diamond………………………………………………………….63 Figure 4.11: SEM images of dust particles collected by single bucket (a) sphere, and agglomerate (b) sphere and irregular (c) sphere and irregular (d) sphere and irregular……………………………...64 Figure 4.12: SEM images of dust particles collected by MWAC N (a) irregular square (b) cylindrical (c) irregular square and cylindrical (d) agglomerate and
cylindrical……………………………………………………………………..64 Figure 4.13: SEM images of dust particles collected by MWAC D
(a) cylindrical, (b) cylindrical, (c) agglomerate and (d) irregular square……………………………………………………………65
Figure 4.14 Particle Size Distribution plots for the dust collected by the Four dust samplers …………………………………………………………...66
List of Tables Table 1.1: The Landau Colliery monitoring network……………………………………5 Table 2.1; Classification of areas in terms of sensitivity to precipitant dust………………………………………………………………..15 Table 2.2: Description of Different Standard Deposit Gauges…………………………..24 Table 2.3: Air quality guidelines and standards for respirable particulates (PM10)……………………………………………………………30 Table 2.4: Nuisance: mass deposition measurements……………………………………30 Table 2.5: Four-band scale evaluation criteria for dust deposition (SANS 1929:2005)…………………………………………………………...32 Table 2.6 Dust standards, target, action and alert thresholds for
dust deposition (SANS 1929:2005)…………………………………………..32 Table 3.1: Indeterminate errors for single bucket monitoring
Process……………………………………………………………………….44 Table 3.2: Specifications of the JEOL 840 SEM ………………………………………..47 Table 4.1: Dustfall rates recorded by four samplers under investigation

x
at Landau Colliery Schoongezicht Mini-pit site RAMP 6 for the march to May study period……………………………………………53
Table 4.2: Ratios of dustfall rates and average ratios obtained for the four samplers under investigation…………………………………………….55 Table 4.3: Table showing collection efficiencies of the MWDFG,
NWAC N and MWAC D against the Single Bucket……………………….56
List of Appendices
APPENDIX A. Step by Step Description of the method used to obtain Dust Data……………………………………………………… APPENDIX B Schematic Design of modified WDFG………………. APPENDIX C: Particle size analysis graphs for the Single Bucket ... APPENDIX D: Particle size analysis graphs for the MWDFG……… APPENDIX E: Particle size analysis graphs for the MWAC D……... APPENDIX F: Particle size analysis graphs for the MWAC N………
……………………78 ……………………82 ……………………83 ……………………84 ……………………85 ……………………86
Nomencluture
• Aeolian dust is windblown dust
• Aerodynamic diameter is the diameter of a spherical particle that has a density of
1g/cm3 and which has the same terminal settling velocity as the particle of interest.
• Atmospheric dust – Minute particles slowly settling or suspended by slight currents
and existing in varying amounts in all air.
• Brownian motion – The continual random movement due to molecular agitation of
fine particles suspended in a gas or a liquid.
• d50 – In a sample of dust the d50 diameter is the diameter above which fifty percent of
the particles are larger, and below which fifty percent of the particles are smaller.
• Dry deposition – The collection of precipitant dust during periods with no rainfall.
• Export Bucket – The export bucket can be north, south, east or west bucket that is
closet to the dust source. When the wind blows over the dust source towards the
sampling location then the export bucket is open and dust from the dust source is
collected in the bucket
• Fall – out dust – See precipitant dust.
• Fugitive dust – Dust that is not emitted from a point source that can be easily defined
such as stacks. Sources are open fields, travel ways, stock piles and process buildings.

xi
• Meteorology - the earth science dealing with phenomena of the atmosphere (especially
weather)
• MWAC – Modified Wilson and Cooke sampler
• MWAC D – Modified Wilson and Cooke sampler with double size air inlet and outlet.
• MWAC N – Modified Wilson and Cooke sampler with normal size air inlet and outlet
• WDFG – Wedge dust flux gauge
• MWDFG – Modified Wedge Dust Flux Gauge
• New Bucket - A bucket that is taken to the field to replace and old bucket.
• Nuisance particulates – the course fraction of airborne particulates typically greater
than about 20 µm. These particulates tend to be deposited quickly and as such
approximates to annoyance, or nuisance dust, such settled particles may show up as a
deposit on smooth surfaces such as cars and window ledges.
• Old Bucket - A bucket that has been in the field for thirty days and is being replaced
by a new bucket.
• Particulate Matter – Material suspended in the air in the form of minute solid particles
or liquid droplets, especially when considered as atmospheric pollutants.
• Petri dish – A container used to keep the precipitant dust samples free of
contamination after they have been filtered.
• PM 2.5 – Dust where the aerodynamic d50 diameter is 2.5 µm.
• PM 10 – Dust where the aerodynamic d50 diameter is 10 µm.
• Precipitant dust – Any particulate matter that has an aerodynamic diameter below 100
µm.
• Total deposition – The sum of wet and dry deposition.
• Wet deposition – The collection of precipitant dust and any soluble substance in the
rainwater during periods of rainfall.

1
CHAPTER ONE
OVERVIEW
Introduction
Windblown dust is often a major nuisance problem faced in South African urban and
near urban areas due to the prevailing dry climatic conditions, extensive surface mining and
mineral processing (Held et al., 1994). Aerosol particles have been of major concern as early
as 1500s after they were recognized as a threat to human health (WHO, 1998). In its report of
1998, the World Bank stated that particles smaller than 10 µm are a major threat to human
health and enhance diseases such as pneumonia, influenza and tuberculosis (Nemmar et al,
2003). Wind-blown dust acts as a secondary pathway for the ingestion of toxic metals
(Combes and Warren, 2005). The onset of full-blown AIDS is often precipitated by other
occupational disease such as silicosis, which is a result of dust (Hall, 1994; Schwela, 1998).
Aerosol particles have also been a major cause of visibility reduction in urban areas. Wet and
dry deposition of particulate matter may also cause damage to plants, metal surfaces, fabrics
and buildings (Farmer, 1993).
The distribution of aerosols in the atmosphere is influenced by prevailing meteorological
conditions of an area (Baumbach, 1996). The meteorological characteristics of an area impact
on the rate of emissions from fugitive sources and govern the dispersion and eventual removal
of pollutants from the atmosphere. Fugitive dust emission rates are predominantly a function
of the wind speed and the intensity and duration of the activity generating the dust (Combes
and Warren, 2005). Evaporation rates and precipitation levels also influence fugitive emission
rates due to their impact on the moisture content of materials being handled (Combes and
Warren, 2005).
The adverse effects that the aerosol particles have impacted on humans, animals, plants and
the climate have called for an effective and reliable monitoring processes over the years so as
to reduce and avoid their impacts. The directly inhaled dust particle fraction is normally
monitored using active samplers, which fractionate the sampler and pull a known volume of
air through a filter paper (Garland and Nicholson, 1991). For nuisance dusts it is usually
A brief discussion of dust, its effects and dust monitoring gauges is given in the chapter. The study area, problem statement and research goals are also outlined

2
either deposition to the ground or the flux of particles past a point that is of interest (Hall,
1994). Deposition and flux are often monitored with passive gauges. Passive samplers rely on
ambient wind conditions when collecting samples. Passive gauges are relatively cheap
compared with pump-driven aerosol samplers and installation is not limited by the need for a
power supply (Hall, 1994). There are difficulties with sampling the larger end of the
atmospheric particle size distribution range (>40 µm), which is of the greatest interest for dust
nuisance, with pumped samplers. Apart from the Wide Range Aerosol Classifier (Burton and
Lundgren, 1987), whose performance is presently unquantified and of which only three
models currently exist, there are no fully effective, commercial designs presently available
which measure the total atmospheric suspended particulate up to and beyond 100 µm in size
(Hall, 1994).
Measurements of larger size fractions normally associated with nuisance are often made using
passive gauges set above the ground. Deposit gauges have a horizontal opening and flux
gauges a vertical opening. Deposit gauges are normally in the form of a cylindrical container
or funnel of some sort and a fair variety of them are in use worldwide (Hall, 1994). Flux
gauges are less common, the most common being the British Standard directional gauge
(British Standards Institution, 1972) and the Wedge Dust Flux Gauge, (Hall, 1994). Dust
deposit and flux gauges should be used in combination to assess different aspects of wind-
blown dust problems (Hall, 1994). Deposit gauges give information on local rates of
deposition to the ground, whereas flux gauges indicated the passage of dust past the sampling
point. Flux gauges can also possess natural directional properties, which can be used to
identify the source direction of wind-blown dust (Hall, 1994). The dust deposit and flux
gauges have to be set well above the ground, typically between 1 and 2 m height, in order to
avoid collecting locally wind-raised material.
The Standard American Test Method (Egami et al, 1991) for wind blown dust monitoring has
found wide application in the South African mining industry in or near urban areas. The
deposit gauge used in this method consists of a single bucket half filled with treated de-
ionized water for trapping dust.
Study area Field experiments for this study were carried out at Landau Colliery Schoongezicht
Mini - pit, site RAMP 6 (see figures 1.1, 1.2 and 1.3). Dust monitoring at Landau Colliery is

3
carried out by Annegarn Environmental Research (Pty) Ltd on continuous basis. A dust
deposition monitoring network of fallout dust monitors at Landau Colliery has been in
Figure 1.1 Locality map of Landau Colliery Schoongezicht Mini – pit-showing dust
monitoring sites RAMP 6 and Mpondozankomo
operation at Landau Colliery – Kromdraai Opencast since November 1992 and at Landau
Colliery – Schoongezicht Mini-pit since June 1997. Schoongezicht Mini-pit comprised of
seven single bucket and two DustWatch multidirectional monitors. In February 2007
Mpondozankomo twin bucket network was decommissioned and replaced by
Mpondozankomo DustWatch multidirectional monitors in March 2007. Other existing dust
monitoring sites for Schoongezicht are shown in the table 1.1

4
Figure 1.2: Photograph of site RAMP 6 (North West) Schoongezicht Mini-pit
Figure 1.3: Photograph of Site Ramp 6 (South) at Schoongezicht Mini-pit

5
Table 1.1: The Landau colliery monitoring network:
Division Site description
Site
number Commission date
SINGLE BUCKET MONITORS
Schoongezicht Mini-Pit West End Bluegum Trees LAND 01 June 1997
East End Bluegum Trees LAND 02 June 1997
Power Lines LAND 03 June 1997
Clewer Crossroads LAND 04 August 2006
HTPL LAND 05 August 2006
Ramp 6 LAND 06 August 2006
Ramp 3 LAND 07 August 2006
DUSTWATCH MONITORS
Schoongezicht Mini-Pit Mpondozankomo MPOD March 2007
Schoongezicht SCHOON
DW
November 2007
Landau Colliery (Coal) is located 15km north-west to 12km south-west of Witbank in the
Province of Mpumalanga. Landau Colliery, an open-cast operation, produces pulverized coal
and thermal coal for export; and washed sized coal for the domestic market. Landau Colliery
is one of Anglo Coal's South African export mines. It commenced operations in 1992 but the
coal reserves were mined as early as 1926. The mine was then known as Coronation Colliery
and mining was underground. Underground mining stopped in 1966. Today opencast mining
methods are used and the number 1 and number 2 seams are mined in a drill and blast
operation with one dragline, two hydraulic shovels and four haul trucks.
Most of the coal produced at Landau is exported through the Richards Bay Coal Terminal. A
small portion is supplied to the inland market.
Fugitive dust represents the predominant source of atmospheric emissions from the Landau
Colliery. Fugitive dust sources comprise emission of solid particles by the forces of wind or
machinery acting on exposed material. Typical examples of such sources include materials
handling activities, vehicle entrainment of road dust and wind erosion of stockpiles and
tailings impoundments. Particulates may contribute to visibility reduction, pose a threat to
human health, or be a nuisance due to their soiling potential.

6
The main functions of dust monitoring in general include the quantification of the mining
operation’s contribution to dust deposition in the area, and the identification of possible
problem areas. Dustfall monitoring is also useful in tracking progress of control measures
and for demonstrating compliance with accepted air quality standards.
Problem statement
It was noted from an emission inventory and modeling study carried out at Landau
Colliery by Ecoserve (Pty) Ltd that the predominant size fraction for the nuisance particulates
is 10 to 85 µm (Baird, 2007). The modeling study indicated that episodes of dust fallout
effects on the community would likely occur at wind speeds greater than 2 m.s-1 (Baird,
2007). According to Warren (2000), the Single Bucket at wind speeds greater than 2 m.s-1 will
collect less dust than in an area with the same atmospheric load but with lower wind speed.
The reason being that collected dust is lost easily due the scouring action of the wind driven
circulation inside the bucket, which tends to remove material already collected. This is
mitigated by filling the bucket with water. The other reason for poor collection efficiency is
that the aerodynamic blockage of the gauge produces a rising and accelerating separation
streamline over the gauge opening. As a result, particle trajectories are displaced away from
the gauge opening and its collection efficiency is reduced (Figure 1.4).
Figure 1.4: Displacement of particle trajectories away from the gauge. (After Hall et al., 1994)
The wind speed data obtained from South African Weather Services (SAWS) Witbank
weather station indicate that wind speeds in Witbank region are generally above 2 m.s-1 over
the annual period. The dust monitoring carried by Annegarn Environmental Research (Pty) at
Landau colliery using the single bucket could be yielding dustfall rates that are below the
actual dust fall load around the colliery. Ecoserve (Pty) Ltd recommended deployment of flux
gauges at Landau Colliery for maximum recovery of dust (Baird, 2007).

7
This research set out to examine the efficiencies of three flux gauges against a single bucket
in the Witbank region. It is hoped that the findings of this research will provide a solution to
Landau Colliery and also contribute to the growing knowledge on dust monitoring,
particularly to the air pollution control and monitoring industry of South Africa
In this study, a dust flux directional monitoring gauge called a Modified Wedge Dust Flux
Gauge (MWDFG) to capture dust particles at high wind speeds is designed and manufactured.
The dust samples collected from this sampler and those from single bucket and modified
Wilson and Cooke (MWAC) samplers are investigated for particle size distribution and
morphology.
Research goals The aim of this study is to develop and test a horizontal flux gauge that will effectively
capture dust particles at high wind speeds. This rather broad aim is concentrated on three
main objectives.
• To modify the existing Wedge Dust Flux Gauge (WDFG) by incorporating a
removable dust deposition tray, wind vane and a bearing to orient the sampler towards
different wind directions. The new sampler will be called Modified Wedge Dust Flux
Gauge (MWDFG).
• To evaluate the relative efficiencies of the four samplers (single bucket, MWDFG, and
Modified Wilson and Cooke (MWAC) – normal and double size).
• To determine the physical properties of the collected dust samples
Structure of the report
The remainder of the report is organized into four chapters.
Chapter two focuses on review of literature relevant to the study, highlighting the classes of
dust and health and ecological effects. This chapter also considers the standard methods used
for dust monitoring. Included in this chapter is description of various dust sources and effects
of climatic conditions on dust levels.
Chapter three discusses the methodology adopted for the study

8
Chapter four presents’ dustfall rates observed for the four dust samplers, particle size
analysis and microscopic analysis. Included in this chapter is a comparative analysis of the
findings presented.
Chapter five summarizes the research and draws conclusions from the research findings.

9
CHAPTER TWO
In this chapter dust particles are defined, health and ecological effects are reviewed. The standard methods used for dust monitoring are also presented. This is followed by a description of the various dust sources and how climatic conditions affect dust levels.
Literature review
Dust particles and their classification
Dust consists of finely divided particles that may become airborne (Mody and Jakhete,
1987). These tiny solid particles are formed by a wide range of manufacturing, domestic, and
industrial activities. Construction, agriculture, and mining are among the industries that
contribute most of the atmospheric dust levels (Mody and Jakhete, 1987). Some of the
activities that contribute to dust generation include: vehicle- entrainment of dust from paved
and unpaved roads; wind erosion of open areas, stockpiles, and tailings impoundments;
material handling (loading and tipping operations); drilling and blasting operations; dozing
and scraping operations and agricultural activities like tilling, (Combes and Warren, 2005).
The principal modes, sources and particle formation and removal mechanisms of atmospheric
aerosols are indicated in figure 2.1.
According to Seinfeld and Pandis, (1998) dust particles ranges in size between 1 – 100 µm in
diameter and fall within the course mode range (Figure 2.1), Particle less than 1 µm are
classified as smoke or fumes and fall within the fine mode range. The 2.5 µm particles are
respirable and are associated with health effects. These particles are small enough to penetrate
the nose and upper respiratory system and deep into the lungs. Particles that penetrate deep
into the respiratory system are generally beyond the body’s natural clearance mechanisms of
cilia and mucous and are more likely to be retained, (Mody and Jakhete, 1987). Inhalable dust
consists of dust particles with a median aerodynamic diameter of 10 µm which enters the
body, but is trapped in the nose, throat, and upper respiratory tract (Mody and Jakhete, 1987).
Particles greater than 10 µm are associated with nuisance. According to the Environment
Agency, (2003) particles >30 – 50 µm tend to be deposited quickly and may show up as
deposit on clean surfaces such as cars and window ledges. Excess concentrations of nuisance
dust in the workplace may reduce visibility, may cause unpleasant deposits in eyes, ears, and

10
nasal passages, and may cause injury to the skin or mucous membranes by chemical or
mechanical action (Mody and Jakhete, 1987). Another form of dust may be particulate matter
that, although may be found resting on the ground or other surfaces, is capable of becoming
airborne before returning to the surfaces (Grantz et al., 2003).
Figure 2.1: Idealized schematic of distribution of surface area of an atmospheric aerosol.
Principal modes, sources and particle formation and removal mechanisms are
indicated. (After Seinfeld and Pandis, 1998)
11
Dust in the atmosphere and the removal pathways
The wind assists in keeping between one and three billion tons of dust and other
particles airborne at any given time (Envirocast Newsletter, 2003). The atmosphere is
continuously being gleaned of its dust load through the different deposition mechanisms
(Jiries et al., 2002). The deposition of particles can take place by three dominant routes: wet
deposition, dry deposition and occult deposition. If the particles settle by gravity then they are
collected as dry deposition. Alternatively, if it rains, then the particles are collected as wet
deposition. Particles are removed through incorporation into raindrops as condensation nuclei.
Particles in the 0.1 µm diameter size range, particularly sulphate, represent effective
condensation nuclei. Smaller particles rapidly diffuse to cloud droplets. Larger particles such
as ammonium sulphate and sodium chloride are removed beneath the cloud by raindrops.
Occult deposition occurs during mist and fog conditions.
There is an interaction between dry deposition and wet deposition in that wet deposition often
removes previously deposited dust on exposed surfaces. If the rainfall is very light then it may
not be able to wash away the dry deposited material on surface and the content of the wet
deposition may be added to the exposed surface when the rain stops.
Dry deposition is a slow process compared to wet deposition, but dry deposition occurs
almost continuously.
Particles between 10 and 100 µm usually loose altitude as a result of gravity. These particles
can be lifted up by strong winds but when the wind stops lifting the particles up into the air,
they begin to settle. Smaller particles (less than 10 µm) are affected by thermals, turbulence
and Brownian motion and will not necessarily settle all the way to ground level. These
particles are nevertheless present in the atmosphere at all altitudes and they also precipitate
when climate conditions are suitable (Countess Environmental, 2005).
Impacts of particulate matter Dust particles play an important role in the dynamics of the lower atmosphere and on
the Earth itself. They also strongly affect, directly or indirectly, the biological and chemical
activities in these regions (Goosens, 1999). Dust particles in the atmosphere form an aerosol
when they are suspended in a heterogeneous mixture with liquid droplets. Atmospheric
aerosol can be either primary or secondary pollutants. Primary particulates such as soil
particles are transferred to the atmosphere in the same chemical form as the source material;
secondary particulates are derived from condensation of vapours or chemical reactions in the
gas phase. Primary pollutants are not subject to any chemical transformations. Particles larger

12
than 1 µm are produced by mechanical disintegration of material such as crushing, grinding
and blasting. Primary pollutants like chlorides, fluoride and phosphate in the size range
between 0.1 to 1 µm form larger particles through coagulation process through collision and
adhesion. The particles are held together by chemical bonds. The secondary and condensation
particulate species resulting from chemical conversions are significant on a regional scale
(Held et al., 1996).
Particulates lifetime in the atmosphere varies from minutes to several days, allowing some
components to be transported over thousands of kilometers from their source regions. The
dust fall impacts are generally of concern within a 3 km radius of large source. The majority
of the environmental and health complaints are generally more pronounced during dry, windy
months.
Effects on human health
Pollution problems due to wind-borne dust from human activities are one of the major
sources of complaint, alongside odours (Hall et al., 1994). Wind-borne dust is important for
health reasons, due to entry into respiratory tract or as a secondary pathway for ingestion of
toxic materials (Combes and Warren, 2005). With the rise of large-scale manufacturing,
workers are now exposed to new dusts in settings such as steel and textile mills (Combes and
Warren, 2005). The onset of full blown AIDS is often precipitated by other occupational
disease such as silicosis which is a result of dust (Schwela, 1998). Exposure to particulate
matter has been associated with hospitalization for respiratory or cardiovascular disease and
exacerbation of respiratory disease, such as asthma (Schwela, 1998). In people who already
have respiratory problems asthma and allergic reactions caused by dust may be severe.
Breathing a lot of dust over a long period of time can cause chronic breathing and lung
problems. Dust also causes coughing, wheezing and runny noses (Schwela, 1998).
The impact of particles on human health is largely depended on (i) particle characteristics,
particularly particle size and chemical composition and (ii) the duration, frequency and
magnitude of exposure (Dockery and Pope, 1994). The potential of particles to be inhaled and
deposited in the lung is a function of the aerodynamic characteristics of particles in flow
streams. The aerodynamic properties of particles are related to their size, shape and density
(Dockery and Pope, 1994). The deposition of particles in different regions of the respiratory
system depends on their size (Lennon et al., 1998). The nasal openings permit very large dust

13
particles to enter the nasal region, along with much finer airborne particulates. Large particles
are deposited in the nasal region by impaction on the hairs of the nose or at the bends of the
nasal passages. Smaller particles (PM10) pass through the nasal region and are deposited in the
tracheobronchial and pulmonary regions. Particles are removed by impacting with the wall of
the bronchi when they are unable to follow the gaseous streamline flow through subsequent
bifurcations of the bronchial tree (Dockery and Pope, 1994). As the airflow decreases near the
terminal bronchi, the smallest particles are removed by Brownian motion, which pushes them
to the alveolar membrane (Godish, 1990). Epidemiological research has identified PM2.5 as
the most damaging size fraction with regard to human health due to their ability to penetrate
the deep lung (Godish, 1990). The PM2.5 size fraction has a longer residence time and a low
gravitational settling velocity thus representing a greater exposure potential. Ambient PM2.5
also penetrates more easily into buildings than does coarser particles. Exposures to PM10 are
related to increases in the prevalence of chronic respiratory disease and increased risk of acute
respiratory disease (Dockery and Pope, 1994; Godish, 1990).
Breathing too much dust can potentially harm anyone. However, the following groups are at
the highest risk: Infants, children, and teens, the elderly and pregnant women; People with
asthma, bronchitis, emphysema, or other respiratory conditions; People with heart disease;
and Healthy adults working or exercising outdoors
Ecological effects
Wet and dry deposition of particulate matter may cause damage to plants, metal
surfaces, fabrics and building (Grantz et al., 2003). Depending on the chemical composition,
particulate matter can contaminate soil and water.
The primary effects of particulate matter on vegetation are reduced growth and productivity
due to interference with photosynthesis and phototoxic impacts as a result of particulate
composition. The mechanisms of action are through smothering of the leaf; physical blocking
of the stomata; bio-chemical interactions; and/or indirect effects through the soil (Grantz, et
al., 2003). Dust deposited on the ground may produce changes in soil chemistry, which may
in the longer-term result in changes in plant chemistry, species competition and community
structure (Wayne, 1991). The relative efficiency of these methods will depend upon the plant
or soil surface, the micro-climate and ambient (temperature and humidity) conditions (Wayne,
1991). Dust particles can also act as nuclei onto which ammonia, sulphuric acid and hydrogen
fluoride may adhere, forming acidic dust, which can burn plants (Wayne, 1991)

14
The deposition of particulate matter on materials can reduce their aesthetic appeal as well as
increase their physical and chemical degradation (Grantz et al., 2003). The primary effects of
particulate matter on materials are on the rates of corrosion and erosion, and soiling and
discoloration. Course particles (2.5-10 µm) contribute more soiling and discoloration
horizontal and vertical surfaces than fine particle (<2.5 µm). Course particles are more readily
removed by rain (Grantz et al., 2003). Particles may act as a catalyst for the conversion of
SO2 and NOX to sulfuric acid and nitric acid which accelerate the chemical degradation of
susceptible material surfaces on which they are deposited (Grantz et al., 2003)
Effects on animals
Deposition of acidic dust on aquatic systems alters the pH and this result in
acidification of lakes and ponds (Grantz et al., 2003). Low pH kills fish and result in lakes
with no fish species. Heavy metals that may be contained in dust and transported in water and
vegetation may be toxic to animals and fish (Grantz et al., 2003). The process by which the
animals may be affected by contaminated dust is by them ingesting contaminated vegetation
or forage where contaminated dust has accumulated. Carnivores may also consume small
animals that have ingested exotic chemical from dust (Grantz et al., 2003.
Sources of dust Dust is caused by a combination of weather conditions, the natural environment and
human activities (Grantz et al., 2003). High winds can raise large amounts of dust from areas
of dry, loose soil. High winds are most common during the late winter and spring months
(Dockery and Pope, 1994). Process-generated precipitant dust comes from industrial activities
where the actual structure of the material is altered, such as a rock crushing operation
(Countess Environmental, 2005). Open sources generate precipitant dust as a result of wind or
mechanical contact (Countess Environmental, 2005). The sources of dust can include:
soil disturbance during construction projects; disturbed land areas that are cleared and vacant;
unpaved roads, parking lots and playgrounds; windblown emissions from tilted fields;
military training exercises; unpaved equipment yards; undisturbed desert areas during the
highest winds; ploughing on farms; dust blown from recently ploughed fields; traffic on dirty
roads; blasting at opencast mine operations; dust emitted from process buildings (excluding
stacks); dust blown from stockpiles of raw and finished materials; crushing operations; and
transportation of raw materials and products by rail or roads.

15
Dust becomes more common where natural soils have been disturbed by human activities
(Scotland Government 1998). This tends to be concentrated close to populated areas
(Etyemezian et al., 2004). Each site is unique and the impact of the precipitant dust emanating
for example, from a mine or factory is dependent on many factors: The type of mineral being
processed and the methods used (Rodrigues, 2002); Local meteorology and topography
(Rodrigues, 2002); and the zoning of the land surrounding the site, as shown in Table 2.1
Table 2.1: Classification of areas in terms of sensitivity to precipitant dust
High Sensitivity Medium Sensitivity Low Sensitivity
Hospitals and Clinics Schools Farms
Retirement homes Residential areas Light and heavy industry
Hi-tech industries Food retailers Outdoor storage
Areas where painting is
being done
Greenhouses and nurseries
Food processing Horticultural land
Offices
Depending on climatic conditions and topography, fine particles may remain airborne for days
or months and may be transported 1000 to 10 000 km or more from their sources (Countess
Environmental, 2004). Dust sources can be process or open source generated, but excludes
dust emitted from stacks. Dust emitted from stacks is usually constant all year round with
wind and rainfall not affecting the amount of dust emitted from the stack (Countess
Environmental, 2004)
Climatic conditions The impact that climatic conditions have on the precipitant dust levels is important
and the factors that could be considered are rainfall (drought), wind speed, and the time
periods with little or no wind. The meteorology characteristics of a site impact on the rate of
emissions from fugitive sources, and govern the dispersion, transformation and eventual
removal of pollutants from the atmosphere (Godish, 1990). Fugitive dust emission rates are
predominantly a function of the wind speed, and the intensity and duration of the activity
generating the dust (e.g. traffic volumes, extent of batch drop operations) (Godish, 1990).
Evaporation rates and precipitation levels also influence fugitive emission rates due to their
impact on the moisture content of materials being handled or stored (Godish, 1990).

16
The wind direction and the viability in wind direction determine the general path pollutants
will follow, and the extent of cross-wind spreading (Kuhn and Loans, 2003).
Pollution concentration levels therefore fluctuate in response to changes in atmospheric
stability and to shifts in the wind field. Spatial variations, and diurnal and seasonal changes, in
the wind field and stability regime are functions of atmospheric processes operating at various
temporal and spatial scales (Kuhn and Loans, 2003). Atmospheric processes at macro- and
meso-scales need therefore be taken into account in order to accurately parameterize the
atmospheric dispersion potential of a particular area (Kuhn and Loans, 2003).
Meso-scale factors
Mesoscale factors such as regionally induced topographic winds, urban heat island
effects and atmospheric stability are important control factors in atmospheric pollution
dispersion (Held, 1996 a,b; Tyson et al, 1998). These circulations and atmospheric conditions
are major determinates of the low-level field, particularly during the night and winter as they
control to a larger extent, the transport and dispersion of low-level emissions of pollutants.
Atmospheric stability is a key factor for plume behavior and dispersion characteristics.
Various plume types are shown as a function of atmospheric stability in figure 2.2. Looping
plumes in unstable air and fumigating plumes when the air is stable above the emission point
produce the highest ground-level concentrations of pollutants. Coning and fanning plumes
tend to carry pollutants greater distances from the source in a relatively undiluted form, while
lofting plumes disperse emissions released above surface inversions both vertically and
horizontally (Held et al., 1996).

17
Figure 2.2 The effect of lapse rate on plume type DALR signifies the dry adiabatic lapse
rate (dashed line) and ELR the environmental lapse rate (solid line): after
Pretorius et al (1986)
Transport mechanism over the Highveld region
The Highveld lies on a plateau some 1600 m above sea level. The regional scale
topography slopes gradually downwards towards the west and south. To the east lies the
escarpment of the Drakensberg. The southern area of the Highveld is dominated by the Vaal

18
Basin some 1400 m above sea level, which tends to drain cold air from the surrounding high-
lying platea of the Gauteng region (Held et al,. 1996).
Boundary layer characteristics of the Mpumalanga Highveld
Over the Mpumalanga Highveld, mean daytime surface winds over much of the region
show a predominance of north to north-westerly winds, with easterly winds being the next
most frequent. However during winter the frequency of south-westerly winds increase as a
result of increased cyclonic occurrences associated with the passage of westerly weather
disturbances. During the night a greater incidence of north-easterly winds occur than north-
westerly winds. However substantial increases of light topographically induced winds occur
from the east and south-easterly sectors during the night. Annual surface wind speeds vary
between 2 and 4 m.s-1 with maximum velocities of 6 m.s-1 occurring during late winter and
autumn (August and September) as discussed by (Pretorius et al., (1986) and Tyson et al.,
(1988).
Boundary layer winds
The winter season in the Highveld region is dominated by the presence of anticyclonic
circulation, mostly sustained by the expansion of the south Indian Ocean anticyclone over the
relatively colder interior of Mpumalanga. The “winter mode” 800 hPa wind circulation (about
350m AGL) clearly indicates that the boundary layer winds are dominated by the Indian
Ocean anticyclone which extends inland to the Northern Province (Tosen and Jury, 1986).
Due to the northward migration of the anticyclonic pressure belts in winter, Mpumalanga is
dominated by westerly and west-north-westerly winds. However, in summer, due to the
southward migration of these pressure belts, the circulation is characterized by the presence of
northerly-component winds over the highveld region (Tosen and Jury, 1988). The winds veer
progressively towards north-north-east with the approach of February and thereafter tend to
back at the onset of autumn to westerly (figure 2.3)

19
Figure 2.3 Seasonal variation of the mean 800 hPa winds and contours. The 800 hPa
surface occurs at around 1950m, i.e. about 350 m above the surface over the
industrial highveld region (shaded): after Tosen and Jury (1986).
Dust erosion and subsequent transport
Dust mobilization occurs only for winds velocities higher than a threshold value, and
is not linearly dependent of the wind fraction velocity. The threshold friction velocity, defined
as the minimum friction velocity required to initiate particle motion, is dependent on the size
of the erodible particles and the effect of the wind shear stress on the surface. The threshold
friction velocity decreases with a decrease in the particle diameter, for particles with diameter
>60 µm. Particles with a diameter <60 µm result in increasingly high threshold friction
velocities, due to the increasingly strong cohesion forces linking such particles to each other.
Following the exceedance of the necessary threshold friction velocity, the movement of a

20
particle is dependent on the relationship between the weight of the particle acting downward,
and the opposite aerodynamic drag on the particle. The particles (<60 µm) are small enough
to be transported upward by turbulent eddies. Particles in the range 60 to 2000 µm can be
lifted from the surface at a height of some tenths of cm, but the aerodynamic drag is seldom
sufficient to exceed the weight, and the particles are carried back to the surface. Such
trajectories define a motion called saltation. The maximum height of the saltation layer is
generally in the order of 1 m. Particles which are too large or too heavy to be lifted from the
surface (>2000 µm) role and creep along the surface in a motion called creeping figure 2.4.
Figure 2.4 Modes of particle transported by wind: after Pye (1987)
Figure 2.5 shows deposition of dust in the lee of topography obstacles due to flow divergence. Dust deposition is prevented on windward slopes where flow convergence and speed-up occurs.
Figure 2.5 Deposition of dust in the lee of topographic obstacles: after Pye (1987)

21
Fugitive dust abatement Dust emissions can be controlled by use of preventive and mitigative measures. The
preventive measures are aimed at the reduction of the source extent, or process modification
and adjusting work practices (Cowherd et al., 1998). For example, the extent of the source
may be reduced by reduction in the mass of material being handled, or elimination of track-on
on paved roads, and the paving of unpaved roads. A mitigative measure includes periodic
removal of deposited material. This may involve clean-up of spillage on paved roads (broom
and vacuum sweeping) or clean-up spills, for example, at conveyor transfer points. Higher
priority should be given to preventive measures rather than cleaning up deposited material
(Cowherd et al., 1998).
Dust from surfaces may be removed by wet suppression and air atomization suppression. The
efficiencies of these treatments can be estimated through the relationships between climatic
parameters, material properties and quantities of material transferred (Cowherd et al., 1998).
Examples of wet suppression systems for materials handling purposes includes sprayers on
conveyor belts, spot spraying of stockpile reclaim areas prior to reclaiming and spraying at
transfer points. In the wet suppression process, the emissions are prevented through
agglomerate formation by combining fine particulates with larger aggregate or with liquid
droplets. The coverage of the material by the liquid and the ability of the liquid to wet small
particles are the key factors affecting the extent of agglomeration and the control efficiency of
dust emission (Cowherd et al., 1998).
Liquid Spray suppression utilizes water only or a combination of water and a chemical
surfactant as the wetting agent. Surfactants reduce the surface tension of the water thus
allowing particles to more easily penetrate the water particles and reducing the quantity of
water needed to achieve the control efficiency required. Foam Suppression systems utilizes
foam that is generated by adding a chemical to a relatively small quantity of water and
vigorously mixing to produce small bubble, high energy foam in 100 to 200 µm size range.
The major advantage of foam is that it wets the fines more effectively than untreated water
(EPA, 1990). Air Atomizing Spray system uses water and compressed air to produce micron
sized droplets that are able to suppress respirable dust without adding substantial moisture to
the process. This system is useful when limited water is available or not allowed to be used
(EPA, 1990).

22
Wind sheltering is a dust suppression method that is used at material handling sites. This
involves installation of transfer chutes, to avoid spillage and reduce entrainment during
transfer by sheltering e.g. at belt-to-belt transfer points and stacking points (EPA, 1990).
Dust monitoring Ambient particulate monitoring is attracting considerable attention in today’s
environment as worldwide air quality legislation comes into effect. Dust monitoring is an
important practical activity for pollution control purposes. Monitoring is conducted for both
health and nuisance purposes and the different monitoring methods can be divided into active
systems and passive systems (Colls, 1997). The directly inhaled particle fraction is normally
monitored using active samplers, which fractionate the sample and pull a known volume of
particle-laden air through the filter (Colls, 1997). For nuisance dusts and those concerned with
secondary pathways it is usually either deposition to the ground or the flux of particles past a
point that is of interest (Colls, 1997). Deposit gauges have a horizontal opening and flux
gauges a vertical opening (US-EPA, 1998). Dust deposit and flux gauges, should be used in
combination to assess different aspects of wind-blown dust problems (Hall, 1994). Deposit
gauges gives information on local rates of deposition to the ground, whereas flux gauges
indicate the passage of material past sampling point. Flux gauges can also possess natural
directional properties, which can be used to identify the source direction of wind-blown
material (Hall, 1994). Gauges have to be set well above the ground to avoid collecting locally
wind-raised material.. The end result is a collection performance, which is strongly wind
speed and particle size dependent. The general trend is for collection performance to reduce as
wind speed increases, which is doubly unfortunate as the amount of windblown material also
tends to increase at higher wind speeds, compounding collection problems for deposit gauges
(Hall, 1994).
Other monitoring techniques and methods in use for nuisance dust include: measurement of
airborne dust concentrations using gauges which sample air volumes or by using light
scattering devices that measure attenuation of light (Environmental Agency, 2003); examining
the progressive soiling by dust (Environmental Agency, 2003); and visual monitoring which
is subjective and qualitative (Environmental Agency, 2003).
Active systems are best suited for measuring over minutes, hours and days whereas passive
systems are best suited for measuring over days weeks and months (British Standards
Institute, 1972).

23
Sampling periodic approach
The periods of sampling are determined by the processes and installations producing
dust (US-EPA, 1998). The more variable the emission, the more frequently periodic
monitoring is required. When emissions levels vary so frequently and significantly that
intermittent sampling would be unrepresentative, or would be required too frequently to be
practicable, then sampling should be carried out using a continuous system (US-EPA, 1998).
Averaging period and sampling duration
The duration of sampling must be long enough to allow the results to be expressed as
an average over the specified period. In other cases, the choice of suitable averaging periods is
strongly influenced by the expected short-time variability in emission levels (Environmental
Agency, 2000).
The averaging period determines the monitoring technique to be used. Direct-reading
analyzers (automatic monitors) can provide data with a very fine time resolution. The
averaging time for a manual technique is often constrained by the need for a sampling run of
appropriate duration (often half and hour or more). This is because manual techniques have an
associated analytical end-method stage for which a sufficient mass of pollutants must be
sampled to achieve an adequate lower detection limit (Environmental Agency, 2000).
Type of dust samplers
Passive samplers
Passive systems focus on the soiling aspect of dust with the monitoring periods of
days, weeks and months (Colls, 1997). Deposited dust is collected and measured to assess
potential soiling effects. Passive sampling does not involve active movement of air through
the sampler. Passive samplers have the advantage of giving good overall picture of average
pollutant concentrations. They normally give long averaging periods (typically 1-4 weeks).
Neither electricity nor calibration is required for its operation. They have low operational
costs thus facilitating the installation of several samplers in non-secure areas to enhance the
potential for data collection (US-EPA, 1998). The samplers must be situated in a generally
open area, which allows free circulation of air. Examples of passive samplers include single
and double bucket fallout monitors (US-EPA, 1998). Passive samplers are further divided into
non-directional and directional monitors.

24
Non-directional monitors
Non-directional methods provide nuisance monitoring using either dustfall or surface
soiling. Deposit gauges are designed to collect material deposited over a given monitoring
period, typically 1 week to one month and are based on the principle that course particulates
suspended in the air will precipitate out either under the influence of gravity (dry deposition)
or in contact with water droplets (wet deposition) (Environmental Agency, 2003)
Single Bucket dust fallout monitor
Single bucket monitors are deployed following the American Society for Testing and
Materials standard test method for collection and analysis of dustfall (US-EPA, 1998). This
method employs a simple device consisting of a cylindrical container half-filled with de-
ionized water exposed for one calendar month (~30 days) (US-EPA, 1998). The cylindrical
container is supported by a metal stand upward, 1.2 m above the ground. The dust falls into
the bucket vertically, as either dry deposition or wet deposition. The water is treated with an
organic biocide to prevent algae growth in the buckets. The buckets are also covered with net
and a ring that is raised above the rim, to prevent contamination from birds perching. Once
returned to the laboratory, the water is filtered, and the residue is dried before the insoluble
dust is weighed (US-EPA, 1998). It measures ambient deposition falling vertically, either as
dry deposition or wet deposition. The other types of deposit gauges are described in Table 2.2
(Environment Agency, 2003).
Table 2.2: Description of different standard deposit gauges
Standard Shape Diameter Depth Extra
UK BSI, 1969 Funnel 300mm 200mm
German (VDI, 1990) Glass jar 100mm 200mm
US (ASTM, 1990) Cylindrical 150mm 300mm Surrounded by a
wind deflector at
angle 450
Irish Plastic funnel 200 & 250mm
ISO 1991 Cylindrical 200m 400mm
Norwegian NILU Cylindrical 200mm 400mm

25
Frisbee gauge
The gauge consists of an Inverted Frisbee mounted horizontally on a pole 1.75m
above the ground figure. The shape has superior collecting efficiency and aerodynamic
characteristics that make it suitable for short-term sampling periods of about a week
(Environment Agency, 2003). The matter deposited on the collection surface and the
insoluble matter in the collection bottle is removed and separated by gentle vacuum filtration.
The insoluble matter is dried and determined gravitationally. The results are expressed in
mg/m2/day. The gauge requires additional guard to reduce bird-strike, and a polyester foam
insert to improve collection efficiency and reduce contamination by leaves (Environmental
Agency, 2003)
Figure 2.6 Photograph of Frisbee depositional dust gauge. After Goodquarry (2004)
Twin bucket wind direction sampler
Twin bucket wind direction samplers consists of two collection containers half filled
with treated water, mounted 2.5 m above ground level (Kuhn, 2003) . A moveable lid is
positioned over the containers; the lid alternating between containers depending on the wind
direction recorded by an attached wind sensor. The exposure time of each container is
recorded electronically. Following exposure, samples are subject to gravimetric analysis as in
the case of single bucket samples. Since the twin bucket wind directional sampler is able to
monitor dust deposition by direction, they are useful in identifying source contributions in
instances where multiple sources occur (Kuhn and Loans, 2003).

26
Glass slides
A clean microscope slide is exposed for, typically, one week (Environmental Agency,
2003). The slide is positioned horizontally on a surface between 1m and 2m above the
ground. The dustiness of the exposed slide is quantified by measuring the reduction in
specular reflectance relative to a clean unexposed slide (Environmental Agency, 2003). A
measurement in Soiling Units (SU) is obtained by subtracting the reflectance value from 100.
The soiling level can be related to perceived annoyance.
Directional monitors
Directional gauges collect dust in air moving in a given direction (British Standards
Institution, 1972). The following is a description of different types of directional gauges.
BS 1747 Part 5 or CERL-type directional gauge
This type of sampler consists of four slotted sampling tubes set at right angles to each
other (Environment Agency, 2003), figure 2.7. It is positioned with either each tube lined up
with the four ordinate points of the campus, or one slot towards the pollution source.
Sampling periods of about 10 days to 1 month are usual and long sampling programs of about
one year are necessary. An aqueous suspension of the dust is placed in a water-filled glass
cell, and dust loading is estimated by the amount of obscuration of a beam of light passing
through the cell. Alternatively, the insoluble deposit material is filtered, dried and determined
gravitationally. Results are then expressed in units of mg/m2/day for each direction. The
method has limited efficiency in dust collection (Environment Agency, 2003)
Figure 2.7 Photograph of directional dust gauge After Goodquarry (2004)

27
Directional frisbee gauge
The gauge is similar to standard Frisbee gauge but differs in that the collection surface
is exposed only when the associated meteorological equipment indicates that wind is from a
defined direction arc. The matter deposited on the collection surface and the insoluble matter
in the collection bottle is removed and separated by gentle vacuum filtration. The insoluble
matter is dried and determined gravimetrically. The results are expressed as mg/m2/day. The
gauge requires additional equipment and/or a power supply (Environmental Agency, 2003).
Directional sticky pads (DustScan)
The gauge consists of a purpose made adhesive slide mounted on a collection cylinder
on a post 2m above the ground (Environmental Agency, 2003), figure 2.8. The gauge is
normally exposed for 1-2 weeks. Dust in flux is captured for subsequent analysis using
computer-based tools. The software is able to account for foreign objects such as insects.
Unlike other methodologies this technique is capable of collecting and assessing dust from
multiple sources (of various colors) and from any direction. Reporting of results may be as
loss of reflectance through soiling (Effective Area Coverage, or EAC%) (Beaman et al, 1981),
or as Absolute Area Coverage (AAC%) (Joint Nature Conservation Committee, 1993), the
density of coverage of dust as presence or absence, irrespective of color. A combination of
both AAC and EAC is used to assess the quality of dust present and define whether the levels
are a nuisance or not (Beaman et al., 1984)
Figure 2.8 Photograph showing sticky pad cylinder and slide on DustScan unit. After
Goodquarry (2004)
Active samplers
Active samplers collect pollutant samples, either by physical or chemical means, for
subsequent analysis in a laboratory (US-EPA, 1998). A known volume of air is pumped
through a collector (filter or chemical solution) for a known period of time, the collector is

28
then removed for analysis (Colls, 1997). The samplers require power supply and are labor
intensive. Example of this type of sampler includes Black Smoke and Sulfur Dioxide
Monitoring by Bubbler, High-volume Sampling, Active Particulate Sampling by PM10
Sampler and Tapered Element Oscillating Microbalance (TEOM) (ISO, 1970).
Hi-volume sampling
The sampler consist of a collecting glass fiber filter located upstream of a heavy-duty
vacuum cleaner type motor which is operated at a high airflow rate (1.13-1.7 m3/min) (US-
EPA, 1998). The sampler is mounted in a shelter with the filter parallel to the ground. The
covered housing protects the glass fiber from wind and debris and from the direct impact of
precipitation. The sampler collects particles efficiently in the size range 0.3 to 100 µm. The
sampler is normally operated on a 6-day sampling schedule, with a 24- hour sample collected
every sixth day (US-EPA, 1998). The sampler employs the principle of gravitational settling
for dust collection. The mass of Total Suspended Particles (TSP) collected is expressed in
µg/m3 for 24-hour period.
Active particulate sampling (e.g. PM10 Sampler)
The collection of particles in this sampler is through filtration. The air is drawn
through a section of filter paper for a specified time. At the end of the exposure period the roll
of filter paper is wound on and a clean section exposed. Area of sample is removed and
weighed in the laboratory. The excess mass is attributed to collected particles. The type of
filter used is dependent on the type of analysis to be conducted, e.g. Teflon filter is used for
inorganic element analysis by x-ray fluorescence (ISO, 1970), and quartz/NaCl impregnated
filter for analysis of organic and soluble chemical species.
Tapered element oscillating microbalance (TEOM)
TEOM operates by continuously measuring the weight of particles deposited onto a
filter (US-EPA, 1998), figure 2.9. The filter is attached to a hollow tapered element which
vibrates at its natural frequency of oscillation. As particles progressively collect on the filter,
the frequency changes by an amount proportional to the mass deposited. As the airflow
through the system is regulated, it is possible to determine the concentration of PM10 in the
air. The filter requires changing periodically, typically every 2 to 4 weeks, and the instrument
is cleaned whenever the filter is changed (US-EPA, 1998). Different inlet arrangements are
used to configure the instrument and can monitor PM10, PM2.5, PM1 and TSP continuously.

29
Data averages and update an interval includes: 5-minute total mass average (every 2 seconds),
10-minute rolling averages (every 2 seconds), 1-hour averages, 8-hour averages, and 24-hour
averages (US-EPA, 1998).
Figure 2.9 Schematic diagram of Tapered Element Oscilating Microbalance (TEOM)
Ambient air quality guidelines and standards
International ambient air quality guidelines and standards
Air quality guidelines and standards are fundamental to effective air quality
management, providing the link between the source of atmospheric emissions and the user of
that air at the downstream receptor site (WHO, 2000). The ambient air quality guideline
values indicate safe daily exposure levels for the population, including the very young and the
elderly, throughout an individual’s lifetime. Air quality guidelines and standards are normally
given for specific averaging period. These averaging periods refer to the time-span over
which the air concentration of the pollutant was monitored at a location (WHO, 2000).

30
Generally five averaging periods are applicable, namely an instantaneous peak, 1-hour
average, 24-hour average, 1-month average and annual average. Guidelines for particulates
are normally given for maximum daily and annual averaging periods. The United States
Environmental Protection Agency (US-EPA) has set standards for both PM10 (Table 2.3) and
PM2.5 size fractions. Reference is also made to UK Air Quality Strategy and other regional
and national Air Quality Standards and guidelines shown in Table 2.4 (US-EPA, 2000).
Table 2.3: Air quality guidelines and standards for respirable particulates (PM10)
Averaging
period
µg/m3
South African
(SANS 1929:2005)
mg/m3
World Health
Organization
mg/m3
US-EPA
µg/m3
European
Union
µg/m3
Annual average 40 60-90 50 80
Max 24-hour
average
75 150-230 150 130
250
Table 2.4: Nuisance dust mass deposition measurements (US-EPA, 2000)
Authority Pollutant Concentration
measurement
Measured as Relevance
UK dust deposit
rate
All particulates 200mg/m2/day Annual mean Serious nuisance
West Australia
Nuisance
Standard
All particulates 133mg/m2/day
333mg/m2/day
Monthly mean First loss of
amenity
Unacceptable
reduction in air
quality
West Germany
Nuisance
Standard
All particulates 350mg/m2/day
650mg/m2/day
Monthly mean Possible
nuisance
Very likely
nuisance
Malaysia Air
Quality Standard
All particulates 133mg/m2/day Nuisance dust
deposit
Israel Air Quality
Standard
All particulate 2*105
kg/km2/month
Nuisance deposit

31
The EU standards have been determined through consultations with due regard to
environmental conditions, the economic and social development of various regions and the
importance of a phased approach to attaining compliance. The ambient air quality standards
of the US-EPA are based on clinical, toxicological and epidemiological evidence. The
standards of the US-EPA also reflect the technological feasibility of attainment (US-EPA,
2000).
The US-EPA standard for PM2.5 (particles <2µm is given as
Maximum 24-hour average 65µg/m3
Annual average 15µg/m3
The exceedance of maximum daily average limit by the three year average 98th percentile of
24-hour concentrations would constitute a violation of this standard. The PM2.5 three-year
annual average needs to be less than the 15 µg/m3 limit in order to demonstrate compliance
with the annual standard (WHO, 2000).
South African ambient air quality quidelines and standards
The South African National Standards (SANS) 1929:2005, Edition 1.1 describes the
proposed guideline criteria for dust deposition.
A four-band scale is used to set target, action and alert threshold concentrations for dust
depositions, in addition to permissible margins of tolerance and exceptions. The four four-
band deposition criteria, extracted from SANS 1929:2005 (Edition 1.1) are shown in Table
2.5. The target, action and alert threshold are shown in Table 2.6.

32
Table 2.5: Four-band scale evaluation criteria for dust deposition (SANS 1929:2005).
1 2 3 4
Band
Number
Band
description
label
Dust fall rate (D)
(mg/m2/day)
Comment
1 Residential D<600 Permissible for residential and light
commercial
2 Industrial 600<D<1 200 Permissible for heavy commercial and
industrial
3
Action
1 200<D<2 400
Requires investigation and remediation if 2
sequential months lie in this band, or more
than 3 occur in a year
4
Alert
2 400<D
Immediate action and remediation required
following the 1st incidence of dust fall rate
being exceeded. Incident report to be
submitted to relevant authority
Table 2.6 Dust standards, target, action and alert thresholds for dust deposition
(SANS 1929:2005)
Level Dustfall Rate
(mg/m2/day) Permitted Frequency of Exceedances
Target 300
Action residential 600 Three within any year, no two sequential months.
Action industrial 1 200 Three within any year not sequential months.
Alert threshold 2 400 None. First exceedance requires remediation and
compulsory report to authorities.
For heavy commercial and industrial regions, the guidelines state that monthly average dust
deposition rates below 1 200mg/m2/day “are permissible”. Areas recording monthly average
dust deposition concentrations between 1 200 mg/m2/day and 2 400 mg/m2/day “require
further investigation and remediation” Areas recording monthly average dust deposition
concentrations that exceed 2 400 mg/m2/day will “require immediate action and remediation
and an incident report to be issued to the relevant authority”.
The largest proportion of dust particles generated from surface mining activities is greater
than 30 µm and these will normally deposit within 100m of the source. This does not include

33
the dust emitted from kiln stacks and other heated processes as the dust emitted from these
processes can contain a large proportion of particles less than 10 µm. The heat and exit
velocity from stacks makes the dust more likely to travel further from the source. The smaller
the particles the further they can potentially travel.

34
CHAPTER THREE
OVERVIEW
This chapter discusses the methodology adopted for the study. The description of the design and principles of operation of the MWDFG and MWAC samplers are given. Details of the sample preparation method and laboratory analysis used to obtain dust data are also explained. Finally microscopy and particle size analysis of dust samples are described.
Methodology
Study site
Dust samples were collected with four samplers Modified Wedge Dust Flux Gauge
(MWDFG, Modified Wilson and Cooke normal sized inlet (MWAC N), Modified Wilson and
Cooke double sized inlet (MWAC D), and the Single Bucket located at Landau Colliery
Schoongezichy Mini – pit, site RAMP 6, over a three month sampling period (March to May
2008). The samplers were located 1.5 meters away from each other, and two meters above the
ground. Landau Colliery is located in Mpumalanga province in the Witbank region.
Mpumalanga province is situated in the eastern part of South Africa: it is a summer rainfall
region with precipitation occurring mainly in the form of thunderstorms. The mean annual
rainfall varies from 350 mm in the north east to 1600 mm on the escarpment. The region’s
proximity to the tropic of Capricorn and warm Mozambique current of the Indian Ocean
results in a subtropical, frost-free climate in the low lying areas of the lowveld (Schulze,
1972).
Description of flux gauges The modified Wedge dust flux gauge and Modified Wilson and Cooke are flux gauges
and were used in conjunction throughout this study to determine the most efficient sampler in
collecting dust amongst the two against the bucket gauge. Two versions of Modified Wilson
and Cooke were used in this study – the normal sized inlet and outlet and the double sized
inlet and outlet. Detailed descriptions of the designs of MWDFG and MWAC are presented in
the next sections.

35
Modified wedge dust flux gauge (MWDFG)
The modified Wedge Dust Flux gauge is based on an original design developed by
Hall et al.. (1994). A picture and technical scheme of the original Wedge Dust Flux Gauge
(WDFG) is shown in figure 3.1. The dimensions shown in figure 3.1 refer to half scale
version. The WDFG is commercially available in normal and half dimensions. The WDFG
consists of a simple, parallel-sided box, wedge shaped in elevation and with extended sides
towards the rear holding a baffle plate. The flat, horizontal bottom of the box is 18 cm long
and 10 cm wide. The top slopes upwards at an angle of 24.5 degrees. Sediment-laden air
enters the instrument via a 1.9 x 10.0 cm rectangle slot. The box contains a particle trap made
from 10 pores per inch foam, which is normally sprayed with a thin sticky coating to retain
any impacting particles. The layer of the foam is 3 cm deep and is set with its rear face 2 cm
from the back face of the box. The WDFG does not respond to changing wind directions.
During operation the WDFG is fixed towards the predominant wind direction. The top is a
sliding plate for easy access to the foam and the settled dust. Recovery of settled dust without
disturbing the original installation position of the sampler is challenging.

36
Figure 3.1: (a) Photograph and (b) construction scheme of Wedge Dust Flux Gauge
The Modified Wedge Dust Flux Gauge (MWDFG) is a simple parallel-sided box, wedge-
shaped in elevation and with extended sides mounted on a pole through a bearing at the
bottom of the instrument (see figure 3.4). The approved drawings of the MWDFG produced
by the author is shown in APPENDIX B. The sides of the box extend rearwards by 100 mm to
carry the vertical baffle plate, which is of 75 mm depth with its bottom edge set 45 mm above
the bottom of the box. The MWDFG contains a dust deposit tray shown in figure 3.2, which is
slotted into the gauge through the back by lifting the backflow preventer.
(a)
(b)

37
Figure 3.2: Construction scheme of the (a) Modified Wedge Dust Flux Gauge (MWDFG)
(b) Dust deposit tray The horizontal bottom of the dust deposit tray is 180 mm long and 100 mm wide. The top
slopes upwards at an angle of 24.5o. The air entry is a slot of 19 mm height over the whole
width at the front of the box and the exit a slot of 80 mm height (also over the whole width of
the dust deposit tray) set at the top of the flat vertical face which forms the rear of the dust
deposit tray. The dust deposit tray contains a particle trap made from 10 pores per inch open-
(a)
(b)
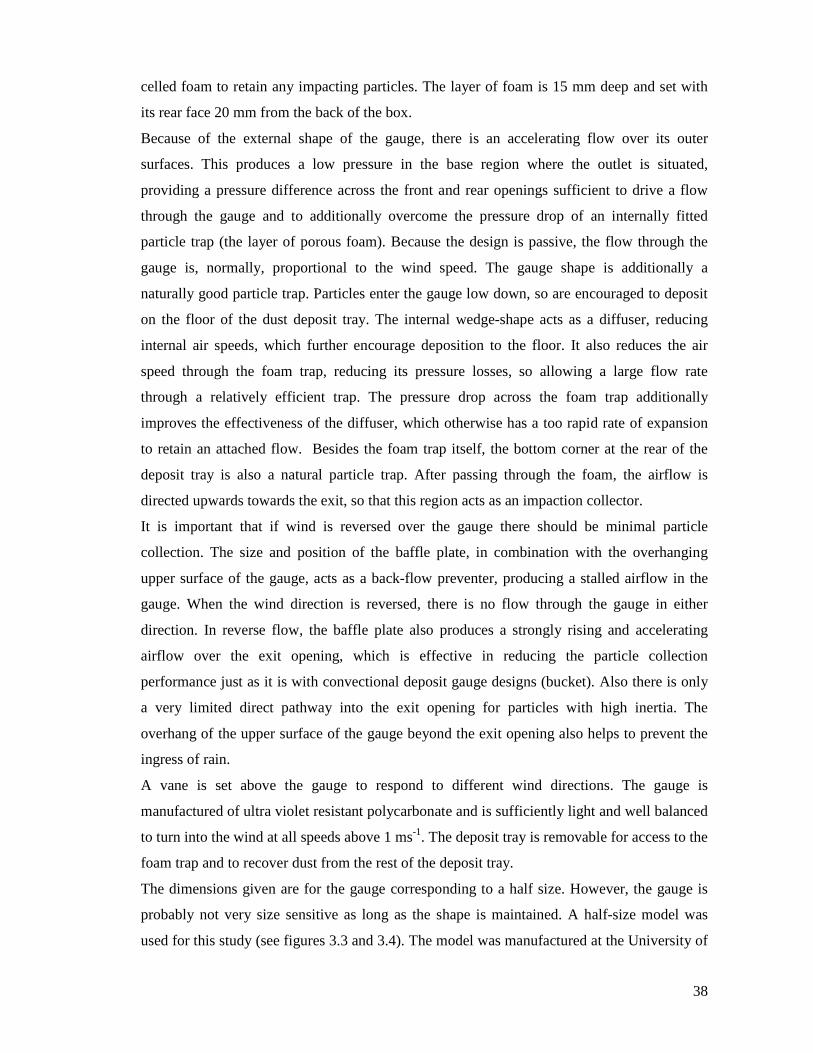
38
celled foam to retain any impacting particles. The layer of foam is 15 mm deep and set with
its rear face 20 mm from the back of the box.
Because of the external shape of the gauge, there is an accelerating flow over its outer
surfaces. This produces a low pressure in the base region where the outlet is situated,
providing a pressure difference across the front and rear openings sufficient to drive a flow
through the gauge and to additionally overcome the pressure drop of an internally fitted
particle trap (the layer of porous foam). Because the design is passive, the flow through the
gauge is, normally, proportional to the wind speed. The gauge shape is additionally a
naturally good particle trap. Particles enter the gauge low down, so are encouraged to deposit
on the floor of the dust deposit tray. The internal wedge-shape acts as a diffuser, reducing
internal air speeds, which further encourage deposition to the floor. It also reduces the air
speed through the foam trap, reducing its pressure losses, so allowing a large flow rate
through a relatively efficient trap. The pressure drop across the foam trap additionally
improves the effectiveness of the diffuser, which otherwise has a too rapid rate of expansion
to retain an attached flow. Besides the foam trap itself, the bottom corner at the rear of the
deposit tray is also a natural particle trap. After passing through the foam, the airflow is
directed upwards towards the exit, so that this region acts as an impaction collector.
It is important that if wind is reversed over the gauge there should be minimal particle
collection. The size and position of the baffle plate, in combination with the overhanging
upper surface of the gauge, acts as a back-flow preventer, producing a stalled airflow in the
gauge. When the wind direction is reversed, there is no flow through the gauge in either
direction. In reverse flow, the baffle plate also produces a strongly rising and accelerating
airflow over the exit opening, which is effective in reducing the particle collection
performance just as it is with convectional deposit gauge designs (bucket). Also there is only
a very limited direct pathway into the exit opening for particles with high inertia. The
overhang of the upper surface of the gauge beyond the exit opening also helps to prevent the
ingress of rain.
A vane is set above the gauge to respond to different wind directions. The gauge is
manufactured of ultra violet resistant polycarbonate and is sufficiently light and well balanced
to turn into the wind at all speeds above 1 ms-1. The deposit tray is removable for access to the
foam trap and to recover dust from the rest of the deposit tray.
The dimensions given are for the gauge corresponding to a half size. However, the gauge is
probably not very size sensitive as long as the shape is maintained. A half-size model was
used for this study (see figures 3.3 and 3.4). The model was manufactured at the University of

39
the Witwatersrand Physics Workshop with the assistance of the Physics Technicians. The
drawing of the redesigned wedge sampler (APPENDIX B) with templates for each side
together with a model made of cardboard were produced by the author and given to the wits
Physics Technicians to study. The author monitored and supervised the entire workshop
construction of the test device. A dry untreated particle trap made from 10 pores per inch
open-celled foam, which was used in this study.
Figure 3.3: Modified WDFG Sampler and the Single Bucket at Schoongezincht Mini pit
Site RAMP 6

40
Figure 3.4: Modified WDFG, MWAC N, MWAC D and the Single Bucket Schoongezincht Mini-pit site RAMP 6
Modified Wilson and Cooke sampler (MWAC) Samplers
The modified Wilson and Cooke (MWAC) sampler is based on an original design
developed by S.J. Wilson and R.U. Cooke in 1980 (Hall et al., 1994). The sampler consists of
a plastic bottle, figuring as settling chamber, to which an inlet tube and an outlet tube have
been added (Figure 3.5). The bottle is installed vertically, with the inlet oriented to the wind.
Sediment entering the bottle will be deposited due to the pressure drop created by the
difference in diameter between the bottle and the inlet and outlet tubes. The clean air then
discharges from the bottle via the outlet. The original concept was later slightly modified by
Kuntze et al., (1990), who attached the bottle in a horizontal (not vertical) position to a mast
provided with a wind vane. Attaching several bottles at different levels to the mast, vertical
flux profiles can be measured (Sterk, 1993). The inlet and outlet tubes were made of glass
1.25 mm thick, with an inner diameter of 7.5 mm for MWAC N and 15mm for MWAC D.
The samplers were made at the University of Witwatersrand, Glassblowing unit in the School
of Chemistry under the supervision of the author.

41
Figure 3.5: Construction Scheme of the MWAC
Single Bucket
Single bucket fallout monitors are deployed following the American Society for
Testing and Materials standard method for collection and analysis of dustfall (ASTM D1739)
(Egami et al., 1989). This method employs a simple device consisting of a cylindrical
container half-filled with de-ionised water exposed for one calendar month (see figure 3.6).
The water is treated with an inorganic biocide (copper sulphate) to prevent algal growth in the
bucket. The bucket stand comprises a ring that is raised above the rim of the bucket to prevent
contamination from perching birds. Once returned to the laboratory, the contents of the bucket
is filtered and the residue dried before the insoluble dust is weighed. The dustfall rates
recorded by the existing single bucket installed at Landau site RAMP 6 by Annegarn
Environmental Research (Pty) Ltd were used in this study.

42
Figure 3.6: Single Bucket monitoring unit, showing sampling bucket with bird ring and
Security clamp
Sample preparation method and laboratory analysis
Dust samples were collected by having open buckets, Modified Wedge Dust Flux
gauge (MWDFG) and the Modified Wilson and Cooke N (MWAC N) and Modified Wilson
and Cooke D (MWAC D) samplers exposed to the atmosphere for 30 days. MWAC D is
double the size of inlet and outlet of MWAC N. The sampling period extended over three
months. The particulate in the atmosphere fell passively into the samplers and was then
weighed to report the results as milligrams per square meter per day (mg/m2/day). Water was
maintained in the bucket for the duration of the measurement period to prevent re-entrainment
of the dust already collected. Dust results were collected every 30 days within the three
months sampling period.
The detailed method used for collecting dust from each sampler is provided in APPENDIX A
with a brief description of the method outlined below.
43
Single bucket – Sample preparation
The bucket was prepared by charging them with de-ionised water, taking into account
the expected evaporation that was likely to occur. A small amount of copper sulphate was
added to the bucket to prevent algae growth. The buckets were then transported to site and put
into the holder of the monitor and left in position for 30 days. After 30 days the bucket was
collected and replaced with another bucket. This ensured a continuous monitoring. 47mm
filters were pre-weighed in the laboratory. The contents of the bucket were filtered through
the pre-weighed filter using a Buchner Funnel. Care was taken to ensure that no dust was left
in the buckets. Once the solid contents of the bucket were collected on the filter, it was dried
in the oven. When the filter was dry, it was weighed and the mass was recorded with the
initial mass of the filter. The initial and final mass of the filter paper was then processed using
a spreadsheet to yield a result in mg/m2/day for each bucket. The height of the polypropylene
bucket was 237.0 mm and the inside diameter of the lip was 179.8 mm.
Quality Control
Indeterminate errors are present in most experimental measurements and the potential sources
of indeterminate errors for single bucket dust monitoring process as identified by AER are
shown in table 3.1.

44
Table 3.1: Indeterminate errors for single bucket monitoring process
Positive errors Negative errors
During bucket preparation error would occur
if too much copper sulphate was added to the
water then the excess copper sulphate would
come out of solution and form a solid
material that would be collected on the filter.
During emptying of bucket error would occur
when the water and dust was put unto the
Buchner funnel to be filtered. Any dust that
remained in the bucket was not measured.
During bucket cleaning error would occur if
residual dust was left in bucket between times
that it was used.
During changing of buckets error would
occur if old bucket water was spilt
accidentally.
During changing of buckets error would
occur if dust was allowed to enter either the
old or new bucket.
During the filtering process error would occur
if spillages from the buckets would result in
loss of sample.
If algae grew in bucket either because too
little copper sulphate was put into the bucket
or because unusual weather conditions, such
as excessive rain that diluted the copper
suphate to a point where it was not able to
prevent the formation of algae an error would
occur.
During the filtering process error would occur
if the sieves used to keep insects from being
added to the dust samples were damaged or
bigger than 1mm may allow insects to be
added to the mass of the dust collected. If
some of the dust adheres to insect and the
insect is removed.
During the filtering process error would occur
if the sieves used to keep insects from being
added to the dust samples were damaged or
bigger than 1mm may allow insects to be
added to the mass of the dust collected.
The following procedure was used to limit the error in the dust monitoring results:
The buckets were prepared indoors to prevent dust landing in buckets while open. The lids
were put onto the buckets as soon as they had been prepared. The lids remained on the
buckets from when they were prepared until they were ready to be put on the stand. The
buckets were kept upright during transportation. Care was taken not to kick dust into the

45
buckets or to have open buckets while replacing the old bucket. Buckets were kept closed
until they were ready to be processed in the laboratory. The lids were kept loosely on the
buckets while they waited in the queue to be processed. The washout water used to wash the
buckets out on to the Buchner funnel was also taken from the filtered source. The inside walls
of the buckets were cleaned using spatula and a squirt bottle. Rubber gloves were worn to
limit the skin contact with the slightly acidic water in the buckets. After buckets were used in
the field and the contents filtered, they were cleaned with soap and water and left to drip-dry
before being prepared to go into field again.
Modified wedge dust flux gauge – sample preparation
MWDFG with a dust deposition tray was transported to the site. The dust deposition
tray contained was fitted with pre-weighed dry foam. During transportation, the dust deposit
tray was placed in a clean closed dry bucket to prevent dust contamination. The sampler was
then put into a stand and left in position for 30 days. After 30 days the dust deposit tray was
collected and replaced with another tray containing pre-weighed foam. Once in the laboratory
the foam was weighed and the mass was recorded with the initial mass of the foam. The initial
and final mass of the foam was then recorded. 47mm filters were pre-weighed in the
laboratory. The contents of the dust deposit tray after removing the foam were transferred into
a pre-weighed filter with a clean brush. The pre-weighed filter with the dust was weighed and
the mass recorded with the initial mass of the filer. After weighing, the dust in the filter was
kept in a Petri dish. The initial and final mass of the filter paper and the initial and final mass
of the foam were then processed to yield a result in mg/m2/day for the MWDFG.
Modified Wilson and Cooke samplers – sample preparation
The samplers were prepared by screwing the plastic container into the inlet and outlet
tube holder. The samplers were then transferred to site and put into the stand facing east and
left in position for 30 days. After 30 days the plastic container was collected and replaced
with another plastic container. This ensured a continuous monitoring. Once in the laboratory
the dust sample collected from the dry plastic container was immediately transferred to pre-
weighed filter in a Petri dish. The contents of the pre-weighed filter were weighed and the
mass was recorded with the initial mass of the filter. The initial and final mass of the filter
paper was then processed using a spreadsheet to yield a result in mg m-2 d-1 for each bucket.

46
Microscopic analyses Microscopic analysis was used to identify major components and the morphology of
particles in each sample. It was important to do morphologic analyses to obtain a general idea
about the composition and the structure of the particles that are produced at a coal mine.
Figure 3.7: Photograph of the Scanning Electron Microscopy used in the study housed at the Wits University in the Biology Department Electron Microscopy unit
The JEOL 840 Scanning Electron Microscope (SEM) used in the study is shown in figure 3.7
located in the School of Animal, Plants and Environmental Sciences, Biology, Department at
the University of the Witwatersrand. Specifications of the Wits Scanning Electron
Microscope are given in Table 3.2.

47
Table 3.2: Specifications of the JEOL 840 SEM
Resolution 3µm at 1kV, 1µm at 20kV
Magnification 20 to 900 000X
Accelerating voltage 200V to 30 kV
Probe Current 4 pA to 10nA
Electron Gun Thermal field emission type
Specimen stage X=75mm, y=75mm, z=25mm
Detectors In-Lens annular secondary Electron Detector
(SED), Biscattered Electron Detector,
(BSED) and Electron Backscatter Diffraction
(EBSD)
EDX Working distance 8.5 mm
Image processing Pixel averaging, Frame integration
continuous averaging
Image resolution 512 x 384 to 3074 x 2304 pixels
Image formation 2D
Working environment (vacuum) 10-5 to 10-4 torr
The scanning electron microscope (SEM) uses a focused beam of high-energy electrons to
generate a variety of signals at the surface of solid specimens. The signals that derive from
electron-sample interaction reveal information about the sample including external
morphology (texture), chemical composition, and crystalline structure and orientation of
materials making up the sample. In most applications, data is collected over a selected area of
the surface of the sample, and a 2-dimensional image is generated that displays spatial
variations in these properties. Areas ranging from approximately 1 cm to 5 microns in width
can be imaged in a scanning mode using conventional SEM techniques (magnification
ranging from 20X to approximately 30,000X, spatial resolution of 50 to 100 nm). The SEM is
also capable of performing analyses of selected point locations on the sample; this approach is
especially useful in qualitatively or semi-quantitatively determining chemical compositions,
crystalline structure, and crystal orientations.

48
Fundamental principles of scanning electron microscopy (SEM)
Accelerated electrons in an SEM carry significant amounts of kinetic energy, and this
energy is dissipated as a variety of signals produced by electron-sample interactions when the
incident electrons are decelerated in the solid sample. These signals include secondary
electrons (that produce SEM images), backscattered electrons (BSE), diffracted backscattered
electrons (ESBD) that are used to determine crystal structures and orientations of minerals),
photons (characteristic X-rays) that are used for elemental analysis and continuum X-rays),
visible light (cathodoluminescence-CL), and heat. Secondary electrons and backscattered
electrons are commonly used for imaging samples: secondary electrons are most valuable for
showing morphology and topography on samples and backscattered electrons are most
valuable for illustrating contrasts in composition in multiphase samples (i.e. for rapid phase
discrimination). X-ray generation is produced by inelastic collisions of the incident electrons
with electrons in discrete ortitals (shells) of atoms in the sample. As the excited electrons
return to lower energy states, they yield X-rays that are of a fixed wavelength (that is related
to the difference in energy levels of electrons in different shells for a given element). Thus,
characteristic X-rays are produced for each element in a mineral that is "excited" by the
electron beam. SEM analysis is considered to be "non-destructive"; that is, X-rays generated
by electron interactions do not lead to volume loss of the sample, so it is possible to analyze
the same materials repeatedly.
Images were acquired by selectively combining output of the backscattered electron detector
(BSED) with an in-lens annular secondary electron detector (SED) using low accelerated
voltages of 15 keV. These voltages allowed detection of particles with low energy, narrow
beam, and minimum degradation of samples.
Particle size analysis Four samples for particle size analysis were selected, one from the bucket, MWDFG,
normal and double size MWAC samplers. M & L Inspectorate in Johannesburg South Africa,
an accredited laboratory, undertook the analysis using a Malvern particle size analyzer. The
size range used was from 0.02 to 2000 micron with 102 measurements at different size
intervals being taken.
The particle size distribution of a powder, or granular material, or particles dispersed in fluid,
is a list of values or mathematical function that defines the relative amounts of particles

49
present, sorted according to size. A representative sample passes through a broadened beam of
laser light which scatters the incident light onto a Fourier lens. This lens focuses the scattered
light onto a detector array and, using an inversion algorithm, a particle size distribution is
inferred from the collected diffracted light data. The method is non-destructive and non-
intrusive. Hence samples can be recovered if they are valuable. The method has high
resolution up to 100 size classes within the range of system can be calculated on the Marlvern
Mastersizer.
Dust data presentation Results from the Single Bucket dust monitoring carried out at Landau Colliery –
Schoongezich Mini-pit for the period January to December 2007 are presented. The dustfall
rates obtained by the MWDFG, Single Bucket, and the MWAC samplers for the March to
May 2008 are also shown in chapter 4. In the analysis of the dust fallout samples the total
gravimetric mass is recorded. Tabular and graphic summaries of the data are given to aid data
interpretation. Dustfall rates recorded during the January to December 2007 and March to
May 2008 periods are also compared to average dustfall rates measured since the start of the
monitoring programme to assess whether changes in such rates have occurred.
Fluctuations in dustfall rates are a function of variations in the meteorological conditions of
the site and/or changes in source characteristics. The meteorological characteristics of the site
impact on the rate of emissions from fugitive sources and govern dispersion and eventual
removal of pollutants from the atmosphere. Fugitive dust emission rates are predominantly a
function of wind speed and intensity and duration of the activity generating the dust (e.g.
traffic volumes, extent of batch drop operations). Evaporation rates and precipitation rates
also influence fugitive emission rates due to their impact on the moisture content of materials
being handled or stored, which influences the cohesion of particles. A review of
meteorological data, including wind speed and precipitation data is undertaken in the current
study in order to assist in the analysis of dustfall rates recorded during the period.

50
CHAPTER FOUR
Dustfall results for Single Bucket during the January to December 2007 are presented. This is followed by a presentation of dustfall rates, particle size analysis and microscopy analysis for each of the MWDFG, Bucket, MWACN and MWAC D for the period March to May 2008
Results and discussions
2007 Annual Average in Dustfall rates for the Single Bucket recorded at Schoongezicht mini-pit
Annual average dustfall rates observed at each of the Landau Colliery Schoongezicht
Mini-pit single bucket sites during the January to December 2007 period are compared to the
long-term average dustfall per station recorded since the start of the monitoring programme in
November 1992 as shown in Figure 4.1.
Figure 4.1: Comparison of annual average dust fall rates recorded at each monitoring station in Schoongezincht Mini pit during January to December 2007 with pre-2007 rates
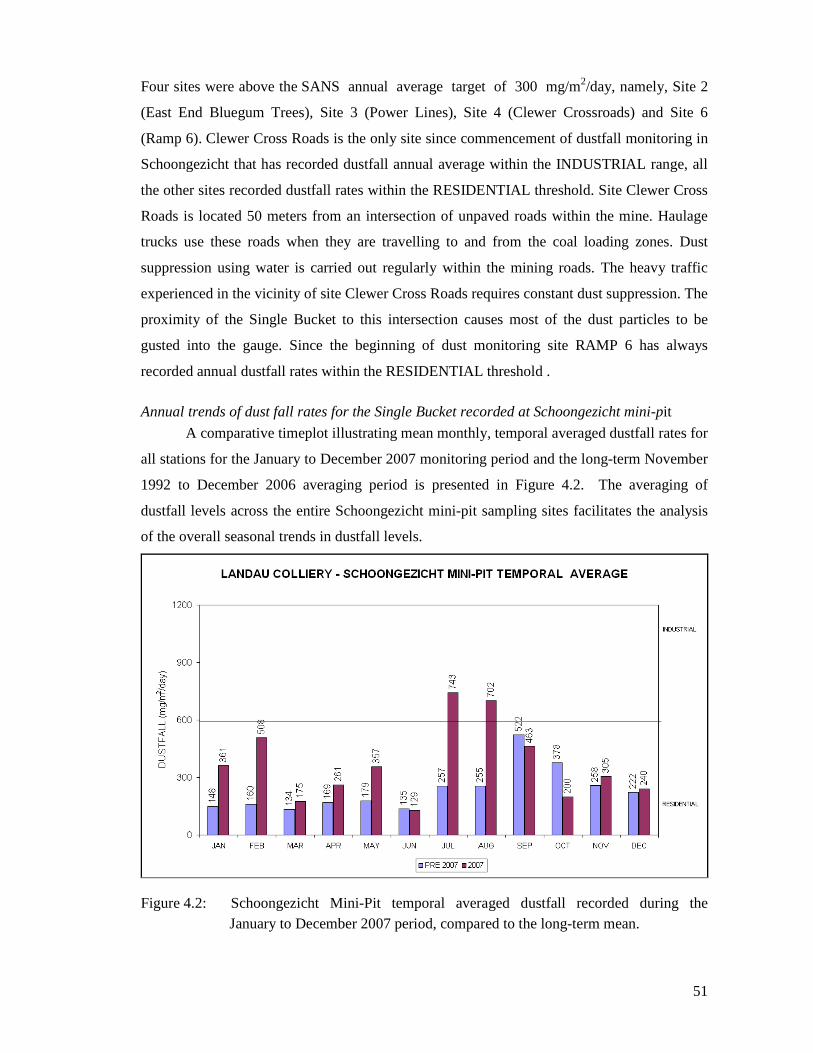
51
Four sites were above the SANS annual average target of 300 mg/m2/day, namely, Site 2
(East End Bluegum Trees), Site 3 (Power Lines), Site 4 (Clewer Crossroads) and Site 6
(Ramp 6). Clewer Cross Roads is the only site since commencement of dustfall monitoring in
Schoongezicht that has recorded dustfall annual average within the INDUSTRIAL range, all
the other sites recorded dustfall rates within the RESIDENTIAL threshold. Site Clewer Cross
Roads is located 50 meters from an intersection of unpaved roads within the mine. Haulage
trucks use these roads when they are travelling to and from the coal loading zones. Dust
suppression using water is carried out regularly within the mining roads. The heavy traffic
experienced in the vicinity of site Clewer Cross Roads requires constant dust suppression. The
proximity of the Single Bucket to this intersection causes most of the dust particles to be
gusted into the gauge. Since the beginning of dust monitoring site RAMP 6 has always
recorded annual dustfall rates within the RESIDENTIAL threshold .
Annual trends of dust fall rates for the Single Bucket recorded at Schoongezicht mini-pit
A comparative timeplot illustrating mean monthly, temporal averaged dustfall rates for
all stations for the January to December 2007 monitoring period and the long-term November
1992 to December 2006 averaging period is presented in Figure 4.2. The averaging of
dustfall levels across the entire Schoongezicht mini-pit sampling sites facilitates the analysis
of the overall seasonal trends in dustfall levels.
Figure 4.2: Schoongezicht Mini-Pit temporal averaged dustfall recorded during the January to December 2007 period, compared to the long-term mean.

52
July and August recorded temporal averaged dustfall rate in the INDUSTRIAL range,
>600 mg/m2/day. The monthly temporal averaged dustfall rates for January, February, July
and August recorded a significant increase compared to previous years results. There was an
increase in dustfall rates recorded in 2007 compared to the previous years because Landau
Colliery expanded its mining operations in 2007. Two additional dust monitoring sites
Mpondozankomo (MPOD) and Schoongezicht (SCOONDW) were a result of the expansion.
The long-term mean shows dustfall rates are generally higher during the dry windy months of
August to November; however in the January to December 2007 reporting period the
temporal averaged dustfall was higher during July to September and January to February
2007.
The dust monitoring programme creates and maintains awareness with regard to dust
generating activities. The information generated from the dust monitoring programme can be
used to indicate the dust generating activities on site and provide indication of continuous
improvement from a dust generating point of view.
The awareness that a simple passive dust monitoring programme generates is very valuable in
another way because the solutions to dust problems are often very simple and sometimes do
not require many resources.
Dustfall rates for the Single Bucket recorded at Schoongezicht mini-pit site RAMP 6 over January to December 2007 sampling period
The site was commissioned in September 2006, July recorded ACTION dustfall rates
with 1282 mg/m2/day (figure 4.3). February, August and September recorded INDUSTRIAL
dustfall rates with 639 mg/m2/day, 886 mg/m2/day and 643 mg/m2/day, repectively. The
remaining monitoring months recorded RESIDENTIAL dustfall rates. October recorded no
data as the monitoring equipment was moved to a different location a few meters away.
August recorded a significant increase in dustfall rates compared to the 2006 dustfall rates.
September and December recorded a significant decrease in dustfall rates compared to 2006
dustfall rates. In July site RAMP 6 recorded dustfall rates that were within the ACTION
threshold and August to September recorded dusfall levels that were within the
INDUSTRIAL threshold. The main reasons for high dust levels dring the months of July to
September 2007 was that the new mining expansions that took place at Landau Colliery in
2007 are closer to site RAMP 6 and the months of July to November are dry windy months
and as results more dust was generated and gusted into the Single Bucket.
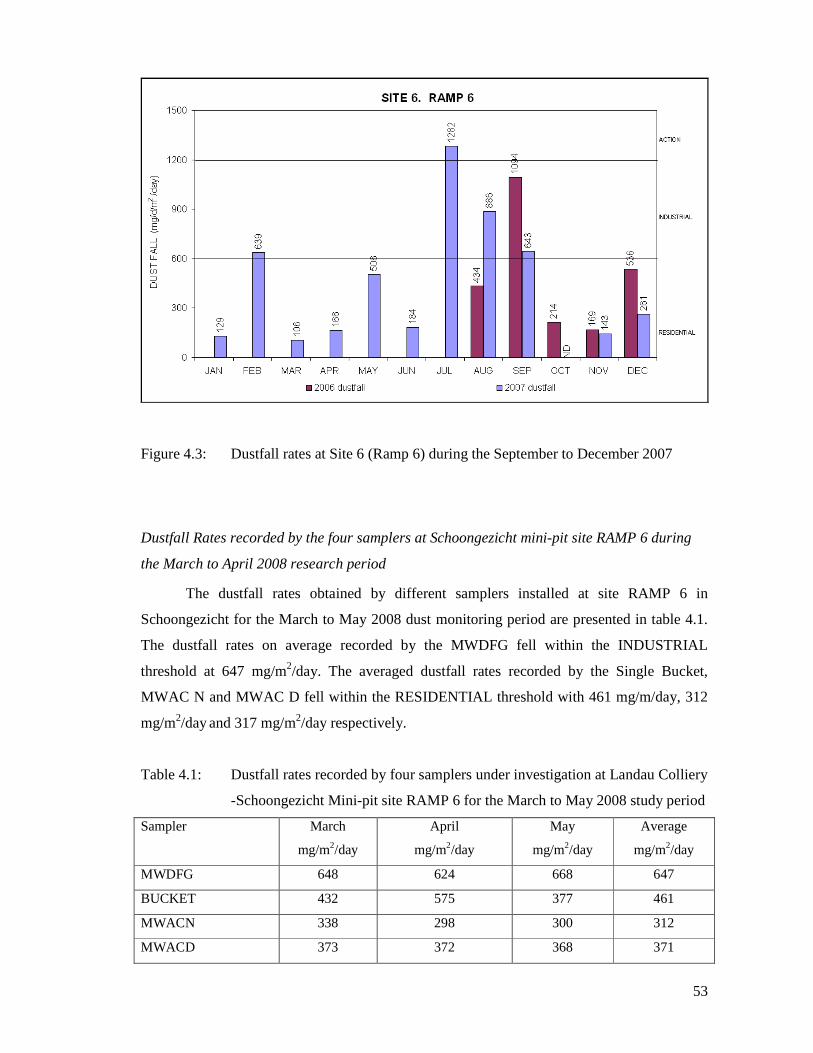
53
Figure 4.3: Dustfall rates at Site 6 (Ramp 6) during the September to December 2007
Dustfall Rates recorded by the four samplers at Schoongezicht mini-pit site RAMP 6 during
the March to April 2008 research period
The dustfall rates obtained by different samplers installed at site RAMP 6 in
Schoongezicht for the March to May 2008 dust monitoring period are presented in table 4.1.
The dustfall rates on average recorded by the MWDFG fell within the INDUSTRIAL
threshold at 647 mg/m2/day. The averaged dustfall rates recorded by the Single Bucket,
MWAC N and MWAC D fell within the RESIDENTIAL threshold with 461 mg/m/day, 312
mg/m2/day and 317 mg/m2/day respectively.
Table 4.1: Dustfall rates recorded by four samplers under investigation at Landau Colliery
-Schoongezicht Mini-pit site RAMP 6 for the March to May 2008 study period
Sampler March
mg/m2/day
April
mg/m2/day
May
mg/m2/day
Average
mg/m2/day
MWDFG 648 624 668 647
BUCKET 432 575 377 461
MWACN 338 298 300 312
MWACD 373 372 368 371

54
The dustfall rates observed at RAMP 6 recorded by the Single Bucket during the March to
April 2008 are compared to the dustfall rates for the same period in 2007 (figure 4.4). The
dustfall rates for the 2008 sampling period were generally higher than the 2007 sampling
period. The dustfall rates obtained by the Single Bucket for the March to April sampling
periods of 2007 and 2008 fell within the RESIDENTIAL threshold and are both lower that the
dustfall rates recorded by the MWDFG for the same sampling months in 2008 (figure 4.4).
The dustfall rates recorded for May 2008 was lower that the same period in 2007, possible
due to different weather conditions. The MWDFG recorded higher dustfall at INDUSTRIAL
threshold level in March to May 2008 rates compared to the Single Bucket in 2007 and pre-
2007 years.
Site 6, RAMP 6
0
100
200
300
400
500
600
700
March April May
Du
stfa
ll (
mg
/m2/
day
)
2008
2007
Figure 4.4: Comparison of monthly dustfall rates recorded at Landau Colliery
-Schoongezicht Mini-pit site RAMP 6 by Single Bucket during the
March to May 2008 with March to May 2007 sampling periods
Dustfall collection efficiencies of the four samplers under investigation
The ratios of the dustfall rates obtained for MWDFG, MWAC N and MWAC D
against the Bucket were calculated to determine the collection efficiencies of these samplers
against the bucket. The ratio of dustfall rates of MWAC N against MWAC D was also
calculated. The ratios obtained are shown in table 4.2. The ratio of MWAC N against MWAC
D was calculated to determine which of the two flux gauges was more efficient. The ratios of

55
dustfall rates for MWDFG against MWAC N and MWAC D were calculated to determine
how efficient the MWAC flux samplers were against MWDFG
The ratio of MWDFG against the Single Bucket for the month of March 2008 was 1.50:1.00
meaning that for every milligram the Bucket collect MWDFG collects an additional half
milligram more. The ratio of MWDFG against the Single Bucket decreased in the month of
April but increased in the month of May. The average dustfall ratio for MWDFG against the
Single Bucket is 1.50:1.00. The average dustfall ratios indicate that the MWDFG collects
double the amount of dust collected by the MWAC N and collects an additional half more
quantity that MWAC D collects. The dustfall ratio between MWAC N and MWAC D means
that for every 1 milligram that the MWAC D collects MWAC N collects 0.8 milligrams. The
Single Bucket collects an additional half quantity more of dust that an MWAC N sampler
collects.
Table 4.2: Ratios of dustfall rates and average ratios obtained for the four samplers under investigation
DUSTFALL RATIO OF DUSTFALL RATES SAMPLER (mg/m^2/d) BUCKET MWDFG MWACN MWACD MARCH BUCKET 432 1.00 0.67 1.28 1.16 MWDFG 648 1.50 1.00 1.92 1.74 MWACN 338 0.78 0.52 1.00 0.91 MWACD 373 0.86 0.58 1.10 1.00 BUCKET MWDFG MWACN MWACD APRIL BUCKET 575 1.00 0.92 1.93 1.55 MWDFG 624 1.09 1.00 2.09 1.68 MWACN 298 0.52 0.48 1.00 0.80 MWACD 372 0.65 0.60 1.25 1.00 BUCKET MWDFG MWACN MWACD MAY BUCKET 377 1.00 0.56 1.26 1.02 MWDFG 668 1.77 1.0 2.23 1.82 MWACN 300 0.80 0.45 1.00 0.82 MWACD 368 0.98 0.55 1.23 1.00 AVERAGE BUCKET MWDFG MWACN MWACD BUCKET 443 1.00 0.68 1.48 1.20 MWDFG 653 1.47 1.00 2.18 1.77 MWACN 299 0.68 0.46 1.00 0.81 MWACD 369 0.83 0.57 1.23 1.00

56
The collection efficiency of MWDFG, MWAC N and MWAC D against the Single Bucket is
shown in figure 4.3. The Single Bucket is 32 % less efficient in dust collection than the
MWDFG, and 48% and 20 % more efficient than the MWAC N and MWAC D respectively.
Table 4.3: Table showing collection efficiency of the MWDFG, MWAC N and MWAC D against the Single Bucket DUSTFALL Excess (Deficiency) in collection relative to
reference sampler (%) SAMPLER (mg/m^2/d) BUCKET MWDFG MWACN MWACD MARCH BUCKET 432 0% -33% 28% 16% MWDFG 648 50% 0% 92% 74% MWACN 338 -22% -48% 0% -9% MWACD 373 -14% -42% 10% 0% BUCKET MWDFG MWACN MWACD APRIL BUCKET 575 0% -8% 93% 55% MWDFG 624 9% 0% 109% 68% MWACN 298 -48% -52% 0% -20% MWACD 372 -35% -40% 25% 0% BUCKET MWDFG MWACN MWACD MAY BUCKET 377 0% -44% 26% 2% MWDFG 668 77% 0% 123% 82% MWACN 300 -20% -55% 0% -18% MWACD 368 -2% -45% 23% 0% AVERAGE BUCKET MWDFG MWACN MWACD BUCKET 443 0% -32% 48% 20% MWDFG 653 47% 0% 118% 77% MWACN 299 -32% -54% 0% -19% MWACD 369 -17% -43% 23% 0%
Regional climate and analysis of meteorological data Spatial variations and diurnal and seasonal changes in the wind field and atmospheric
stability regime are functions of atmospheric processes operating at various temporal and
spatial scales (Goldreich and Tyson, 1988). Atmospheric processes at macro- and meso-scales
need therefore to be taken into account in order to accurately parameterise the dust generation
potential and atmospheric dispersion potential of a particular area. Local-scale systems are
investigated in sections to follow through the analysis of meteorological data observed during
the study period, March to May 2008 and previous data of January to October 2007. The

57
precipitation, temperature and humidity data could not be obtained from SAWS for the
Witbank Weather Station.
Analysis of local-scale meteorological data
The wind field and the intensity and frequency of occurrence of precipitation represent
the most important meteorological parameters influencing emissions, dispersion and
deposition of fugitive dust. Hourly average wind data were obtained from the South African
Weather Service (SAWS) monitoring station at Witbank for the period under review.
Surface wind field analysis for January to December 2007
The erosion and vertical dispersion of dust is a function of the wind field. The wind
speed determines the dust generation potential, the distance of downwind transport, and the
rate of dilution of pollutants. The generation of mechanical turbulence is similarly a function
of the wind speed, in combination with the surface roughness.
The monthly average wind speeds are provided in Figure 4.5. Period average and monthly
average wind roses for the January to October 2007 interval are given in Figures 4.6 and 4.7,
respectively. Wind roses comprise 16 spokes which represent the directions from which
winds blew during the period. The colours reflected the different categories of wind speeds;
thus light yellow represents wind speeds lower than 1.5 m/s, yellow represents winds of 1.5 to
4.0 m/s, red represents 4.0 to 8.0 m/s and blue represents winds greater than 8 m/s. The
dashed circles represent the frequency of occurrence of wind speed and direction categories.
Wind speeds higher than 4 m/s will have an influence on dust mobility and are thus the winds
of concern with respect to dust concentrations. The threshold wind speed (minimum speed
required to transport dust particles) depends on the dust particle size and surface shear.

58
Figure 4.5: Period average wind rose for the January to October 2007 monitoring period
based on wind field data from the SAWS station in Witbank
Wind speeds generally decrease during the autumn to winter months and increase again
during spring and summer, with maximum gusts during October. Over the annual period,
winds in the Witbank region blew predominantly from the easterly to east-south-easterly
sector, with winds from the northerly to west of northwest quadrant representing a less
frequent secondary flow component. Within the region, the easterly to east of southeast and
northern wind components are occasionally associated with gusts.

59
Figure 4.6: Monthly wind rose for Witbank for the period of January to June 2007
January 2007 February 2007 March 2007
April 2007 May 2007 June 2007

60
Figure 4.7: Monthly wind rose for Witbank for the period of July to October 2007
July 2007 August 2007 September 2007
October 2007 November 2007 December 2007

61
The surface wind field largely reflects the synoptic scale circulation. The northerly wind
component, associated with the presence of the continental high pressure and the influence of
the tropical easterlies persist throughout much of the year. The strengthened influence of the
tropical easterlies during spring and summer months is evident by the increase in airflow from
the south-easterly sector in October. During winter a decrease in wind speed is evident and,
due to the influence of the local terrain, the flow regime is predominantly characterised by
westerly and north-westerly winds. However, a more prominent airflow from the southerly
component is evident during July, associated with the passage of cold fronts.
Surface wind field analysis for Witbank region during March to June 2008 research period
During March 2008, wind in the Witbank region blew predominately from the easterly
sector. The wind blew prominently from the westerly quadrant during the month of April
2008. During the month of April wind predominately blew from the east with east
representing a less frequent secondary flow component. Monthly average wind roses for the
March to April 2008 interval and May to June 2008 interval are given in Figures 4.8 and 4.9,
respectively
March 2008 April 2008
May 2008 June 2008
Figure 4.8: Monthly wind rose for Witbank for the period of March to April 2008

62
May 2008 June 2008
Figure 4.9: Monthly wind rose for Witbank for the period of May to June 2008
Dust morphology Based on the images of particle surface shape gained by the SEM analysis of dust
particles from the four samplers, 6 clusters of particulate morphology have been sorted out;
Irregular square, Agglomerate, sphere, floccule and cylindrical.
Irregular square
The Irregular square particles were observed from the dust samples collected by the
MWDFG (figure 4.10 a-c), MWAC N (figure 4.12 a and c) and MWAC D (figure 4.13 d).
Irregular square grains are the most predominant particle in the samples detected. The surface
of these particles is smooth as shown in figure 4.10 b. Some irregular diamonds were
observed from the dust samples collected by MWDFG (figure 4.10 e)
Agglomerate
Agglomerate shaped particles are the least predominant than the irregular square in
dust particles collected by MWDFG, MWAC N and MWAC D. The Single bucket exhibited a
larger quantity of agglomerate compared to the other samplers in the study. Agglomerate
particles are little smaller in size than the irregular square particles.
Sphere
Sphere particles were observed from the dust collected by the Single Bucket (figure
4.11 a-e). Sphere particles are generally smaller than all other particle types with average
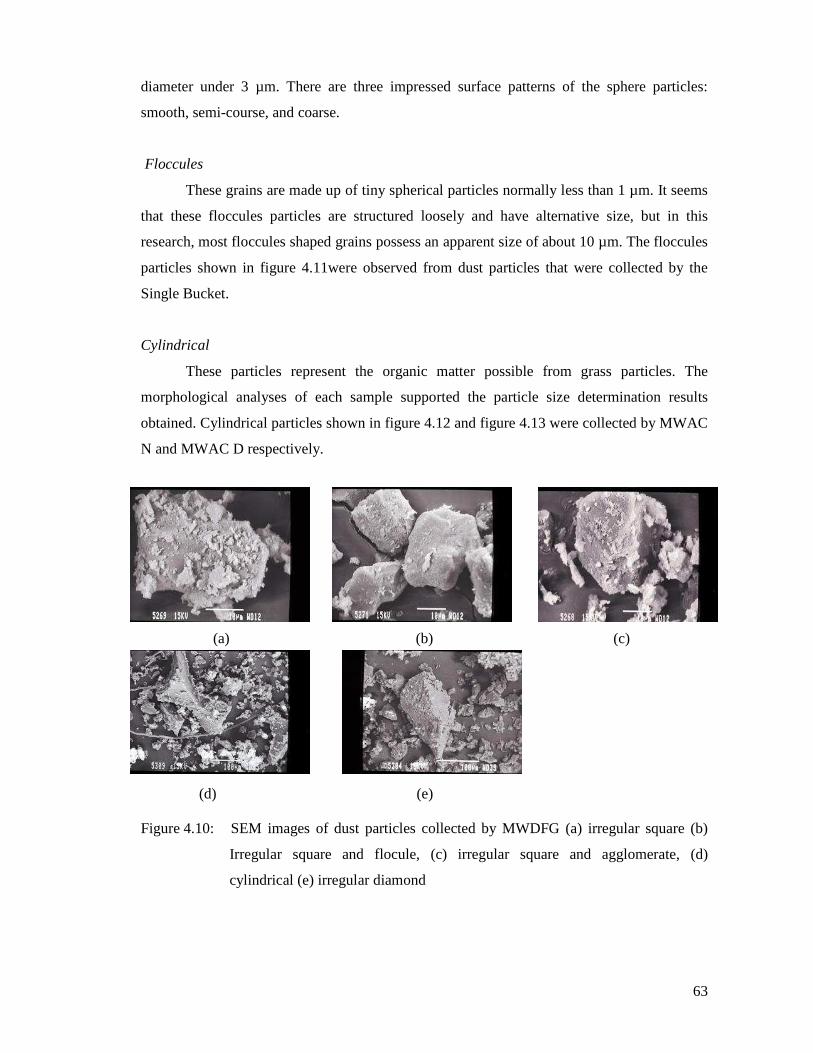
63
diameter under 3 µm. There are three impressed surface patterns of the sphere particles:
smooth, semi-course, and coarse.
Floccules
These grains are made up of tiny spherical particles normally less than 1 µm. It seems
that these floccules particles are structured loosely and have alternative size, but in this
research, most floccules shaped grains possess an apparent size of about 10 µm. The floccules
particles shown in figure 4.11were observed from dust particles that were collected by the
Single Bucket.
Cylindrical
These particles represent the organic matter possible from grass particles. The
morphological analyses of each sample supported the particle size determination results
obtained. Cylindrical particles shown in figure 4.12 and figure 4.13 were collected by MWAC
N and MWAC D respectively.
(a) (b) (c)
(d) (e)
Figure 4.10: SEM images of dust particles collected by MWDFG (a) irregular square (b)
Irregular square and flocule, (c) irregular square and agglomerate, (d)
cylindrical (e) irregular diamond

64
(a) (b) (c) (d)
Figure 4.11: SEM images of dust particles collected by Single Bucket (a) sphere, and agglomerate (b) sphere, floccules and irregular (c) sphere and irregular (d) sphere and irregular
(a) (b)
(c) (d)
Figure 4.12: SEM images of dust particles collected by MWAC N (a) Irregular square (b) Column (c) irregular square and column (d) agglomerate and column

65
(c) (d)
Figure 4.13: SEM images of dust particles collected by MWAC D (a) Column, (b) Column,
(c) agglomerate and (d) irregular square.
Particle size analysis for four dust samplers Four dust samples from Single Bucket, MWAC N, MWAC D and MWDFG were sent
for analysis to M & L Inspectorate an accredited laboratory. The particle size analysis graphs
are presented in APPENDICES C, D, E and F.
The MWDFG, MWAC N and MWAC D yielded very similar particle analysis results
These three are symmetrical around the mode (max value), while the Single Bucket is
distinctly asymmetrical. The Single Bucket yielded particle size distribution results that were
not log-normally distributed skewed distinctly to the larger sizes (mean diameter 45 micron
diameter. The MWDFG yielded particle size analysis results (log – normally distributed) with
particles less than 1000 µm. According to Hall et al., (1994), the collection efficiency of the
single bucket for wind speeds between 2 and 12 m.s-1 and particle sizes between 87 and 400
µm is less than 20%. It is interesting to note that the single bucket during this sampling period
recorded more dustfall rate for the 100 µm dust fraction compared to the other samplers under
investigation. The MWDFG recorded a higher dustfall rate for the dust fraction above 400
µm compared to the other samplers under investigation. The results obtained suggest that
there was another closer source of the dust from a different direction with large dust fractions
d
(a) (b)

66
which were able to be collected by the MWDFG but could not be collected by the single
bucket, MWAC N and MWAC D. `
There were particles less than 15 µm that were detected in all particle size analysis results.
These particles were within the PM10 range and this indicates that all these samplers do collect
particles in the PM10 size fractionation. The PM10 fraction is about 19 percent by volume for
MWAC N, 16 percent for MWAC D, 19 percent for Bucket and 23 percent for MWDFG.
Particles of 10 microns diameter and less will pass through the nose and throat and reach the
lungs. If the sources of PM10 are from the same sources as the dust, then measurements of the
dust concentrations will be able to indicate if PM10 concentrations are being controlled. This
excludes sources from high temperature emissions such as combustion and smelting
processes.
The diameter of maximum particulate concentration for MWAC N and MWAC D is 27 µm,
for the Single Bucket is 50 µm and for the MWDFG is 25 µm for the zero to 100 µm particle
size distribution. The MWAC N, MWAC D, Single Bucket and the MWDFG recorded
maximum particulate concentration of 450 µm, 500 µm, 450 µm and 320 µm for the 100 to
1000 particle size distribution, figure 4.14.
Figure 4.14 Particle Size Distribution plots for the dust collected by the four samplers
during the March to May 2008 dust monitoring period at Landau Colliery
Schoongezincht mini pit Site RAMP 6
____Single Bucket ______MWDFG ______MWAC N ______MWAC D

67
Particles below 40 µm can enter the nasal passage and have been shown to be existent in this
size particle analysis. These can contribute to allergies, sensitizations, and asthma. Particles in
this size range include pollens, spores, and viruses. The percentage of particles by volume,
below 40 µm is just about 63 percent for MWAC N, 59 percent for MWAC D, 59 percent for
the Single Bucket and 63 percent for MWDFG particle size distribution.
The percentage of particles by volume of 2.5 µm for MWDFG is 6 percent, 5.3 percent for the
Single Bucket, and 3.9 percent for MWAC D and 5 percent for MWAC N. Particles of < 2.5
µm size are repairable and will penetrate into the gas exchange region of the lungs. Many
countries including the United States of America do not consider precipitant dust as an
indication of atmospheric environmental and health conditions (Grantz et al, 2003). These
countries use more expensive active atmospheric monitoring equipment to determine the
PM10 and PM2.5 dust concentrations in the atmosphere (Grantz, et al, 2003). The fact that the
PM10 fraction is collected by the dust monitoring unit under study means that the methods
could be used to correlate to the PM10 dust concentrations once the appropriate research has
been done. While there is currently no method to convert dust depositions to PM10
concentrations (Australian Government, 1998), the correlation is mostly going to be specific
to the topography and climate of the area and to the sources of PM10 particulate matter.
In South Africa and many other countries, the cost of doing PM10 and PM2.5 atmospheric
monitoring is very high and often the monitoring systems do not operate efficiently enough to
provide data that can be reliably used to determine environmental and health risk trends. With
passive monitoring systems it is often possible to have more monitoring stations and this
normally provides more reliable data than active monitoring (Schneider, et al, 2002).
With the passive nature of precipitant dust monitoring and the reliability of the monitoring
programmes as shown by 2007 and pre 2007 data collected at Landau Colliery discussed in
this dissertation, the cost of PM10 and PM 2.5 monitoring programmes could be achievable for
third world countries.

68
Discussion of Results
Dustfall rates recoreded by the four dust samples at Schoongezicht mini-pit site RAMP 6 during March to May 2008
The MWDFG collected more dust than the other samplers during the March to April
2008 sampling period (see table 4.1). There was a decrease in the dustfall rates obtained by
MWDFG for the month of April. The dustfall ratio for the MWDFG to the Single Bucket
dropped from 1.50:1.00 in March to 1.09:1.00 in April and increased to 1.77:1.00 in May.
There were less calms conditions (6.45%) and more high wind speeds (4-8 m.s-1) in March
than in April (figure 4.8). These weather conditions were more ideal for the MWDFG
function than the Single Bucket hence the extra dustfall collected by the MWDFG. The
predominant winds during the month of March were coming from the east.
The ideal weather condition for efficiency of a Single Bucket sampler is weather
characterized by calm and low wind speed conditions. The month of April was characterized
by more calms and low wind speed weather conditions. These weather conditions resulted in
the Single Bucket collecting more dust than in the month of March. The predominant winds
during the month of April were coming from the west. The increased dustfall rates recorded
by the Single Bucket in April could have been from a source of dust located to the west of
Site RAMP 6.
During the month of May the predominant winds were coming from the east with lesser
winds coming from the west (figure 4.9). There were more calms conditions (14.11%) and
more high wind speeds (4-8 m.s-1). The dominant easterly wind direction and high wind
speeds resulted in more dust collected by MWDFG than the Single Bucket. However, the
Single Bucket recorded more dustfall rates during May than March because of the westerly
wind component and the more calm weather conditions experienced in May. Throughout the
investigation period MWDFG did not record significant variations in dustfall rates because it
was not affected by changing wind direction as it could orientate itself to any wind direction.
There was no significant variation in dustfall rates recorded by the MWAC N and the MWAC
D samplers during the month of March to May 2008.

69
Particle size analysis of the dust samples
The particle size analysis performed on the dust samples indicate that the dust
collected by the samplers is predominantly less than 100 µm. The particle size of less than
100 µm is similar to the size of dust from fugitive dust sources.
The fraction of dust particles above 100 µm recorded by the four samplers indicates that these
dust fractions are from within 100 meters of the sampling location. The particles were either
gusted into the samplers by wind or mechanically agitated and lifted into the air during calm
conditions. The area is next to an unpaved road used by mining trucks to transport coal from
the nearby mine pits (figure 1.1).
Significant percentages by volume of particles collected by the four samples are under 15 µm.
The PM10 fraction is about 19 percent by volume for MWAC N, 16 percent for MWAC D,
19 percent for the Single Bucket and 23 percent for MWDFG.
Scanning electron microscopy analysis of the dust samples
Based on the morphological features, it can be considered that irregular square and
diamond particles are assuredly derived from soil, coal and geological deposit as the product
of mechanical abrasion (Kaegi, 2004); the agglomerate and sphere particles are from the
combustion of coal (Ramesh and Koziski, 1999:), while the floccules particles are from the
discharge of vehicles (Colberk et al., 1997), and the cylindrical or stick shaped particles are
from bioactivities (Crook and Sherwood-Higham, 1997). In the atmospheric environment,
only a few particles possess smooth surface, most of them are fractal. With the enlarged
surface area by the cracked and holed process, these fractal particles can provide suitable
environment and medium for the secondary atmospheric reactions. The particles observed
from the Bucket are rounded possible due to the filtration process. Particles from MWDFG,
MWACN and MWAC D could have retained their original sharp edges because they were not
subjected to filtration process.

70
CHAPTER FIVE
CONCLUSION
This chapter has the conclusions and recommendations of the study
Conclusion and Recommendations
During the 3 months sampling period MWDFG recorded dustfall rates that were higher than
the Single Bucket with 647 mg/m2/day on average while Single Bucket recorded dustfall
levels with 461 mg/m2/day on average. The Single Bucket may be measuring inefficiently at
higher wind speeds.
The MWDFG and the Single Bucket should be used in combination to assess different aspects
of wind-blown dust problems in Landau Colliery. The Single Bucket would give information
on local rates of deposition, whereas the MWDFG would indicate dust from various source
and direction. The excess dustfall that has been exhibited by the MWDFG during the March
to April 2008 dust sampling period is a result of dust from other source directions that could
not be recorded by the Single Bucket.
MWAC N and MWAC D are flux gauges, but the results obtained indicated that they were
not as efficient as MWDFG in collecting dustfall under high wind conditions. They obtained
dustfall level rates of 312 µm and 371 µm on average respectively during the sampling
period. Doubling the size of the inlet and out yielded no significant difference as shown by
ratios calculated.
MWDFG yielded better dustfall results compared to the Single Bucket and MWAC samplers
for the Landau Colliery RAMP 6 sampling site. The results obtained may not be true for other
sites, in this and other provinces.
Annegarn Environmental Research and Ecoserve Private Limited recently adopted the
MWDFG and thirty units have been produced and installed in Saldanha and Vredenburg and

71
other sites in Durban and Cape Town. The results from these new units will not be included in
this study. Results from Ecorseve may only be available towards the end of 2009 and that is
out of this study time-frames.

72
REFERENCIES
American Society for testing and Materials (ASTM), 2000: Standard test method for
collection and measurement of dustfall (Settleable particulate matter). Designation: D 1739-
98. West Conshohocken, PA: (Reprinted from the Annual Book of ASTM standards).
Australian Government – Department of the Environment and Heritage. 1998: (25
screens).http://www.deh.gov.au/settlements/industry/minerals/booklets/dust/dust.htlm#
Accessed July 2008.
Baird M., 2007: Dust Fallout: Quarter 1 October 2006 to December 2006, Report prepared for
CSIR, AS306, March 2007, Ecoserve (Pty) Ltd.
Baumbach, G, 1996: Air Quality Control, 490pp, Springer-Verlag, Berlin Heidelberg.
Burton and Lundgren, 1997: Aerosol Science and Technology. Journal of Aerosol Science,
31, 339-356, Elsevier Science Ltd.
Colberk, I., Atkinson, B., Joher, Y., 1997: The Morphology and Optical Properties Of Soot
Produced By The Different Fuels, Journal of Aerosol Science, 28(3): 715-723.
http://www.scotland.gov.uk/library5/planning/pan50ab.pdf. Accessed May 07 2008.
Colls, J. 1997: Air Pollution. An Introduction, E & FN Spon, London, pp. 341 pp.
Combes, R.S. and Warren, D.A., 2005: Characterizing and Controlling Industrial Dust; A
Case Study In Small Particle Measurement. Environmental Monitoring and Assessment 106:
43-58pp.
Countess Environmental 2004: WRAP Fugitive Dust Handbook: 191 pp
http://ndep.nv/baqp/WRAP/final-handbook.pdf. Accessed May, 2008.
Cowherd, C., and Euglehart, J., 1984: Paved Road Particulates Emissions, EPA-600/7-84-
077, US Environmental Protection Agency Cincinnati, OH.

73
Cowherd, C., and Euglehart, J., 1985: Size specific Particulate Emission Factors for Industrial
and Rural Roads, EPA-600/7-85-038, US Environmental Protection Agency, Cincinnati, OH.
Cowherd, C., Muleski, G. E., and Kinsey J.S., 1998: Control of Open Fugitive Dust Sources,
EPA-450/3-88-008, United States Environmental Protection Agency, research Triangle Park,
North Carolina.
Crook, B,, Sherwood-Higham, J. L., 1997: Sampling and assay of bioaerosols in the work
environment, Journal of Aerosol Science, 28(3): pp. 417-426.
Dockery D.W. and Pope C.A. 1994: Acute Respiratory Effects of Particulate Air Pollution,
Annual Review of Public Health, 15, 107-132.
Egami, T. S., Bilinge J.L., 2003: Structural Analysis of Complex Materials, Technology and
Engineering, pp. 404. Elsevier Ltd, Oxford.
Egami R, Watson, J. G., Chow J. C., at al, 1991: In: Methods of Air Sampling and Analysis
(ed: Lodge Jr), Lewis Publishers, Michigan IL, 542 – 558.
Environmental Agency, 2003) Monitoring of Particulate Matter in Ambient Air around Waste
Facilities; Technical Guidance Document (Monitoring M17, Environmental Agency, London.
Environmental cast Newsletter. 2003: The Wind and Watershed: Pollen and Pollution.: (5).
EPA, 1990: Surface Impoundment Modelling System (SIMS) Technical Manual, EPA-68-02-
4378, US-Environmental Protection Agency, Research Triangle Park, North Carolina.
EPA, 1992: Fugitive Dust background and Technical Information Document for Best
Available Control Measures, EPA-450/2-92-004, U.S. Department of Commerce, Springfield,
VA September 1992.
Etyemezian, V., Ahonen, S., Nikolic, D., Gillies, J., Kuhns, H., Gillette D, Ahonen, S.,
Nokolic, D., and Veranth, J. 2004. Deposition and Removal of Fugitive Dust In: The Arid
South Western United States: Measurement And Model Results. Journal of Air and Waste
Management Association, 54: 1099-1111.

74
Farmer, A. M., 1993: The effects of dust on vegetation – a review, Environmental Pollution;
79:63-75.
Garland, J. A., Nicholson, K. W., 1991: A Review of Methods for Sampling Large Airborne
Particles and Associated Radioactivity – Journal of Aerosol Science, 22, (4), pp 479 – 499.
Godish, R., 1990: Air Quality, Lewis Publishers, Michigan, pp. 422.
Goodquarry, 2004: Air Pollution.
http://www.goodquarry.com/article.aspx?id=22&navid=2.
Goossens D, 1999, Dry Aeolian Dust Accumulation in Rocky Deserts: A medium-Term Field
Experiments Based on Short-Term Wind Tunnel Simulations, Earth Surface Processes and
Landforms, 25, pp. 41-57.
Grantz, D.A., Garner J.H.B., Johnson, D. W., 2003: Ecological Effects of Particulate Matter,
Environmental International, 29 pp. 213-39.
Hall, D. J., 1994: Design for a Deposit Gauge and a Flux Gauge for Monitoring Ambient
Dust: Atmospheric Environment 28, 18 pp 2963-2979.
Held, G., Gore, B.J., Surridge, A.D., Tosen,G.R., Turner, C.R. and Walmsley R.D., (eds),
1996: Air Pollution And Its Impacts On The South African Highveld,. Environmental
Scientific Association, Cleveland, pp. 144.
Held, G., Scheifinger, H., and Snyman, G. M., 1994a: Recirculation of Pollutants in the
Atmosphere of the South African Highveld, South African Journal of Science. 90, pp. 91-97.
Held, G., Turner, C.R., Louth, W., and de Beer, G. H., 1994b: Air Quality and Meteorological
Monitoring the Vicinity of Kendal Power Station (Final Report). Eskom Report
TRR/S94/157, Johannesburg, pp. 33.
http://www.stormcenter.com/envirocast/2003-03-01/envirocast-article1.php. Accessed June,
2008.

75
ISO, 1970: Air Quality Determination Of Gaseous Sulphur Compounds In Ambient Air-
Sampling Equipment, International Standard ISO 4219. International Organization for
Standardization, Geneva. (Example of ISO standards available for monitoring).
Jiries, A., El-Hasan T., and Manasrah W., 2002: Qualitative Evaluation of The Mineralogical
And Chemical Composition Of Dry Deposition In The Central And Southern Highlands Of
Jordan, Journal of Chemosphere; 48: 933-8
Kaegi, R., 2004: Chemical and Morphological Analysis of Airborne Particles At A Tunnel
Construction Site, Journal of Aerosol Science, 35: 621-632.
Kuhn, G.F., Loans, C., 2003: Practical Determination and Location of Windblown Dust
Sources and How to Establish a Good Monitoring Program, Journal of Chemical Technology;
11:27-9.
Lennon, S., Zhang, Z., Lessmann, R., and Webster, S., 1998: Experiments on Particle
Deposition in the Human Upper Respiratory System, Journal of Aerosol Science and
Technology 28, Issue 5, 1998, pp. 464-474.
Mody,V., Jakhete, R., 1987: Dust Control Handbook For Mineral Processing.
http://www.osha.gov/SLTC/silicacrystalline/dust/dust_control_handbook.html Accessed May
2008.
Nemmar, A., Hoylaerts, M.F., Hoet P.H.N., Vermylen, J. D., Dinsdale, M.F., Hoylaerts and
B. Nemery (2003), Diesel Exhaust Particles In Lung Acutely Enhance Experimental
Peripheral Thrombosis, Journal of Circulation, 107, pp. 1202-1208.
Pretorious, R. W., Auret, I., Held, G., Brassel, K. M., Danford, I.R., and Waldie, D. D., 1986:
The Climatology Of The Boundary Layer Over The Eastern Transvaal Highveld And Its
Impact on Sulphur Dioxide Concentrations At Ground Level. CSIR Report ATMOS/86/16,
Pretoria, pp. 212.
Pye, K., 1987: Aeolian Dust and Dust Deposits, Academic Press, London.

76
Ramesh, A., Kozinski, J. A., 1999: Analysis Of Surface Topography Of Ash Particles
Obtained From Sludge Combustion Using Tapping-Mode AFM, Journal of Applied Surface
Science, 152: 185-192.
Rawle, A., 1998: Basic Principles of Particle Size Analysis, Malvern Instruments Limited,
Enigma Business Park, Malvern, and Worcestershire.
Martin Marietla Laboratories Baltimore .
Rodrigues, M., 2002: New Dust Monitoring Technology Developed. Engineering News 2002;
11; weekly feature.
Schneider, T., Schlunssen, V., Vinzents, P.S., and Kildeso, J., 2002: Passive Sampler Used
For Simultaneous Measurements Of Breathing Zone Distribution, Inhaleable Dust
Concentration And Other Size Fractions Involving Large Particles. Occupational Hygiene
Journal 46 (2): 187-95.
Schulze, B.R., 1972: South Africa In: JF Griffiths, Editor, Climates Of Africa, World Survey
Of Climatology, vol. 10. Elsevier, Amsterdam, pp. 501-586.
Schwela D., 1998: Health and Air Pollution- A Developing Country’s Perspective, Paper 1A-
1, Papers of the 11th World Clean Air and Environmental Congress, 13-18 September 1998,
Durban, South Africa.
Scotland Government, 1998: Controlling the Environmental Effects Of Surface Mineral
Workings. http://www.scotland.gov.uk/library5/planning/pan50ab.pdf. Accessed May 03
2007.
Scotland Government, 1998: Controlling the Environmental Effects of Surface Mineral
Working, Annex B: The control of dust at surface mineral workings, pp. 25.
http://ww.scotland.gov.uk/library5/planning/pan50ab.pdf. Accessed May 03 2008
Tosen, G. R., and Jury, M,. 1986: The Winter Noctural Wind Jet over the Eastern Transvaal –
A Case Study Sequence. Eskom Report TRR/N86/006, Johannesburg, pp. 20.

77
Tosen, G. R., and Jury, M., 1988: Climatology of The Winter Boundary Layer Over The
Eastern Transvaal. South African Journal of Science. 84. Pp. 247-253.
Tyson, P. D., Kruger, F and Louw, C. W., 1988: Atmospheric Pollution and its Implications
on the Eastern Transvaal Highveld. South African National Scientific Programmes Report
No. 150, pp. 114.
US-EPA, 1998: Quality Assurance Handbook for Air Pollution Measurement Systems,
Volume II; Part 1. Ambient Air Quality Monitoring Program Quality System Development,
US Environmental Protection Agency, Research Triangle Park, EPA-454/R-98-004, August
1998.
US-EPA, 2000: List of Designated Reference and Equivalent Methods, National Exposure
Research Laboratory, United States Environmental Protection Agency, 9 May 2000.
Warren A, 2000, Wind Erosion on Light Soils (WEELS), Final Report to the European Union
Commission.
Wayne, R.P., 1991: Chemistry of Atmosphere, 2nd ed, 447 pp, Oxford University Press, New
York.
WHO, 2000: Air Quality Guidelines, World Health Organisation, Geneva.
World Bank Report, (1998), World Development Indicators. New Ideas in Pollution
Regulation, World Bank Group, pp. 162-163.

78
APPENDIX A. Step by Step Description of the method used to obtain Dust Data
1. Bucket Preparation
Clean the buckets well, making sure that no dust or particulate remains in the buckets.
Rinse out with a little distilled water, discarding this rinse water.
Partially fill with distilled water, allowing for the expected rate of evaporation appropriate to
the expected rate of sampling as outlined in Table. These are rough figures and conditions in
your area will dictate exact water requirements.
Table 1: Amount of water required for different climatic conditions.
WEATHER
CONDITIONS
1 WEEK 2 WEEKS 3 WEEKS 4 WEEKS
OR
1 MONTH
Hot dry warm
periods
2.5 liters 3.5 liters 4.0 liters 4.0 liters +
check after 3
weeks
Hot wet warm
periods
2 liters 2.5 liters 3.0 liters 3.5 liters +
check after 3
weeks
Cool dry cold
periods
2 liters 2.5 liters 2.5 liters 3.5 liters
Cold dry cold
periods
2 liters 2.5 liters 2.5 liters 3.0 liters
Wet cold
periods
2 liters 2.0 liters 2.5 liters 3.0 liters +
check after 3
weeks
It is not critical to measure the water accurately and the above approximations are good
enough. It should be noted that with any longer period of measurement the water should be
topped up to prevent total loss of water, which will result in some loss of dust or alternatively
failure to catch dust adequately during the period when the bucket is dry.
Add an amount of 5 ml to 10 ml of copper sulphate to each bucket as an algaecide, depending
on how full the buckets will be kept. Top-up water does not have to be similarly dosed with
bleach

79
Seal the buckets with the lids, adding labels to the bucket lids
Transport the buckets to site
2. Bucket Collection Procedure
The bucket support cradle must be dropped by unlocking the pad lock
The bucket must be removed and replaced with a pre-prepared bucket, using the labeled lid to
seal the removed bucket, taking care to label the sample buckets correctly.
Lift the support assembly back into position and lock.
Any notes should be made in the field book before leaving.
3. Filtering Procedure
The clean Buchner funnel assemblies should be fitted with the pre-weighed and marked filter
papers, making sure that the filter paper is located to prevent by-pass leakage around the filter.
The contents of one bucket must be loaded into each funnel after +1mm discard solids are
strained out and the vacuum pump started.
Filter numbers must be entered against the designation of the collected bucket on the
assessment form.
Enter all the relevant information on the assessment form.
On completion of the filtering process, remove the filters using forceps, place these in the
Petri dishes, partially covering the filters and allow these to desiccate in a low temperature
oven.
The filter + solids must be weighed once the filters have been desiccated. The stage at which
full desiccation has been achieved is defined under “Weighing Procedure”.
The filter mass must be noted on the assessment form.
100 ml of the filtrate solution should be retained if the soluble content of the captured sample
is also to be assessed and weighed. The total remaining water must be measured and the
quantity added to the assessment sheet to determine the amount of dissolved solids
The above filtrate solution should be boiled off over a low Bunsen or heat source (hot plate)
to accelerate the boiling off. The initial operation can be undertaken in a microwave oven and
the beaker transferred to a hot plate for final desiccation.
The filtrate solids from the beaker must be collected and weighed, entering the mass on the
assessment form as soluble solids.

80
4. Weighing Procedure – Filter Preparation
Stabilize filters in the laboratory or weighing room for 8 hours or keep stocks in an unsealed
partly ventilated container so that they are continuously stable for the laboratory conditions.
Filter papers are individually marked using a ballpoint pen. Ensure that the ink has dried
before proceeding with any weighing operations. Should filtrate be required to establish
Alpha short or long-lived particles, no marking of the filters must be undertaken.
Each filter must be placed in its own Petri dish: the Petri dishes should also be marked with
filter number and bucket number.
5. Weighing Procedure – Filter/Filtrate Weighing
Initial desiccation in a dust free environment for maximum of 24 hours must be allowed or
until all sample moisture evaporation has stopped.
Desiccated filters are placed on the balance and permitted to remain on the pan for about 60
seconds. If there is any indication of a continuous fall in mass, it means that the filter/filtrate
is not completely desiccated and the sample must be removed for further drying.
If the mass remains stable, remove the filter, allow the balance to zero and reweigh the filter.
6. Calculations
The cross-sectional area of the buckets is a standard constant in all of the calculations
representing the area over which precipitant dust collection has been made, 0.02545m2.
The actual mass collected is derived by subtraction of the mass of the filter (mass before)
from the combined mass of the filter and filtrate (mass after). Mass after – mass before =
collected mass of dust sample.
All units should be expressed in milligrams and the value of milligram/square meter/day
derived from the formula:
Precipitation rate (mg/m2/d) = collected mass X 1 0.02545 X days

81
7. Limitations of Sampling and Filter materials
The type of filter paper used and the location of samplers unit in relation to the source of the
dust dictate the sample capture restraints
Generally finer suspended dust (2.5µm > 5µm) will remain airborne almost indefinitely due to
the dynamic nature of the air currents and thermal activities on any given day, even if there is
no wind at all. A rapid increase in humidity together with an absence of wind will result in
precipitation of less than 5µparticulate.
Particulate larger than about 5µm will settle on a very still day and this material is collected
within the buckets in varying amounts depending on the wind turbulence.
Particulate of large size, 500 µm, carried by high wind velocities will not be collected within
the buckets due to the aerodynamic shape. At velocities below 3.0 m/s no particulate of this
size is lifted higher than a maximum of about 2.0m.
Once the wind drops to lower levels the particulate starts precipitating and this gets captured
in the buckets. We thus note that no dust gets captured during very windy conditions but only
when the wind speed drops. Once the wind changes, the maximum precipitation rate is
reached when the air mass movement is totally arrested and then starts to move in the
opposite direction.
From the above we thus selected filter material with a pore size of about 5µm. The filter
papers weave permits capture of 1 -2µm particulate and thus the actual collection guarantee is
a lot better than 5µm.

82
APPENDIX B Schematic Design of modified WDFG
Design drawings of MWDFG by the author

83
APPENDIX C: Particle size analysis graphs for the Single Bucket dust samples obtained at
Schoongezicht mini-pit site RAMP 6 over the month of April 2008

84
APPENDIX D: Particle size analysis graphs for the MWDFG dust samples obtained at
Schoongezicht mini-pit site RAMP 6 over the month of April 2008

85
APPENDIX E: Particle size analysis graphs for the MWAC D dust samples obtained at
Schoongezicht mini-pit site RAMP 6 over the month of April 2008

86
APPENDIX F: Particle size analysis graphs for the MWAC N dust samples obtained at
Schoongezicht mini-pit site RAMP 6 over the month of April 2008