msc fisheries assessment methodology v2 - california
TRANSCRIPT

Version 2.1, Release date: 1 May 2010
Marine Stewardship Council
Marine Stewardship Council
Fisheries Assessment Methodology
and
Guidance to Certification Bodies
Including Default Assessment Tree
and Risk-Based Framework

Version 2.1, Release date: 1 May 2010
Terms and conditions of use
This version 2 of the Marine Stewardship Council ―Fishery Assessment Methodology and Guidance to Certification Bodies‖ and its content is copyright of ―Marine Stewardship Council‖ - © ―Marine Stewardship Council‖ 2009. All rights reserved. Any redistribution or reproduction of part or all of the contents in any form is prohibited other than the following:
you may print or download to a local hard disk for your personal and non-commercial use only.
You may not, except with the express written permission of the Marine Stewardship Council,
copy or transmit this document in any form or by any means, electronic, mechanical, photocopying or otherwise,
distribute or commercially exploit this document or its content
store this document in any retrieval system, website or otherwise.
Copyright © Marine Stewardship Council, 2010. All rights reserved.
Document: Marine Stewardship Council Fisheries Assessment Methodology page 1 Date of issue: 1 May 2010 File: Fisheries_Assessment_Methodology_v2.1.pdf © Marine Stewardship Council, 2010
Table of Contents
Foreword ........................................................................................................................................ 6
Purpose .......................................................................................................................................... 7
Structure of this document .......................................................................................................... 8
Section 1: Overview of Structure and Approach to the Assessment Methodology .............. 9
Section 2: Use of the Risk-Based Framework (RBF) .............................................................. 12
Section 3: Guidance on Issues of Scope ................................................................................. 14
Section 4: Weighting and Scoring Procedures ....................................................................... 15
Section 4.1: Weighting ........................................................................................................... 15
Section 4.2: Scoring using the FAM ...................................................................................... 16
Section 4.3: Scoring a PI using results from the RBF SICA methodology ............................ 19
Section 4.4: Scoring a PI using results from the RBF PSA methodology ............................. 19
Section 5: Default Assessment Tree, Performance Indicators and Scoring Guideposts ... 22
Section 6: Principle 1 ................................................................................................................. 24
Section 6.1: General guidance on Principle 1 ....................................................................... 25
Section 6.2: Outcome Performance Indicators ...................................................................... 25
Section 6.3: Harvest Strategy (Management) Performance Indicators ................................. 32
Section 6.4: Principle 1 Performance Indicators and Scoring Guideposts ............................ 36
Section 7: Principle 2 ................................................................................................................. 41
Section 7.1: General guidance on Principle 2 ....................................................................... 41
Section 7.2: Retained Species .............................................................................................. 45
Section 7.3: Bycatch Species ................................................................................................ 46
Section 7.4: Endangered, Threatened or Protected Species (ETP) ..................................... 47
Section 7.5: Habitats.............................................................................................................. 47
Section 7.6: Ecosystem ......................................................................................................... 49
Section 7.7: Further Guidance on Key Principle 2 Phrases .................................................. 51
Section 7.8: Principle 2 Performance Indicators and Scoring Guideposts ............................ 53
Section 8: Principle 3 ................................................................................................................. 63
Section 8.1: General guidance on Principle 3 ....................................................................... 63
Section 8.2: Governance and Policy Performance Indicators ............................................... 64
Section 8.3: Fishery-specific management system performance indicators ......................... 69
Section 9: Glossary .................................................................................................................... 78
Section 10: Implementation Arrangements ............................................................................. 81
Appendix I: Risk-Based Methodologies .................................................................................... 82
Section A1: Introduction to the Risk-Based Framework ......................................................... 82
Section A2: Overview of the Risk-Based Framework .............................................................. 82
Section A3: Applying the Risk-Based methods ....................................................................... 84
Section A3.1: Scoping ........................................................................................................... 85
Section A3.2: Scale Intensity Consequence Analysis (SICA) ............................................... 85
Section A3.3: Productivity-Susceptibility Analysis (PSA) ...................................................... 89
Section A3.4: RBF reference table by Performance Indicator............................................... 93
Section B1: SICA scoring templates for MSC Principles 1 and 2 .......................................... 96
Document: Marine Stewardship Council Fisheries Assessment Methodology page 2 Date of issue: 1 May 2010 File: Fisheries_Assessment_Methodology_v2.1.pdf © Marine Stewardship Council, 2010
Section B2: SICA reference tables: ......................................................................................... 101
Section B3: SICA Consequence tables for MSC Principles 1 and 2. ................................... 102
Section B4: PSA reference tables ............................................................................................ 105
Section B5: Guidance on identifying species, habitats, and ecosystems impacted by a fishery under assessment. ............................................................................................... 107
Section B5.1: Identification of species ................................................................................. 107
Section B5.2: Identification of habitat types ........................................................................ 107
Section B5.3: Identification of ecosystems (community assemblages) ............................... 108
Section B6: Hazard Identification Tables ................................................................................ 109
Section B7: RBF Scoring Examples ........................................................................................ 113
Endnotes .................................................................................................................................... 118
LIST OF FIGURES
Figure 1. Assessment Tree Levels relevant to scoring fisheries .................................................... 9
Figure 2. Assessment Tree Structure with Performance Indicators and Scoring Guideposts ..... 11
Figure 3. Decision tree to determine which Performance Indicators are eligible to be scored using the RBF approach........................................................................................................ 13
Figure 4. Principle 1 Assessment Tree Structure ......................................................................... 24
Figure 5. Principle 2 Assessment Tree Structure ......................................................................... 42
Figure 6. Principle 3 Assessment Tree Structure ......................................................................... 63
Figure A1. Schematic overview of how the RBF is triggered and carried out within the scoring phase of the fishery assessment ........................................................................................... 83
Figure A2. Examples of diagnostic charts for displaying PSA values for each species. ............. 93
Figure B5.1. Examples of worldwide pelagic habitat boundaries ............................................... 108
Figure B5.2. Generic foodweb .................................................................................................... 108
LIST OF TABLES
Table 1. Comparison between the MSC‘s Principles and Criteria for Sustainable Fishing and the new Assessment Tree structure. ........................................................................................... 10
Table 2. Overview of RBF applicability to Performance Indicators for Principles 1 and 2. ........... 12
Table 3. Default weighting to be applied in using the FAM assessment tree. .............................. 15
Table 4. Consequence categories and associated guidepost scores for the SICA portion of the MSC assessment. ................................................................................................................. 19
Table 5. Guidance for terms ‗unlikely‘, ‗highly unlikely‘ and ‗evidence‘ for Habitats Component . 48
Table 6. Guidance for terms ―unlikely‖, ―highly unlikely‖ and ―evidence‖ for Ecosystem Component ............................................................................................................................ 50
Table A1. PI by PI overview of guidance for applying SICA and PSA. ........................................ 93
Table B1.1. Principle 1 SICA Scoring Template (Target Species). . ............................................ 96
Table B1.2. Scoring Template for PI 2.1.1 Retained Species. ..................................................... 97
Table B1.3. Scoring Template for PI 2.2.1 Bycatch Species. ....................................................... 98
Table B1.4. Scoring Template for PI 2.4.1 Habitats. .................................................................... 99
Table B1.5. Scoring Template for PI 2.5.1 Ecosystem. .............................................................. 100

Document: Marine Stewardship Council Fisheries Assessment Methodology page 3 Date of issue: 1 May 2010 File: Fisheries_Assessment_Methodology_v2.1.pdf © Marine Stewardship Council, 2010
Table B2.1. SICA spatial scale score table. ............................................................................... 101
Table B2.2. SICA temporal scale score table. ............................................................................ 101
Table B2.3. SICA intensity score table ....................................................................................... 101
Table B3.1. SICA Consequence Table for Principle 1, Target Species, and Principle 2, Retained Species and Bycatch Species. ............................................................................................ 102
Table B3.2. Principle 2 SICA Consequence Table for PI 2.4.1, Habitats. .................................. 103
Table B3.3. Principle 2 SICA Consequence Table for PI 2.5.1, Ecosystem. ............................. 104
Table B4.1. PSA Attribute table .................................................................................................. 105
Table B4.2. PSA Productivity attributes and scores ................................................................... 105
Table B4.3. PSA Susceptibility attributes and scores ................................................................. 105
Table B4.4. Selectivity attribute scores, example for hooks. ...................................................... 106
Table B6.1. Hazard identification table, examples of fishing activities ....................................... 110
Table B7.1. Sample SICA table for PI 1.1.1. .............................................................................. 114
Table B7.2. Sample SICA table for PI 2.2.1. .............................................................................. 115
Table B7.3. Sample SICA table for PI 2.4.1. .............................................................................. 116
Table B7.4. Sample PSA table for target and retained species with MSC equivalent scores. ... 117
Document: Marine Stewardship Council Fisheries Assessment Methodology page 4 Date of issue: 1 May 2010 File: Fisheries_Assessment_Methodology_v2.1.pdf © Marine Stewardship Council, 2010
Committee Responsible for this Assessment Methodology and Guidance
The MSC Technical Advisory Board is the Committee responsible for developing this assessment methodology and guidance. This assessment methodology and guidance is intended to be a living document and will be reviewed on an ongoing basis.

Document: Marine Stewardship Council Fisheries Assessment Methodology page 5 Date of issue: 1 May 2010 File: Fisheries_Assessment_Methodology_v2.1.pdf © Marine Stewardship Council, 2010
Document Control Version No. Date Description
1 21 July 2008 Approved for implementation in all new fisheries assessments after this date by the MSC Board of Trustees.
2 Released: 31 July 2009 Mandatory from: 1 November 2009
Second version of the FAM incorporating the RBF and approved for implementation in all new fisheries assessments after this date by the MSC Board of Trustees.
2.1 1 May 2010 Change to file name, insertion of copyright and document management information

Document: Marine Stewardship Council Fisheries Assessment Methodology page 6 Date of issue: 1 May 2010 File: Fisheries_Assessment_Methodology_v2.1.pdf © Marine Stewardship Council, 2010
Foreword
This assessment methodology and guidance document is aimed at certification bodies and their assessment teams who are conducting pre- and full assessments of fisheries against the MSC‟s Principles and Criteria for Sustainable Fishing. It is the culmination of nearly three years‘ work beginning in 2005 on an MSC-initiated project entitled ―The Quality and Consistency Project‖, the object of which is to ensure high quality, credible fishery assessments and certifications are based upon an assessment methodology that can be applied consistently across a majority of fisheries regardless of ecological, geographical, technological or other variations in characteristics. Both the assessment methodology and supporting guidance take the MSC‟s Principles and Criteria for Sustainable Fishing (the MSC standard) as their foundation and provide a new hierarchical, multi-criteria structure for assessing fisheries. This is called the default Assessment Tree and the intention is that this structure and the prescribed default set of performance indicators and scoring guideposts (PISGs) shall be used in all assessments unless a certification body can show just cause in writing why a variation should apply and approval is sought and received in writing from the MSC‘s Senior Fisheries Assessment Manager in accordance with TAB Directive D-017 v2. The default Assessment Tree and PISGs were produced through an international consultation process, expert drafting and testing sessions and expert calibration work. Version 1 of this assessment methodology and guidance was approved for release by the MSC Board of Trustees in July 2008 and applied to new fishery assessments against the MSC standard from July 2008 subject to the transition arrangements described in TAB Directive D-017. TAB Directive D-017 v2 sets out the procedures certification bodies shall follow in relation to the use of FAM v2. During 2008, the MSC conducted pilot studies of small scale/data deficient fisheries (SS/DD) under the GASS/DD project to trial a risk-based approach to assessing fisheries that are data deficient. Lessons learned from the trials provided the basis for development of the Risk-Based Framework (RBF) now integrated into this Version 2 Fisheries Assessment Methodology. Both FAM v1 and RBF v1 have been the subject of stakeholder consultations prior to this implementation of the combined FAM v2. Persons wishing to comment on this assessment methodology and guidance on an ongoing basis are encouraged to do so by sending an email to [email protected]. MSC Executive Release date: 31 July 2009

Document: Marine Stewardship Council Fisheries Assessment Methodology page 7 Date of issue: 1 May 2010 File: Fisheries_Assessment_Methodology_v2.1.pdf © Marine Stewardship Council, 2010
Purpose
This document is written for use by accredited and applicant certification bodies when undertaking assessments of fisheries against the MSC‟s Principles and Criteria for Sustainable Fishing, and as the assessment methodology to be used by those bodies. The purposes of this document are to:
Establish a consistent fisheries assessment methodology to enable all MSC accredited certification bodies to operate in a consistent and controlled manner.
Provide the transparency that is required of an international standard setting body for it to be credible with potential stakeholders, including governments, fishery managers, certification bodies, suppliers of fish and fish products, non-governmental organisations and the general public.
To specify a system that ensures the MSC Logo on fish or fish products is a credible assurance that the fish is derived from a well-managed and sustainable fishery, as defined by the MSC‟s Principles and Criteria for Sustainable Fishing and ultimately the MSC claim.
The specific objectives and benefits of the new Assessment Tree are to:
Improve the common understanding by certification bodies, fishery certification clients and stakeholders of how fisheries will be assessed against the MSC standard by simplifying the assessment structure and making it more transparent;
Increase consistency of interpretation and application of the MSC standard to ensure all fisheries are assessed in a similar and equitable manner;
Increase future certainty about reassessment for currently certified fisheries;
Improve the robustness and credibility of fishery assessments by providing greater clarity on required performance; and
Improve the efficiency of the assessment process while maintaining the integrity of the MSC‘s third party approach to certification.
Standing of this document
The use of this assessment methodology is mandatory and is to be used by all applicant and accredited certification bodies for fisheries certification, subject to the transition arrangements described in this document. Explanatory guidance is contained within this assessment methodology to aid its interpretation by certification bodies. This document prescribes the assessment methodology that a certification body shall implement when conducting an assessment of a fishery that submits for compliance with the MSC Principles and Criteria for Sustainable Fishing and MSC certification. The term “shall” is used to indicate those provisions that are mandatory. Any variation from the requirements of this document by a certification body shall be an exception. Such variations will only be permitted on a case-by-case basis after the certification body has demonstrated to the MSC‘s satisfaction that the exception meets the intent of this document and that the requirements of the MSC‟s Principles and Criteria for Sustainable Fishing are not undermined in any way. Any approved variations to this methodology must be documented and kept by the certification body. The term “should” is used to indicate those provisions that a certification body is expected to adopt. Any variation to provisions using the term “should” shall only occur where the CB has justified, documented and kept their variation.

Document: Marine Stewardship Council Fisheries Assessment Methodology page 8 Date of issue: 1 May 2010 File: Fisheries_Assessment_Methodology_v2.1.pdf © Marine Stewardship Council, 2010
Structure of this document
Overview
The first section gives a brief overview of the assessment approach in this methodology. Use of the Risk-Based Framework (RBF)
This section defines the processes and methodologies by which certain performance indicators in data-deficient fisheries may be assessed and scored using the Risk-Based Framework (RBF). Further information on the use of the RBF is integrated with the main text. The detailed methodologies required when applying the RBF are appended to the document. Guidance on Issues of Scope
This section defines ‗issues of scope‘ and describes two such issues for the purposes of assessing fisheries against the MSC standard. Weighting and Scoring Procedures
This section provides detailed descriptions of the procedures for weighting and scoring the performance of a fishery when using this assessment methodology. Default Assessment Tree, Performance Indicators and Scoring Guideposts (PISGs)
The next four sections contain detailed descriptions of the new Assessment Tree structure, including the PISGs for each of the three MSC Principles to be used in fishery assessments against the MSC standard. Each section contains specific guidance to help certification bodies interpret and apply the new structure. Glossary
Definitions are provided for terms used in the new structure, PISGs and relevant guidance. . Implementation Arrangements
This section summarises the mandatory and voluntary steps to be taken in the implementation of this methodology. The detailed provisions for the implementation of this version 2 of the FAM (including the RBF) are provided in TAB Directive D-017 v2.
Supporting Documents
This assessment methodology shall be read in conjunction with the main procedural methodology (the MSC Fisheries Certification Methodology) and other subsidiary documents that provide the mandatory certification methodology and more details in the form of guidance and advice on how to assess and certify fisheries and the responsibilities of a certification body. These supporting documents include: Mandatory documents – containing mandatory requirements
The MSC Principles and Criteria for Sustainable Fishing.
The MSC Fisheries Certification Methodology, Version 6, July 2006.
MSC Accreditation Manual, Version 5, August 2005.
TAB Directives, including new TAB Directive D-017 v2.
Guidance and advisory documents
Guidance for Certification Bodies on Stakeholder Consultation (Version 1, December 2004). The MSC will periodically produce and update guidance and advisory material to assist interpretation and implementation of mandatory Scheme Documents. The MSC has an obligation to advise certification bodies of any new requirements. Certification bodies have an obligation to inform themselves, and where relevant, their fishery certification clients, and implement new procedures in accordance with MSC instructions.

Document: Marine Stewardship Council Fisheries Assessment Methodology page 9 Date of issue: 1 May 2010 File: Fisheries_Assessment_Methodology_v2.1.pdf © Marine Stewardship Council, 2010
Section 1: Overview of Structure and Approach to the Assessment Methodology
1.1 Work in 2007-08 by the MSC, with many contributions from experts, stakeholders, peer reviewers and the Technical Advisory Board, resulted in a model for a new default Assessment Tree structure. This structure improves simplicity, understanding and clarity and reduces, by restructuring and consolidating, the number of performance indicators from the previous average of about 70 to 31 in the new structure.
1.2 Each of the MSC‘s Principles and Criteria for Sustainable Fishing has been integrated into the new structure. Some rearranging of concepts has occurred and some criteria will now be considered as issues of scope (see Section 3). A table comparing the Principles and Criteria with the new Assessment Tree is on the next page (Table 1, page 10).
1.3 The main difference between the new Assessment Tree and past practice is to organise the performance indicators into Components that focus upon the outcomes of the fisheries management process and the management strategies implemented that aim to achieve those outcomes. Therefore the new Assessment Tree structure is divided into three levels for the purposes of scoring (see Figure 1 below):
Level 1 – is the MSC Principle as described in the MSC‘s Principles and Criteria for Sustainable Fishing (also referred to as the MSC standard).
Level 2 – is the Component (see Glossary) which is a high level sub-division of the Principle.
Level 3 – is the performance indicator which is a further sub-division of the Principle and the point at which scoring of the fishery occurs.
A complete illustration of the new structure can be found in Figure 2 on page 11.
Level 1: Principle
Level 2: Component
Level 3: Performance indicators
Figure 1. Assessment Tree Levels relevant to scoring fisheries

Document: Marine Stewardship Council Fisheries Assessment Methodology page 10 Date of issue: 1 May 2010 File: Fisheries_Assessment_Methodology_v2.1.pdf © Marine Stewardship Council, 2010
Table 1. Comparison between the MSC‘s Principles and Criteria for Sustainable Fishing and the new Assessment Tree structure.
Principle 1 Principle 2 Principle 3 Scope
Perf
orm
an
ce i
nd
icato
rs
Sto
ck s
tatu
s
Refe
rence p
oin
ts
Recovery
& R
ebuild
ing
Perf
orm
ance o
f harv
est
str
ate
gy
Harv
est
contr
ol ru
les &
tools
Info
rmation /
monitoring
Assessm
ent
Sta
tus
Managem
ent
Info
rmation
Sta
tus
Managem
ent
Info
rmation
Sta
tus
Managem
ent
Info
rmation
Sta
tus
Managem
ent
Info
rmation
Sta
tus
Managem
ent
Info
rmation
Legal and/o
r custo
mary
fra
mew
ork
Consultation r
ole
s a
nd r
esps
Long t
erm
obje
ctives
Incentives f
or
sust.
fis
hin
g
Fis
hery
specific
obje
ctives
Decis
ion m
akin
g p
rocesses
Com
plia
nce a
nd e
nfo
rcem
ent
Researc
h p
lan
Monitoring a
nd e
valu
ation
Criteria 1 2 3 1 2 3 4 1 2 3 1 2 3 1 2 3 1 2 3 1 2 3 1 2 3 4 1 2 3 4 5
Principle 1. Target species
1 High productivity
2 If depleted, recovery plan
3 Reproductive capacity
Principle 2. Ecosystem
1 Functional relationships
2 Biodiversity and ETP spp
3 If depleted, recovery plan
Principle 3. Management system
A Management system criteria
A1 No controversial unilateral exemption
A2 Clear long-term objectives, etc
A3 Appropriate to cultural context and scale
A4 Observe legal and customary rights
A5 Dispute resolution mechanism
A6 Incentives, no negative subsidies
A7 Timely, adaptive, precautionary
A8 Research plan
A9 Stock assessments conducted
A10 Mgmt measures and strategies
A11 Compliance, MCS
B Operational criteria
B12 Bycatch and discards
B13 Habitat impacts
B14 Destructive fishing practices
B15 Operational waste
B16 System, legal and admin requirements
B17 Collaboration in data collection
1. Governance and
policy
2. Fishery specific
management
1. Outcome 2. Harvest strategy 1. Retained
species
2. Bycatch
species
3. ETP
species
4. Habitats 5. Ecosystem

Document: Marine Stewardship Council Fisheries Assessment Methodology page 11 Date of issue: 1 May 2010 File: Fisheries_Assessment_Methodology_v2.1.pdf © Marine Stewardship Council, 2010
Figure 2. Assessment Tree Structure with Performance Indicators and Scoring Guideposts

Document: Marine Stewardship Council Fisheries Assessment Methodology page 12 Date of issue: 1 May 2010 File: Fisheries_Assessment_Methodology_v2.1.pdf © Marine Stewardship Council, 2010
Section 2: Use of the Risk-Based Framework (RBF)
2.1 The Risk-Based Framework (Appendix I) may be used to evaluate and score specified outcome Performance Indicators within the MSC default assessment tree when data-deficiency is encountered.
2.2 Table 2 defines which PIs within the default assessment tree may be scored using each of the two RBF methodologies. PIs not scored using the RBF shall be scored using the FAM default assessment tree, taking account of any accompanying guidance specific to that PI. Special guidance for scoring PIs in cases where the RBF is used is provided in the guidance sections for relevant PIs as listed in Table 2 below.
Table 2. Overview of RBF applicability to Performance Indicators for Principles 1 and 2. PIs for which the RBF may directly be used are indicated in bold. PIs for which special guidance applies when the RBF is used for related PIs are indicated in italics.
Performance Indicator RBF applicability
1.1.1 Stock status Both SICA and PSA applicable
1.1.2 Reference points If RBF is used for 1.1.1 default score of 80 shall be given to this PI
1.1.3 Stock rebuilding Do not score if RBF is used for 1.1.1
1.2.1 Harvest strategy RBF not applicable
1.2.2 Harvest control tools and rules RBF not applicable
1.2.3 Information/monitoring RBF not applicable
1.2.4 Assessment of stock status If RBF is used for 1.1.1 default score of 80 shall be given to this PI
2.1.1 Retained species outcome Both SICA and PSA applicable
2.1.2 Retained species management strategy RBF not applicable
2.1.3 Retained species information/monitoring If RBF is used for 2.1.1. see Paragraph 7.1.29
2.2.1 Bycatch species outcome Both SICA and PSA applicable
2.2.2 Bycatch species management strategy RBF not applicable
2.2.3 Bycatch species information/monitoring If RBF is used for 2.2.1. see Paragraph 7.1.29
2.3.1 ETP Species outcome RBF not applicable to ETP species1
2.3.2 ETP Species management strategy
2.3.3 ETP Species information/monitoring
2.4.1 Habitats outcome SICA only, no PSA available2
2.4.2 Habitats management strategy RBF not applicable
2.4.3 Habitats information/monitoring RBF not applicable
2.5.1 Ecosystem outcome SICA only, no PSA available2
2.5.2 Ecosystem management strategy RBF not applicable
2.5.3 Ecosystem information/monitoring RBF not applicable
Principle 3 RBF not applicable to P33
Note: For endnotes, see final section of Appendix 1.
2.3 There are no prerequisites for a fishery to meet in order to be eligible to use the RBF for
any data-deficient PIs. Certifiers need not use the RBF for all outcome PIs. For example, when assessing Principle 2, a Certification Body may use the conventional PIs and scoring guideposts for PIs 2.1.1 (retained species) and 2.2.1 (bycatch species), but trigger the RBF on 2.4.1 (habitat) and 2.5.1 (ecosystem), if data are lacking only in those areas.
2.4 The precaution built in to the RBF methods always creates an incentive to use the conventional process when data are available
4. Certifiers shall use the conventional
FAM where sufficient data are available and enable this. All data which are available
Document: Marine Stewardship Council Fisheries Assessment Methodology page 13 Date of issue: 1 May 2010 File: Fisheries_Assessment_Methodology_v2.1.pdf © Marine Stewardship Council, 2010
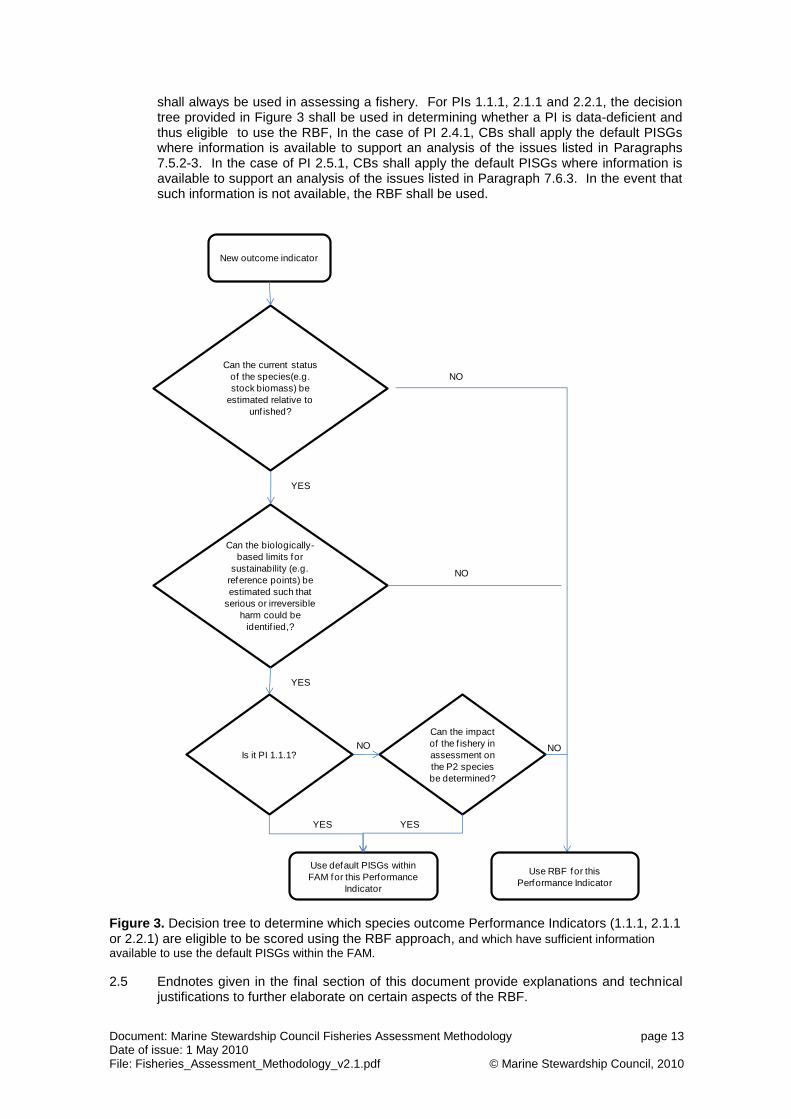
shall always be used in assessing a fishery. For PIs 1.1.1, 2.1.1 and 2.2.1, the decision tree provided in Figure 3 shall be used in determining whether a PI is data-deficient and thus eligible to use the RBF, In the case of PI 2.4.1, CBs shall apply the default PISGs where information is available to support an analysis of the issues listed in Paragraphs 7.5.2-3. In the case of PI 2.5.1, CBs shall apply the default PISGs where information is available to support an analysis of the issues listed in Paragraph 7.6.3. In the event that such information is not available, the RBF shall be used.
New outcome indicator
YES
Use default PISGs within
FAM for this Performance
Indicator
YES
NO
YESCan the impact
of the f ishery in
assessment on
the P2 species
be determined?
Can the biologically-
based limits for
sustainability (e.g.
reference points) be
estimated such that
serious or irreversible
harm could be
identif ied,?
Can the current status
of the species(e.g.
stock biomass) be
estimated relative to
unf ished?
NO
NO
NO
Use RBF for this
Performance Indicator
Is it PI 1.1.1?
YES
YES
YES
Figure 3. Decision tree to determine which species outcome Performance Indicators (1.1.1, 2.1.1 or 2.2.1) are eligible to be scored using the RBF approach, and which have sufficient information
available to use the default PISGs within the FAM.
2.5 Endnotes given in the final section of this document provide explanations and technical justifications to further elaborate on certain aspects of the RBF.

Document: Marine Stewardship Council Fisheries Assessment Methodology page 14 Date of issue: 1 May 2010 File: Fisheries_Assessment_Methodology_v2.1.pdf © Marine Stewardship Council, 2010
Section 3: Guidance on Issues of Scope
3.1 An issue of scope is one that determines eligibility for certification. In other words, a certification body shall be satisfied that the fishery is eligible to enter a full assessment against the MSC standard by determining the answer to any questions posed by an issue of scope.
3.2 There are two key issues of scope that are contained within the MSC standard (the Principles and Criteria for Sustainable Fishing) which were formerly scored during a full assessment of a fishery for certification. These are:
a) Principle 3, Criterion A1: A fishery shall not be conducted under a controversial unilateral exemption to an international agreement.
b) Principle 3, Criterion B14: A fishery shall not use destructive fishing practices such as poisons or dynamite.
Guidance for use – Controversial unilateral exemption
3.3 A fishery shall not be eligible for certification if it is conducted under a controversial unilateral exemption to an international agreement where that exemption and the actions of the State under that exemption undermine the sustainable management of the fishery.
3.4 In applying this issue of scope, certification bodies shall take the following into consideration:
a) controversial means creating a controversy in the wider international community rather than simply between two states;
b) unilateral means arising from the action of a single state;
c) exemption means a refusal to join or abide by the rules of an international management body, or the taking of a reservation or exception to a measure adopted by such body, when in either such case the effect is to undermine the sustainable management of the fishery; and
d) international agreements are those with a direct mandate for sustainable management of the resources affected by the fishery according to the outcomes expressed by MSC‘s Principles 1 and 2.
3.5 Certification bodies shall also take into consideration the relationship between international and coastal state jurisdictions recognised by relevant international agreements and whether any exemptions result in the implementation of a higher or lower level of conservation than currently agreed by an international management body. In all cases, the important point is whether the sustainable management of the fishery is undermined.
Guidance for use – Destructive fishing practices (Criterion B14)
3.6 A fishery shall not be eligible for certification if it utilises fishing with poisons or explosives. The only fishing practices that the MSC considers to be ―destructive fishing practices‖ in the context of an MSC assessment, at this time, are fishing with poisons or fishing with explosives.

Document: Marine Stewardship Council Fisheries Assessment Methodology page 15 Date of issue: 1 May 2010 File: Fisheries_Assessment_Methodology_v2.1.pdf © Marine Stewardship Council, 2010
Section 4: Weighting and Scoring Procedures
Section 4.1: Weighting
4.1.1 Table 3 below gives the weights that shall be assigned to each Component and PI within the Assessment Tree structure. Certification bodies shall use the MSC supplied scoring spreadsheet as the basis for reporting assessment results. Modifications to the spreadsheet may be made where required, so long as the clarity and functionality of the default version are retained. Weights in each level of the Assessment Tree (eg. Principle, Component or PI) shall sum to 1. Equal weighting shall be given to each branch of the Assessment Tree that lies at the same Level.
Table 3. Default weighting to be applied in using the FAM assessment tree.
Principle We
igh
t
Le
ve
l 1
Component We
igh
t
Le
ve
l 2
PI No.
Performance Indicator W
eig
ht
Le
ve
l 3
Weight in Principle
Either Or
One 1 Outcome 0.5 1.1.1 Stock Status 0.5 0.25 0.333 0.1667
1.1.2 Reference Points 0.5 0.25 0.333 0.1667
1.1.3 Stock Rebuilding -- -- 0.333 0.1667
Management 0.5 1.2.1 Harvest Strategy 0.25 0.125
1.2.2 Harvest Control Rules & Tools
0.25 0.125
1.2.3 Information & Monitoring 0.25 0.125
1.2.4 Assessment of Stock Status
0.25 0.125
Two 1 Retained species
0.2 2.1.1 Outcome 0.333 0.0667
2.1.2 Management 0.333 0.0667
2.1.3 Information 0.333 0.0667
Bycatch species
0.2 2.2.1 Outcome 0.333 0.0667
2.2.2 Management 0.333 0.0667
2.2.3 Information 0.333 0.0667
ETP species 0.2 2.3.1 Outcome 0.333 0.0667
2.3.2 Management 0.333 0.0667
2.3.3 Information 0.333 0.0667
Habitats 0.2 2.4.1 Outcome 0.333 0.0667
2.4.2 Management 0.333 0.0667
2.4.3 Information 0.333 0.0667
Ecosystem 0.2 2.5.1 Outcome 0.333 0.0667
2.5.2 Management 0.333 0.0667
2.5.3 Information 0.333 0.0667
Three 1 Governance and Policy
0.5 3.1.1 Legal/Customary Framework
0.25 0.125
3.1.2 Consultation, Roles & Responsibilities
0.25 0.125
3.1.3 Long Term Objectives 0.25 0.125
3.1.4 Incentives for sustainable fishing
0.25 0.125
Fishery Specific Management System
0.5 3.2.1 Fishery Specific Objectives
0.2 0.1
3.2.2 Decision Making processes
0.2 0.1
3.2.3 Compliance & Enforcement
0.2 0.1
3.2.4 Research Plan 0.2 0.1
3.2.5 Management Performance Evaluation
0.2 0.1

Document: Marine Stewardship Council Fisheries Assessment Methodology page 16 Date of issue: 1 May 2010 File: Fisheries_Assessment_Methodology_v2.1.pdf © Marine Stewardship Council, 2010
Section 4.2: Scoring using the FAM
Terminology
4.2.1 MSC‘s fishery assessment and certification processes use the following terminology (see Glossary):
a) Unit of certification – the fishery or fish stock (the biologically distinct population unit) combined with the fishing method/gear, the client and practice (the vessels pursuing the fish of that stock) that is the subject of certification.
b) Assessment – the process of evaluating a fishery against the performance indicators and scoring guideposts (PISGs).
c) Scientific Assessment – the scientific assessment of the status of a Component of the fishery/ecosystem (eg Stock Assessment, Ecosystem Impact Assessment).
d) Assessment Tree – the structure of performance indicators (PIs) and scoring guideposts (SGs) that make up the evaluation comprise:
i) Principles
ii) Components
iii) Performance Indicators
iv) Scoring Guideposts
e) Component – a high level sub-division of a Principle in an Assessment Tree.
f) Scoring Elements – in the case of Principles 1 or 2, used to mean a sub-division of individual parts of the ecosystem affected by the fishery, such as different species/stocks/sub-stocks or habitats within a Component.
g) Scoring Issues – here used to mean the different parts of a single scoring guidepost, where more than one part exists covering related but different topics.
h) In considering multiple elements, the text below refers to the following language:
i) Few:Most of the issues, taken to indicate minority:majority or less than half:greater than half. Eg if there were 6 issues, 1:5 and 2:4 would both be represented by the terms Few:Most
ii) Some:Some, taken to indicate a roughly equal split of issues.
Guidance on scoring procedure
4.2.2 Scoring is a qualitative process, involving discussion between team members and arrival at a joint agreed score. To avoid the implication of spurious accuracy within this system, scores for individual PIs should be normally assigned in divisions of 5 points. Assigning scores at smaller divisions needs to be justified in the narrative, for instance when considering complexity generated by multiple scoring issues and scoring elements (see below). Scores for each of the three Principles (as calculated based on the weighting in Table 3) shall be reported to the nearest one decimal place.
4.2.3 The only narrative guidance that is available is at the 60, 80 and 100 scoring guideposts (SGs). Intermediate scores must therefore reflect:
a) a failure to fully meet the upper SG narrative guidance while more than satisfying the lower SG narrative guidance; or
b) a failure of some of the scoring elements being considered under the Component to meet a SG.
4.2.4 The general approach is to:
a) award 60, 80 and 100 scores when the fishery meets the performance required at SG60, SG80 and SG100;

Document: Marine Stewardship Council Fisheries Assessment Methodology page 17 Date of issue: 1 May 2010 File: Fisheries_Assessment_Methodology_v2.1.pdf © Marine Stewardship Council, 2010
b) 70 where the fishery meets a performance level mid-way between SG60 and SG80; and likewise, 90 when the performance is mid-way between SG80 and SG100;
c) 75 when the performance is almost at SG80; 95 when it is almost at SG100; and 65 when it is slightly above SG60 and 85 when it is slightly above SG80.
d) Any scoring elements or scoring issues within a PI, or the PI itself, which fail to achieve SG60 represent a failure against the MSC standard, therefore the fishery would be ineligible for certification. In such cases, no score shall be assigned to that PI. Certification bodies shall record their rationale in narrative form for the element, issue or PI, rather than assigning actual scores of less than 60.
4.2.5 In practice, the general approach in Paragraph 4.2.4 shall be applied in the scoring of individual PIs using the sequential process below.
a) First, assess the PI against each of the scoring issues at the SG60 level.
i) If any one or more of the SG60 scoring issues is not met, the fishery fails as indicated in Paragraph 4.2.4(d) above. No further scoring is required for this PI.
ii) If all of the SG60 scoring issues are met, the PI must achieve at least a 60 score; proceed as below to determine if a higher score is justified.
b) If the PI has achieved the SG60 level, assess each of the scoring issues at the SG80 level.
i) If any one or more of the SG80 scoring issues is not met, the PI shall be assigned a condition (or conditions) as required by FCM v6 Section 3.4.
ii) If any one or more of the SG80 scoring issues are met, but not all are met, the PI shall be given an intermediate score (65, 70 or 75) reflecting its overall performance against the different SG80 scoring issues. If all of the SG80 scoring issues are met, the PI must achieve at least an 80 score; proceed as below to determine if a higher score is justified.
c) If the PI has achieved the SG80 level, assess each of the scoring issues at the SG100 level.
i) If any one or more of the SG100 scoring issues are met, but not all are met, the PI shall be given an intermediate score (85, 90 or 95) reflecting its overall performance against the different SG100 scoring issues.
ii) If all of the SG100 scoring issues are met, the PI shall be given a 100 score.
4.2.6 In Principle 2, many scoring elements (species or habitats) may be part of a Component affected by the fishery. To achieve consistency with the FCM, if any scoring element fails substantially to meet SG80, such that intervention would be required to ensure that it does meet it, the overall score for that element shall be less than 80 so that a condition can be raised, regardless of the situation with regard to other elements, some of which may be at the SG100 level. Therefore the actual score given shall reflect the number of elements that fail, and the level of their failure, rather than being derived directly as a numerical average of the individual scores for all elements (which might well raise the average score for a performance indicator above 80 if one element scored 100 even when one element was in need of intervention action). This is broadly consistent with the practice of CBs prior to the introduction of the FAM.
4.2.7 Although the assessment team will have to weigh up the balance of evidence, and must use its judgement in coming up with a final score, it shall do so logically and be able to fully document and explain its reasoning. Scores should first be determined for each scoring element by applying the process in Paragraphs 4.2.5(a)-(c) to each scoring element. The scores assigned to different scoring elements and their rationale should be reported in the scoring narrative. The following system should then be used to determine the overall score for the PI from the scores of the different scoring elements. This system combines a primary approach based on the combination of scores achieved by the individual scoring elements (the a) to i) list below), and the use of modifiers where appropriate in special cases (Paragraphs 4.2.8 and 4.2.9).

Document: Marine Stewardship Council Fisheries Assessment Methodology page 18 Date of issue: 1 May 2010 File: Fisheries_Assessment_Methodology_v2.1.pdf © Marine Stewardship Council, 2010
a) Score = 60: all elements meet SG60, and only SG60. Any scoring element within a PI which fails to reach SG60, represents a failure against the MSC standard and no score shall be assigned, in accordance with Paragraph 4.2.4(d) above.
b) 65: all elements meet SG60; a few achieve higher performance, at or exceeding SG80, but most do not meet SG80.
c) 70: all elements meet SG60; some achieve higher performance, at or exceeding SG80, but some do not meet SG80 and require intervention action to ensure they get there.
d) 75: all elements meet SG60; most achieve higher performance, at or exceeding SG80; only a few fail to achieve SG80 and require intervention action.
e) 80: all elements meet SG80.
f) 85: all elements meet SG80; a few achieve higher performance, but most do not meet SG100.
g) 90: all elements meet SG80; some achieve higher performance at SG100 but some do not.
h) 95: all elements meet SG80; most achieve higher performance, at SG100; only a few fail to achieve SG100.
i) 100: all elements meet SG100.
4.2.8 These scores should be modified where appropriate by the intermediate scores obtained by the individual elements that fail to meet an upper SG level (intermediate scores are those falling between two scoring guideposts, e.g. 65, 70, 75 scores falling between SG60 and SG80). For instance, in the situation where most elements did not meet SG80, indicating an overall score of 65, but generally scored high intermediate scores a higher overall score would be appropriate, for instance 70; but if the elements scored only low intermediate scores, then a score of 65 or below would remain appropriate. In the situation where only a few elements failed to achieve SG80, suggesting an overall score of 75, but achieved low intermediate scores, a lower score, such as 70, would be appropriate.
4.2.9 These scores can also be modified by the intermediate scores obtained by the individual elements that exceeded an upper SG level. For example, in the situation where some elements met SG100, but some only met SG60, suggesting a score of 70 under Paragraph 4.2.7(c), it may be appropriate to reflect the very high performance of some of the elements with an upwards adjustment to 75. This upward adjustment should never rise as high as 80 if the Assessment Team judges that a condition is required.
4.2.10 Rationale for all scores shall be explicitly documented in the report text in accordance with clause 3.3.3 of the FCM Version 6. For example, rationale for a score of 75 in Principle 2 (Retained Species, Management PI 2.1.2) might read:
a) There are five retained species other than the target species. For three of them catch by the fishery under evaluation is less than 5% of the total catch. There is a management strategy in place which is primarily designed for the fisheries which target these three species, and which recognises limit reference points that are based on sensible assumptions about the stock, and are used in conjunction with a periodic assessment to keep catches within a quota defined by the assessment and reference points. In the years when quota on these species has been reduced, those reductions have been reflected in reduced catches in the fishery under evaluation as well as reductions in the main target fisheries for these species (meeting SG80). A fourth species (hake) is a major target species of high value to another fishery, and is assessed and managed rigorously. The fishery under evaluation takes 20% of the catch of this species, and quotas are applied to the fishery under assessment as well as to its major target fishery and are effectively monitored and enforced (meeting SG100). However, one species (a valuable but only occasionally caught deep water species) currently lacks an effective management plan and is intrinsically vulnerable to the fishery that is being evaluated. The managers accept that it will be difficult in this multi-species fishery to maintain this species (and all the others) at BMSY, but
Document: Marine Stewardship Council Fisheries Assessment Methodology page 19 Date of issue: 1 May 2010 File: Fisheries_Assessment_Methodology_v2.1.pdf © Marine Stewardship Council, 2010
they do aim to keep it above levels that would impair reproduction. Monitoring is in place to identify when catch rates increase, but although there is a CPUE-triggered move-on rule there has been no work to indicate whether the trigger level for the move-on rule is set such that it is likely to be able to keep the stock above levels that would impair reproduction.
b) Based on the scoring guideposts, in the above scenario, most of the scoring elements achieve SG80 and above (one achieving SG100), and individual scores for the ones not meeting SG80 are medium or high intermediates as defined in Paragraph 4.2.7 above: thus the score would be 75. There are four scoring issues in SG80 (there is a strategy; it is based on information about the fishery and species; there is an objective basis to think that it will work; the strategy is being implemented), only one of which is really in doubt (objective basis to think it will work). The scoring element that falls short, the deep water stock, meets most of the requirements of SG80. Therefore an appropriate score is 75.
Section 4.3: Scoring a PI using results from the RBF SICA methodology
4.3.1 There are two circumstances where a SICA result is used to score an RBF PI:
a) where the ―worst case‖ scenario applied to the ―most vulnerable‖ scoring element for a given PI results in a SICA consequence score of 1 or 2, or;
b) where the SICA is used to score PI 2.4.1 (habitat outcome) or 2.5.1 (ecosystem outcome), since no PSA methodology is currently available for these components
2.
4.3.2 All PIs falling into either of the above categories shall use the scoring conversion in Table
4 below as a starting point. If there is no additional information or considerations to bring to bear on the PI, then this converted score shall be applied directly to the PI, with the accompanying scoring template and rationale provided as justification. However if there is any additional relevant information available which may justify modifying the MSC score within the 20 point range, such information may be brought to bear in reaching the final score for that PI. For example, if the SICA results in a consequence score of 2 (corresponding to an MSC score of 80), but additional information is available and presented that justifies raising this score, a final MSC score of 85 may be given.
Table 4. Consequence categories and associated guidepost scores for the SICA portion of the MSC assessment. Each of the Performance Indicators undergoing the SICA evaluation would be scored using this table.
Consequence category MSC equivalent score Target, bycatch, retained species
MSC equivalent score Habitats and ecosystems
1 100 100
2 80 80
3 - 60
>3 - <60
4.3.3 An example of PI 2.4.1 scored using the SICA is given in Section B7, Table B7.3.
Section 4.4: Scoring a PI using results from the RBF PSA methodology
4.4.1 If the SICA result for the ―worst case‖ scenario applied to the ―most vulnerable‖ scoring element for PI 1.1.1, 2.1.1, or 2.2.1 is moderate or worse (consequence score of 3 or higher), the SICA result is recorded for documentation, and the PSA results instead form the basis of the MSC score for the given PI.
4.4.2 For each PI triggering the PSA, there shall be one PSA score per species. For PI 1.1.1 this will usually be only the target species, but for PIs 2.1.1 and 2.2.1, there could be more than one retained or bycatch species (scoring elements) under consideration. In

Document: Marine Stewardship Council Fisheries Assessment Methodology page 20 Date of issue: 1 May 2010 File: Fisheries_Assessment_Methodology_v2.1.pdf © Marine Stewardship Council, 2010
order to arrive at the final MSC score in cases where there is more than one scoring element, the following guidance applies:
a) Convert the PSA score for each scoring element into an MSC equivalent score using the following quadratic equation
5 :
MSC Score = -11.965(PSA)2 + 32.28(PSA) + 78.259
b) Although the above equation will result in very precise MSC equivalent scores, these
shall be rounded to the nearest whole number.
c) Apply the following set of rules (consistent with Paragraph 4.2.7) to the set of MSC equivalent scores:
i. Score = 60: all elements have a score of 60, and only 60. Any scoring elements within a PI which fail to reach a score of 60 represent a failure against the MSC standard and no score shall be assigned.
ii. 65: all elements score at least 60; a few achieve higher scores, approaching or exceeding 80, but most do not reach 80.
iii. 70: all elements score at least 60; some achieve higher scores, approaching or exceeding 80; but some fail to achieve 80 and require intervention action.
iv. 75: all elements score at least 60; most achieve higher scores, approaching or exceeding 80; only a few fail to achieve 80 and require intervention action.
v. 80: all elements score 80.
vi. 85: all elements score at least 80; a few achieve higher scores, but most do not approach 100.
vii. 90: all elements score at least 80; some achieve higher scores approaching 100, but some do not.
viii. 95: all elements score at least 80; most achieve higher scores approaching 100; only a few fail to score at or very close to 100.
ix. 100; all elements score 100.
4.4.3 If there is no additional information or considerations to bring to bear on the PI, then this converted score shall be applied directly to the PI, with the accompanying scoring template and rationale provided as justification. However if there is any additional relevant information available which justifies modifying the MSC score within the 20 point range, such information may be brought to bear in reaching the final score for that PI.
4.4.4 An example of PI 2.2.1 with multiple retained species (i.e. landed and sold but not under MSC assessment) scored using the PSA is given in Section B7, Table B7.4.
4.4.5 As for a conventionally scored PI, any score >80 results in an unconditional pass for the PI.
4.4.6 Where any of the species scored in the PSA are at medium risk (i.e. <80 but >60) a condition is set on that Performance Indicator. This is similar to the setting of conditions for the conventionally scored PIs. A number of species could be in this category for a given PI, and the conditions shall address every ―medium risk‖ species. High risk for any of the species assessed in the PSA (guidepost scores <60) will result in failure for the Performance Indicator, unless convincing evidence can be presented that the risk was overestimated.
Scoring “main” vs. all retained or bycatch species using PSA
4.4.7 Recognizing that some retained or bycatch species may be encountered extremely rarely, and there may be little data available on them, it is possible for CBs to consider only ―main‖ retained or bycatch species when evaluating PI 2.1.1 or 2.2.1 using the RBF. However, if this is done, the final PI score must reflect the fact that only a subset of the total number of species has been evaluated. Therefore, it is not possible to score a PI at the 100 level if only main species are considered, and in all cases, the PI score must be

Document: Marine Stewardship Council Fisheries Assessment Methodology page 21 Date of issue: 1 May 2010 File: Fisheries_Assessment_Methodology_v2.1.pdf © Marine Stewardship Council, 2010
modified downward from the scoring regime outlined above. For example, if there are 10 species identified as bycatch, and 4 of them classified as main, if the assessment team only looks at those four and they all score at or above 90, it would be reasonable to score the PI at 85 unless the other 6 species are considered as well. The definition of ―main‖ in the context of retained species is defined in Paragraph 7.2.2 and for bycatch species in Paragraph 7.3.2.
Using the PSA to set conditions
4.4.8 The results from a PSA may be used to help set conditions in a fishery under assessment. Since the PSA score is derived from a set of attributes (productivity attributes, such as age at maturity; and susceptibility attributes, such as encounterability with the fishing gear), it can be easily seen which attributes have contributed to a high risk, and the risk can be reduced by changes in these same attributes: i.e. by the setting of a condition related to reducing susceptibility. Since productivity attributes are inherent to the species, these attributes cannot be changed through fisheries improvements. However, where individual productivity attributes have been defaulted to ―high risk‖ because of lack of information, these risk scores could be reduced if additional studies revealed the risk level was actually lower.
4.4.9 For example, if the risk score for a particular bycatch species was due to high encounterability, and high post-capture mortality, then the corrective action might be to restrict fishing to night time, or reduce the mortality when that species iscaptured. These actions can even be tested, by simulating changing the PSA attribute scores, and observing if the risk category changes. This ability to explore the effectiveness of meeting conditions is a strong advantage of analyzing a fishery using the attributes included in the PSA approach.
4.4.10 However, if a condition is triggered when assessing a PI using either the SICA or PSA, CBs should ensure that the corrective action proposed by the fishery is capable of raising the score to 80 without causing additional associated problems, and may be able to use the RBF to test for this possibility at the time of agreeing corrective actions. For instance, if the proposal was to decrease the susceptibility of a bycatch species by using a different type of gear, it would be important to ensure that any future RBF score with the alternative gear did not identify a consequential problem for another, currently unaffected, bycatch species.

Document: Marine Stewardship Council Fisheries Assessment Methodology page 22 Date of issue: 1 May 2010 File: Fisheries_Assessment_Methodology_v2.1.pdf © Marine Stewardship Council, 2010
Section 5: Default Assessment Tree, Performance Indicators and Scoring Guideposts
General Guidance
5.1 The focus for assessing a fishery against the MSC standard is on outcomes of fisheries management, for instance, the actual stock status of the target stock(s), as well as the actual fisheries management that is implemented that aims to achieve those outcomes. The new Assessment Tree structure reflects this focus.
5.2 The scoring guideposts have incorporated all the scoring elements or scoring issues required at each guidepost. In this sense the scoring guideposts are not ‗cumulative‘, as has been the approach applied in the past by some, but not all, certification bodies. A cumulative approach would have meant that all the performance elements specified at the 60 level are givens, but not specified, at the 80 guidepost where only the additional elements needed to achieve a score of 80 are specified. In order to achieve an 80 score, all the 60 elements and all the 80 elements would need to be met. Similarly, the elements specified at both 60 and 80 would be givens, and not specified, at the 100 guidepost. Rather than adopting this approach, instead, within the default Assessment Tree structure, all the scoring elements or issues at each guidepost that are needed to score a performance indicator have been articulated.
Assessment of special fishery types including enhanced fisheries
5.3 During this period of implementation of FAM v2, further guidance relevant to special fishery types including enhanced fisheries is likely to be developed by the MSC. This guidance will be made available in a later version of this document.
5.4 Until such guidance is made available, if a certification body is assessing a fishery which involves some level of enhancement, the CB shall follow the directions in TAB Directive D-001 v2: Enhanced Fisheries – Scope of Application of the MSC Principles and Criteria.
Guidance on Key Phrases
5.5 In the Assessment Tree for each Principle, care has been to taken to have a number of key words and phrases always mean the same thing. Guidance for each Principle‘s PISGs sometimes provides explanatory text about a specific key word or phrase, to avoid being cryptic about the intent of a specific PI or SG under that Principle. The use of explanatory text is not to be taken as restrictive on the meaning of the word or phrase in these individual applications. The key phrases for which guidance is provided here in this section are applicable across more than one Principle. In all cases the full interpretation, as defined below, is meant, every time a key word or phrase is used in the text.
ACHIEVING ITS OBJECTIVE – Means that the measure or strategy is having the
consequences that were expected when the measure or strategy was implemented. It is not necessary to have evidence that a long term goal or objective is being or has been achieved. However, it is necessary to have evidence that the measure or strategy is producing some results with regard to performance of the fishery, and the results are consistent with movement along an identified pathway towards a specific long term goal or objective.
IMPLEMENTED SUCCESSFULLY – Means that there is evidence that the fishery is following the practice(s) required by the measure or strategy, and that some expected consequences of that measure(s) are seen in the performance of the fishery. It is not necessary to have evidence that the measure or strategy has resulted in benefits to the Component of concern.
INTENDED CHANGES ARE OCCURRING – This phrase is used, when it is necessary to evaluate if a measure or strategy is actually making a difference. Often the goal or objective of the measure or strategy is a benefit to a species, habitat or

Document: Marine Stewardship Council Fisheries Assessment Methodology page 23 Date of issue: 1 May 2010 File: Fisheries_Assessment_Methodology_v2.1.pdf © Marine Stewardship Council, 2010
ecosystem that must accrue over a number of years. The certification process, however, often requires annual feedback that the measure or strategy is making a positive difference, particularly if conditions have been set. Hence, when the measure or strategy is implemented, it is necessary to identify some measurable response that can be taken as sufficient evidence that the measure is making a positive difference in the short term, and in some cases that the difference is large enough to be correcting an undesirable impact of the fishery. The property should be one that is consistent with being on the pathway to the long-term goal or objective, but does not have to be a measure of the long term objective itself. The measurable response that is used may be a direct effect of a measure, such as a reduction in bycatch rate corresponding to application of a mitigation measure, and such direct measures are generally preferred. However, sometimes it may be necessary to use ecosystem properties there are indirectly related to the measure, because even the intended short term benefit cannot be measured.
SPECIES – When ―species‖ is used in these Guidelines, it is intended to refer to any or all of stocks, populations, individual species, or groupings of species, depending on the context. In contexts such as under the Bycatch Species Component there may be a large number of individual species taken in a fishery, such that it is impractical and inefficient to attempt to address status and impact of each species individually. In such cases it is acceptable to group species with similar biological characteristics into species groups, and evaluate outcome status and fishery impact for the species group.
5.6 The terms ―unlikely‖, ―highly unlikely‖, ―likely‖, ―highly likely‖, ―evidence‖ (in Paragraphs
7.5.6 and 7.6.6) and ―high degree of certainty‖ are used in the scoring guideposts for Principles 1 and 2. The term ―probability‖ is not used to imply that a quantitative measure is required, but probability interpretations of the ‗likelihood‘ terms are provided for general guidance and for when quantitative measures are available. These probability interpretations are defined differently for Principle 1, for the Retained and Bycatch Species Components for Principle 2, for the ETP Component for Principle 2, and for the Habitats and Ecosystem Components for Principle 2. These differences are intentional. They reflect the differences in understanding about these Components, legal requirements or past MSC practice.

Document: Marine Stewardship Council Fisheries Assessment Methodology page 24 Date of issue: 1 May 2010 File: Fisheries_Assessment_Methodology_v2.1.pdf © Marine Stewardship Council, 2010
Section 6: Principle 1
The generic structure for the Principle 1 performance indicators (PIs) focuses on two key aspects of a fishery‘s performance:
1) Outcomes: The current status of the target stock resource; and 2) Harvest Strategy (Management): A precautionary and effective harvest strategy.
‗Outcome‘-related PIs consider the impact of the fishery on the target species, and particularly whether the species/stock is at sustainable levels. ‗Harvest Strategy (Management)‘-related PIs look at whether a management strategy is in place to ensure that harvest of the target species is maintained within sustainable levels. PIs under ‗Management‘ in Principle 1 shall consider the tools, measures or strategies that are being used specifically to manage the impact of the fishery on the target species. This differs from the considerations under Principle 3 where the overarching management system for the entire fishery and its operations are considered. There is a conscious effort to ensure that the Harvest Strategy (Management) PIs under Principle 1 do not duplicate considerations in Principle 3. The default intent is that the Outcome and Management Components are of equal importance to the performance of a fishery under Principle 1. This means that the default procedure shall be to equally weight these Components in the scoring process.
Figure 4. Principle 1 Assessment Tree Structure

Document: Marine Stewardship Council Fisheries Assessment Methodology page 25 Date of issue: 1 May 2010 File: Fisheries_Assessment_Methodology_v2.1.pdf © Marine Stewardship Council, 2010
Section 6.1: General guidance on Principle 1
6.1.1 All three Criteria under Principle 1 are considered to be assessed by the combination of performance indicators. Specifically, each of the outcomes required by the three Criteria is covered by the Outcome PIs. In addition, the Harvest Strategy (Management) PIs assess a fishery‘s ability to manage the impact on target stocks to achieve those outcomes sought by the three Criteria. Criterion 3, which does not have a specific Outcome PI, is accounted for by considering its impact on the formulation of the management strategy and the Harvest Control Rule (HCR) and tools. For example, the limit reference point should be set at a point where there is no danger that genetic changes in the stock would reduce reproductive productivity; and if there were a danger or a concern about this, the limit reference point should be increased accordingly; or, the problem might be addressed through changes to the Component of the stock that is harvested, for instance by changing the distribution or selectivity of fishing.
6.1.2 When conditions of certification are set, changes to the Harvest Control Rule or assessment method may be needed to make these conditions operational. If, in turn, these new HCRs or assessment methods would require different or additional information it will be important to ensure that the information required to implement those changes is either already available or is an additional requirement of certification.
Section 6.2: Outcome Performance Indicators
Guidance for use
6.2.1 There are two primary PIs and one supplementary PI for outcomes. The supplementary PI (reference points) could have been placed with the Management PIs. After careful consideration it was placed with the Outcome PIs because it is required to assess them and because of the interdependence between this PI and the two true Outcome PIs in this Component.
6.2.2 Taken together, these three PIs express the concept that sustainability of target stocks (i.e., a desirable outcome and therefore an unconditional pass against the MSC standard) comes from management behaviour that increases the probability that exploited biomass fluctuates around the BMSY target, or a higher target if this is warranted from a consideration of the trophic inter-dependencies of the target species, and decreases the probability that it will drop significantly towards the point where recruitment becomes impaired, either through recruitment overfishing or through genetic effects or imbalances in sex ratio. Accordingly, the following outcomes would attract scores of 80 or higher:
a) a more consistent fluctuation around the target level;
b) biomass levels in excess of target levels, which imply a lower probability of being below target levels;
c) a higher probability of being above a biomass limit reference point;
d) the setting of higher (precautionary) reference points; and
e) more rapid and clearly demonstrated rebuilding of stocks from areas close to the limit reference point to the target reference point.
6.2.3 Key terms are defined and provided in the Glossary. Some terminology was developed from a list of common terminology used in connection with management procedures (―MPs‖) by Rademeyer et al. (2007)
i.
i Rademeyer, R.A., Plaga´nyi, E´.E., and Butterworth, D.S. 2007. Tips and tricks in designing management procedures. ICES Journal of Marine Science, 64: 618–625.

Document: Marine Stewardship Council Fisheries Assessment Methodology page 26 Date of issue: 1 May 2010 File: Fisheries_Assessment_Methodology_v2.1.pdf © Marine Stewardship Council, 2010
Stock Status Performance Indicator (PI 1.1.1)
6.2.4 This performance indicator measures the outcome required by Criterion 1 (C1) of Principle 1 of the MSC standard: the current status of the target species resource relative to the target and limit reference points. The Criterion 3 outcome is considered to be implicitly considered within the assessment of a fishery against this Stock Status PI.
Guidance for use
6.2.5 The default performance requirement under this performance indicator is expressed in terms of biomass, and makes reference to two indicator points: the stock status at which there is an appreciable risk that recruitment is impaired; and a target reference point. The recruitment risk point is used in preference to a limit reference point to judge the status of the stock because management decision rules may vary in their application of limit reference points. Nevertheless, the guidance on PI 1.1.2 identifies default limit reference points for stocks with average productivity as being ½BMSY or 20% of B0. Such points shall be generally consistent with being above the point at which there is an appreciable risk that recruitment is impaired, though clearly for some short-lived stocks the actual point at which there is an appreciable risk that recruitment is impaired may be lower than 20% B0 and for some long-lived species it may be higher than this.
6.2.6 The default PISGs mean that:
a) Stocks for which there is a high degree of certainty of being above the point of recruitment failure and being at their target reference point, and for which this status has endured for a number of years suggesting a stable and effective management system, should result in scores of 100.
b) A score of 80 is appropriate for a stock being managed reasonably well, which is at or fluctuating around its target reference point, and where it is highly likely that the stock is above the point where there is an appreciable risk of recruitment being impaired.
c) Stocks that are likely to be appreciably and consistently below their target reference point and which are approaching the point at which recruitment would be impaired shall receive lower and lower scores, until it is only likely that the stock is above the point at which recruitment would be impaired, at which point it scores 60.
d) Stocks that are at or below the point at which recruitment is impaired shall result in scores lower than 60, leading to a failure against the MSC standard, therefore the fishery being ineligible for certification.
6.2.7 The terms ―likely‖, ―highly likely‖ and ―high degree of certainty‖ are used in this context, under Principle 1 to allow for qualitative evaluation (see also Paragraph 6.2.31). To put this into probabilistic context:
a) likely means greater than or equal to the 70th percentile of a distribution (i.e. there shall be at least a 70% probability that the true status of the stock is higher than the point at which there is an appreciable risk of recruitment being impaired);
b) highly likely means greater than or equal to the 80th percentile; and
c) high degree of certainty means greater than or equal to the 95th percentile.
6.2.8 Additional certainty that target reference levels can be maintained may be deduced when stock sizes have been above target reference levels. However, where a fishery is being fished down, certainty will depend to a certain extent on the degree of control over current high stock levels and the rate of fishing down being allowed by management or exerted by fishers.
6.2.9 Fluctuation refers to the variability over time around the target reference point, acknowledging that the magnitude of fluctuation will be influenced by the biology of the species, and that short-term trends may be apparent in such fluctuations. At SG80, there shall be evidence that the stock is at the target reference point now or has fluctuated around the target reference point for the past few years. At SG100, there shall be evidence that the stock has fluctuated around the target reference point for longer

Document: Marine Stewardship Council Fisheries Assessment Methodology page 27 Date of issue: 1 May 2010 File: Fisheries_Assessment_Methodology_v2.1.pdf © Marine Stewardship Council, 2010
periods of time. In determining relevant time periods over which these fluctuations are judged, various issues shall be considered, including the biology of the species and the scale and intensity of both the fishery and management system.
6.2.10 There may be situations where well-managed stocks do not have target reference points or do not have limit reference points. The stock will still need to be assessed in terms of the overall outcome objectives, i.e. for SG80 that the stock status is highly likely to be above the point at which there is an appreciable risk that recruitment is impaired, and will be at or around a level consistent with BMSY. Further guidance is given in Paragraph 6.2.18 under PI 1.1.2 and under the section entitled Surrogate Measures, also under PI 1.1.2.
6.2.11 As exceptions, proxy stock indicator points may be used in management systems based only on fishing effort, such as management of some short-lived species. The precise wording of the Stock Status SGs will need to be redrafted for management systems which are based purely on fishing mortality reference points. For the majority of stocks, for which stock status reference points based on fishing mortality are not relevant, the performance of indices of exploitation rate (eg, fishing mortality reference points) shall be evaluated against relevant benchmarks (such as FMAX or FLIM) in PI 1.2.2 in relation to the harvest control rule to ensure that biomass reference points are met.
6.2.12 Species fished as stock complexes, such as Pacific salmon, may be considered analogous to multi-species target species considered under guidance for PI 2.1.1. For each SG, there shall be evidence that, as an outcome, the levels of ‗likelihood‘ meet the levels of ‗likelihood‘ specified in Paragraph 6.2.7 above for each separate stock. It is acknowledged that in a multi-stock fishery context such as this the target levels of biomass (or some measure or surrogate of similar intent or outcome) for some species may be different from those usually applied to a single species (i.e. BMSY). The overall targets shall, however, be set so as to maintain the high productivity of the stock complex.
RBF guidance relevant to PI 1.1.1
6.2.13 If the RBF is used to score PI 1.1.1, both the SICA and PSA methodologies shall be conducted and MSC scores determined, regardless of the SICA outcome.
6.2.14 A fishery shall only be eligible to use the RBF for this PI in subsequent MSC assessments if, using the RBF, the MSC scores resulting from both the SICA and PSA analyses are 80 or greater. Low trophic level fisheries that are targeted over a large part of their range would not be expected to fall in this category. If the MSC score arising from an RBF assessment is less than 80, the following conditions shall apply to this PI:
a) There shall be measures put in place that will reduce the risk score within the specified timeframe of the condition.
b) There shall be information collected and analysis completed such that there is a direct measure of stock status (e.g. biomass) that can be compared with biologically based reference points by the time of reassessment. At reassessment, PI 1.1.1 shall then be scored using the scoring guideposts present in the FAM default assessment tree, and if necessary, the conventional PI 1.1.3 shall then be scored as well.
6.2.15 If the SICA and PSA scores are both 80 or greater, the RBF may continue to be used in subsequent assessments (surveillance audits and reassessment) as long as the scores do not drop below 80, in which case, Paragraph 6.2.14, above, shall apply.
Reference Points Performance Indicator (PI 1.1.2)
6.2.16 This supplementary performance indicator measures the appropriateness of the target and limit reference points used to assess stock status. This performance indicator could have been placed with the Harvest Strategy PIs but is placed with the Outcome PIs because it is required to assess them and because of the interdependence between this and the two true Outcome PIs under this Component.
Document: Marine Stewardship Council Fisheries Assessment Methodology page 28 Date of issue: 1 May 2010 File: Fisheries_Assessment_Methodology_v2.1.pdf © Marine Stewardship Council, 2010
Guidance for use
6.2.17 The MSC standard at SG80 shall be interpreted by Assessment Teams to determine whether limit reference points, set by management, are above the level at which there is an appreciable risk of impairing reproductive capacity, and that target reference points are set at a level ―consistent with BMSY‖.
6.2.18 “Consistent with BMSY‖ means close to or at BMSY or some other measure or surrogate with similar intent or outcome, which maintains a high productivity of the stock and is a level well above the point at which recruitment might be impaired.
6.2.19 Default assumptions relating to target and limit reference points (TRP and LRPs) are provided in the following sub-sections. The setting of reference points by management should include consideration of normal stock recruit relationships as well as any potential impacts on reproductive capacity of changes to genetic structure or sex composition, and the guidance on consideration of trophic level given in Paragraph 6.2.25.
a) In the case where neither BMSY nor BLIM are analytically determined, the following default reference points may be appropriate depending on the species: TRP=BMSY=40%B0; LRP=BLIM=20%B0=½BMSY.
b) In the case where either BMSY or BLIM are analytically determined, those values should be used for reference points unless additional precaution is sought.
c) In the case where BMSY=TRP is analytically determined to be greater than 40%B0, and there is no analytical determination of the LRP, the default LRP should be ½BMSY. This case covers the situation of low productivity stocks, where higher default LRPs may be justified.
d) In the case where BMSY=TRP is analytically determined to be lower than 40%B0 (as in some highly productive stocks), and there is no analytical determination of the LRP, the default LRP should be 20%B0 unless TRP=BMSY<27%B0, in which case the default LRP should be 75%BMSY.
e) For stocks with average productivity, where BMSY is not analytically determined but assumed to be 40%B0 and the TRP is set greater than 40%B0 for precautionary reasons, the default LRP should be 20%B0=½BMSY unless it is analytically determined. This covers situations where the management authority has deliberately chosen a conservative TRP, but where the default BLIM is still appropriate.
6.2.20 In order to satisfy Paragraph 6.2.19, reference points should be consistent with ecosystem productivity which may change from time to time as marine environments change naturally, for instance under conditions of regime shift. If changes in the productivity of the fishery are due to natural environmental fluctuations, it would be appropriate to reassess the reference points to accommodate such changes in productivity levels. However, if the productivity of the fishery is being affected through human-induced impacts (either directly from the fishery or from other sources such as pollution or habitat degradation), no changes to reference points are justified. Such impacts should be resolved and the fishery should receive a reduced score until this is done.
6.2.21 The Assessment Team should first establish whether the reference points, or implied reference points, are appropriate for the stock. It is assumed that all management systems will have reference points. Even if these are not stated explicitly they should be implicit within the decision rules or management procedures, and the fishery should be assessed on these implicit reference points. For example, an explicit use of only a target reference point should include some implicit consideration of a limit reference point, and likewise a management system that uses only a limit reference point will have some implicit acknowledgement of targets.
6.2.22 In these situations, both explicit and implicit reference points need to be consistent with the scoring guideposts. For example, if a management strategy is based solely around a target reference point, the harvest control rule, when combined with the target reference point shall ensure that the stock will remain well above the level where there is an appreciable risk that recruitment would be impaired and ensure that the exploitation rate
Document: Marine Stewardship Council Fisheries Assessment Methodology page 29 Date of issue: 1 May 2010 File: Fisheries_Assessment_Methodology_v2.1.pdf © Marine Stewardship Council, 2010
is reduced as this point is approached. This is an implied limit reference point. Equally, a management strategy based solely around a limit reference point shall imply that there is a target reference point close to or at BMSY (or some other measure or surrogate that maintains the stock at high productivity), and at a level that is well above the limit reference point.
6.2.23 As established by TAB Directive D-004, ―there is no necessary connection between an MSC guidepost and a government set reference point. If the government set reference point meets the needs and standards of the MSC assessment, then a certification body‟s assessment team may well choose to use it. But it is not necessary to use the government reference point and it should not be used if the assessment team does not consider that it meets the needs and standards of an MSC assessment‖.
6.2.24 In some cases management defines a target range rather than a level, in which case the PIs for Stock Status and Reference Points should be interpreted in relation to this range.
6.2.25 There may be situations where the limit reference point is set higher than the point at which there is an appreciable risk that recruitment is impaired. Where this results in more precautionary management, the SG100 statement about ―following consideration of relevant precautionary issues‖ would apply.
6.2.26 To ensure precaution in relation to ecological role, consideration shall be given to the trophic position of target species, in particular species low in the food chain.
a) At SG60 the fishery shall have adopted reference points that are based on justifiable and reasonable practice associated with the species type, For example, generic reference points appropriate for low trophic level, short lifespan, high fecundity species would be those appropriate to such species, rather than those appropriate for high trophic level, long lived, low fecundity species.
b) At SG80 scoring for low trophic level species shall take into account whether the management system has explicitly considered the trophic position of the target stock and acted appropriately. Should the consideration of the ecological role of the target species indicate a strong interdependence such that maintaining the stock at levels consistent with BMSY would cause significant changes to the ecosystem (see PI.2.5.1) an expectation of the SG would be that the target reference point should have been appropriately adjusted. Additional guidance on appropriate actions is given in Paragraph 6.2.28 below.
c) At SG100 the intention is that a high degree of certainty is appropriate when considering the ecological role of the stock. For mid and high trophic level species scoring at SG100 shall take into account whether the management system has considered the trophic position of the target stock and acted appropriately. For low trophic level species, for a fishery to score 100, consideration of the ecological role of the stock shall include more certainty that the target reference point is appropriate given its ecological role than at SG80, such as adoption of even higher target levels or a more thorough analysis of its ecological role.
6.2.27 To reflect the concern that harvesting a low trophic level species poses a greater inherent risk to ecosystems than harvesting mid and high trophic level species, in the absence of specific consideration, an appropriate default assumption would be that low trophic level species should be maintained at stock levels higher than BMSY. An alternative approach, that of managing to higher levels of probability that the stock is above target and limit reference points, could also be acceptable. The effect of active consideration of the trophic dependencies of the target species by the management system could, however, mean that a higher trophic level species whose removal to BMSY is likely to cause a trophic cascade is instead maintained at a higher level of biomass; but a low trophic level species on which the ecosystem does not show significant dependence might be maintained at BMSY.
6.2.28 An assessment of the trophic position of the species and the information required to make this assessment is considered under Principle 2, but the result of that should be incorporated into the development of precautionary reference points under Principle 1. It should include consideration of whether different reference points are required for
Document: Marine Stewardship Council Fisheries Assessment Methodology page 30 Date of issue: 1 May 2010 File: Fisheries_Assessment_Methodology_v2.1.pdf © Marine Stewardship Council, 2010
different Components of the stock, for example where there is a high dependency of predators on juvenile fish.
6.2.29 Although it may generally be the case that limit reference points are set at the point that reproductive capacity starts to be appreciably impaired, for some fisheries, especially those for small pelagic species and annual species where there the stock recruit relationship is very steep, management may choose to set a limit reference point above this level. Such action should attract scores in the range 80 to 100 with the intent that the overall score reflects the very low likelihood of reproductive capacity ever being impaired if such a limit reference point was used.
6.2.30 Some species, such as Pacific salmon, are fished as stock complexes in a way which can be considered analogous to multi-species target species considered under guidance for PI 2.1.1. It should be acknowledged that in a multi-stock fishery context such as this, a practical management approach may require that the target levels of biomass for some individual stocks within the complex be different from those usually applied to a single species (i.e. a level consistent with BMSY or some surrogate or measure with similar intent). In these situations the overall target reference points should aim to be consistent with the intent of the performance indicator, and maintain the high productivity of the stock complex.
Surrogate Measures
6.2.31 A comment often received by MSC is that articulation of performance indicators and scoring guideposts in terms of biomass and fishing rate metrics creates the appearance that the MSC standard is not well suited for other than large industrial fisheries with formalised stock assessments and biomass based reference points. Specific examples are given below of specific instances where other measures or surrogates that serve the same purpose may be used. In these cases, the terms ―likely‖, ―highly likely‖, and ―high degree of certainty‖ may be interpretable either qualitatively (e.g. through analogy with similar situations, plausible argument, empirical observation of sustainability and qualitative risk assessment) or quantitatively (e.g. through measured data from the relevant fishery, statistical analysis, quantitative risk assessment and quantitative modelling).
6.2.32 Relatively sedentary bivalves often have fishery management trigger points based on population densities collected through systematic surveys, where these index densities are established based on the species population dynamics and the inherent productivity of the habitat and environmental conditions. There may be no formal stock assessment but yield is calculated on a proportion of the observed biomass and the harvested fraction determined on empirical evidence from historical catches and their consequences.
6.2.33 In the case of some crustacean species, fishery management strategies might seek to protect from harvest the complete female reproductive capacity in the population (i.e., single sex harvest). The trigger or reference points involved could relate to metrics such as percent fertilised eggs and or other female population indicators that are evaluating the management systems effectiveness at achieving its goal.
6.2.34 In salmon and other semelparous species different management metrics may be used, for instance numerical escapement goals that on the average can be expected to maximise the long-term numerical yield of adult or maturing fish. A variety of terms are used for target reference points in this case, such as MSY or optimum escapement goals, and given the normal annual freshwater and marine survival fluctuations that are typical for salmon populations, an effective management outcome is typically considered to be spawning escapements that fluctuate to some extent above and below the target. These are surrogates for BMSY based targets, even though MSY and BMSY may not be used explicitly nor may it always be possible to estimate them. Further, given the extensive population structure inherent with salmon life history, resource managers often establish index populations that they use to establish and monitor achievement of spawning escapement outcomes to verify the effectiveness of a fishery management

Document: Marine Stewardship Council Fisheries Assessment Methodology page 31 Date of issue: 1 May 2010 File: Fisheries_Assessment_Methodology_v2.1.pdf © Marine Stewardship Council, 2010
programme on the constituent populations within runs and management units defined for fishery management purposes.
6.2.35 Limit reference points for salmon populations are sometimes expressed as critical spawning escapement thresholds, levels below which populations could be particularly vulnerable if subject to wide fluctuations in marine or freshwater survival conditions, including impacts on freshwater productive capacity due to habitat damage or degradation. This is a surrogate for the point at which there is an appreciable risk of impairing recruitment, and their use as limit reference points would be consistent with the PISGs. An indexing approach is often used to define these triggers. Some salmon fisheries managed by MSY escapement goals may not have explicit limit reference points. This is acceptable so long as the harvest strategy acknowledges some level of critical escapement threshold, for instance, through a combination of target reference point and harvest control rule such that the stock will remain well above the level where there is an appreciable risk that recruitment would be impaired.
6.2.36 While these are only provided as some initial generalised examples they should serve to demonstrate the envisioned use of other measures or surrogates to traditional biomass based reference points and stock status indicators when applying the MSC standard to a wide range of circumstances. To repeat: the important features of SG80 are that a limit reference point is set above the point where there is an appreciable risk of recruitment failure, and a target reference point maintains the stock well above the limit reference point, and at levels of production and stock sizes consistent with BMSY.
RBF guidance relevant to PI 1.1.2
6.2.37 When the RBF is used to score PI 1.1.1, PI 1.1.2 (reference points) shall receive a score of 80
6.
Stock Rebuilding Performance Indicator (PI 1.1.3)
6.2.38 This performance indicator measures the fishery‘s performance in relation to the requirements of Principle 1, Criterion 2: the recovery and rebuilding of stocks that are currently depleted. It would normally be assumed that a well constructed harvest strategy would include consideration of the situation where the stock becomes depleted, but that in this situation additional measures may also be required. The performance indicator is a mixture of management and outcome.
Guidance for use
6.2.39 Consistent with previous MSC Fisheries Certification Methodologies, this performance indicator shall only be scored when the Principle 1, Stock Status PI 1.1.1 reveals that a stock is depleted, as defined below and in the Glossary.
a) A stock is depleted when it is consistently below the target reference point. Stocks scoring less than 80 on PI 1.1.1 would normally fall into this category. The critical decision over whether a stock is depleted is its performance relative to the target reference point, and whether it can be considered to be fluctuating around it (therefore is not depleted) or to have dropped significantly towards the point at which recruitment is impaired (therefore is depleted). In considering this issue, certification bodies shall also consider other relevant information including recent biomass trends (or other measures or surrogates with similar intent or outcome).
b) Depleted stocks should always have a score of above 60 under the Stock Status PI (PI 1.1.1). Stocks whose status is currently below the point at which recruitment is impaired will not be eligible for certification even if there are recovery plans or programmes in place which are effectively increasing the status of the stock, until such time as the stock status meet SG60.
6.2.40 Provision for the situation for where the stock becomes depleted should be a normal consideration of a harvest strategy, and could include a pre-agreed strategy which will rebuild stocks to the target reference point so that they once again comply with SG80 of
Document: Marine Stewardship Council Fisheries Assessment Methodology page 32 Date of issue: 1 May 2010 File: Fisheries_Assessment_Methodology_v2.1.pdf © Marine Stewardship Council, 2010
the Stock Status PI. In cases where stocks were not depleted at the time of assessment, but then become depleted during a period of MSC certification, rebuilding strategies and monitoring shall be put in place within a maximum of 1 year after the availability of the determination of a depleted status.
6.2.41 This performance indicator does not refer to ―formal recovery plans‖ acknowledging that in some jurisdictions, but by no means all, this terminology carries specific legislative or regulatory meaning. The scoring guideposts refer to ―recovery strategies‖. These may or may not be binding in a statutory context. The material concerns are that the recovery strategies are in place and, depending on the performance level (60, 80 or 100) are monitored and effective over varying specified timescales.
6.2.42 SG80 ideally requires evidence of rebuilding. However, it is acknowledged that in the early stages of depletion the stock will not have been able to demonstrate any period of recovery. In this case, to achieve a score of 80 a fishery shall be able to demonstrate to the certification body that it is highly likely that the stock will recover under the actions being taken, and this demonstration shall be either through robust simulation testing; through evidence that the measures taken had successfully recovered a stock in the past; or that there is a high expectation that the stock will start recovering in the near future (for instance if a large year-class is just about to recruit).
6.2.43 SG100 makes reference to ―the shortest practicable timeframe‖, and is a higher standard than ―within a specified timeframe‖ under SG80. Clearly the fastest recovery will usually include a reduction of fishing mortality to zero, but this may not be practicable where even under such a regime recovery would be too slow for the industry to still be in existence when the stock is recovered. The practicality of requiring a zero catch in all fisheries that catch the assessed species (as target or non-target), and in mixed species fisheries may be taken into consideration in judging what timeframe might be consistent with the SG100 language.
RBF guidance relevant to PI 1.1.3
6.2.44 PI 1.1.3 shall not be scored when the RBF is used to score PI 1.1.1.7 Instead, the
guidance in Paragraphs 6.2.13 - 6.2.15 concerning mandatory conditions on PI1.1.1 shall apply in cases where PI 1.1.1 receives a score between 60 and 80.
Section 6.3: Harvest Strategy (Management) Performance Indicators
6.3.1 There are four performance indicators that assess the performance of the harvest strategy. In addition to a performance indicator which considers the overall performance of the harvest strategy, three further performance indicators consider key elements of harvest strategies: the control rules and tools in place, the information base and monitoring, and the assessment method.
a) All four Harvest Strategy PIs are expressed in relation to achieving outcomes, in particular the harvest strategy shall be appropriate to achieving the management objectives expressed in the target and limit reference points.
b) For low trophic level species the target and limit reference points need to take into account the ecological role of the stock for the fishery to score 80 or above under PI 1.1.2. Clearly, the harvest strategy, control rules, information requirements and assessment also need to be consistent with this distinction for low trophic level species.
Harvest Strategy Performance Indicator (PI 1.2.1)
6.3.2 This performance indicator scores the overall performance of the harvest strategy, particularly the way that the different elements work together to keep the stock at levels consistent with reference points.

Document: Marine Stewardship Council Fisheries Assessment Methodology page 33 Date of issue: 1 May 2010 File: Fisheries_Assessment_Methodology_v2.1.pdf © Marine Stewardship Council, 2010
Guidance for use
6.3.3 Harvest strategy is defined in the Glossary.
6.3.4 The word ―evaluated‖ at SG100 means ‗tested for robustness to uncertainty, appropriate to the scale and intensity of the fishery‘. Such evaluation may, for example, range from a subjective stakeholder process in small scale/data deficient (SS/DD) fisheries to quantitative Management Strategy Evaluation (MSE) as appropriate to the fishery.
6.3.5 Testing means the involvement of some sort of structured logical argument and analysis that supports the choice of strategy. Testing can include the use of experience from analogous fisheries, empirical testing (for example practical experience of performance or evidence of past performance) and simulation testing (for instance using computer-intensive modelling such as management strategy evaluation (MSE)).
Harvest Control Rules and Tools Performance Indicator (PI 1.2.2)
6.3.6 This performance indicator assesses the control rules and actions that management takes in response to changes in the fishery and/or changes in status in relation to reference points.
Guidance for use
6.3.7 This performance indicator should be applied as an assessment of the design and plausibility of Harvest Control Rules and management tools to control exploitation of the stock(s) under assessment.
6.3.8 Harvest Control Rules and/or management tools need to be based on plausible hypotheses about resource dynamics and be reasonable and practical, meaning that those measures possess a substantial likelihood of success. The basis for plausibility and practicality of design should be considered in relation to the scale and intensity of the fishery, for instance utilising empirical information; relevant science; or model based approaches such as MP and MSE.
6.3.9 The requirement that a Harvest Control Rule reduces exploitation rates as the limit reference point is approached should not be necessarily interpreted as requiring the control rule to deliver an exploitation rate that is a monotonically decreasing function of stock size. Any exploitation rate function may be acceptable so long as it acts to keep the stock above the limit reference point and attempts to maintain the stock at the target reference point. This outcome necessarily includes the requirement that the harvest control rule should act to cause stocks to rebuild to the target reference point when they are below it; maintenance of a stock at a level just above the limit reference point would not be acceptable. Furthermore, a reduction of exploitation rate may not necessarily always mean that the control rule requires a reduction in "total" exploitation rate, but instead could, for instance, involve reducing exploitation rate on parts of the stock (eg, by age or sex). Finally, reductions in exploitation rate are assumed to primarily refer to reductions in catches and effort, and not to gear modifications unless these have the effect of reducing catches/effort.
6.3.10 At SG100 the requirement to have a Harvest Control Rule that keeps stocks well above limit reference points should be interpreted as requiring additional precaution to be built into the control rules.
6.3.11 The requirement that the control rules and/or management actions are designed to take into account uncertainty can be supported by testing, where testing means the employment of some sort of structured logical argument and analysis that supports the choice of strategy. Testing can include the use of experience from analogous fisheries, empirical testing (for example practical experience of performance or evidence of past performance) and simulation testing (for instance using computer-intensive modelling such as MSE).
Document: Marine Stewardship Council Fisheries Assessment Methodology page 34 Date of issue: 1 May 2010 File: Fisheries_Assessment_Methodology_v2.1.pdf © Marine Stewardship Council, 2010
Information and Monitoring Performance Indicator (PI 1.2.3)
6.3.12 This performance indicator addresses the information base for the management of the target stocks. As noted above, the information and monitoring required for the management of stocks should only include that which is needed to inform the harvest strategy, Harvest Control Rules and control tools.
Guidance for use
6.3.13 A large number of performance indicators in previous Assessment Trees have been devoted to information. In the default Assessment Tree these items are collapsed into one performance indicator. While this is unlikely to appreciably affect certification outcomes, organising the information sensibly may present certification bodies with some challenges. It is suggested that information sources be grouped together into categories (see a) to f) below) and their adequacy in respect of informing the harvest strategy be evaluated as described below.
6.3.14 The intent of SG60 is that while only a limited amount of information may be available and regularly monitored this would normally be considered sufficient to support the harvest control rule under the most likely stock hypothesis.
6.3.15 Information will be required to undertake the assessment of stock status, to inform the design of a harvest strategy and effective harvest control rules, and for the effective operation of harvest control tools. The certification body should identify which information from the following groupings is relevant to both the design and operational phases of the harvest strategy. The evaluation should proceed with respect to these data, with a combined score for this performance indicator being determined on the quality of data available, weighted by category (see a)-f) below) on the relevance to the harvest strategy, harvest control rule and management tools. Information categories include:
a) Stock structure could incorporate information describing the distribution and geographical range of the stock, the relationship of the geographical range to the harvest control, and the age, size, sex and genetic structure of the stock.
b) Stock productivity could incorporate maturity, growth, natural mortality, density dependent processes, the stock recruit relationship and fecundity.
c) Fleet composition could incorporate information on associated effort by gear type/method of capture, including fleet characteristics in both targeted and non-targeted fisheries taking the species. The general assumption is that information is required for the stock as a whole, but better information would usually be expected from the fishery unit that is being assessed.
d) Stock abundance could incorporate information relating to absolute or relative abundance indices including recruitment, age size sex and genetic structure of the stock. Reflecting the guidance on surrogate measures under PI 1.1.2, the requirement for ‗stock abundance‘ information at SG60 and SG80 may be met by the use of surrogate indicators that provide an adequate proxy for stock abundance.
e) Fishery removals could incorporate information describing the level, size, age, sex and genetic structure of landings, discards, illegal, unreported, unregulated, recreational, customary and incidental mortality of the target stock by location and method of capture. The general assumption is that information is required for the stock as a whole, but better information would usually be expected from the fishery unit that is being assessed.
f) Other data may include environmental information such as temperature, weather and other factors which may influence fish populations and fishing.
6.3.16 ―Sufficient information‖ at the SG80 level means that all information required to implement the harvest strategy is available at a quality and quantity necessary to demonstrate achievement of the SG80 outcome PI (1.1.1). The intent behind the consideration in SG100 that additional information should be available that may not be not directly relevant to the current harvest strategy, is that the information monitoring system should take into account information relevant to a wider set of possible stock

Document: Marine Stewardship Council Fisheries Assessment Methodology page 35 Date of issue: 1 May 2010 File: Fisheries_Assessment_Methodology_v2.1.pdf © Marine Stewardship Council, 2010
hypotheses than addressed by the current harvest strategy. This is essentially ―future proofing‖ the management system against alternative hypotheses and changes in the system.
6.3.17 The distinction between the second and third scoring issues at SG80 relates to the relative amount or quality of information required on fishery removals. The second scoring issue relates to fishery removals specifically by those vessels covered under the Unit of Certification which need to be regularly monitored and have a level of accuracy and coverage consistent with the harvest control rule. The reference to ‗other‘ fishery removals in the third scoring issue relates to vessels outside or not covered by the Unit of Certification. These require good information but not necessarily to the same level of accuracy or coverage as that covered by the second scoring issue.
Assessment of Stock Status Performance Indicator (PI 1.2.4)
6.3.18 This performance indicator considers how the fishery assesses information to provide an understanding of stock status and the effectiveness of the harvest strategy. Some harvest strategies assess stock status using empirical indicators and do not require use of quantitative assessment models. In such cases, the Assessment PI will be scored relative to the robustness of that indicator (which may also have contributed to the score for the Information PI).
Guidance for use
6.3.19 This performance indicator refers to stock assessments (see definition) but in some circumstances, particularly under SG100, it may be useful to consider whether MP/MSE approaches were used to test the robustness of the stock assessment to uncertainty and alternative hypotheses.
6.3.20 For some harvest strategies stock assessment methods may not be model based but based on stock status relative to empirical reference points (eg, catch rate, density, survey abundance, among other things), and decision rules may be constructed of rules using these indices rather than analytical assessments. Other harvest strategies may utilise complex analytical models. In all cases the assessment methods shall have been tested and found to be reliable.
6.3.21 For SG80, when considering the assessment appropriate for the stock with regard to stock complexes, such as salmon stocks, Assessment Teams should take into account that the level of assessment required for individual stocks within stock complexes should reflect their ecological importance.
RBF guidance relevant to PI 1.2.4
6.3.22 When the RBF is used to score PI 1.1.1, PI 1.2.4 (Assessment of stock status) shall receive a score of 80
8.
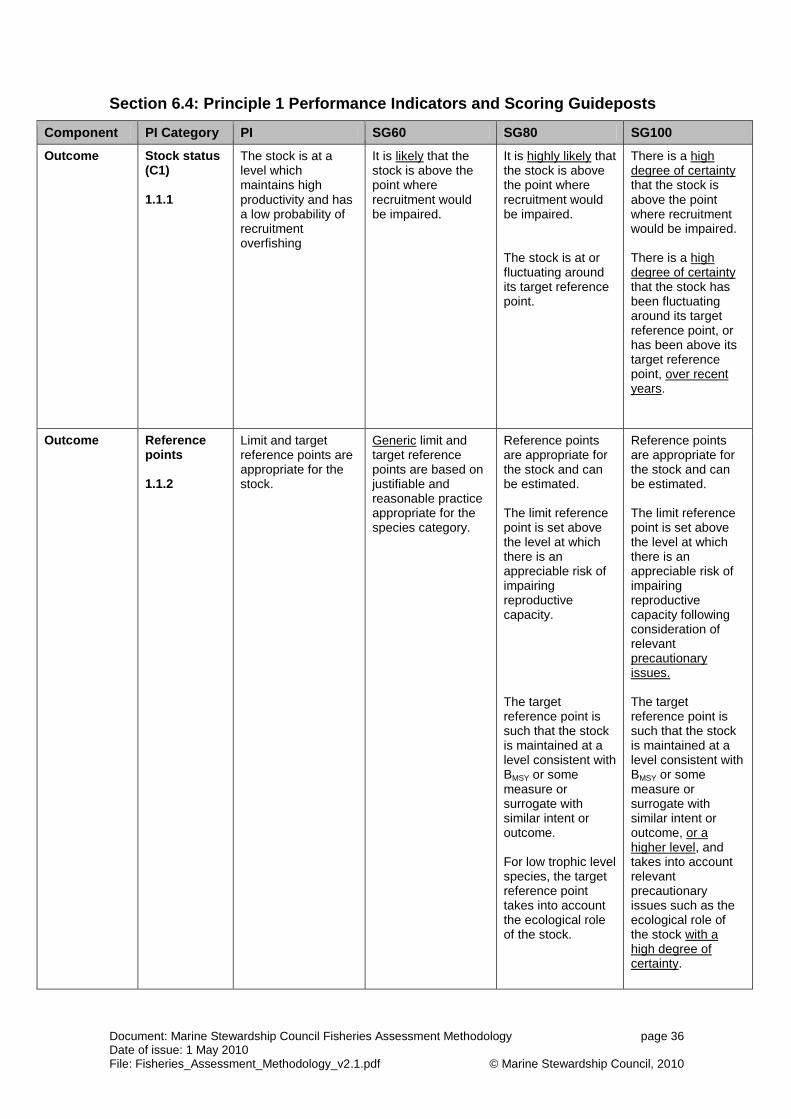
Document: Marine Stewardship Council Fisheries Assessment Methodology page 36 Date of issue: 1 May 2010 File: Fisheries_Assessment_Methodology_v2.1.pdf © Marine Stewardship Council, 2010
Section 6.4: Principle 1 Performance Indicators and Scoring Guideposts
Component PI Category PI SG60 SG80 SG100
Outcome Stock status (C1) 1.1.1
The stock is at a level which maintains high productivity and has a low probability of recruitment overfishing
It is likely that the stock is above the point where recruitment would be impaired.
It is highly likely that the stock is above the point where recruitment would be impaired. The stock is at or fluctuating around its target reference point.
There is a high degree of certainty that the stock is above the point where recruitment would be impaired. There is a high degree of certainty that the stock has been fluctuating around its target reference point, or has been above its target reference point, over recent years.
Outcome Reference points 1.1.2
Limit and target reference points are appropriate for the stock.
Generic limit and target reference points are based on justifiable and reasonable practice appropriate for the species category.
Reference points are appropriate for the stock and can be estimated. The limit reference point is set above the level at which there is an appreciable risk of impairing reproductive capacity. The target reference point is such that the stock is maintained at a level consistent with BMSY or some measure or surrogate with similar intent or outcome. For low trophic level species, the target reference point takes into account the ecological role of the stock.
Reference points are appropriate for the stock and can be estimated. The limit reference point is set above the level at which there is an appreciable risk of impairing reproductive capacity following consideration of relevant precautionary issues. The target reference point is such that the stock is maintained at a level consistent with BMSY or some measure or surrogate with similar intent or outcome, or a higher level, and takes into account relevant precautionary issues such as the ecological role of the stock with a high degree of certainty.
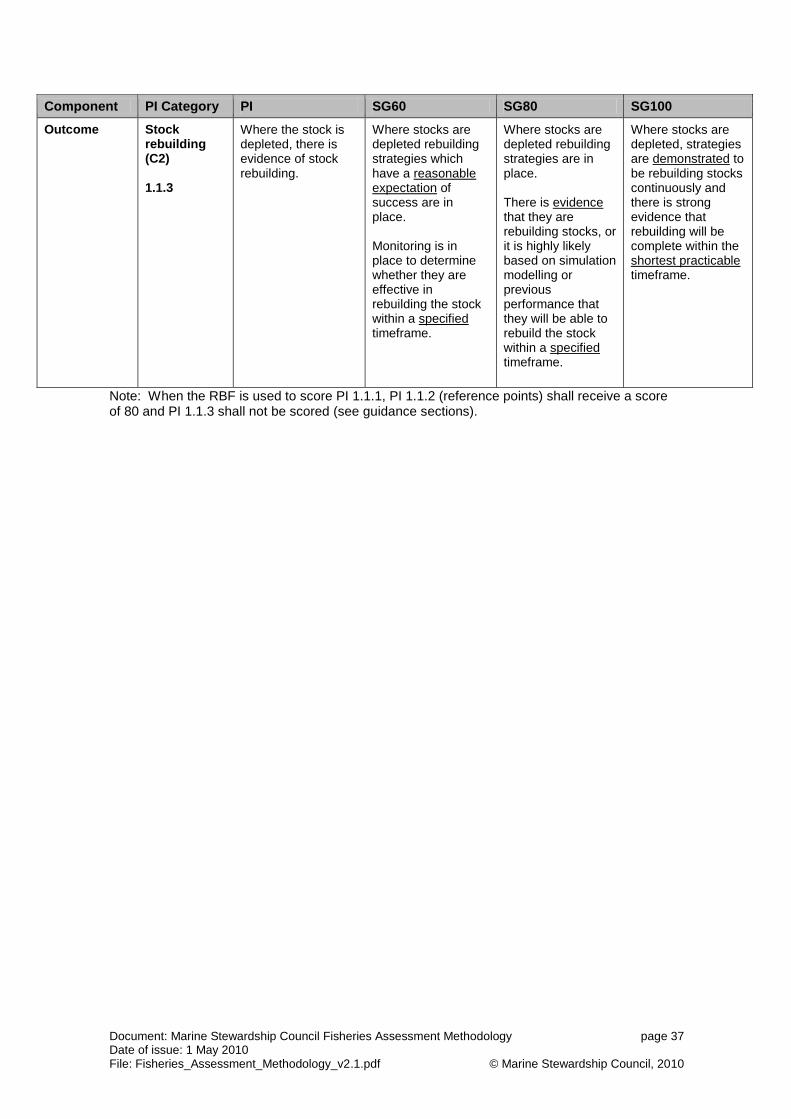
Document: Marine Stewardship Council Fisheries Assessment Methodology page 37 Date of issue: 1 May 2010 File: Fisheries_Assessment_Methodology_v2.1.pdf © Marine Stewardship Council, 2010
Component PI Category PI SG60 SG80 SG100
Outcome Stock rebuilding (C2) 1.1.3
Where the stock is depleted, there is evidence of stock rebuilding.
Where stocks are depleted rebuilding strategies which have a reasonable expectation of success are in place. Monitoring is in place to determine whether they are effective in rebuilding the stock within a specified timeframe.
Where stocks are depleted rebuilding strategies are in place. There is evidence that they are rebuilding stocks, or it is highly likely based on simulation modelling or previous performance that they will be able to rebuild the stock within a specified timeframe.
Where stocks are depleted, strategies are demonstrated to be rebuilding stocks continuously and there is strong evidence that rebuilding will be complete within the shortest practicable timeframe.
Note: When the RBF is used to score PI 1.1.1, PI 1.1.2 (reference points) shall receive a score of 80 and PI 1.1.3 shall not be scored (see guidance sections).

Document: Marine Stewardship Council Fisheries Assessment Methodology page 38 Date of issue: 1 May 2010 File: Fisheries_Assessment_Methodology_v2.1.pdf © Marine Stewardship Council, 2010
Component PI Category PI SG60 SG80 SG100
Harvest strategy (management)
Harvest strategy 1.2.1
There is a robust and precautionary harvest strategy in place
The harvest strategy is expected to achieve stock management objectives reflected in the target and limit reference points. The harvest strategy is likely to work based on prior experience or plausible argument. Monitoring is in place that is expected to determine whether the harvest strategy is working.
The harvest strategy is responsive to the state of the stock and the elements of the harvest strategy work together towards achieving management objectives reflected in the target and limit reference points. The harvest strategy may not have been fully tested but monitoring is in place and evidence exists that it is achieving its objectives.
The harvest strategy is responsive to the state of the stock and is designed to achieve stock management objectives reflected in the target and limit reference points. The performance of the harvest strategy has been fully evaluated and evidence exists to show that it is achieving its objectives including being clearly able to maintain stocks at target levels. The harvest strategy is periodically reviewed and improved as necessary.
Harvest strategy
Harvest control rules and tools 1.2.2
There are well defined and effective harvest control rules in place
Generally understood harvest control rules are in place that are consistent with the harvest strategy and which act to reduce the exploitation rate as limit reference points are approached. There is some evidence that tools used to implement harvest control rules are appropriate and effective in controlling exploitation.
Well defined harvest control rules are in place that are consistent with the harvest strategy and ensure that the exploitation rate is reduced as limit reference points are approached. The selection of the harvest control rules takes into account the main uncertainties.
Available evidence indicates that the tools in use are appropriate and effective in achieving the exploitation levels required under the harvest control rules.
Well defined harvest control rules are in place that are consistent with the harvest strategy and ensure that the exploitation rate is reduced as limit reference points are approached. The design of the harvest control rules take into account a wide range of uncertainties.
Evidence clearly shows that the tools in use are effective in achieving the exploitation levels required under the harvest control rules.

Document: Marine Stewardship Council Fisheries Assessment Methodology page 39 Date of issue: 1 May 2010 File: Fisheries_Assessment_Methodology_v2.1.pdf © Marine Stewardship Council, 2010
Component PI Category PI SG60 SG80 SG100
Harvest strategy
Information / monitoring 1.2.3
Relevant information is collected to support the harvest strategy
Some relevant information related to stock structure, stock productivity and fleet composition is available to support the harvest strategy. Stock abundance and fishery removals are monitored and at least one indicator is available and monitored with sufficient frequency to support the harvest control rule.
Sufficient relevant information related to stock structure, stock productivity, fleet composition and other data is available to support the harvest strategy. Stock abundance and fishery removals are regularly monitored at a level of accuracy and coverage consistent with the harvest control rule, and one or more indicators are available and monitored with sufficient frequency to support the harvest control rule. There is good information on all other fishery removals from the stock.
A comprehensive range of information (on stock structure, stock productivity, fleet composition, stock abundance, fishery removals and other information such as environmental information), including some that may not be directly relevant to the current harvest strategy, is available. All information required by the harvest control rule is monitored with high frequency and a high degree of certainty, and there is a good understanding of the inherent uncertainties in the information [data] and the robustness of assessment and management to this uncertainty.
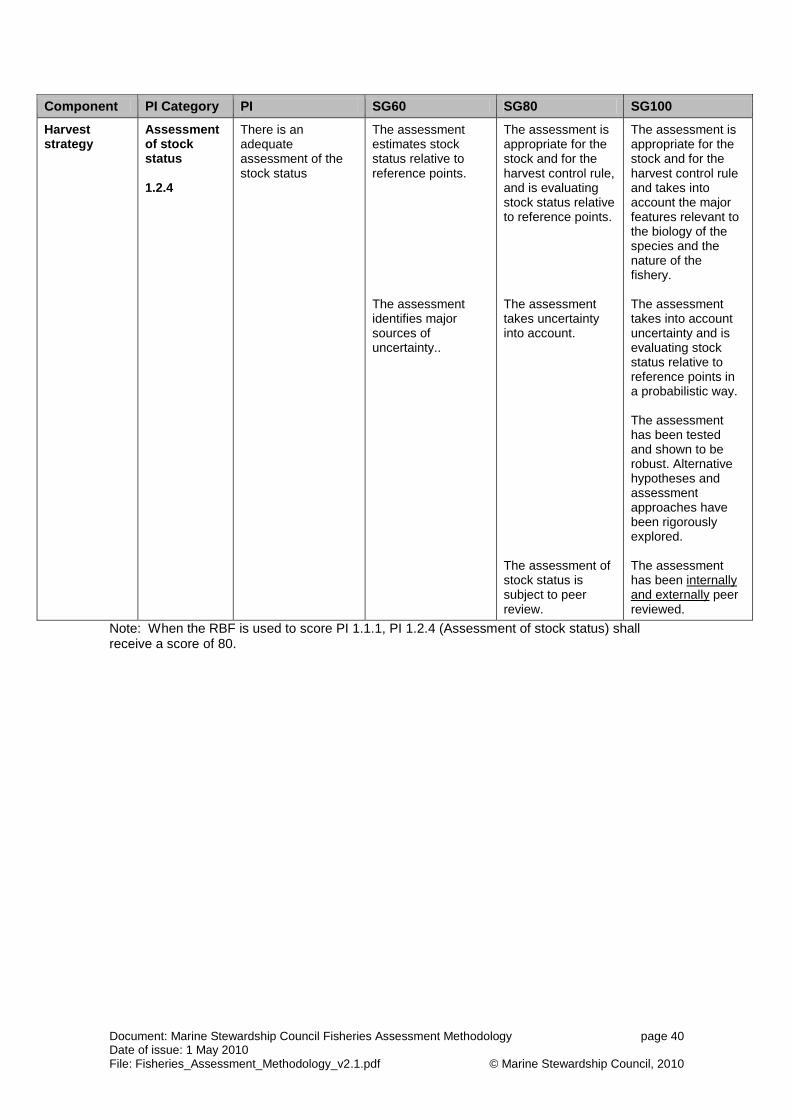
Document: Marine Stewardship Council Fisheries Assessment Methodology page 40 Date of issue: 1 May 2010 File: Fisheries_Assessment_Methodology_v2.1.pdf © Marine Stewardship Council, 2010
Component PI Category PI SG60 SG80 SG100
Harvest strategy
Assessment of stock status 1.2.4
There is an adequate assessment of the stock status
The assessment estimates stock status relative to reference points. The assessment identifies major sources of uncertainty..
The assessment is appropriate for the stock and for the harvest control rule, and is evaluating stock status relative to reference points. The assessment takes uncertainty into account. The assessment of stock status is subject to peer review.
The assessment is appropriate for the stock and for the harvest control rule and takes into account the major features relevant to the biology of the species and the nature of the fishery. The assessment takes into account uncertainty and is evaluating stock status relative to reference points in a probabilistic way. The assessment has been tested and shown to be robust. Alternative hypotheses and assessment approaches have been rigorously explored. The assessment has been internally and externally peer reviewed.
Note: When the RBF is used to score PI 1.1.1, PI 1.2.4 (Assessment of stock status) shall receive a score of 80.

Document: Marine Stewardship Council Fisheries Assessment Methodology page 41 Date of issue: 1 May 2010 File: Fisheries_Assessment_Methodology_v2.1.pdf © Marine Stewardship Council, 2010
Section 7: Principle 2
Section 7.1: General guidance on Principle 2
7.1.1 Principle 2 considerations have been categorised into five Components; which are considered to cover the range of potential ecosystem elements that may be impacted by a fishery:
a) Retained species: Species that are retained by the fishery under assessment (usually because they are commercially valuable or because they are required to be retained by management rules).
b) Bycatch species: Organisms that have been taken incidentally and are not retained (usually because they have no commercial value).
c) ETP species: Endangered, threatened or protected species are those that are recognised by national legislation and/or binding international agreements (e.g. CITES) to which the jurisdictions controlling the fishery under assessment are party.
d) Habitats: The habitats within which the fishery operates.
e) Ecosystem: Broader ecosystem elements such as trophic structure and function, community composition, and biodiversity.
7.1.2 The separation of these Components should enable assessments to be focused clearly on the different objectives and expectations of management, and the different strategies used to manage a fishery‘s impact. To minimise the possibility of duplicate scoring, it is intended that any Principle 2 species should only be considered within one of the Retained species, Bycatch species or ETP species Components.
7.1.3 It may appear that there is overlap between the Ecosystem Component and other Components, however in general the Ecosystem Component establishes the performance against which to assess the indirect impacts of fishing on the wider ecosystem, while the Retained species, Bycatch species and Habitats Components establish the performance against which to assess the direct impacts of fishing on those Components of the ecosystem. The ETP Component considers both indirect and direct impacts.
7.1.4 The reasons for separating Retained species and Bycatch species Components in the new tree are: 1) to recognise that information on species which are typically discarded and are therefore of nuisance value to a fishery may often be more difficult to obtain than for species which are retained and of commercial value; and 2) to allow the identification of those species that are caught by the fishery, but are not included in the Unit of Certification, but from which the fishery may derive some income and therefore may, on occasion, influence the operation of the fleet in a way that makes their catch more likely. This may increase the risk of the fishery on these retained species, and therefore the assessment against the MSC standard should take account of this possibility. In contrast, those bycatch species which are truly of nuisance value to the fishery, and are discarded, are unlikely ever to provide an incentive for increased catches.
7.1.5 Prior to scoring the fishery, certification bodies shall determine and document under which Component any Principle 2 species will be assessed. For example, when considering a seabird species taken as bycatch that is also listed as threatened under relevant national legislation, the certification body would recognise that the species is primarily managed as an ETP species and therefore it will only be considered when scoring the ‗ETP species‘ PIs, and not in the scoring of ‗Bycatch species‘ PIs. In addition, the wider ecosystem impacts of, for instance, retained catch removals should also be considered under the Ecosystem Component.
7.1.6 Similar to Principle 1, the Management Strategy PIs within Principle 2 should only consider those management tools, measures or strategies that manage the impact the fishery is having on the Principle 2 Component specifically. Broader management and fisheries policy considerations are captured in Principle 3.
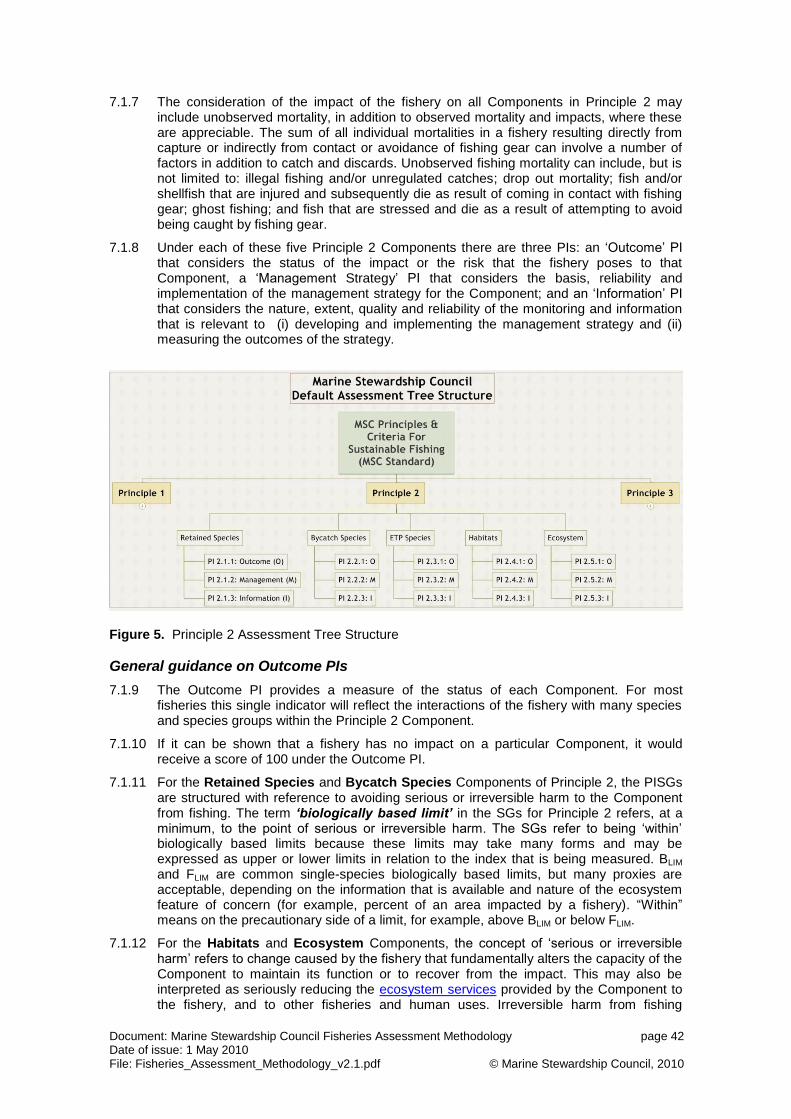
Document: Marine Stewardship Council Fisheries Assessment Methodology page 42 Date of issue: 1 May 2010 File: Fisheries_Assessment_Methodology_v2.1.pdf © Marine Stewardship Council, 2010
7.1.7 The consideration of the impact of the fishery on all Components in Principle 2 may include unobserved mortality, in addition to observed mortality and impacts, where these are appreciable. The sum of all individual mortalities in a fishery resulting directly from capture or indirectly from contact or avoidance of fishing gear can involve a number of factors in addition to catch and discards. Unobserved fishing mortality can include, but is not limited to: illegal fishing and/or unregulated catches; drop out mortality; fish and/or shellfish that are injured and subsequently die as result of coming in contact with fishing gear; ghost fishing; and fish that are stressed and die as a result of attempting to avoid being caught by fishing gear.
7.1.8 Under each of these five Principle 2 Components there are three PIs: an ‗Outcome‘ PI that considers the status of the impact or the risk that the fishery poses to that Component, a ‗Management Strategy‘ PI that considers the basis, reliability and implementation of the management strategy for the Component; and an ‗Information‘ PI that considers the nature, extent, quality and reliability of the monitoring and information that is relevant to (i) developing and implementing the management strategy and (ii) measuring the outcomes of the strategy.
Figure 5. Principle 2 Assessment Tree Structure
General guidance on Outcome PIs
7.1.9 The Outcome PI provides a measure of the status of each Component. For most fisheries this single indicator will reflect the interactions of the fishery with many species and species groups within the Principle 2 Component.
7.1.10 If it can be shown that a fishery has no impact on a particular Component, it would receive a score of 100 under the Outcome PI.
7.1.11 For the Retained Species and Bycatch Species Components of Principle 2, the PISGs are structured with reference to avoiding serious or irreversible harm to the Component from fishing. The term „biologically based limit‟ in the SGs for Principle 2 refers, at a minimum, to the point of serious or irreversible harm. The SGs refer to being ‗within‘ biologically based limits because these limits may take many forms and may be expressed as upper or lower limits in relation to the index that is being measured. BLIM and FLIM are common single-species biologically based limits, but many proxies are acceptable, depending on the information that is available and nature of the ecosystem feature of concern (for example, percent of an area impacted by a fishery). ―Within‖ means on the precautionary side of a limit, for example, above BLIM or below FLIM.
7.1.12 For the Habitats and Ecosystem Components, the concept of ‗serious or irreversible harm‘ refers to change caused by the fishery that fundamentally alters the capacity of the Component to maintain its function or to recover from the impact. This may also be interpreted as seriously reducing the ecosystem services provided by the Component to the fishery, and to other fisheries and human uses. Irreversible harm from fishing

Document: Marine Stewardship Council Fisheries Assessment Methodology page 43 Date of issue: 1 May 2010 File: Fisheries_Assessment_Methodology_v2.1.pdf © Marine Stewardship Council, 2010
includes very slowly reversible harm that is effectively irreversible on time-scales of natural ecological processes (e.g. natural perturbation, recovery and generation times in the absence of fishing, normally one or two decades but may be shorter or longer depending on the species and ecosystem concerned). Examples of serious or irreversible harm include local or global extinction, serious recruitment overfishing, habitat loss on scales that have widespread detrimental consequences for the ecosystem services provided by the habitat (e.g. gross change in species composition of dependent species), and loss of resilience resulting in trophic cascades, fishery mediated regime shifts, etc. Explicit targets may not be appropriate or available for all of the Components, in some cases because there is no scientific or general consensus on appropriate targets. So while performance in relation to targets can be introduced where appropriate, the generic performance requirements SG60 relate to increasing confidence and safety margins with which serious or irreversible harm is avoided, including through the management tools, measures and strategies that are in place.
7.1.13 Several PIs and SGs use the phrase ‗do not hinder‘ recovery or rebuilding. This should be interpreted as not materially or significantly impeding recovery or rebuilding, and relates to the impact of the fishery rather than change in the absolute status of the Component (see Further Guidance on Key Principle 2 Phrases). If there is a formally planned recovery then the management of the fishery under assessment needs to be consistent with that plan and the fishery should not prevent the planned recovery from being achieved in the intended timeframe. If there is no formally planned recovery then the fishery would permit recovery on a timeframe that is consistent with the natural dynamics of the species.
7.1.14 The Components of Principle 2 may be subject to human impact from sources other than the assessed fishery. For example, retained or bycatch species may be target species in other fisheries, while habitats and ecosystem processes may be impacted by coastal zone or other development or introduced species. The SGs in Principle 2 are structured to first address the status of the Component. If the status is low, for whatever reason, then the operative Principle 2 assessment issue is then whether the fishery is hindering recovery. This is different to the treatment of target species in Principle 1, where low status would preclude certification irrespective of the cause of that low status. For example if a retained or bycatch species in the assessed fishery is depleted as a result of targeting in other fisheries then the Principle 2 assessment would be based on the impact of the assessed fishery on recovery of the depleted species, even if no effort was being made to recover the species in the other fisheries. The assessment is based on the ‗marginal contribution‘ that this fishery makes to the status or recovery of the Component under consideration. This could be determined in a practical way by examining likely population trajectories if all the other fisheries reduced their catches to zero (i.e., the only catches were being taken by the fishery under assessment). If the fishery is not the root cause of human impacts on the Component then actions of the fishery cannot redress the situation. However in any event the fishery is required not to hinder recovery or rebuilding.
Confidence and risk
7.1.15 Increasing scores require increasing confidence in the assessment of outcome status and adequacy of management measures or strategies. For most Components the 60 SG is ‗likely‘ to be, the 80 SG is a ‗highly likely‘ to be, and 100 SG has a ‗high degree of certainty‘ of being within biologically based limits. These terms may be interpretable either qualitatively (e.g. through analogy with similar situations, plausible argument, empirical observation of sustainability and qualitative risk assessment) or quantitatively (e.g. through measured data from the relevant fishery, statistical analysis, quantitative risk assessment and quantitative modelling).
7.1.16 Direct observations and quantitative analysis are often limited in Principle 2 Components and so there may be a greater reliance on qualitative interpretations. Achieving an 80 score through qualitative assessment would typically require the risk to be very low and for there to be ongoing monitoring in place to provide measurement of continued performance. A long history of stability or continuity in the fishery when monitored and
Document: Marine Stewardship Council Fisheries Assessment Methodology page 44 Date of issue: 1 May 2010 File: Fisheries_Assessment_Methodology_v2.1.pdf © Marine Stewardship Council, 2010
managed on the basis of qualitative assessments or expert-judgements can provide good evidence for sustainability of the fishery, but CBs must consider both the current outcome status and the resilience of the historical arrangements to function adequately and deliver low risk under future conditions.
7.1.17 For situations where risk is estimated to be low and a quantitative analysis is not available, the MSC is developing a risk-based approach to enable CBs to score these Components.
7.1.18 The terms ―likely‖, ―highly likely‖ and ―high degree of certainty‖ are different to the values assigned under Principle 1. To put the Principle 2 values into probabilistic context:
a) ‗likely‘ means greater than or equal to the 60th percentile in the distribution (i.e. there
shall be at least a 60% probability that the true status of the Component is within biologically based limits).
b) ‗highly likely‘ means greater than or equal to the 70th percentile in the distribution.
c) ‗high degree of certainty‘ means greater than or equal to the 80th percentile in the
distribution.
7.1.19 Specific guidance relating to application of these terms and probability levels in relation to Habitats and Ecosystem Components can be found in the guidance on the Outcome PI for each Component.
General guidance on Management Strategy PIs
7.1.20 These performance indicators intend to assess the arrangements that are in place to manage the impact that a fishery has on the Component. The SGs contain a mixture of requirements for either measures to be in place or strategies. To clarify the difference:
7.1.21 ―Measures‖ are individual actions or tools that may be in place either explicitly to manage impacts on the Component or coincidentally, being designed primarily to manage impacts on another Component, indirectly contribute to management of the Component under assessment. For example, the closure of an area may have primarily been put in place to avoid the catch of juvenile target species and therefore enhance target species sustainability; however it may also have a beneficial effect on the bycatch of sensitive species such as other juvenile finfish. If such a measure were effective in assisting the fishery to achieve the SG80 level for the Bycatch species Outcome PI then this could be considered as a management measure under the Bycatch species Management Strategy PI.
7.1.22 A ―strategy‖ represents a cohesive and strategic arrangement which may comprise one or more measures, an understanding of how it/they work to achieve an outcome and which should be designed to manage impact on that Component specifically. A strategy needs to be appropriate to the scale, intensity and cultural context of the fishery, and could include voluntary or customary arrangements, agreements or practices, codes of practice (if they can be demonstrated to be working). A strategy should contain mechanisms for the modification fishing practices in the light of the identification of unacceptable impacts.
7.1.23 A ―partial strategy‖ represents a cohesive arrangement which may comprise one or more measures, an understanding of how it/they work to achieve an outcome and an awareness of the need to change the measures should they cease to be effective. It may not have been designed to manage the impact on that Component specifically.
7.1.24 A ―comprehensive strategy‖ is a complete and tested strategy made up of linked monitoring, analyses, and management measures and responses.
7.1.25 The term ―if necessary‖ is used in the management strategy PIs at SG60 and SG80 for the retained species, bycatch species, habitats and ecosystems Components. This term is applicable to those fisheries that have no impact on the relevant Component and where no management strategy is required. For example, if there are no ―main‖ retained species then a management strategy would not be required at SG60 or SG80.

Document: Marine Stewardship Council Fisheries Assessment Methodology page 45 Date of issue: 1 May 2010 File: Fisheries_Assessment_Methodology_v2.1.pdf © Marine Stewardship Council, 2010
7.1.26 If it has been shown that a fishery has no impact on a particular Component and has therefore scored 100 under the Outcome PI, it shall still be scored under the Management Strategy PI. But to meet the requirement at SG100 this may simply comprise a statement of intent about continuing to have no impact and ongoing monitoring to ensure that no impact occurs.
General guidance on Information PIs
7.1.27 Even if it has been shown that a fishery has no impact on a particular Component and has therefore scored 100 under the Outcome PI, the Information PI shall still be scored. This is because information is required to ensure and continue to confirm that the fishery has no impact upon that Component.
7.1.28 Objective Basis for Confidence. Throughout the Assessment Tree there is a gradient from 60 to 100 in the performance requirement regarding the basis for the conclusions that can be drawn in an evaluation.
a) The first level is information that can provide a basis for inference about the impacts of fishing is expert knowledge. This is acquired from diverse sources, including studies that may have been conducted in the area although not for the purpose of certification, studies of the same or similar species or ecosystems in other places, established ecological theory and modelling, and community or experiential knowledge.
b) The next level of information has that expert knowledge augmented by some information collected in the area of the fishery, and about the specific Component(s) and/or fishery being considered. The information should have been collected in a sound manner, but might be opportunistically collected rather than collected as part of a systematic monitoring program or a research project targeted on the specific Component. How extensive that more specific information may vary, but should be appropriate to the scale and intensity of the fishery.
c) The highest level of information has all the preceding information augmented by relatively complete information on the Component, and much of that information should come from systematic monitoring and/or research. This does not mean that information exists on everything, particularly for the Habitats and Ecosystem Components, but information is reliable and complete for all the major points of interaction between the fishery and Component, to a level of detail appropriate to the scale and intensity of the fishery.
Specific guidance on Information PIs when the RBF is applied
7.1.29 In cases where the RBF is used to score outcome PIs in Principle 2, the scoring guideposts shall be revised such that the fishery need not be required to meet those scoring issues relating to its assessment relative to biologically based limits. This exception is allowed since the information required to meet these scoring issues would not be expected to be available in the data-limited situations applicable to the RBF. The scoring issues covered by this exception are identified by brackets in the information/monitoring scoring guideposts for PIs 2.1.3 (Retained species), and 2.2.3 (Bycatch species).
Section 7.2: Retained Species
Retained Species Outcome Performance Indicator (PI 2.1.1)
7.2.1 Retained species in Principle 2 are those parts of the retained catch that are not covered under Principle 1 because they are not included in the Unit of Certification. However the retained catch can still be a valuable catch in the fishery, whether it is targeted or taken incidentally, and there is thus an economic incentive for capture.
Document: Marine Stewardship Council Fisheries Assessment Methodology page 46 Date of issue: 1 May 2010 File: Fisheries_Assessment_Methodology_v2.1.pdf © Marine Stewardship Council, 2010
Guidance for use
7.2.2 Both SG60 and SG80 use the qualifier ‗main retained species‘. ‗Main‘ in this context is intended to allow consideration of the weight, value or vulnerability of species caught. For instance, a species that comprises less than 5% of the total catch by weight may normally be considered to be a minor species, i.e., not ‗main‘, in the catch, unless it is of high value to the fisher or of particular vulnerability, or if the total catch of the fishery is large, in which case even 5% may be a considerable catch. On the other hand a species that normally comprises 20% or more of the total catch by weight would almost always be considered a ‗main‘ retained species. Assessment Teams shall use their expert judgement to determine and justify in writing which species are considered ‗main‘ and which are not.
7.2.3 SG100 does not include the qualifier ‗main‘ and all retained species are included in the assessment. If there are no Principle 2 retained species in the fishery, or retention is exceptionally rare and negligible in its impact, then the fishery would meet SG100.
7.2.4 SG60 for Principle 2 retained species is consistent with the Stock Status PI for Principle 1. However there is an additional consideration in Principle 2 to recognise that the status of some retained species, especially those that are not targeted, may be very uncertain. Consequently, SG60 reflects acceptance that the management system may rely on measures and practices that make it unlikely that this fishery could seriously deplete the population or hinder recovery (e.g. practices expected to result in very low fishing mortality), even if the status of the species is very uncertain.
7.2.5 Although SG80 only makes reference to biologically based limits, there is a requirement at SG100 that retained species are at or fluctuating around a target reference point. Retained species will often be taken in multi-species complexes. In a multi-species fishery context, the target levels of biomass or fishing mortality for some species that would be acceptable at SG100 may be different from that usually applied to a single species, although in all cases should result in retained species having a low risk of serious or irreversible harm.
7.2.6 The terms ‗likely‘ and highly likely‘ in SG60 and SG80 may be assessed qualitatively or quantitatively, but SG100 would usually require quantitative evidence and exceptions would need strong justification of very low risk over the period of proposed certification. Quantitative assessments can include methods such as yield per recruit or catch curve analysis.
7.2.7 Species used as bait in the fishery, whether they are caught by the fishery under assessment or elsewhere, should normally be considered under the Bycatch Species component in Principle 2.
Section 7.3: Bycatch Species
Bycatch Species Outcome Performance Indicator (PI 2.2.1)
7.3.1 Bycatch species are species in the catch that are not retained and that are discarded, as well as those that die as a result of unobserved fishing mortality where those species have not already been assessed under Principle 1 as target species or under the other Components in Principle 2 (see Paragraph 7.1.5). The Outcome PISGs requirements levels are similar to those for retained species. SG60 may rely on measures and practices that make it unlikely that this fishery could seriously deplete the population or hinder recovery (e.g. practices expected to result in very low fishing mortality), even if the status of the species is very uncertain.
Guidance for use
7.3.2 Both SG60 and SG80 use the qualifier ‗main bycatch species‘. ‗Main‘ in this context is intended to allow consideration of the catch size or vulnerability of species caught. For instance, a species that comprises less than 5% of the total catch by weight may normally be considered to be a minor species, i.e., not ‗main‘, in the catch, unless it is of particular vulnerability or if the total catch of the fishery is large, in which case even 5%

Document: Marine Stewardship Council Fisheries Assessment Methodology page 47 Date of issue: 1 May 2010 File: Fisheries_Assessment_Methodology_v2.1.pdf © Marine Stewardship Council, 2010
may be a considerable catch. On the other hand a species that normally comprises 20% or more of the catch by weight would almost always be considered a ‗main‘ bycatch species. Assessment Teams shall use their expert judgement to determine and justify in writing which species are considered ‗main‘ and which are not.
7.3.3 The terms ‖likely‖ and ―highly likely‖ in SG60 and SG80 may be addressed qualitatively or quantitatively, but SG100 would usually require quantitative evidence and exceptions would need strong justification of very low risk over the period of proposed certification. If there are no bycatch species in the fishery, or bycatch is exceptionally rare and negligible in its impact, then the fishery would meet SG100.
Section 7.4: Endangered, Threatened or Protected Species (ETP)
ETP Species Outcome Performance Indicator (PI 2.3.1)
7.4.1 ETP (endangered, threatened or protected) species are those that are recognised by national legislation and/or binding international agreements (e.g. CITES) to which the jurisdictions controlling the fishery under assessment are party. The SGs refer to ‗national and international requirements‘ and ‗unacceptable impacts‘. These terms relate to the requirements or impacts specified in relevant national legislation or binding international agreements.
Guidance for use
7.4.2 Consideration of species that are on non-binding lists (e.g. the IUCN Red List) or requirements that are recognised at intergovernmental level (e.g. FAO International Plans of Action) that are not included in national legislation or binding international agreements etc. shall be assessed under the Retained or Bycatch Species Components of the Assessment Tree.
7.4.3 At SG60 it is likely that the fishery meets the requirements of protection and rebuilding provided through national legislation or binding international agreements. Catches or mortality in excess of requirements for protection and rebuilding would only occasionally occur and the excess would be slight.
7.4.4 At SG80 it is highly likely that the fishery meets the requirements for protection and rebuilding set out in national legislation or binding international agreements. There is direct demonstration that requirements for protection and rebuilding are being achieved.
7.4.5 SG100 requires full compliance with all requirements and for mortality from the fishery to be negligible. If there are no ETP species caught in the fishery then the fishery would meet the 100 SG.
ETP Species Management Strategy Performance Indicator (PI 2.3.2)
7.4.6 All ETP Management Strategy PI scoring guideposts refer to the need to minimise mortality. When scoring these SGs, all sources of direct mortality shall be considered including, but not limited to direct deaths and injuries leading to death.
ETP Species Information Performance Indicator (PI 2.3.3)
7.4.7 For SG60 and SG80, ―fishery related mortality‖ means the mortality in the fishery under assessment.
Section 7.5: Habitats
Habitats Outcome Performance Indicator (PI 2.4.1)
7.5.1 The Habitats Component considers habitats impacted by the fishery. Usually it is bottom habitats rather than pelagic habitats that are relevant, but impacts on the biotic aspects of pelagic habitats could be considered.
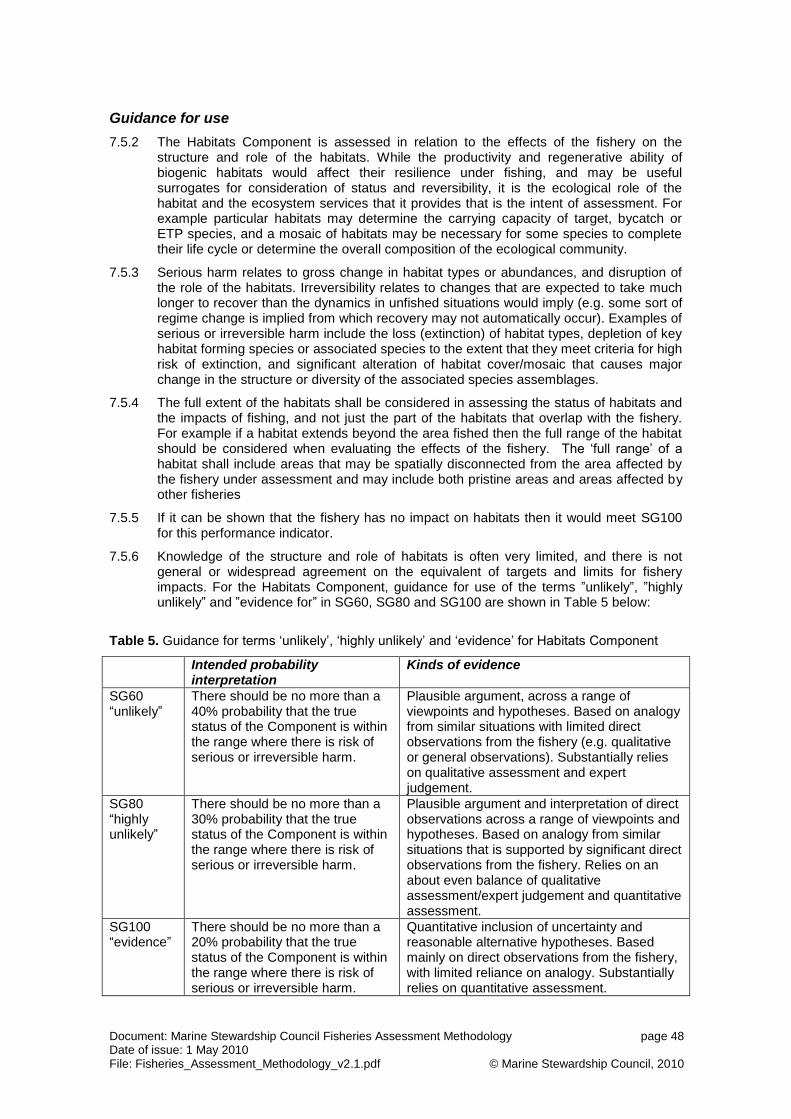
Document: Marine Stewardship Council Fisheries Assessment Methodology page 48 Date of issue: 1 May 2010 File: Fisheries_Assessment_Methodology_v2.1.pdf © Marine Stewardship Council, 2010
Guidance for use
7.5.2 The Habitats Component is assessed in relation to the effects of the fishery on the structure and role of the habitats. While the productivity and regenerative ability of biogenic habitats would affect their resilience under fishing, and may be useful surrogates for consideration of status and reversibility, it is the ecological role of the habitat and the ecosystem services that it provides that is the intent of assessment. For example particular habitats may determine the carrying capacity of target, bycatch or ETP species, and a mosaic of habitats may be necessary for some species to complete their life cycle or determine the overall composition of the ecological community.
7.5.3 Serious harm relates to gross change in habitat types or abundances, and disruption of the role of the habitats. Irreversibility relates to changes that are expected to take much longer to recover than the dynamics in unfished situations would imply (e.g. some sort of regime change is implied from which recovery may not automatically occur). Examples of serious or irreversible harm include the loss (extinction) of habitat types, depletion of key habitat forming species or associated species to the extent that they meet criteria for high risk of extinction, and significant alteration of habitat cover/mosaic that causes major change in the structure or diversity of the associated species assemblages.
7.5.4 The full extent of the habitats shall be considered in assessing the status of habitats and the impacts of fishing, and not just the part of the habitats that overlap with the fishery. For example if a habitat extends beyond the area fished then the full range of the habitat should be considered when evaluating the effects of the fishery. The ‗full range‘ of a habitat shall include areas that may be spatially disconnected from the area affected by the fishery under assessment and may include both pristine areas and areas affected by other fisheries
7.5.5 If it can be shown that the fishery has no impact on habitats then it would meet SG100 for this performance indicator.
7.5.6 Knowledge of the structure and role of habitats is often very limited, and there is not general or widespread agreement on the equivalent of targets and limits for fishery impacts. For the Habitats Component, guidance for use of the terms ‖unlikely‖, ‖highly unlikely‖ and ‖evidence for‖ in SG60, SG80 and SG100 are shown in Table 5 below:
Table 5. Guidance for terms ‗unlikely‘, ‗highly unlikely‘ and ‗evidence‘ for Habitats Component
Intended probability interpretation
Kinds of evidence
SG60 ―unlikely‖
There should be no more than a 40% probability that the true status of the Component is within the range where there is risk of serious or irreversible harm.
Plausible argument, across a range of viewpoints and hypotheses. Based on analogy from similar situations with limited direct observations from the fishery (e.g. qualitative or general observations). Substantially relies on qualitative assessment and expert judgement.
SG80 ―highly unlikely‖
There should be no more than a 30% probability that the true status of the Component is within the range where there is risk of serious or irreversible harm.
Plausible argument and interpretation of direct observations across a range of viewpoints and hypotheses. Based on analogy from similar situations that is supported by significant direct observations from the fishery. Relies on an about even balance of qualitative assessment/expert judgement and quantitative assessment.
SG100 ―evidence‖
There should be no more than a 20% probability that the true status of the Component is within the range where there is risk of serious or irreversible harm.
Quantitative inclusion of uncertainty and reasonable alternative hypotheses. Based mainly on direct observations from the fishery, with limited reliance on analogy. Substantially relies on quantitative assessment.
Document: Marine Stewardship Council Fisheries Assessment Methodology page 49 Date of issue: 1 May 2010 File: Fisheries_Assessment_Methodology_v2.1.pdf © Marine Stewardship Council, 2010
7.5.7 The qualitative analysis and expert judgements in the 60 and 80 SGs should be approximately equivalent to the quantitative probability interpretation given above, and the justification for this equivalence should be provided. Plausible argument should be agreed across a range of informed viewpoints, and not just one of many viewpoints. The range of informed viewpoints or alternative hypotheses could be used to make qualitative judgements about the probability interpretation of the SG.
Habitats Information Performance Indicator (PI 2.4.3)
7.5.8 For SG80 and SG100 ―vulnerability‖ means the combination of the likelihood that the gear would encounter the habitat, and the likelihood that the habitat would be altered if an encounter between the gear and the habitat did occur.
Section 7.6: Ecosystem
Ecosystem Outcome Performance Indicator (PI 2.5.1)
7.6.1 The Ecosystem Component considers the broad ecological community and ecosystem in which the fishery operates.
Guidance for use
7.6.2 The other Components of the assessment (i.e. target species, Retained species, Bycatch species, ETP species and Habitats) are significant elements of the ecosystem and their status is scored separately. The Ecosystem Component does not repeat the status assessment of these elements individually but rather considers the wider system structure and function - although if all these Components scored highly it might be expected that the Ecosystem Component would also score highly. The Ecosystem Component addresses system-wide issues, primarily impacted indirectly by the fishery, including ecosystem structure, trophic relationships and biodiversity.
7.6.3 Serious or irreversible harm should be interpreted in relation to the capacity of the ecosystem to deliver ecosystem services and could include:
a) Trophic cascade (i.e. significantly increased abundance, and especially decreased diversity, of species low in the food-web) caused by depletion of predators and especially ‗keystone‘ predators.
b) Depletion of top predators and trophic cascade through lower trophic levels caused by depletion of key prey species in ‗wasp-waist‘ food webs.
c) Severely truncated size composition of the ecological community (e.g. greatly elevated intercept and steepened gradient in the community size spectrum) to the extent that recovery would be very slow due to the increased predation of intermediate-sized predators.
d) Gross changes in the species biodiversity of the ecological community (e.g. loss of species, major changes in species evenness and dominance) caused by direct or indirect effects of fishing (eg, discarding which provides food for scavenging species).
e) Change in genetic diversity of species caused by selective fishing and resulting in genetically determined change in demographic parameters (e.g. growth, reproductive output).
7.6.4 Relatively few fisheries would have the information needed to address ecosystem issues quantitatively, and usually they will be assessed using surrogates, analogy, general observations, qualitative assessment and expert judgement. Harm to ecosystem structure is normally inferred from impacts on populations, species, functional groups etc. which can often be measured directly. Harm to ecosystem functions is normally inferred from impacts on ecosystem processes and properties such as trophic relationships, community resilience, etc, and often have to be inferred from conceptual or analytical models or analyses.

Document: Marine Stewardship Council Fisheries Assessment Methodology page 50 Date of issue: 1 May 2010 File: Fisheries_Assessment_Methodology_v2.1.pdf © Marine Stewardship Council, 2010
7.6.5 ―Key‖ ecosystem elements are the features of an ecosystem considered to be most crucial to giving the ecosystem its characteristic nature and dynamics, and are considered relative to the scale and intensity of the fishery. They are the features most crucial to maintaining the integrity of its structure and functions, and the key determinants of the ecosystem resilience and productivity.
7.6.6 For the Ecosystem Component, guidance for use of the terms ―unlikely‖, ―highly unlikely‖ and ―evidence for‖ in SG60, SG80 and SG100 are shown in Table 6 below:
Table 6. Guidance for terms ―unlikely‖, ―highly unlikely‖ and ―evidence‖ for Ecosystem Component
Intended probability interpretation
Kinds of evidence
SG60 ―unlikely‖
There should be no more than a 40% probability that the true status of the Component is within the range where there is risk of serious or irreversible harm.
Plausible argument, across a range of viewpoints and hypotheses. Based on analogy from similar situations with limited direct observations from the fishery (e.g. qualitative or general observations). Substantially relies on qualitative assessment and expert judgement.
SG80 ―highly unlikely‖
There should be no more than a 30% probability that the true status of the Component is within the range where there is risk of serious or irreversible harm.
Plausible argument and interpretation of direct observations across a range of viewpoints and hypotheses. Based on analogy from similar situations that is supported by significant direct observations from the fishery. Relies on an about even balance of qualitative assessment/expert judgement and quantitative assessment.
SG100 ―evidence‖
There should be no more than a 20% probability that the true status of the Component is within the range where there is risk of serious or irreversible harm.
Quantitative inclusion of uncertainty and reasonable alternative hypotheses. Based mainly on direct observations from the fishery, with limited reliance on analogy. Substantially relies on quantitative assessment.
7.6.7 The qualitative analysis and expert judgements in the SG60 and SG80 should be
approximately equivalent to the quantitative probability interpretation given above, and the justification for this equivalence should be provided. Plausible argument should be agreed across a range of informed viewpoints, and not just one of many viewpoints. The range of informed viewpoints or alternative hypotheses could be used to make qualitative judgements about the probability interpretation of the SG.
Ecosystem Management Performance Indicator (PI 2.5.2)
7.6.8 In addition to the guidance on ‗measures‘ provided in the General Guidance section, the measures required by SG60 under this PI may exist primarily to manage the impact on target species or other Components, but have the capacity to achieve Ecosystem Outcomes.
7.6.9 For SG80 and SG100, partial strategies and strategies respectively may also contain measures designed and implemented to address impacts on Components that have been evaluated elsewhere in this framework. If such measures address specific ecosystem impacts effectively enough to meet the appropriate standard, then it is not necessary to have special ―ecosystem measures‖ to address the same impacts. Equally, it may also not be necessary to have a specific ―ecosystem strategy‖ other than that which comprises the individual strategies for the other Components under Principle 1 and Principle 2. However, if there are ecosystem impacts that may not be addressed effectively by existing measures, it may be necessary to add new measures or strengthen existing ones to address those impacts.

Document: Marine Stewardship Council Fisheries Assessment Methodology page 51 Date of issue: 1 May 2010 File: Fisheries_Assessment_Methodology_v2.1.pdf © Marine Stewardship Council, 2010
Ecosystem Information Performance Indicator (PI 2.5.3)
7.6.10 Key ecosystem elements may include trophic structure and function (in particular key prey, predators, and competitors), community composition, productivity pattern (e.g. upwelling or spring bloom, abyssal, etc), and characteristics of biodiversity.
7.6.11 In the second scoring issue of this PI, some information is required of ―the main impacts of the fishery on these key ecosystem elements‖ at the SG80 level. At the SG100 level, however, the focus is on the ―main interactions between the fishery and these ecosystem elements‖. At this level, fisheries should be capable of adapting management to environmental changes as well as managing the effect of the fishery on the ecosystem. Monitoring the effects of environmental change on the natural productivity of fisheries should thus be considered best practice when and where possible and should, for example, recognise the increasing importance of anthropogenic climate change.
Section 7.7: Further Guidance on Key Principle 2 Phrases
7.7.1 Throughout the Principle 2 section of the Assessment Tree care has been to taken to have a number of key words and phrases always mean the same thing. The guidance about the content of the PISG tables sometimes provides explanatory text about a specific key word or phrase, to avoid being cryptic about the intent of a specific PI or SG. However, the use of explanatory text is not to be taken as restrictive on the meaning of the word or phrase in these individual applications. In all cases the full interpretation, as defined below, is meant, every time a key word or phrase is used in the context of Principle 2.
BIOLOGICALLY BASED LIMITS – When this phrase it used, it means that there is some benchmark against which status of a Component can be evaluated, and the benchmark is chosen to provide a low risk of serious or irreversible harm to the ecosystem feature. The benchmark should be derived from biological information that is relevant to the ecosystem feature and fishery, although the information does not necessarily have to come from the specific area. BLIM and FLIM are common single-species biologically based limits, but many proxies are acceptable to these specific limits, depending on the information that is available and nature of the ecosystem feature of concern (for example, percent of an area impacted by a fishery). The wider role of the component in the ecosystem is recognised in identifying Biologically Based Limits, and for example the Biologically Based Limits may be modified so as to avoid excessive depletion of dependent predators.
BROADLY UNDERSTOOD – When this phrase is used, it means that there is a general knowledge of the ecological feature, process, or Component. This general knowledge can be acquired from diverse sources that are relevant to the ecosystem and fishery under consideration, but does not have to be locally derived information. There is a ―broad understanding‖ of an ecosystem when the main features of the ecosystem and their major inter-relationships can be specified. Examples of ―Main features‖ are characteristics of trophic structure (e.g. key predators, prey species, and competitors of a species), pattern of productivity (e.g. upwelling system, major spring bloom, etc); presence of strong bottom-up, wasp-waist, or top-down control; and main aspects of biodiversity and community composition (e.g. relatively species rich or poor given the latitude and depth, high or low dominance of the most common species), etc.
DOES NOT HINDER – When this phrase is used, it means that the impact of the fishery is low enough that if the species is capable of improving its status, the fishery will not deter that improvement. It does not require evidence that the status of the species is actually improving. Sometimes a species is depleted or otherwise experiencing very low productivity for reasons that are unrelated to the impacts of the fishery of concern (e.g. impacts of other fisheries, highly unfavourable environmental conditions, effects of contaminants on reproduction, etc). Hence it is appropriate to evaluate this Component relative to the impact of the fishery on the species, and not actually require evidence that the status of the species is

Document: Marine Stewardship Council Fisheries Assessment Methodology page 52 Date of issue: 1 May 2010 File: Fisheries_Assessment_Methodology_v2.1.pdf © Marine Stewardship Council, 2010
improving. Sometimes a species is depleted or otherwise experiencing very low productivity for reasons that are unrelated to the fishery.
IN PLACE – When a measure or strategy is ―in place‖ it means that a measure or strategy has been implemented, and if multiple measures have been identified to address an impact of the fishery, there is a specified process with a clear timetable and endpoint for implementation of the full suite of measures.
INFORMATION IS ADEQUATE – ―Adequate‖ refers to the accuracy, precision and (when relevant) quantity and relevance of information that is available. It does not refer to what the information may say about the status of a species relative to a biologically based limit or the impact of the fishery on an ecosystem feature.
INFORMATION IS SUFFICIENT – This phrase is to be interpreted in the same way as ―information is adequate‖, except that quantity and quality of information is high enough to justify the level of risk or certainty associated with the specific SG standard.

Document: Marine Stewardship Council Fisheries Assessment Methodology page 53 Date of issue: 1 May 2010 File: Fisheries_Assessment_Methodology_v2.1.pdf © Marine Stewardship Council, 2010
Section 7.8: Principle 2 Performance Indicators and Scoring Guideposts
Component PI Category PI SG60 SG80 SG100
Retained species
Outcome Status 2.1.1
The fishery does not pose a risk of serious or irreversible harm to the retained species and does not hinder recovery of depleted retained species.
Main retained species are likely to be within biologically based limits or if outside the limits there are measures in place that are expected to ensure that the fishery does not hinder recovery and rebuilding of the depleted species. If the status is poorly known there are measures or practices in place that are expected to result in the fishery not causing the retained species to be outside biologically based limits or hindering recovery.
Main retained species are highly likely to be within biologically based limits, or if outside the limits there is a partial strategy of demonstrably effective management measures in place such that the fishery does not hinder recovery and rebuilding.
There is a high degree of certainty that retained species are within biologically based limits. Target reference points are defined and retained species are at or fluctuating around their target reference points.
Retained species
Management strategy 2.1.2
There is a strategy in place for managing retained species that is designed to ensure the fishery does not pose a risk of serious or irreversible harm to retained species.
There are measures in place, if necessary, that are expected to maintain the main retained species at levels which are highly likely to be within biologically based limits, or to ensure the fishery does not hinder their recovery and rebuilding. The measures are considered likely to work, based on plausible argument (e.g., general experience, theory or comparison with similar fisheries/species).
There is a partial strategy in place, if necessary that is expected to maintain the main retained species at levels which are highly likely to be within biologically based limits, or to ensure the fishery does not hinder their recovery and rebuilding. There is some objective basis for confidence that the partial strategy will work, based on some information directly about the fishery and/or species involved. There is some evidence that the partial strategy is being implemented successfully.
There is a strategy in place for managing retained species. The strategy is mainly based on information directly about the fishery and/or species involved, and testing supports high confidence that the strategy will work. There is clear evidence that the strategy is being implemented successfully, and intended changes are occurring. There is some evidence that the strategy is achieving its overall objective.
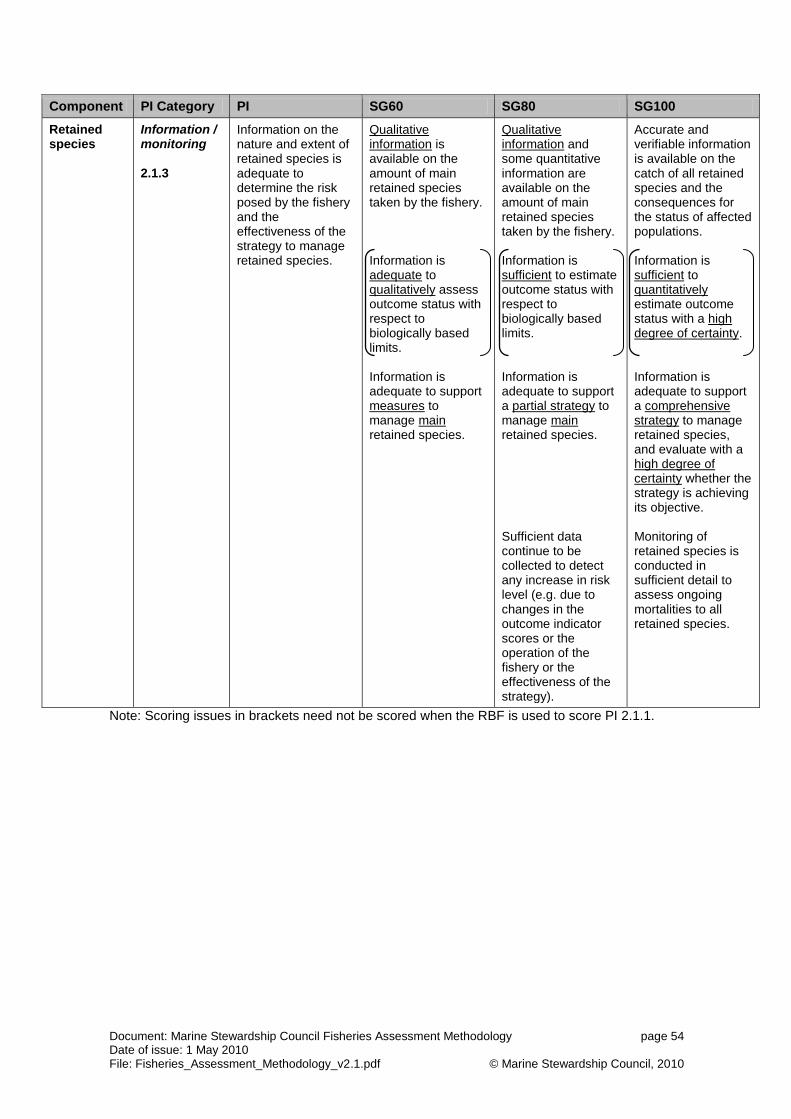
Document: Marine Stewardship Council Fisheries Assessment Methodology page 54 Date of issue: 1 May 2010 File: Fisheries_Assessment_Methodology_v2.1.pdf © Marine Stewardship Council, 2010
Component PI Category PI SG60 SG80 SG100
Retained species
Information / monitoring 2.1.3
Information on the nature and extent of retained species is adequate to determine the risk posed by the fishery and the effectiveness of the strategy to manage retained species.
Qualitative information is available on the amount of main retained species taken by the fishery. Information is adequate to qualitatively assess outcome status with respect to biologically based limits. Information is adequate to support measures to manage main retained species.
Qualitative information and some quantitative information are available on the amount of main retained species taken by the fishery. Information is sufficient to estimate outcome status with respect to biologically based limits. Information is adequate to support a partial strategy to manage main retained species. Sufficient data continue to be collected to detect any increase in risk level (e.g. due to changes in the outcome indicator scores or the operation of the fishery or the effectiveness of the strategy).
Accurate and verifiable information is available on the catch of all retained species and the consequences for the status of affected populations. Information is sufficient to quantitatively estimate outcome status with a high degree of certainty. Information is adequate to support a comprehensive strategy to manage retained species, and evaluate with a high degree of certainty whether the strategy is achieving its objective. Monitoring of retained species is conducted in sufficient detail to assess ongoing mortalities to all retained species.
Note: Scoring issues in brackets need not be scored when the RBF is used to score PI 2.1.1.

Document: Marine Stewardship Council Fisheries Assessment Methodology page 55 Date of issue: 1 May 2010 File: Fisheries_Assessment_Methodology_v2.1.pdf © Marine Stewardship Council, 2010
Component PI Category PI SG60 SG80 SG100
Bycatch species
Outcome Status 2.2.1
The fishery does not pose a risk of serious or irreversible harm to the bycatch species or species groups and does not hinder recovery of depleted bycatch species or species groups.
Main bycatch species are likely to be within biologically based limits, or if outside such limits there are mitigation measures in place that are expected to ensure that the fishery does not hinder recovery and rebuilding. If the status is poorly known there are measures or practices in place that are expected to result in the fishery not causing the bycatch species to be outside biologically based limits or hindering recovery.
Main bycatch species are highly likely to be within biologically based limits or if outside such limits there is a partial strategy of demonstrably effective mitigation measures in place such that the fishery does not hinder recovery and rebuilding.
There is a high degree of certainty that bycatch species are within biologically based limits.
Bycatch species
Management strategy 2.2.2
There is a strategy in place for managing bycatch that is designed to ensure the fishery does not pose a risk of serious or irreversible harm to bycatch populations.
There are measures in place, if necessary, which are expected to maintain main bycatch species at levels which are highly likely to be within biologically based limits or to ensure that the fishery does not hinder their recovery. The measures are considered likely to work, based on plausible argument (e.g general experience, theory or comparison with similar fisheries/species).
There is a partial strategy in place, if necessary, for managing bycatch that is expected to maintain main bycatch species at levels which are highly likely to be within biologically based limits or to ensure that the fishery does not hinder their recovery. There is some objective basis for confidence that the partial strategy will work, based on some information directly about the fishery and/or the species involved. There is some evidence that the partial strategy is being implemented successfully.
There is a strategy in place for managing and minimising bycatch. The strategy is mainly based on information directly about the fishery and/or species involved, and testing supports high confidence that the strategy will work. There is some evidence that the strategy is achieving its objective. There is clear evidence that the strategy is being implemented successfully, and intended changes are occurring.

Document: Marine Stewardship Council Fisheries Assessment Methodology page 56 Date of issue: 1 May 2010 File: Fisheries_Assessment_Methodology_v2.1.pdf © Marine Stewardship Council, 2010
Component PI Category PI SG60 SG80 SG100
Bycatch species
Information / monitoring 2.2.3
Information on the nature and amount of bycatch is adequate to determine the risk posed by the fishery and the effectiveness of the strategy to manage bycatch.
Qualitative information is available on the amount of main bycatch species affected by the fishery. Information is adequate to broadly understand outcome status with respect to biologically based limits. Information is adequate to support measures to manage bycatch.
Qualitative information and some quantitative information are available on the amount of main bycatch species affected by the fishery. Information is sufficient to estimate outcome status with respect to biologically based limits. Information is adequate to support a partial strategy to manage main bycatch species. Sufficient data continue to be collected to detect any increase in risk to main bycatch species (e.g. due to changes in the outcome indicator scores or the operation of the fishery or the effectiveness of the strategy).
Accurate and verifiable information is available on the amount of all bycatch and the consequences for the status of affected populations. Information is sufficient to quantitatively estimate outcome status with respect to biologically based limits with a high degree of certainty. Information is adequate to support a comprehensive strategy to manage bycatch, and evaluate with a high degree of certainty whether a strategy is achieving its objective. Monitoring of bycatch data is conducted in sufficient detail to assess ongoing mortalities to all bycatch species.
Note: Scoring issues in brackets need not be scored when the RBF is used to score PI 2.2.1.
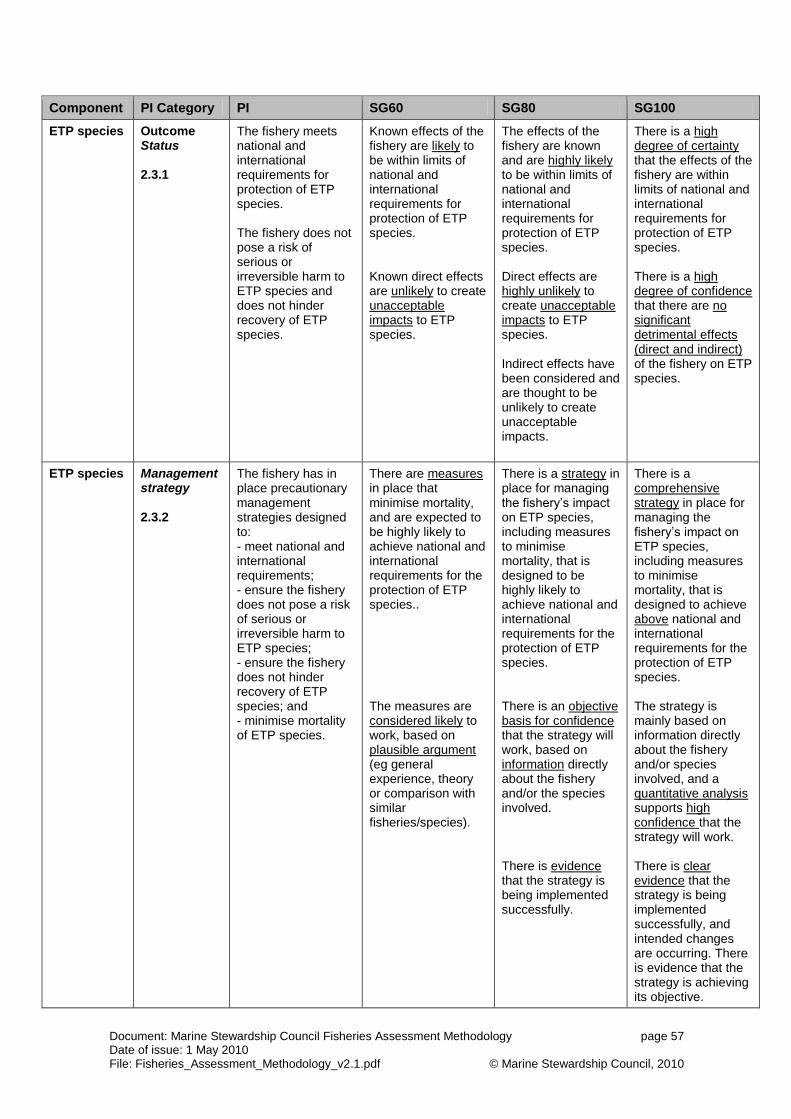
Document: Marine Stewardship Council Fisheries Assessment Methodology page 57 Date of issue: 1 May 2010 File: Fisheries_Assessment_Methodology_v2.1.pdf © Marine Stewardship Council, 2010
Component PI Category PI SG60 SG80 SG100
ETP species Outcome Status 2.3.1
The fishery meets national and international requirements for protection of ETP species. The fishery does not pose a risk of serious or irreversible harm to ETP species and does not hinder recovery of ETP species.
Known effects of the fishery are likely to be within limits of national and international requirements for protection of ETP species. Known direct effects are unlikely to create unacceptable impacts to ETP species.
The effects of the fishery are known and are highly likely to be within limits of national and international requirements for protection of ETP species. Direct effects are highly unlikely to create unacceptable impacts to ETP species. Indirect effects have been considered and are thought to be unlikely to create unacceptable impacts.
There is a high degree of certainty that the effects of the fishery are within limits of national and international requirements for protection of ETP species. There is a high degree of confidence that there are no significant detrimental effects (direct and indirect) of the fishery on ETP species.
ETP species Management strategy 2.3.2
The fishery has in place precautionary management strategies designed to: - meet national and international requirements; - ensure the fishery does not pose a risk of serious or irreversible harm to ETP species; - ensure the fishery does not hinder recovery of ETP species; and - minimise mortality of ETP species.
There are measures in place that minimise mortality, and are expected to be highly likely to achieve national and international requirements for the protection of ETP species.. The measures are considered likely to work, based on plausible argument (eg general experience, theory or comparison with similar fisheries/species).
There is a strategy in place for managing the fishery‘s impact on ETP species, including measures to minimise mortality, that is designed to be highly likely to achieve national and international requirements for the protection of ETP species. There is an objective basis for confidence that the strategy will work, based on information directly about the fishery and/or the species involved. There is evidence that the strategy is being implemented successfully.
There is a comprehensive strategy in place for managing the fishery‘s impact on ETP species, including measures to minimise mortality, that is designed to achieve above national and international requirements for the protection of ETP species. The strategy is mainly based on information directly about the fishery and/or species involved, and a quantitative analysis supports high confidence that the strategy will work. There is clear evidence that the strategy is being implemented successfully, and intended changes are occurring. There is evidence that the strategy is achieving its objective.

Document: Marine Stewardship Council Fisheries Assessment Methodology page 58 Date of issue: 1 May 2010 File: Fisheries_Assessment_Methodology_v2.1.pdf © Marine Stewardship Council, 2010
Component PI Category PI SG60 SG80 SG100
ETP species Information / monitoring 2.3.3
Relevant information is collected to support the management of fishery impacts on ETP species, including: - information for the development of the management strategy; - information to assess the effectiveness of the management strategy; and - information to determine the outcome status of ETP species.
Information is adequate to broadly understand the impact of the fishery on ETP species. Information is adequate to support measures to manage the impacts on ETP species Information is sufficient to qualitatively estimate the fishery related mortality of ETP species.
Information is sufficient to determine whether the fishery may be a threat to protection and recovery of the ETP species, and if so, to measure trends and support a full strategy to manage impacts. Sufficient data are available to allow fishery related mortality and the impact of fishing to be quantitatively estimated for ETP species.
Information is sufficient to quantitatively estimate outcome status with a high degree of certainty. Information is adequate to support a comprehensive strategy to manage impacts, minimize mortality and injury of ETP species, and evaluate with a high degree of certainty whether a strategy is achieving its objectives. Accurate and verifiable information is available on the magnitude of all impacts, mortalities and injuries and the consequences for the status of ETP species.

Document: Marine Stewardship Council Fisheries Assessment Methodology page 59 Date of issue: 1 May 2010 File: Fisheries_Assessment_Methodology_v2.1.pdf © Marine Stewardship Council, 2010
Component PI Category PI SG60 SG80 SG100
Habitats Outcome Status 2.4.1
The fishery does not cause serious or irreversible harm to habitat structure, considered on a regional or bioregional basis, and function.
The fishery is unlikely to reduce habitat structure and function to a point where there would be serious or irreversible harm.
The fishery is highly unlikely to reduce habitat structure and function to a point where there would be serious or irreversible harm.
There is evidence that the fishery is highly unlikely to reduce habitat structure and function to a point where there would be serious or irreversible harm.
Habitats Management strategy 2.4.2
There is a strategy in place that is designed to ensure the fishery does not pose a risk of serious or irreversible harm to habitat types.
There are measures in place, if necessary, that are expected to achieve the Habitat Outcome 80 level of performance. The measures are considered likely to work, based on plausible argument (e.g general experience, theory or comparison with similar fisheries/habitats).
There is a partial strategy in place, if necessary, that is expected to achieve the Habitat Outcome 80 level of performance or above. There is some objective basis for confidence that the partial strategy will work, based on information directly about the fishery and/or habitats involved. There is some evidence that the partial strategy is being implemented successfully.
There is a strategy in place for managing the impact of the fishery on habitat types. The strategy is mainly based on information directly about the fishery and/or habitats involved, and testing supports high confidence that the strategy will work. There is clear evidence that the strategy is being implemented successfully, and intended changes are occurring. There is some evidence that the strategy is achieving its objective.

Document: Marine Stewardship Council Fisheries Assessment Methodology page 60 Date of issue: 1 May 2010 File: Fisheries_Assessment_Methodology_v2.1.pdf © Marine Stewardship Council, 2010
Component PI Category PI SG60 SG80 SG100
Habitats Information / monitoring 2.4.3
Information is adequate to determine the risk posed to habitat types by the fishery and the effectiveness of the strategy to manage impacts on habitat types.
There is a basic understanding of the types and distribution of main habitats in the area of the fishery. Information is adequate to broadly understand the nature of the main impacts of gear use on the main habitats, including spatial overlap of habitat with fishing gear
The nature, distribution and vulnerability of all main habitat types in the fishery area are known at a level of detail relevant to the scale and intensity of the fishery. Sufficient data are available to allow the nature of the impacts of the fishery on habitat types to be identified and there is reliable information on the spatial extent of interaction, and the timing and location of use of the fishing gear. Sufficient data continue to be collected to detect any increase in risk to habitat (e.g. due to changes in the outcome indicator scores or the operation of the fishery or the effectiveness of the measures).
The distribution of habitat types is known over their range, with particular attention to the occurrence of vulnerable habitat types. Changes in habitat distributions over time are measured. The physical impacts of the gear on the habitat types have been quantified fully.

Document: Marine Stewardship Council Fisheries Assessment Methodology page 61 Date of issue: 1 May 2010 File: Fisheries_Assessment_Methodology_v2.1.pdf © Marine Stewardship Council, 2010
Component PI Category PI SG60 SG80 SG100
Ecosystem Outcome Status 2.5.1
The fishery does not cause serious or irreversible harm to the key elements of ecosystem structure and function.
The fishery is unlikely to disrupt the key elements underlying ecosystem structure and function to a point where there would be a serious or irreversible harm.
The fishery is highly unlikely to disrupt the key elements underlying ecosystem structure and function to a point where there would be a serious or irreversible harm.
There is evidence that the fishery is highly unlikely to disrupt the key elements underlying ecosystem structure and function to a point where there would be a serious or irreversible harm.
Ecosystem Management strategy 2.5.2
There are measures in place to ensure the fishery does not pose a risk of serious or irreversible harm to ecosystem structure and function.
There are measures in place, if necessary, that take into account potential impacts of the fishery on key elements of the ecosystem. The measures are considered likely to work, based on plausible argument (eg, general experience, theory or comparison with similar fisheries/ ecosystems).
There is a partial strategy in place, if necessary, that takes into account available information and is expected to restrain impacts of the fishery on the ecosystem so as to achieve the Ecosystem Outcome 80 level of performance. The partial strategy is considered likely to work, based on plausible argument (eg, general experience, theory or comparison with similar fisheries/ ecosystems). There is some evidence that the measures comprising the partial strategy are being implemented successfully.
There is a strategy that consists of a plan, containing measures to address all main impacts of the fishery on the ecosystem, and at least some of these measures are in place. The plan and measures are based on well-understood functional relationships between the fishery and the Components and elements of the ecosystem. This plan provides for development of a full strategy that restrains impacts on the ecosystem to ensure the fishery does not cause serious or irreversible harm. The measures are considered likely to work based on prior experience, plausible argument or information directly from the fishery/ecosystems involved. There is evidence that the measures are being implemented successfully.
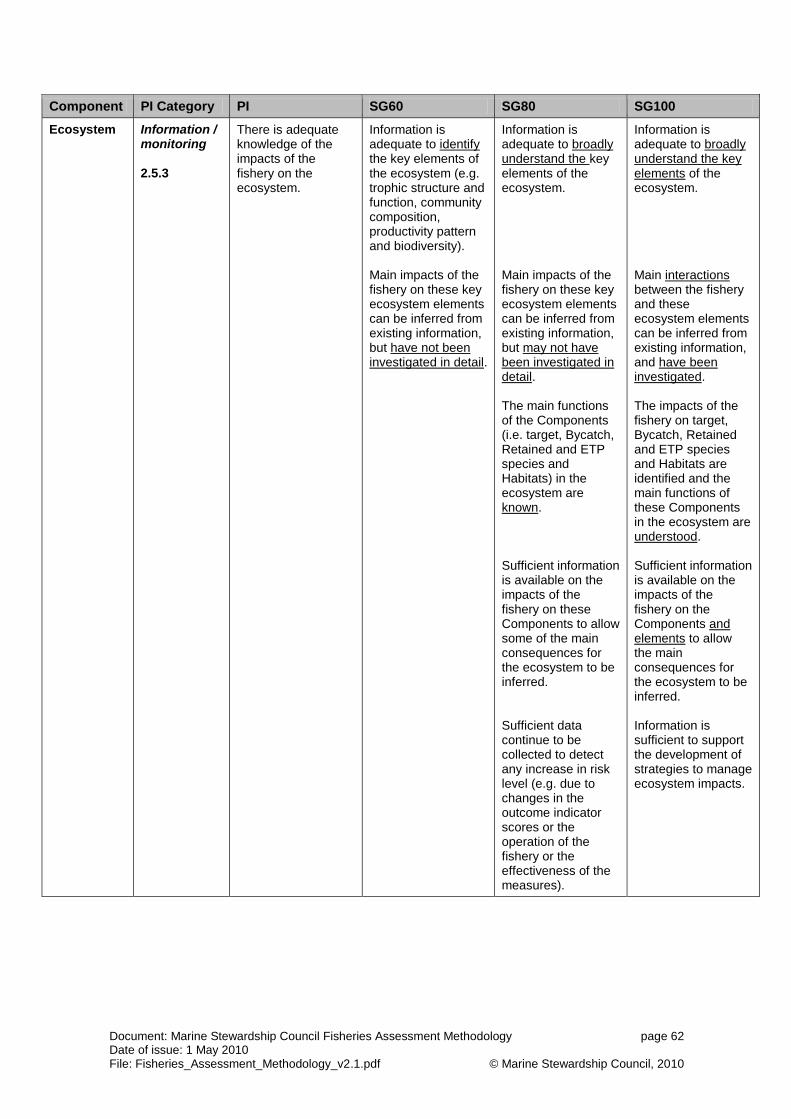
Document: Marine Stewardship Council Fisheries Assessment Methodology page 62 Date of issue: 1 May 2010 File: Fisheries_Assessment_Methodology_v2.1.pdf © Marine Stewardship Council, 2010
Component PI Category PI SG60 SG80 SG100
Ecosystem Information / monitoring 2.5.3
There is adequate knowledge of the impacts of the fishery on the ecosystem.
Information is adequate to identify the key elements of the ecosystem (e.g. trophic structure and function, community composition, productivity pattern and biodiversity). Main impacts of the fishery on these key ecosystem elements can be inferred from existing information, but have not been investigated in detail.
Information is adequate to broadly understand the key elements of the ecosystem. Main impacts of the fishery on these key ecosystem elements can be inferred from existing information, but may not have been investigated in detail. The main functions of the Components (i.e. target, Bycatch, Retained and ETP species and Habitats) in the ecosystem are known. Sufficient information is available on the impacts of the fishery on these Components to allow some of the main consequences for the ecosystem to be inferred. Sufficient data continue to be collected to detect any increase in risk level (e.g. due to changes in the outcome indicator scores or the operation of the fishery or the effectiveness of the measures).
Information is adequate to broadly understand the key elements of the ecosystem. Main interactions between the fishery and these ecosystem elements can be inferred from existing information, and have been investigated. The impacts of the fishery on target, Bycatch, Retained and ETP species and Habitats are identified and the main functions of these Components in the ecosystem are understood. Sufficient information is available on the impacts of the fishery on the Components and elements to allow the main consequences for the ecosystem to be inferred. Information is sufficient to support the development of strategies to manage ecosystem impacts.

Document: Marine Stewardship Council Fisheries Assessment Methodology page 63 Date of issue: 1 May 2010 File: Fisheries_Assessment_Methodology_v2.1.pdf © Marine Stewardship Council, 2010
Section 8: Principle 3
Section 8.1: General guidance on Principle 3
8.1.1 The intent of Principle 3 is to ensure that there is an institutional and operational framework, appropriate to the size and scale of the fishery, for implementing Principles 1 and 2 that is capable of delivering sustainable fisheries in accordance with the outcomes articulated by Principles 1 and 2. The Principle 3 Assessment Tree structure divides the PIs into two Components as shown in Figure 6 and summarized below.
8.1.2 „Governance and Policy‟ captures the broad, high-level context of the fishery management system within which the fishery under assessment is found. Performance elements within this Component include the legal and/or customary framework that overarches the fishery, and possibly other fisheries under the same management framework; the consultation processes and policies, as well as the articulation of the roles and responsibilities of people and organizations within the overarching management system and other overarching policies supporting fisheries management.
8.1.3 „Fishery Specific Management System‟ focuses the certification body on the management system directly applied to the fishery undergoing assessment. Performance indicators under this Component consider the fishery-specific management objectives (i.e. fishery management objectives for the fishery under assessment, specifically); the decision-making processes in the relevant fishery; the fishery‘s compliance and enforcement system and implementation; and research planning and monitoring and evaluation of the performance of the fishery‘s management system. A unit of certification might include only a sub-set of fishers (vessels, fleet operators, individual fishermen) within a wider fleet of fishers fishing for the same biologically distinct stock, using the same method, under the same or similar management system or arrangements. However, it is the management of the wider fleet which denotes the specific ―fishery‖ for the purposes of this Component and shall therefore be the subject of assessment under the fishery-specific management system PIs. Special or additional management arrangements or features unique to the vessels in the unit of certification may be considered and reflected in the scores under the fishery-specific management system PIs.
Figure 6. Principle 3 Assessment Tree Structure

Document: Marine Stewardship Council Fisheries Assessment Methodology page 64 Date of issue: 1 May 2010 File: Fisheries_Assessment_Methodology_v2.1.pdf © Marine Stewardship Council, 2010
Section 8.2: Governance and Policy Performance Indicators
Legal and/or Customary Framework Performance Indicator (PI 3.1.1)
Guidance for use
8.2.1 Key to determining whether fisheries management occurs within a framework that both respects relevant laws and is capable of delivering sustainable fisheries in accordance with MSC‘s Principles 1 and 2, is understanding what is meant by the legal and/or customary framework.
8.2.2 A fishery management system‘s legal and/or customary framework is considered to be the underlying supporting structure, be it formal or informal, that incorporates all the formal and informal practices, procedures and instruments that control, or have an impact on, a fishery. This includes policies and practices of both government and private sectors, including (but not limited to) implementing agencies (eg, fisheries agencies, conservation agencies), fishery business groups (eg, catch sector cooperatives, industry associations), fishing vessel owners, indigenous groups, local civil society or community groups and so on. The government sector includes all applicable government systems, the courts and the relevant parliamentary and regulatory bodies. The management system is not limited to government legislation, nor to industry or customary practice, but is the complex interaction of all such elements, controls and practices that are used in a fishery and result in ‗hard‘ (law) or ‗soft‘ (accepted practice) controls over actual ‗on-water‘ catching practices.
8.2.3 There are four scoring issues to be considered under the Legal and/or Customary Framework PI:
a) Capability of delivering sustainable fisheries in accordance with Principles 1 and 2.
b) Respect for laws.
c) Observing legal rights created explicitly or by custom of people dependent on fishing for food or livelihood.
d) Dispute mechanisms.
Capability of delivering sustainable fisheries in accordance with Principles 1 and 2
8.2.4 The scoring issue for this performance indicator relates to the presence or absence of an appropriate and effective legal and/or customary framework that is capable of delivering sustainable fisheries in accordance with MSC‘s Principles 1 and 2.
8.2.5 Scoring this part of the indicator means focussing on the existence of a framework itself and whether it is capable of delivering sustainable fisheries. This may be determined by examining the presence or absence of the essential features of an appropriate and effective structure within which management takes place, and whether those features are hard (formal laws, regulations, etc) or soft (accepted practice, tradition or custom), whether the framework has a focus on long term management rather the short term and how it manages risk and uncertainty. Also important is whether the framework is transparent and open to scrutiny, review and adaptation as new information becomes available. Under PI 3.1.1 it is not appropriate to assess each feature of the management system and score it effectiveness.
8.2.6 Across SGs 60, 80 and 100, ―generally consistent‖ means that the client can provide the certification body with objective evidence that most of the essential features and elements needed to deliver sustainable fisheries are present in a coherent, logical set of practices or procedures or within a coherent, logical supporting ‗rule-making‘ structure (these could be formalised under rule of law, or informal but known through traditional or customary means). The essential features are defined by their relevance to achieving sustainable fisheries in accordance with Principles 1 and 2, in accordance with the size and scale of the fishery, and may include: establishing when and where people can fish; who can fish; how they may fish; how much they can catch; what they can catch; who they talk to about the ‗rules‘ for fishing; how they might gather relevant information and

Document: Marine Stewardship Council Fisheries Assessment Methodology page 65 Date of issue: 1 May 2010 File: Fisheries_Assessment_Methodology_v2.1.pdf © Marine Stewardship Council, 2010
decide what to do with it; how they know that people are abiding by whatever ‗rules‘ are made and how they catch, sanction or penalise wrongdoers. In this sense the operational framework could be said to be generally consistent with local, national or international laws or standards.
Respect for laws
8.2.7 Another scoring issue under the Legal and/or Customary Framework PI relates to the issue of ‗respect for laws‘ through the presence or absence of actual legal disputes.
8.2.8 This part of the performance indicator is concerned with whether the fishery is operating within the legal or customary framework and whether there is any evidence that it is not.
8.2.9 The MSC Board of Trustees has determined that the precedent set by the Bering Sea/Aleutian Islands Pollock Fishery objection decision it made in 2004 will guide interpretation of this part of the performance indicator:
a) Respect for laws is different to compliance with laws and this part of the indicator does not require that a fishery management system be in perfect minute-to-minute compliance with every single piece of substantive or procedural law that may govern a fishery. This would elevate form over substance to set the bar so high. Rather, should a fisheries management agency be subject to court challenges, it is the record of repeated violation of the same law or regulation, the timely attempts to comply with binding judicial decisions or acting proactively to avoid legal disputes that are important in determining the level of performance against this part of the performance indicator. Indeed, when assessing the importance of any evidence relating to this issue, the certification body should consider whether any violations of the same law or regulations compromise the ability of the management system to deliver sustainable fisheries in accordance with the outcomes intended by MSC‘s Principles 1 and 2.
Observing legal rights created explicitly or established by custom of people dependent on fishing for food or livelihood
8.2.10 Certification bodies shall not make their own judgements or unilateral decisions about whether custom or national treaties relating to aboriginal or indigenous people have conferred rights upon any particular group or individual. Decisions of legislatures (through statutes or national treaties relating to aboriginal or indigenous people), or courts will establish this. The main consideration in relation to performance against this scoring issue is whether a suitable framework exists or does not exist to address the legal rights created explicitly or established by custom of people dependent on fishing for food or livelihood, not on the effectiveness or results (e.g. allocation of access) of such a framework. The use of the term treaties, in relation to this specific scoring issue, does not include international treaties or treaties between States or nations, and is limited, in this context to national treaties relating specifically to aboriginal or indigenous people.
8.2.11 In accordance with MSC‘s Principles and Criteria, issues and disputes involving allocation of quota and access to marine resources are beyond the scope of an assessment against the MSC standard.
8.2.12 SG60 ―Generally respect‖ means that there is some evidence that the legal rights created explicitly or established by custom of people dependent on fishing for food or livelihood, and their long term interests, are considered within the legal and/or customary framework for managing fisheries. At the SG60 level, this may involve accepted practice or custom (soft or informal arrangements) rather than formal arrangements or hard law.
8.2.13 SG80 ―Observes‖ means there are more formal arrangements such as bylaws or regulation that make explicit the requirement to consider the legal rights created explicitly or by custom of people dependent on fishing for food or livelihood, and their long term interests, are taken into account within the legal and/or customary framework for managing fisheries.

Document: Marine Stewardship Council Fisheries Assessment Methodology page 66 Date of issue: 1 May 2010 File: Fisheries_Assessment_Methodology_v2.1.pdf © Marine Stewardship Council, 2010
8.2.14 SG100 ―Formally committed‖ means that the certification client can demonstrate a mandated legal basis where rights are fully codified within the fishery management system and/or its policies and procedures for managing fisheries under a legal framework.
Consultation, Roles and Responsibilities Performance Indicator (PI 3.1.2)
Guidance for use
Consultation
8.2.15 The focus for scoring should be the effectiveness of the consultation processes implemented by fisheries managers to obtain information from a wide range of sources, including local knowledge (defined below), for input into a broad range of decisions, policies and practices within the management system. Scoring under this performance indicator shall not focus on the type of information obtained, or on mandating for what or how it must be used. The material point of the consultation part of the performance indicator is that the management system is open to interested or affected parties and stakeholders and that any information that is viewed as important by those parties can be fed into and be considered by the process in a way that is transparent to the interested or affected parties and stakeholders.
8.2.16 The SG80 and 100 guideposts under the consultation part of the performance indicator introduce the added elements of demonstrating that whatever information is gathered, it is considered and that there is transparency about its use or lack of use. The demonstration and explanation (at SG100) required may not necessarily be additional reporting beyond what may already occur in a fishery management system, for example there may be regular newsletters, broadcasts or reports that go out to interested or affected parties or stakeholders, or information pages published and distributed, or the minutes of meetings put on the public record for people to see, electronic mail or other e-technologies may be used, or if dealing with stakeholders who don‘t have access or ability to read reports, watch broadcasts or use computers there may be report back meetings or other such means to report what happened. There are many possibilities that could pass the burden of proof. Certification bodies will need to be satisfied that what is offered as evidence does indeed meet the standard of demonstrating consideration of the information (being transparent) and also explains how the information was or was not used. If a fishery management system does not currently do this, then it cannot score 100 without implementing some form of transparency about how information is used or not used.
8.2.17 Effective consultation processes within the management system must be appropriate to the scale, intensity and cultural context of the fishery. This should include consideration of consultation processes at both the management system level and fishery-specific management systems that occur within it. For example, but importantly not confined to, consultation at the level of broad policy development and at the level of research planning.
8.2.18 Affected parties, depending on the context, may include (but are not limited to) individuals, mandated representatives, and/or participants in the fishery.
Local knowledge
8.2.19 ―Local knowledge‖ means: qualitative, and/or anecdotal, and/or quantitative information, and/or data that come from individuals or groups local to the fisheries managed under the fisheries management system. The knowledge may be long-term knowledge held by many fishers or community members, it might be place-based, i.e., local to a particular geographical area, and may have social, economic or ecological dimensions. Local knowledge will reflect the knowledge and opinions about issues held by individuals and groups local to relevant fisheries. Local knowledge can be valuable first-hand experience that might inform any fisheries management process, including fisheries research, data collection and resource assessment, monitoring, control and surveillance operations, policies and processes, and fisheries management policies, practices and/or decisions.
Document: Marine Stewardship Council Fisheries Assessment Methodology page 67 Date of issue: 1 May 2010 File: Fisheries_Assessment_Methodology_v2.1.pdf © Marine Stewardship Council, 2010
Evaluation of the relative value and robustness of local knowledge in the management process may form part of the process of being transparent about how information is considered and used or not used under SG80 and SG100.
8.2.20 Individuals or groups could include, but not be limited to, fishers, indigenous people, local community representatives or groups, local civil society groups like local NGOs, local fishing businesses and/or their representatives, local government representatives or politicians.
Roles and responsibilities
8.2.21 Consideration of the roles and responsibilities of the fishers in relation to their cooperation with the collection of relevant information and data, where relevant and/or necessary, may be considered under this performance indicator. In doing so, this will take account of MSC‘s Criterion P3,B17 which relates to fishing operations assisting and cooperating with management authorities in the collection of catch, discard, and other information of importance to the effective management of the resources and the fishery.
Long Term Objectives Performance Indicator (PI 3.1.3)
Guidance for use
8.2.22 The emphasis of this performance indicator is about the presence or otherwise of long term objectives which guide decision-making that is consistent with MSC‘s Principles and Criteria and the precautionary approach (defined below): either long term objectives implied within management policy (SG60); clearly set out in management policy (SG80); or a requirement of management policy that decision-making pursues explicit long term objectives (SG100).
8.2.23 Management policy, in the context of this performance indicator, means outside the specific fishery under assessment (i.e., at a higher level or within a broader context than the fishery-specific management system).
Precautionary approach
8.2.24 The intention under this PI is that scoring focuses on the consistency of any long term objectives within overarching management policy with the notions of being cautious when information is uncertain etc., and taking action even when information is inadequate. Therefore, the precautionary approach, in this context and for the purposes of scoring this performance indicator, means: being cautious when information is uncertain, unreliable or inadequate, and that the absence of adequate scientific information shall not be used as a reason for postponing or failing to take conservation and management measures.
ii
8.2.25 It is not intended that this performance indicator be a second opportunity to score fisheries on the use or otherwise of target and limit reference points which are scored under Principle 1 of the Assessment Tree, nor to point Certification Bodies towards Article 6, Annex II of the Fish Stocks Agreement for a prescriptive list of what must appear in management policy per se in relation to the precautionary approach. Nor should it direct Certification Bodies towards re-scoring management strategies or outcomes covered both in Principles 1 and 2 or decision-making processes covered in a separate performance indicator under Principle 3 where precaution and the precautionary approach are also mentioned.
8.2.26 At its most basic, this performance indicator forms an important part of the overall understanding of the use or otherwise of a precautionary approach in the fishery under assessment but is not concerned with the operational implementation of the
ii Definition of the precautionary approach derived from Article 6, UN Agreement for the implementation of
the provisions of UNCLOS of 10 December 1982 relating to the conservation and management of straddling fish stocks and highly migratory fish stocks. Also known as the ―Fish Stocks Agreement‖.

Document: Marine Stewardship Council Fisheries Assessment Methodology page 68 Date of issue: 1 May 2010 File: Fisheries_Assessment_Methodology_v2.1.pdf © Marine Stewardship Council, 2010
precautionary approach within the ‗day-to-day‘ management of the fishery itself. This performance indicator deals only with the high or broad management policy context – perhaps within overarching legislation, perhaps policy or custom that applies to many or all fisheries within a broader management system – and with whether laws, policies, practices or customs at that high or broad level imply or specify and/or require long term objectives that are consistent with a precautionary approach as defined above, as well as with the pursuit and achievement of outcomes consistent with MSC‘s Principles 1 and 2.
Incentives for Sustainable Fishing Performance Indicator (PI 3.1.4)
Guidance for use
8.2.27 This performance indicator gives effect to Criterion P3,A6.
8.2.28 When considering whether the fishery management system provides for incentives that are consistent with achieving the outcomes expressed by MSC Principles 1 and 2 (SG60 and SG80), the key issue in this part of the SG is to score the system with reference to whether it ‗opens the door‘ for the possibility for positive incentives. Does the system have attributes, policies or principles that would tend to incentivise fishers to fish sustainably, that engender a sense of stewardship of the resources? For example, policies that attempt to provide stability and/or security for fishers amid the uncertainties that come with complex and dynamic systems. This may involve, but not be limited to, the system providing for reducing information gaps and uncertainties for fishers; providing for strategic or statutory management planning to give certainty about the rules and goals of management; providing for mechanisms and opportunities to gain support for the management system from fishers; or fishery management system features that encourage collective action while allowing individual choice such that individual decisions are steered towards public good. Similarly, perhaps the system provides for the clarification of roles, rights and responsibilities of the various stakeholders; engenders a sense of ownership (possibly, but not necessarily, through rights-based measures); or provides for a participatory approach to management, research and other relevant processes.
8.2.29 In addition to considering whether the fishery management system provides for incentives that are consistent with achieving sustainable outcomes, at SG80, certification bodies should take into account the existence of perverse incentives, i.e. incentives for fishers to fish unsustainably, and that the system is seeking to ensure that perverse incentives do not arise. For instance, management systems should not include subsidies that obviously contribute* to unsustainable** fishing. Since there is not yet international agreement on what actions should be considered subsidies and which of these may be considered ―good‖ or ―bad‖ under different circumstances, certification bodies should not attempt to identify and classify all subsidies in the fishery under evaluation. Instead, they should only take note of any issues that are quite clearly and obviously perverse incentives that are contributing to, or have significant potential to contribute to, unsustainable fishing.
* Contribute, in this context, means contributing to unsustainable fishing at the time of assessment for certification.
** Unsustainable, in this context, means unsustainable in an ecological / environmental sense, not economically unsustainable.
8.2.30 At SG100, the ‗theoretically perfect‘ fishery, the expectation is that the management system actively and explicitly considers and reviews management policies and procedures with particular attention paid to the issue of incentives to make sure they are not contributing to unsustainable fishing practices.

Document: Marine Stewardship Council Fisheries Assessment Methodology page 69 Date of issue: 1 May 2010 File: Fisheries_Assessment_Methodology_v2.1.pdf © Marine Stewardship Council, 2010
Section 8.3: Fishery-specific management system performance indicators
8.3.1 All aspects of the fishery-specific management system shall be appropriate to the scale, intensity and cultural context of the fishery under assessment.
Fishery-Specific Objectives Performance Indicator (PI 3.2.1)
Guidance for use
8.3.2 It should be noted that the individual harvest or management strategies that are scored in performance indicators under Principles 1 and 2, would be expected to be consistent with the fishery-specific objectives being scored here under Principle 3. In other words, the objectives shall be assessed here and the strategies that implement the objectives shall be assessed under Principles 1 and 2.
8.3.3 ―Measurable‖, in the context of SG100 for this performance indicator, means that in addition to setting fishery-specific objectives that make broad statements, such as ―the impact on dependent species will be reduced‖, objectives are operationally defined in such a way that the performance against the objective can be measured. For example, ―the impact on dependent predators will be reduced by x% over y years‖. Please note that the example is not to be taken as a specific requirement or inclusive list, or the only subject matter for objectives.
Decision-Making Processes Performance Indicator (PI 3.2.2)
Guidance for use
8.3.4 The performance indicator states: ―…decision-making processes that result in measures and strategies etc‖. In this context, the relevant performance-related issue is whether the decision-making processes actually produce measures and strategies, not an evaluation of the quality of those measures and strategies which is covered elsewhere in the Assessment Tree structure under Principles 1 and 2. The assessment issue is about the decision-making processes themselves.
8.3.5 Each scoring guidepost (SG60, SG80 and SG100) refers to decision-making processes taking account of the wider implications of decisions. This means the processes take account of, for example, the consequences of decisions on management objectives for target species on the ecosystem, and of the impacts on those who depend on the fishery for their livelihoods (thus giving effect to the final sentence of Criterion P3,A2).
8.3.6 The precautionary approach, in this context and for the purposes of scoring this performance indicator at SG80 and SG100, means that decision-making processes themselves use caution when information is uncertain, unreliable or inadequate, and that the absence of adequate scientific information shall not be used as a reason for postponing or failing to take conservation and management measures
ii.
8.3.7 At SG100, resulting measures and strategies from decision-making processes should involve comprehensive, integrated suites of measures or holistic strategies, rather than individual or single measures.
Compliance and Enforcement Performance Indicator (PI 3.2.3)
Guidance for use
8.3.8 In assessing the existence and implementation of monitoring, control and surveillance systems (at SG60, SG80 and SG100), efforts to inform fishers about their obligations under the fishery-specific management system may be considered, but should not be limited to this.
8.3.9 To give effect to Criterion P3, B17, one of the elements that should influence scoring is the reference in the scoring guideposts to fishers cooperating, where necessary, with management authorities in the collection of catch, discard and other information that is of importance to the effective management of the resources and the fishery.

Document: Marine Stewardship Council Fisheries Assessment Methodology page 70 Date of issue: 1 May 2010 File: Fisheries_Assessment_Methodology_v2.1.pdf © Marine Stewardship Council, 2010
8.3.10 At SG80 and SG100, in some fisheries management systems or for particular types of fisheries, it may be difficult to demonstrate an ability to enforce relevant management measures, strategies and/or rules if violations are rare. This could be taken, in an outcome sense, that monitoring, compliance and surveillance (MCS) is effective. However, paradoxically, an absence of violations (or absence of a record of sanctions and penalties for violations) does not necessarily indicate that compliance and enforcement are effective; it could mean that MCS is in fact ineffective and what is happening is an absence of detection. To the extent possible, independent and credible information from relevant compliance and enforcement agencies or individuals and/or stakeholders should inform the judgement of the assessment team on this indicator.
8.3.11 At SG100, consideration of whether the monitoring, control and surveillance system is comprehensive should include: coverage; the independence of the system; and its internal checks and balances.
Research Plan Performance Indicator (PI 3.2.4)
Guidance for use
8.3.12 This performance indicator gives effect to Criterion P3,A8 which states that the management system shall incorporate a research plan, appropriate to the scale and intensity of the fishery, which addresses the information needs of management and provides for dissemination of research results to all interested parties in a timely fashion.
8.3.13 This performance indicator should consider the achievement of a strategic approach (at SG80) and a coherent and strategic approach (at SG100) to research. A strategic approach is pro-active, anticipatory and identifies gaps in knowledge in advance driven by management needs. Coherent touches on all aspects of the system and how they are integrated together. Certification bodies shall make sure scoring is not duplicated with the Management Strategy and Information PIs in Principles 1 and 2. Low scores in Principle 1 and Principle 2 may be caused by lack of specific information or research programmes to deliver them, whereas this performance indicator is concerned with the presence or otherwise of overall strategic research planning. At both SG80 and SG100, the reference to a "research plan" shall be taken to indicate the existence of an actual, written document that includes a specific research plan relating to the fishery under assessment. The extent of the document should be relevant to the scale and intensity of the fishery and the issues requiring research.
8.3.14 Consideration of reliability, in the context of SG80 and 100 for this performance indicator, should include consideration of the level of effective coordination among research providers, the accessibility of research plans and results to the managing ‗entity‘ (such as the managing agency or authority), and the quality of the research itself.
8.3.15 A comprehensive research plan, in the context of SG100, refers to research that goes beyond the immediate short term needs of management to create a strategic body of research relevant to the long term management needs of the fishery.
Monitoring and Management Performance Evaluation Performance Indicator (PI 3.2.5)
Guidance for use
8.3.16 This performance indicator gives effect to the part of Criterion P3,A3 that relates to the management system having a process of monitoring and evaluating management performance, appropriate to the cultural context, scale and intensity of the fishery, and relevant to the whole system not just management outcomes.
8.3.17 In the context of each scoring guidepost under this performance indicator, relevant ―parts‖ of the management system can include MCS (i.e., Compliance and Enforcement PI), research plan, feedback and response, and monitoring systems as required by the Management Strategy and Information Performance Indicators in Principles 1 and 2.

Document: Marine Stewardship Council Fisheries Assessment Methodology page 71 Date of issue: 1 May 2010 File: Fisheries_Assessment_Methodology_v2.1.pdf © Marine Stewardship Council, 2010
8.3.18 At SG80 and 100, ―external review‖ means external to the fisheries management system, but not necessarily international. It could be by another department within an agency, or another agency or organisation within the country, or through a government audit that is external to the fisheries management agency, or a peer organisation nationally or internationally, or external expert reviewers, depending upon the scale and intensity of the fishery. Occasional and regular should also be interpreted in the context of the intensity of the fishery.

Document: Marine Stewardship Council Fisheries Assessment Methodology page 72 Date of issue: 1 May 2010 File: Fisheries_Assessment_Methodology_v2.1.pdf © Marine Stewardship Council, 2010
Section 8.4: Principle 3 Performance Indicators and Scoring Guideposts
Component PI Category PI SG60 SG80 SG100
Governance and policy
Legal and/or customary framework 3.1.1
The management system exists within an appropriate and effective legal and/or customary framework which ensures that it: - Is capable of delivering sustainable fisheries in accordance with MSC Principles 1 and 2; - Observes the legal rights created explicitly or established by custom of people dependent on fishing for food or livelihood; and - Incorporates an appropriate dispute resolution framework.
The management system is generally consistent with local, national or international laws or standards that are aimed at achieving sustainable fisheries in accordance with MSC Principles 1 and 2. The management system incorporates or is subject by law to a mechanism for the resolution of legal disputes arising within the system. Although the management authority or fishery may be subject to continuing court challenges, it is not indicating a disrespect or defiance of the law by repeatedly violating the same law or regulation necessary for the sustainability for the fishery. The management system has a mechanism to generally respect the legal rights created explicitly or established by custom of people dependent on fishing for food or livelihood in a manner consistent with the objectives of MSC Principles 1 and 2.
The management system is generally consistent with local, national or international laws or standards that are aimed at achieving sustainable fisheries in accordance with MSC Principles 1 and 2. The management system incorporates or is subject by law to a transparent mechanism for the resolution of legal disputes which is considered to be effective in dealing with most issues and that is appropriate to the context of the fishery. The management system or fishery is attempting to comply in a timely fashion with binding judicial decisions arising from any legal challenges. The management system has a mechanism to observe the legal rights created explicitly or established by custom of people dependent on fishing for food or livelihood in a manner consistent with the objectives of MSC Principles 1 and 2.
The management system is generally consistent with local, national or international laws or standards that are aimed at achieving sustainable fisheries in accordance with MSC Principles 1 and 2. The management system incorporates or is subject by law to a transparent mechanism for the resolution of legal disputes that is appropriate to the context of the fishery and has been tested and proven to be effective. The management system or fishery acts proactively to avoid legal disputes or rapidly implements binding judicial decisions arising from legal challenges. The management system has a mechanism to formally commit to the legal rights created explicitly or established by custom on people dependent on fishing for food and livelihood in a manner consistent with the objectives of MSC Principles 1 and 2.

Document: Marine Stewardship Council Fisheries Assessment Methodology page 73 Date of issue: 1 May 2010 File: Fisheries_Assessment_Methodology_v2.1.pdf © Marine Stewardship Council, 2010
Component PI Category PI SG60 SG80 SG100
Governance and policy
Consultation, roles and responsibilities 3.1.2
The management system has effective consultation processes that are open to interested and affected parties. The roles and responsibilities of organisations and individuals who are involved in the management process are clear and understood by all relevant parties.
Organisations and individuals involved in the management process have been identified. Functions, roles and responsibilities are generally understood. The management system includes consultation processes that obtain relevant information from the main affected parties, including local knowledge, to inform the management system.
Organisations and individuals involved in the management process have been identified. Functions, roles and responsibilities are explicitly defined and well understood for key areas of responsibility and interaction. The management system includes consultation processes that regularly seek and accept relevant information, including local knowledge. The management system demonstrates consideration of the information obtained. The consultation process provides opportunity for all interested and affected parties to be involved.
Organisations and individuals involved in the management process have been identified. Functions, roles and responsibilities are explicitly defined and well understood for all areas of responsibility and interaction. The management system includes consultation processes that regularly seek and accept relevant information, including local knowledge. The management system demonstrates consideration of the information and explains how it is used or not used. The consultation process provides opportunity and encouragement for all interested and affected parties to be involved, and facilitates their effective engagement.
Governance and policy
Long term objectives 3.1.3
The management policy has clear long-term objectives to guide decision-making that are consistent with MSC Principles and Criteria, and incorporates the precautionary approach.
Long-term objectives to guide decision-making, consistent with MSC Principles and Criteria and the precautionary approach, are implicit within management policy.
Clear long-term objectives that guide decision-making, consistent with MSC Principles and Criteria and the precautionary approach, are explicit within management policy.
Clear long-term objectives that guide decision-making, consistent with MSC Principles and Criteria and the precautionary approach, are explicit within and required by management policy

Document: Marine Stewardship Council Fisheries Assessment Methodology page 74 Date of issue: 1 May 2010 File: Fisheries_Assessment_Methodology_v2.1.pdf © Marine Stewardship Council, 2010
Component PI Category PI SG60 SG80 SG100
Governance and policy
Incentives for sustainable fishing 3.1.4
The management system provides economic and social incentives for sustainable fishing and does not operate with subsidies that contribute to unsustainable fishing.
The management system provides for incentives that are consistent with achieving the outcomes expressed by MSC Principles 1 and 2.
The management system provides for incentives that are consistent with achieving the outcomes expressed by MSC Principles 1 and 2, and seeks to ensure that perverse incentives do not arise.
The management system provides for incentives that are consistent with achieving the outcomes expressed by MSC Principles 1 and 2, and explicitly considers incentives in a regular review of management policy or procedures to ensure that they do not contribute to unsustainable fishing practices.

Document: Marine Stewardship Council Fisheries Assessment Methodology page 75 Date of issue: 1 May 2010 File: Fisheries_Assessment_Methodology_v2.1.pdf © Marine Stewardship Council, 2010
Component PI Category PI SG60 SG80 SG100
Fishery- specific management system
Fishery- specific objectives 3.2.1
The fishery has clear, specific objectives designed to achieve the outcomes expressed by MSC‘s Principles 1 and 2.
Objectives, which are broadly consistent with achieving the outcomes expressed by MSC‘s Principles 1 and 2, are implicit within the fishery‘s management system.
Short and long term objectives, which are consistent with achieving the outcomes expressed by MSC‘s Principles 1 and 2, are explicit within the fishery‘s management system.
Well defined and measurable short and long term objectives, which are demonstrably consistent with achieving the outcomes expressed by MSC‘s Principles 1 and 2, are explicit within the fishery‘s management system.
Fishery- specific management system
Decision-making processes 3.2.2
The fishery-specific management system includes effective decision-making processes that result in measures and strategies to achieve the objectives.
There are informal decision-making processes that result in measures and strategies to achieve the fishery-specific objectives. Decision-making processes respond to serious issues identified in relevant research, monitoring, evaluation and consultation, in a transparent, timely and adaptive manner and take some account of the wider implications of decisions.
There are established decision-making processes that result in measures and strategies to achieve the fishery-specific objectives. Decision-making processes respond to serious and other important issues identified in relevant research, monitoring, evaluation and consultation, in a transparent, timely and adaptive manner and take account of the wider implications of decisions. Decision-making processes use the precautionary approach and are based on best available information. Explanations are provided for any actions or lack of action associated with findings and relevant recommendations emerging from research, monitoring, evaluation and review activity.
There are established decision-making processes that result in measures and strategies to achieve the fishery-specific objectives. Decision-making processes respond to all issues identified in relevant research, monitoring, evaluation and consultation, in a transparent, timely and adaptive manner and take account of the wider implications of decisions. Decision-making processes use the precautionary approach and are based on best available information. Formal reporting to all interested stakeholders describes how the management system responded to findings and relevant recommendations emerging from research, monitoring, evaluation and review activity.
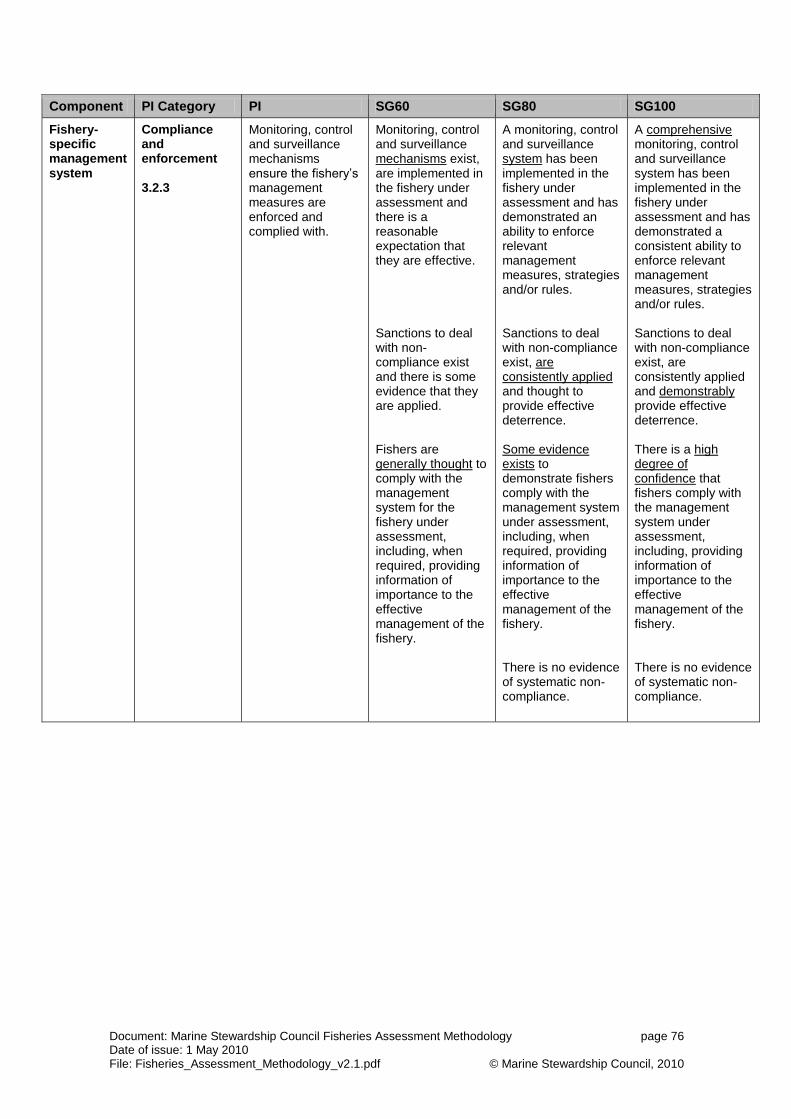
Document: Marine Stewardship Council Fisheries Assessment Methodology page 76 Date of issue: 1 May 2010 File: Fisheries_Assessment_Methodology_v2.1.pdf © Marine Stewardship Council, 2010
Component PI Category PI SG60 SG80 SG100
Fishery- specific management system
Compliance and enforcement 3.2.3
Monitoring, control and surveillance mechanisms ensure the fishery‘s management measures are enforced and complied with.
Monitoring, control and surveillance mechanisms exist, are implemented in the fishery under assessment and there is a reasonable expectation that they are effective. Sanctions to deal with non-compliance exist and there is some evidence that they are applied. Fishers are generally thought to comply with the management system for the fishery under assessment, including, when required, providing information of importance to the effective management of the fishery.
A monitoring, control and surveillance system has been implemented in the fishery under assessment and has demonstrated an ability to enforce relevant management measures, strategies and/or rules. Sanctions to deal with non-compliance exist, are consistently applied and thought to provide effective deterrence. Some evidence exists to demonstrate fishers comply with the management system under assessment, including, when required, providing information of importance to the effective management of the fishery. There is no evidence of systematic non-compliance.
A comprehensive monitoring, control and surveillance system has been implemented in the fishery under assessment and has demonstrated a consistent ability to enforce relevant management measures, strategies and/or rules. Sanctions to deal with non-compliance exist, are consistently applied and demonstrably provide effective deterrence. There is a high degree of confidence that fishers comply with the management system under assessment, including, providing information of importance to the effective management of the fishery. There is no evidence of systematic non-compliance.

Document: Marine Stewardship Council Fisheries Assessment Methodology page 77 Date of issue: 1 May 2010 File: Fisheries_Assessment_Methodology_v2.1.pdf © Marine Stewardship Council, 2010
Component PI Category PI SG60 SG80 SG100
Fishery- specific management system
Research plan 3.2.4
The fishery has a research plan that addresses the information needs of management.
Research is undertaken, as required, to achieve the objectives consistent with MSC‘s Principles 1 and 2. Research results are available to interested parties.
A research plan provides the management system with a strategic approach to research and reliable and timely information sufficient to achieve the objectives consistent with MSC‘s Principles 1 and 2. Research results are disseminated to all interested parties in a timely fashion.
A comprehensive research plan provides the management system with a coherent and strategic approach to research across P1, P2 and P3, and reliable and timely information sufficient to achieve the objectives consistent with MSC‘s Principles 1 and 2. Research plan and results are disseminated to all interested parties in a timely fashion and are widely and publicly available.
Fishery- specific management system
Monitoring and management performance evaluation 3.2.5
There is a system for monitoring and evaluating the performance of the fishery-specific management system against its objectives. There is effective and timely review of the fishery-specific management system.
The fishery has in place mechanisms to evaluate some parts of the management system and is subject to occasional internal review.
The fishery has in place mechanisms to evaluate key parts of the management system and is subject to regular internal and occasional external review.
The fishery has in place mechanisms to evaluate all parts of the management system and is subject to regular internal and external review.

Document: Marine Stewardship Council Fisheries Assessment Methodology page 78 Date of issue: 1 May 2010 File: Fisheries_Assessment_Methodology_v2.1.pdf © Marine Stewardship Council, 2010
Section 9: Glossary
The table below contains a glossary of terms used throughout this methodology
Accreditation The process by which the MSC examines and determines the fitness of a certifying body to be a MSC Certification Body authorised and designated as competent to conduct a fishery assessment according to the MSC Principles and Criteria
AHP Analytic Hierarchy Process: a methodology that provides decision-makers with the ability to incorporate both qualitative (judgmental) and quantitative factors into a decision making process; based on a hierarchical decision model comprising a goal, decision criteria, perhaps several levels of sub-criteria
Assessment The process of implementing the MSC methodologies for assessing and certifying a fishery against the MSC standard
Assessment Methodology
This methodology certification bodies shall use for assessing fisheries against the MSC standard
Assessment tree The hierarchy of Principles, Components, Performance Indicators and Scoring Guideposts that is used as the basis for assessment of the fishery for compliance with the MSC Principles and Criteria for Sustainable Fishing
Certificate The formal document that is issued to a Client as evidence that a fishery is currently certified and complies with the MSC Principles and Criteria
Certification Body A legally constituted entity that conducts certification of conformity; the legal entity responsible for conducting the fishery assessment
Certified fishery A fishery that has been assessed, found to meet the MSC standard and, as a result, has been certified by a Certification Body.
Client The legal entity applying for the fishery to be assessed
Component The second level of three within the Assessment Tree structure.
Condition A requirement to achieve outcomes in order to achieve a score of 80 or above.
Criterion (Criteria) A sub-division of an MSC Principle.
Depleted In the context of the PISGs, means a stock that is consistently below the target reference point, and which may be approaching the point at which recruitment is impaired. Stocks below the point at which recruitment is impaired are not considered to be eligible for MSC certification and have no definition in this scheme.
Ecological role In the context of Principle 1, the trophic role of a stock within the ecosystem under assessment against the MSC standard.
Ecosystem services
Ecosystem services are usually considered to include: provisioning such as the production of food and fibre; regulating, such as regulation of ecosystem processes; supporting, such as nutrient cycles, photosynthesis and habitats that provide the other ecosystem services; and cultural, such as spiritual and recreational benefits.
Expert Choice The software used to support the development of the decision tree, and to assemble the scores of the fishery determined during the assessment
Fisheries Certification Methodology: FCM
An MSC Scheme Document: the rules and procedures to be followed by certification bodies when assessing and certifying fisheries against the MSC standard
Harvest control rule: HCR
A set of well-defined pre-agreed rules or actions used for determining a management action in response to changes in indicators of stock status with respect to reference points
Harvest strategy The combination of monitoring, stock assessment, harvest control rules and management actions, which may include an MP or an MP (implicit) and be tested by MSE
Level Layer within the Assessment Tree hierarchy: Principle; Component; Performance Indicator; or Scoring Guidepost
MP approach Management of a resource using a fully specified set of rules incorporating feedback control; the approach is explicitly precautionary through its

Document: Marine Stewardship Council Fisheries Assessment Methodology page 79 Date of issue: 1 May 2010 File: Fisheries_Assessment_Methodology_v2.1.pdf © Marine Stewardship Council, 2010
requirement for simulation trials to have demonstrated robust performance across a range of uncertainties about resource status and dynamics
MP (implicit) A set of rules for management of a resource that contains the elements of an MP, but has not yet been evaluated through simulation trials
MP: Management Procedure
The combination of pre-defined data, together with an algorithm to which such data are input to provide a value for a TAC or effort control measure; this combination has been demonstrated, through simulation trials, to show robust performance in the presence of uncertainties. Additional rules may be included, for example to spread a TAC spatially to cater for uncertainty about stock structure. Two types of MP may be distinguished:
Empirical MP: An MP where resource-monitoring data (such as survey estimates of abundance) are input directly into a formula that generates a control measure such as a TAC without an intermediate (typically population-model based) estimator;
Model-based MP: An MP where the process used to generate a control measure such as a TAC (this process is sometimes termed a catch limit algorithm or CLA) is a combination of an estimator and an HCR.
MSC Principles and Criteria
The MSC‘s Principles and Criteria for Sustainable Fishing: a high level statement of the attributes of a well managed and sustainable fishery. Also called the MSC standard
MSC standard The MSC‘s Principles and Criteria for Sustainable Fishing. The standard against which fisheries are assessed for compliance in order to achieve certification
MSE: Management Strategy Evaluation
Usually synonymous with MP approach; also often used to describe the process of testing generic MPs or harvest strategies
Objective evidence
Evidence supported by independent witnesses, resulting from quality peer-reviewed scientific research, or otherwise verifiable and credible
Performance Indicator: PI
The lowest level in the Assessment Tree; the level at which the performance of the fishery is scored by the Assessment Team
PISGs Performance Indicators and Scoring Guideposts
Principle A fundamental element, in the MSC‘s case, used as the basis for defining a well-managed and sustainable fishery
Re-assessment Assessment of a fishery prior to the expiration of an existing fishery certificate to ensure, if the fishery passes the MSC standard, continued certification
Reference Points Biological reference points; Stock Status Reference Points used to define management action in response to stock status
Risk-Based Framework: RBF
MSC‘s approach and methods for assessing performance indicators when data-deficient situations are encountered.
Scientific Assessment
The scientific assessment of the status of a part of the fishery or ecosystem (eg, Stock Assessment, Ecosystem Impact Assessment).
Scoring elements In the case of Principles 1 or 2, used to mean a sub-division of individual parts of the ecosystem affected by the fishery, such as different species/stocks/sub-stocks or habitats within a Component.
Scoring Guidepost: SG
The level of performance established equating to numeric scores of 60, 80 or 100 for each Performance Indicator.
Scoring issues The different parts of a single scoring guidepost, where more than one part exists covering related but different topics.
Scheme Document
Official documents setting out rules and procedures for accreditation, certification and assessment relevant to the MSC certification programme.
Simulation trial (or test)
A computer simulation to project resource dynamics for a particular scenario forward for a specified period, under controls specified within an MP, to ascertain performance; such projections will typically be repeated a large number of times to capture variability
Species When ―species‖ is used in these Guidelines, it is intended to refer to any or all of stocks, populations, individual species, or groupings of species,

Document: Marine Stewardship Council Fisheries Assessment Methodology page 80 Date of issue: 1 May 2010 File: Fisheries_Assessment_Methodology_v2.1.pdf © Marine Stewardship Council, 2010
depending on the context. In contexts such as bycatch there may be a large number of individual species taken in a fishery, such that it is impractical and inefficient to attempt to address status and impact of each species individually. In such cases it is acceptable to group species with similar biological characteristics into species groups, and evaluate outcome status and fishery impact for the species group.
Stakeholder Any person, group or organisation that has an interest in, or could be affected by, the assessment; this may include fishery managers, fishers, fishing industry organisations, recreational groups, public interest and community groups, indigenous communities, research communities, and government agencies
Stock assessment
An integrated analysis of information to estimate the status and trends of a population against benchmarks such as reference points.
TAB Directive An interpretation or direction from the Technical Advisory Board in relation to the Principles and Criteria and related assessment methodological documents. May be mandatory or advisory in nature
TAC Total allowable catch or catch limit allowed to be taken from a resource within a specified period
Team Member A person qualified to perform assessment activities against the MSC Principles and Criteria
Testing The involvement of some sort of structured logical argument and analysis that supports the choice of strategy. Testing can include the use of experience from analogous fisheries, empirical testing (for example practical experience of performance or evidence of past performance) and simulation testing (for instance using computer-intensive modelling such as management strategy evaluation)
The MSC Claim ―This product comes from a fishery which has been certified to the Marine Stewardship Council‟s environmental standard for a well-managed and sustainable fishery.‖
Tools Mechanisms for implementing strategies under Principles 1 or 2. For example, total allowable catches, mesh regulations, closed areas, etc could be used to implement harvest control rules
Uncertainty Lack of perfect knowledge of many factors that affect stock assessments, estimation of biological reference points and management, and the consequence of this lack of perfect knowledge
Unit Of Certification
The fishery or fish stock (=biologically distinct population unit) combined with the fishing method/gear and practice (=vessel/s) pursuing the fish of that stock. See TAB Directive D-003.
Document: Marine Stewardship Council Fisheries Assessment Methodology page 81 Date of issue: 1 May 2010 File: Fisheries_Assessment_Methodology_v2.1.pdf © Marine Stewardship Council, 2010
Section 10: Implementation Arrangements
10.1 Certification bodies shall follow TAB Directive D-017 v2 which sets out implementation and transition arrangements for this FAM v2 including the RBF.
10.2 Where conflicts arise between the procedures set out in this Assessment Methodology and the Fisheries Certification Methodology Version 6, TAB Directive D-017 v2 shall have precedence.
Guidance for use
10.3 Although considerable testing of this methodology has already been undertaken there will almost certainly be issues that arise on implementation which may only be addressed by providing additional guidance or adjusting the PISGs. Such adjustments shall only be allowed after full discussion with and approval of the MSC Executive‘s Senior Fisheries Assessment Manager or delegate.
10.4 Certification bodies shall start with the new Assessment Tree as a default position for all fishery assessments, except those covered by the specific circumstances set out in TAB Directive D-017 v2. Any potential adjustments to the default tree shall be proposed to the MSC on a case-by-case basis. The MSC shall only allow adjustments to the new default Assessment Tree rather than full old-style variants. Such adjustments shall be convincingly justified by the specific characteristics of a fishery, and agreed in advance by the MSC.
10.5 Any recommendations to change the default Assessment Tree shall be made through the normal process the TAB/MSC Board of Trustees takes to approve changes to the MSC‘s certification and assessment methodologies.

Document: Marine Stewardship Council Fisheries Assessment Methodology page 82 Date of issue: 1 May 2010 File: Fisheries_Assessment_Methodology_v2.1.pdf © Marine Stewardship Council, 2010
Appendix I: Risk-Based Methodologies
Section A1: Introduction to the Risk-Based Framework
A1.1 The risk-based framework (RBF) described herein is designed for use in association with the Default Assessment Tree for Principles 1 and 2 presented in Sections 6.4 and 7.8 of this document. The RBF was adopted by MSC to enable scoring of fisheries in data-deficient situations, particularly for the ―outcome‖ performance indicators (PIs) associated with Principles 1 and 2. If it is determined by the assessment team using Figure 3 that there is insufficient data to score a given outcome PI using the default scoring guideposts, the risk-based framework can be used as an alternative means of assessment.
A1.2 The RBF includes a set of methods, described in detail in this Appendix, for assessing the risk to each of these ecological components from activities associated with the fishery in assessment. The methods range in complexity and data requirements from a system based on expert judgment (Scale Intensity Consequence Analysis- SICA), to a semi-quantitative analysis to assess potential risk (Productivity Susceptibility Analysis - PSA).
A1.3 Each of the methods provides a risk-based estimate of the impact of the fishery on the ecological component addressed within the outcome Performance Indicator (or on individual elements of a given component, such as individual species). These risk estimates are in turn related to the specific scoring guideposts (SGs) used to assess the performance of the fishery against the PI for a particular component.
A1.4 MSC is aware of the existence of other risk-based analysis tools, as well as the fact that the development of these tools is a continuous process. Future versions of the MSC RBF will reflect the continuing evolution and refinement of these tools and methods.
A1.5 This document is accompanied by an Excel workbook for use in performing calculations for the PSA analysis entitled ―PSA for MSC.xls.‖ This workbook is referred to periodically throughout this document and is downloadable from the MSC website. Explicit instructions on how to use the workbook are contained in the workbook itself on the README tab.
A1.6 The risk-based assessment methodologies outlined within this document are for application by Certification Bodies and their representatives when undertaking an MSC assessment. In order to be eligible to undertake an assessment using this methodology, the lead auditor or at least one team member on the assessment team for the given fishery must be trained in its use.
Section A2: Overview of the Risk-Based Framework
A2.1 More detailed guidance on how and when to use the RBF is contained in subsequent sections of this document; this section is intended as an overview for orientation purposes.
A2.2 When an outcome Performance Indicator (PI) is encountered for which there are insufficient data to score the fishery using the standard scoring guideposts, the RBF may be used—first conducting a ―Level 1‖ qualitative analysis (SICA), then, if necessary and applicable to that Performance Indicator, using a ―Level 2‖ semi-quantitative analysis (PSA).

Document: Marine Stewardship Council Fisheries Assessment Methodology page 83 Date of issue: 1 May 2010 File: Fisheries_Assessment_Methodology_v2.1.pdf © Marine Stewardship Council, 2010
Figure A1. Schematic overview of how the RBF is triggered and carried out within the scoring phase of the fishery assessment. If there are insufficient data available to use the conventional scoring guideposts in the FAM default assessment tree to score the fishery against the requisite outcome Performance Indicator (PI), first a qualitative (SICA), then, if necessary and available for the given PI, a semi-quantitative (PSA) analysis is carried out to arrive at the final score for the PI. If the RBF is not used, the PI will be scored according to the standard FAM. A2.3 There is currently no Level 2 (PSA) analysis available for use with the Habitats and
Ecosystem PIs, 2.4.1 and 2.5.12. In the event that the RBF is needed for these, only a
Level 1 analysis (SICA) will be undertaken, and the PI will be scored based on the SICA, even if it results in a score below 80. Detailed guidance on scoring PIs using the RBF is contained in the respective scoring sections of the main FAM document.
New outcome indicator
Sufficient data for standard
FAM?
P2 ETP species?
Follow standard FAM
YES
YES
UNDERTAKE SICA
SICA score > 80?
UNDERTAKE PSA
PSA score > 60?
Assign converted SICA score
Assign converted PSA score
FAIL fishery
YES
YES
NO
NO
NO
NO
P2 Habitat or ecosystems ?
Assign converted SICA score
YES
NO
Document SICA (always) and PSA (if
undertaken)

Document: Marine Stewardship Council Fisheries Assessment Methodology page 84 Date of issue: 1 May 2010 File: Fisheries_Assessment_Methodology_v2.1.pdf © Marine Stewardship Council, 2010
Step-by-step process
Step 1: Scoping
A2.4 The scoping stage involves compiling preliminary background information needed to score the fishery. This includes information on principle activities in the fishery and a comprehensive list of species, habitats types and communities impacted by the fishery. Hazard Identification tables (Section B6) may be used during this step to define the ―risk landscape‖ associated with the fishery through identifying potential risk-causing activities. This is a useful step for any fishery under assessment, regardless of the use of the RBF. Scoping as it specifically relates to scoring using the RBF is further elaborated in Section A3.1.
Step 2: Conduct SICA for each data-deficient PI.
Stakeholder meetings
A2.5 A SICA is based on the structured collection of qualitative information pertaining to the PI in question from a diverse group of stakeholders. To achieve a good result, it is necessary to plan the stakeholder consultation strategy leading to the SICA in such a way as to ensure effective participation from a range of stakeholders. The robustness of the SICA relies heavily on the inputs of a suitably broad stakeholder group with a good balance of knowledge about the fishery and the ecological components on which it impacts.
Scoring
A2.6 For each data-deficient outcome PI, a SICA scoring template shall be completed, scoring the ―worst plausible case‖ combination of fishing activity and sub-component and using the accompanying consequence table provided for scoring guidance. Within the SICA scoring table, scores are assigned for scale, intensity and consequence of risk causing activity.
Step 3: For “Species” PIs scoring “moderate” or greater risk with the SICA, conduct PSA
A2.7 For each data-deficient outcome PI for species (i.e. target, retained or bycatch) having scored moderate or higher risk in the SICA analysis (i.e. less than an 80 MSC score), a Productivity-Susceptibility Analysis or PSA must be undertaken. PSA is not available for habitat and ecosystem outcome indicators. The PSA requires basic information about the productivity and susceptibility of each species in the given PI, and uses this information to individually score a set of attributes using pre-established PSA tables. Any attribute for which there are insufficient data is automatically assigned the highest risk score: at least some level of information is thus needed to demonstrate low risk in the fishery.
A2.8 Each scoring element in a PI shall have its own PSA score (e.g. for PI 2.2.1, if there are five bycatch species, there should be five PSA scores for that PI).
Step 4: Continue assessment steps according to the FAM v2 and FCM v6.
A2.9 Once all individual PIs are scored, the assessment continues in the same way as a non data-deficient fishery assessment, and the remaining steps of the FCM are carried out as normal.
Section A3: Applying the Risk-Based Methods
This section contains detailed instruction on the steps for applying the risk-based methods for the specific Performance Indicators which have been identified as data-deficient. The three major activities described are gathering information relevant to the risk-based assessment (scoping), carrying out a SICA, and carrying out a PSA.

Document: Marine Stewardship Council Fisheries Assessment Methodology page 85 Date of issue: 1 May 2010 File: Fisheries_Assessment_Methodology_v2.1.pdf © Marine Stewardship Council, 2010
Section A3.1: Scoping
A3.1.1 A comprehensive fishery assessment shall consider a wide range of potential activities that may result in ecological harm from fishing. These activities can occur in several categories, including, but not limited to direct impacts from capture of a species. The SICA scoring templates provided in Section B1 have pre-selected the most likely fishing activities to result in impacts as related to the MSC standard and assessment process. However, any additional identified impacts should be listed and used in scoring as appropriate. The ―Hazard Identification Table‖ in Section B6 shall be used to define this ―risk landscape.‖
A3.1.2 Similarly, the set of scoring elements that have been considered in each Performance Indicator should also be comprehensive, and documented. The activities and components that have been discussed or evaluated in the assessment shall be reported as part of the assessment report, regardless of the final risk-based outcome.
A3.1.3 The scoping stage provides the background information needed to apply the MSC RBF. Key elements needed for scoring risk include:
a) The type of fishery (target species, gear used, jurisdictional area),
b) A list of the principle activities that occur in the process of fishing (this can be guided by what is included in the Section B1 scoring templates, and further identified risk-causing activities from the Section B6 hazard identification table),
c) Management arrangements in place (e.g. quotas, limited entry, gear restrictions, spatial closures, depth limits etc) together with any more specific strategies such as bycatch reduction or species recovery strategies
d) A comprehensive list of species, habitat types and ecosystems (components) impacted by the fishery.
e) Where available, maps of the distribution of fishing effort within the jurisdictional boundaries of the fishery; and maps showing the distribution of all fishing effort on the target stock outside the fishery being certified.
f) Where available, maps of species, habitat and community distributions (including depth ranges)
A3.1.4 It is also useful to have descriptions of any monitoring strategies in place, including at sea observer programs (coverage, duration, objectives)
A3.1.5 More specific guidance on populating the lists of species, habitat types or ecosystems potentially impacted by the fishery can be found in Section B5.
A3.1.6 Note: this is meant as guide to provide the major information categories that will be most useful in conducting an RBF assessment on a Performance Indicator. However, in every case all data which are available shall always be used in assessing a fishery.
Section A3.2: Scale Intensity Consequence Analysis (SICA)
A3.2.1 The SICA is a qualitative analysis which aims to identify which activities lead to a significant impact on any species, habitat or ecosystem. The SICA operates as a screening tool; a ―worst case‖ approach that is used to measure the impacts of a range of activities on particular scoring elements. For Principle 1 PIs, there is typically only one scoring element being considered (target species of the fishery), but under Principle 2, the full range of retained and bycatch species, habitats, or ecosystems (as defined in earlier sections of this document) could be assessed. Where judgments about risk are uncertain, the highest consequence score that is still regarded as plausible is chosen.
Stakeholder involvement in SICA
A3.2.2 Stakeholder consultation and input is critical in a risk assessment, particularly at the qualitative (SICA) level of an assessment. Stakeholders provide expert judgment, local knowledge, hands-on experience, fishery-specific and ecological knowledge and raise
Document: Marine Stewardship Council Fisheries Assessment Methodology page 86 Date of issue: 1 May 2010 File: Fisheries_Assessment_Methodology_v2.1.pdf © Marine Stewardship Council, 2010
issues that may not be covered in material otherwise provided to the assessment team. CBs shall use input from stakeholders to assist in the identification of the activities that occur in the fishery, the spatial and temporal scale of those activities, and offer information suitable for the qualitative evaluation of the risks that the activities pose to the species or habitats included in the risk assessment. The stakeholder consultation process within the SICA should be regarded as a data gathering tool, and stakeholder meetings should thus be used as opportunities to seek expert opinions, rather than to build consensus. The ultimate responsibility for scoring the Performance Indicators remains with the Certification Body‘s assessment team.
A3.2.3 When applying the RBF, Certification Bodies should use the MSC document Guidance for Certification Bodies on Stakeholder Consultation – Version 1, December 2004,
A3.2.4 To perform an adequate stakeholder consultation process, the CB shall plan the stakeholder consultation strategy leading to the SICA in such a way as to ensure effective participation from a range of stakeholders. The robustness of the SICA relies heavily on the inputs of a suitably broad stakeholder group with a good balance of knowledge about the fishery. This should include; fishers, scientists, conservationists, indigenous representatives, managers, local residents, fish processors, as relevant to achieve the objectives of the SICA scoring process..
A3.2.5 At a minimum, the CB shall ensure that:
a) Stakeholder consultation process is conducted in a language that can be understood by all stakeholders.; where different language groups or educational/vocabulary levels are present CBs should consider separate consultations tailored to those specific interest groups.
b) Any materials required for the stakeholder consultation is prepared in language understood by all participants
c) Pre-analysis is performed so that the stakeholders consultation process is focused on providing information required for the SICA scoring process, while allowing them sufficient room to express their expert opinions.
A3.2.6 The stakeholder consultation process shall be clearly documented in assessment reports and shall provide justification for the decisions taken in completing the RBF assessment.
Guidance for conducting a SICA
A3.2.7 SICA scores are obtained for PI‘s by working with the relevant group of stakeholders to score the scale (temporal and spatial) and intensity of the relevant risk-causing activity, as well as the consequence for the particular species, habitat, or ecosystem being scored.
A3.2.8 A set of SICA scoring templates and consequence tables provides a means to evaluate each PI where the conventional scoring approach can not be used. These templates and tables are provided in Sections B1, B2, and B3.
A3.2.9 Instructions for completing the seven MSC SICA steps are detailed below. Tables used for determining the spatial scale score, temporal scale score, and intensity score are provided in Section B2, while consequence scoring tables are provided in Section B3.
a) SICA Step 1: Determine ―worst plausible case‖ combination of fishing activity and sub-component.
b) SICA Step 2: Determine the ―most vulnerable‖ scoring element for this combination, and prepare a SICA scoring template for this species, habitat, or ecosystem.
c) SICA Step 3: Score spatial scale of the fishing activity identified in step 2 for the Performance Indicator.
d) SICA Step 4: Score temporal scale of the fishing activity identified in step 2 for the Performance Indicator.
e) SICA Step 5: Score the intensity of the fishing activity identified in step 2 for the Performance Indicator.

Document: Marine Stewardship Council Fisheries Assessment Methodology page 87 Date of issue: 1 May 2010 File: Fisheries_Assessment_Methodology_v2.1.pdf © Marine Stewardship Council, 2010
f) SICA Step 6: Score the consequence resulting from the scale and intensity of the activity for the subcomponent identified in the ―worst plausible case‖ case in Step 2. (e.g. population size of target species) using the consequence tables in Section B3.
g) SICA Step 7: Convert the consequence score into an MSC score, and feed back into the assessment tree, or go to PSA.
SICA Step 1: Determine “worst plausible case” combination of fishing activity and subcomponent.
A3.2.10 Once the most vulnerable scoring element for the given PI has been determined, it is necessary to look at the possible impact-causing fishing activities and ―subcomponents‖ of the chosen scoring element, and determine the ―worst plausible case‖ combination of the two.
A3.2.11 The potential risk-causing activities relating to each PI shall be documented and specified; typically fishing, gear loss, and bait collection (where relevant) would be considered, and are already listed as defaults in the SICA scoring templates (Section B1). However, if more risk-causing activities are identified, they should be documented in the table and considered as well. In addition, the range of potentially impacted subcomponents for each PI (e.g. population size, geographic range) specified in the SICA scoring templates (Section B1) and scored using the SICA consequence tables (Section B2) should be considered.
A3.2.12 As with step 1, the determination of which combination of activity and subcomponent represent the ―worst plausible case‖ scenario is made qualitatively with the group of stakeholders present at the SICA meeting. Often, different subcomponents are proxies for measuring the same effect (e.g. population size or age/size/sex structure could be indirect measures for reproductive capacity), but are much easier to observe and thus score on a qualitative basis. This should be taken into account when choosing which subcomponent to score. If there is doubt about the worst plausible case scenario, more than one combination of activity and sub component may be scored in order to ultimately determine which represents the greatest risk. In the cases where this is necessary, the highest risk score is then used in the subsequent scoring steps.
SICA step 2: Determine the “most vulnerable” scoring element, and prepare a SICA scoring template for this species, habitat, or ecosystem.
A3.2.13 For PI 1.1.1 there is typically only one scoring element—the target stock. At present, even for multi-species fisheries, each target stock seeking MSC certification will need its own assessment under Principle 1. However for PIs in Principle 2, such as retained species, bycatch species, or habitats, it is likely that there will be more than one scoring element identified during the scoping stage (e.g. 10 bycatch species). In these cases, for the SICA, it is necessary to identify which scoring element is ―most vulnerable‖ to fishing activities. This determination is made qualitatively with the group of stakeholders present at the SICA consultation meeting based on knowledge about inherent species vulnerability, as well as frequency of interaction with the fishery, and level of damage done (i.e. released alive vs. always killed). If there are several scoring elements that appear to have a similar level of vulnerability and the group cannot agree on which one is most vulnerable for a given PI, it is possible to conduct a SICA on all of them. The process of choosing the most vulnerable scoring element must be well documented and the choice justified in the assessment documentation.
SICA step 3: Score spatial scale of activity potentially causing an impact to the subcomponents.
A3.2.14 Default, blank, SICA scoring templates are provided in Section B1 for conducting a SICA on species, habitats, and ecosystems, with a specific set of activities and sub-components pre-entered for consideration. Templates like this should be prepared for the most vulnerable species, habitat, or ecosystem identified for a given PI.
A3.2.15 The greatest spatial extent must be used for determining the spatial scale score for the activities relevant to the scoring elements within the PI under consideration (Table
Document: Marine Stewardship Council Fisheries Assessment Methodology page 88 Date of issue: 1 May 2010 File: Fisheries_Assessment_Methodology_v2.1.pdf © Marine Stewardship Council, 2010
B2.1). For example, if the relevant activity was fishing (e.g. capture by longline) and it takes place within 20% of the overall range of the stock, then the spatial scale is scored as 3. The score is then recorded onto the SICA scoring template for the component in question and the rationale documented NOTE: The spatial scale score is not used mathematically, for example in a calculation to determine the consequence score. It is used in the process of making judgments about level of intensity at SICA Step 5. Obviously, two different activities that scored the same for spatial scale might have quite different outcomes for the intensity score.
SICA Step 4: Score temporal scale of activity/activities potentially causing an impact to the subcomponents.
A3.2.16 The highest temporal frequency must be used for determining the temporal scale score for the relevant Performance Indicator activities (Table B2.2). If the fishing activity occurs daily, the temporal scale is scored as 6. If gear loss occurs about once per year, then the temporal scale is scored as 3. The score is then recorded onto the relevant SICA template in Section B1, and the rationale documented.
A3.2.17 It may be more logical for some activities to consider the aggregate number of days that an activity occurs. For example, if the activity ―fishing‖ was undertaken by 10 boats during the same 150 days of the year, the score is 4. If the same 10 boats each spend 30 non-overlapping days fishing, the temporal scale of the activity is a sum of 300 days, indicating that a score of 6 is appropriate. In the case where the activity occurs over many days, but only every 10 years, the number of days divided by the number of years in the cycle is used to determine the score. For example, 100 days of an activity every 10 years averages to 10 days every year, so that a score of 3 is appropriate. NOTE: The temporal scale score is not used mathematically, for example in a calculation to determine the consequence score. It is used in the process of making judgments about level of intensity at SICA Step 5. Obviously, two different activities that scored the same for temporal scale might have quite different outcomes for the intensity score.
SICA Step 5. Score the intensity of the relevant activity
A3.2.18 The score for intensity of an activity (Table B2.3) considers the direct impacts to the subcomponent under evaluation. The intensity of the activity is judged based on the spatial and temporal scale of the activity, its nature and extent. Activities are scored as per intensity scores in Section B2, recorded on the relevant SICA template prepared in SICA step 1, and the rationale documented.
SICA Step 6. Score the consequence of the relevant activity on the selected subcomponent
A3.2.19 The consequence of the activity is scored using the SICA consequence tables shown in Section B3, and added to the corresponding SICA scoring template from Section B1 in the ―consequence score‖ column. The score should be based on information provided by all stakeholders and the expert judgment of the risk assessment team, and draw qualitatively from the scale and intensity scores provided by the group. The rationale for assigning each consequence score must be documented. In the absence of agreement or information, the highest score (worst case scenario) considered plausible is applied to the activity/activities as they impact the subcomponent under evaluation.
SICA Step 7. Convert the consequence score into an MSC score, and feed back into the assessment tree, or go to PSA.
A3.2.20 Upon conclusion of the SICA analysis for the relevant outcome indicator, and the completion of the SICA scoring tables, if the SICA consequence score for the most vulnerable scoring element in a target, retained or bycatch species PI (i.e. 1.1.1, 2.1.1, or 2.2.1) is 1 or 2, or the PI under consideration is habitat outcome performance indicator (2.4.1) or ecosystem outcome performance indicator (2.5.1), for which no PSA is available, it must be converted into an MSC score equivalent, using the guidance in

Document: Marine Stewardship Council Fisheries Assessment Methodology page 89 Date of issue: 1 May 2010 File: Fisheries_Assessment_Methodology_v2.1.pdf © Marine Stewardship Council, 2010
Paragraphs 4.3.1 and 4.3.2. If the resulting consequence score is 3 or higher for a target, retained or bycatch species outcome PI, the SICA score is recorded but not used further in the assessment and the PI is further evaluated using a PSA.
SICA habitat-specific issues
A3.2.21 The SICA for habitats involves only those habitat types known to occur within the area of effort for the fishery. In assessing risk to the habitat component, all habitat types encountered by the fishing gear during fishing activities should be analyzed and scored according to the given SICA scoring templates and consequence tables for habitat (Tables B1.4 and B3.2). It is important to note that even at a relatively low level of intensity some habitats may demonstrate a high consequence score for some gears, such as seamount habitats trawled at mid-slope depths. Even at low intensity, vulnerable seamount habitats supporting slow-growing, long-lived and complex faunal communities may be substantially impacted by one encounter, which may require recovery times of decades.
Section A3.3: Productivity-Susceptibility Analysis (PSA)
A3.3.1 The PSA is potentially used when the RBF is triggered for PIs 1.1.1, 2.1.1, and 2.2.1 within the default assessment tree, i.e. for target species, retained species, and bycatch species. Attribute and scoring tables for the PSA can be found in Section B4. At present, there is no PSA available for PIs 2.4.1 (habitats) and 2.5.1 (ecosystem). Each species identified within a given PI (e.g. each bycatch species) must be analyzed using the PSA.
A3.3.2 The PSA approach examines attributes of each species that contribute to or reflect its productivity or susceptibility, in order to provide a relative measure of the risk to the scoring element from fishing activities. Productivity is the average of seven attributes, while susceptibility is the product of four aspects (Table B4.1).
Guidance for conducting a PSA
A3.3.3 There are three steps for the MSC PSA.
a) PSA Step 1 Score productivity attributes
b) PSA Step 2 Score susceptibility attributes
c) PSA Step 3 Calculate risk scores and plot individual species onto a PSA plot.
d) PSA Step 4 Convert PSA scores into MSC scores and feed back into default assessment tree
A3.3.4 An Excel workbook entitled PSA for MSC.xls accompanies this document which automatically generates PSA scores and the PSA plot when attribute scores are completed for each species.
PSA Step 1: Score species for productivity
A3.3.5 The level of fishing impact a species can sustain depends on the inherent productivity of the species. The productivity determines how rapidly a species can recover from depletion or impact due to fishing. The productivity of a species is determined by species attributes such as longevity, growth rate, fecundity, recruitment and natural mortality.
A3.3.6 Each productivity attribute is scored on a three-point risk scale: low (3), medium (2) or high (1), according to the cut-offs
9 in Table B4.2 in Section B4. The average of these
risk scores provides the overall productivity risk score, however the calculation is done automatically when entering attribute risk scores into the accompanying Excel workbook, PSA for MSC.xls.
Document: Marine Stewardship Council Fisheries Assessment Methodology page 90 Date of issue: 1 May 2010 File: Fisheries_Assessment_Methodology_v2.1.pdf © Marine Stewardship Council, 2010
PSA Step 2: Score species for susceptibility
A3.3.7 Susceptibility is estimated as the product of four independent aspects; Availability, Encounterability, Selectivity and Post-capture Mortality (PCM).
A3.3.8 The level of fishing impact that a scoring species can sustain depends on its vulnerability or susceptibility to capture or damage by the fishery activities. The susceptibility of a species is determined by attributes such as the degree of overlap between the distribution of the fishery and the distribution of the species; and whether the species occurs at the same depth in the water column as the fishing gear.
A3.3.9 Each of four susceptibility attributes is scored on a three-point risk scale: high (3), medium (2) or low (1), according to the cut-offs in Table B4.3. These risk scores are multiplied (possible range 1-81) and rescaled to the range (1-3) to generate the overall susceptibility risk score. The calculations are done automatically when attribute risk scores are entered into the accompanying Excel workbook.
Susceptibility Aspect 1: Availability
A3.3.10 Availability considers overlap of the fishing effort with a species distribution. Where a fishery overlaps a large proportion of a species‘ range the risk is high because the species has no refuge, and the potential for impact is high.
A3.3.11 For species with good distribution maps, availability is scored using detailed mapping analysis: the amount of overlap between fishing effort and species distribution. Otherwise, stakeholder generated maps may be used.
A3.3.12 Availability is scored using the cut-offs provided in Table B4.3
Susceptibility Aspect 2: Encounterability
A3.3.13 Encounterability considers the likelihood that a species will encounter fishing gear that is deployed within the geographic range of that species. The main aspect of encounterability considered for each species is the deployment of fishing gear in relation to its adult habitat. Table B4.3 should be used to arrive at an encounterability score.
Susceptibility Aspect 3: Selectivity
A3.3.14 For species that do encounter fishing gear, selectivity considers the potential of gear to capture or retain the species.
A3.3.15 Selectivity of nets is affected by a number of factors including length, overall shape, fin spines, swimming speed relative to tow speed of the gear etc. Among these attributes, only length is available for most of the species likely to be assessed. Where available, size at maturity is used rather than maximum size. Size at maturity is more typical of the individuals in a population whereas very few individuals reach maximum size for the species.
A3.3.16 Selectivity of hooks is defined by typical weights of the species caught relative to the breaking strain of the snood, the gaffing method used in the fishery, and by diet of potential species.
A3.3.17 For most groups, when the size at maturity is double the mesh size the risk of being selected is high. The upper size cut-off is used to eliminate large species. For example, basking sharks up to 5m long have been captured in trawl nets and gill nets but the risk of capturing such large animals is low.
A3.3.18 For hook fisheries, body weight cut-offs are determined from observer data. These weight cut-offs are converted to size cut-offs using length weight relationships where available.
Susceptibility Aspect 4: Post-Capture Mortality (PCM)

Document: Marine Stewardship Council Fisheries Assessment Methodology page 91 Date of issue: 1 May 2010 File: Fisheries_Assessment_Methodology_v2.1.pdf © Marine Stewardship Council, 2010
A3.3.19 Post-capture mortality (PCM) evaluates the case that, if captured, a species would be released in condition that would permit subsequent survival. The PCM of a species is affected by its biology and fishing practices. Biological factors limit the potential of a species to be captured alive. These biological factors can be assessed using expert judgement. For example, sharks with spiracles, such as Port Jackson sharks can breathe without swimming and can survive on deck for many hours if captured alive. The impact of fishing practices on PCM is more difficult to evaluate and independent field observations are needed. Handling practices vary between fisheries. The most important considerations are the time taken to clear discards from the deck. In the absence of expert judgement and independent field observations the default value for the PCM of all species is high.
A3.3.20 All species considered dead on capture = high PCM risk, unless there are observer data or other verified field observations made during commercial fishing operations that indicate the individuals are released alive and survivorship can be demonstrated.
Interrelationship between Selectivity and PCM
A3.3.21 The PSA scoring cannot generally distinguish between selectivity across a species size range, and selectivity for a particular species. Lots of discarding of live animals suggests the gear is not very selective for the desired size—a case which would attract a high risk score for the selectivity attribute (a wide size range is captured - high risk of being captured). If a large portion are then returned alive and survive the encounter, the post-capture mortality risk score could be reduced from the default score of high. If only the desired fish are captured, then there would be less discarding, This second situation would attract a lower risk score for selectivity, and a higher one for post-capture mortality.
Adjustments for Susceptibility Scores in a PSA
A3.3.22 The PSA involves scoring a consistent set of attributes for productivity and susceptibility. Adjustments are typically used when the attributes have been scored ―high‖, but experts have additional information regarding the attribute, that would adjust, or change the score. In the case when attributes are scored ―low‖, there is little point in using adjustments. Adjustments can be used when scoring any of the four susceptibility attributes, as outlined below. Where possible, observer data should be verified in face-to-face observer meetings to ensure that the observer is qualified to identify the species concerned. Other sources of data may be appropriate in other fisheries or regions. As in other areas of the RBF, documentation for the rationale is critical to maintaining transparency of decisions and repeatability of process, and is documented in the scoring process. Examples are provided below to assist consideration of whether an adjustment to a risk score is warranted.
Availability
A3.3.23 The information to score availability in the fishery region is quite coarse. Observer input may be used to adjust availability scores for some species. If qualified observers report very low numbers of a species, say only one seen during 10 years experience on the fishing vessels, then availability may be changed to low. If the observer reports seeing the species between 33% and 66% of days spent on the fishing grounds then availability is rescored as medium. If the species is seen on more than 66% of days, then the availability score cannot be reduced from ―high‖. Unless there are independent field observations (non-fishers) during commercial operations it is not appropriate to over-ride availability scores.
Encounterability
A3.3.24 Encounterability is scored by estimating the overlap with the deployed fishing gear. The dominant habitat, and hence area occupied for reptiles and mammals is the very upper ocean (epipelagic zone). These air breathing species are vulnerable to drowning before the gear is recovered to the fishing vessel. As a result, the default encounterability score

Document: Marine Stewardship Council Fisheries Assessment Methodology page 92 Date of issue: 1 May 2010 File: Fisheries_Assessment_Methodology_v2.1.pdf © Marine Stewardship Council, 2010
for these air-breathing groups is ―high‖. In fisheries that have observer programs, encounterability scores may be reduced from a ―high‖ score. For example, if an observer sees sharks every day he/she observes fishing but the sharks never approach the gear or take fish off the hooks, then encounterability is rescored as ―low‖. For fisheries without independent field observations during commercial fishing (e.g. observer programs), it is not appropriate to over-ride encounterability scores.
Selectivity
A3.3.25 Selectivity, an estimate of retention by the fishing gear, is scored based on the length of the particular species, as these data are readily available. Not all species of similar length have the same shape, and shape may influence retention, and thus change the way that selectivity might be scored. On face value one might assume that long thin species, such as squid and sea snakes could escape nets more easily than box-fishes of similar length. However, in the early 1990‘s Australian trawlers caught over 80,000 sea snakes. Similarly arrow squid are taken in high numbers in Australian trawl fisheries (> 1,900 tonnes 2001–2004). This suggests that for moving trawl nets at least, selectivity over-rides are not appropriate. By contrast a sea-snake would be likely to escape a stationary gill net more easily than a fish of the same length. If supporting data could be obtained an adjustment for the length-based selectivity score may be appropriate. Without supporting data, adjustments should not be used, in line with use of the precautionary principle in the RBF.
A3.3.26 In addition, a range of species such as large billfishes can be retained (selected) if they encounter fishing gear. The selectivity score for these species based on their size, is often ―high‖. However, other biological attributes and fishery restrictions may modify these scores. Scores should only be overridden based on supporting data from independent observer programs or observer notes on wildlife interactions. For example, in some Australian fisheries using hooks, observer records show seahorses and plankton feeders are not captured. Selectivity scores in hook fisheries for these species may be overridden to ―low‖. Selectivity experiments suggest that selectivity of hooks for most invertebrates is low. Molluscs such as bailer shells, scallops etc. have low selectivity in hook fisheries.
A3.3.27 In the tables provided below, Table B4.4 presents a selectivity scoring system for hooks. Assessment teams will need to prepare appropriate selectivity tables for other gears, justifying the factors used and cut-offs selected in their report.
Post-capture mortality
A3.3.28 For all retained species, post-capture mortality is high. Post-capture mortality is scored as ―high‖, unless there is information that indicates that animals are released alive. Observers can also provide independent verification of life status of released individuals. Where observers can verify that fishers regularly release >66% (>33%) of individuals of a given species alive during normal fishing operations, and there is evidence of survivorship then the scores is changed to low (med). For some fisheries, additional data on post-capture mortality may also be available from field experiments.
PSA Step 3. Calculate risk scores and plot species onto a PSA plot
A3.3.29 The overall productivity and susceptibility risk scores for each species are used to place the respective scoring element on 2D plots (e.g. Figure A2). This occurs automatically in the PSA for MSC.xls workbook. The relative position of the component on the plot will determine relative risk. The overall risk value for a component is the Euclidean distance
10 from the origin of the graph (0,0).
A3.3.30 The divisions between risk categories and hence scoring guideposts are based on dividing the area of the PSA plots into equal thirds. If all productivity and susceptibility scores (scale 1-3) are assumed to be equally likely, then 1/3
rd of the Euclidean overall
risk values will be greater than 3.18 (high risk), 1/3rd
will be between 3.18 and 2.64 (medium risk), and 1/3
rd will be lower than 2.64 (low risk).

Document: Marine Stewardship Council Fisheries Assessment Methodology page 93 Date of issue: 1 May 2010 File: Fisheries_Assessment_Methodology_v2.1.pdf © Marine Stewardship Council, 2010
PSA-Target Species
1.0
1.5
2.0
2.5
3.0
1.0 1.5 2.0 2.5 3.0
(<-High Productivity (Low->)
(<-
Lo
w)
Su
scep
tib
ilit
y (
Hig
h -
>)
Figure A2. Examples of diagnostic charts for displaying PSA values for each species. Left: Low risk species have high productivity and low susceptibility, while high risk species have low productivity and high susceptibility. The curved lines divide the potential risk scores into thirds on the basis of the Euclidean distance from the origin (0,0). Right. Example PSA plot for a set of target species. Note the curved lines that divide the risk space into equal thirds, as described in the text
PSA Step 4: Convert PSA scores into MSC scores and feed back into default assessment tree
A3.3.31 Using the Excel worksheet PSA for MSC.xls, or the formula provided in Paragraph 4.4.2, convert the PSA scores resulting from this analysis into MSC scores. Follow guidance in Section 4.4 as well for scoring a PI using PSA results for multiple species.
Section A3.4 RBF reference table by Performance Indicator
3.4.1 The following table is a PI by PI overview of which guidance within this document to apply when using the RBF, and where within this document to find scoring examples for the given PI.
Table A1. PI by PI overview of guidance for applying SICA and PSA.
Performance Indicator
Level 1 (SICA) Level 2 (PSA)
1.1.1 Stock status If the result of the SICA for the target stock is a consequence score of 1 or 2, the MSC score conversion from Table 4 shall apply here in the absence of additional information (see Paragraph 4.3.2). Regardless of the SICA result for this PI, a PSA shall also be undertaken. Example: Table B7.1 If either the SICA or PSA score is between 60 and 80, the conditions specified in Paragraphs 6.2.14. shall be applied to this PI.
The PSA score obtained for the Target stock must be converted into an MSC score equivalent according to the equation in Paragraph 4.4.2 (a). In the absence of additional information (see section 4.4), this MSC score equivalent shall apply to the PI. Note susceptibility attribute scores can be modified according to the guidance in Paragraphs A3.3.22-A3.3.28. If either the SICA or PSA score is between 60 and 80, the conditions specified in Paragraphs 6.2.14. shall be applied to this PI. Example: Table B7.4, first data row
1.1.2 Reference When the RBF is used for scoring PI 1.1.1, this PI shall be given a score of 80 in

Document: Marine Stewardship Council Fisheries Assessment Methodology page 94 Date of issue: 1 May 2010 File: Fisheries_Assessment_Methodology_v2.1.pdf © Marine Stewardship Council, 2010
points accordance with guidance in Paragraph 6.2.37.
1.1.3 Stock rebuilding
When RBF is used to score PI 1.1.1, and the score is less than 80, this PI is not scored. In place of scoring PI 1.1.3, conditions will be raised in association with 1.1.1. See guidance in Paragraph 6.2.14.
1.2.1 Harvest strategy RBF does not apply—use FAM PISGs
1.2.2 Harvest control tools and rules
RBF does not apply—use FAM PISGs
1.2.3 Info/monitoring RBF does not apply—use FAM PISGs
1.2.4 Assessment of stock status
When the RBF is used for scoring PI 1.1.1, this PI shall be given a score of 80 in accordance with guidance in Paragraph 6.3.22.
2.1.1 Retained species outcome
If the result of the SICA for the ―most vulnerable‖ retained species (see Section A3.2 step 1) is a consequence score of 1 or 2, the MSC score conversion from Table 4 shall apply here in the absence of additional information (see Paragraph 4.3.2). If the result of the SICA is a consequence score greater than 2 (3 or higher) it is discarded and a PSA must be conducted on all (or ―main‖—see Paragraph 4.4.6) identified scoring elements within the PI. Example: Table B7.2
The PSA scored obtained for all, or ―main‖ (see Paragraph 4.4.6), retained species must be converted into an MSC score equivalent according to the equation in Paragraph 4.4.2 (a).. Following the guidance in Paragraph 4.4.2 (c) step 2, an overall MSC score for the PI is determined based on the combination of MSC scores for the species evaluated within the PI. Note susceptibility attribute scores can be modified according to the guidance in Paragraphs A3.3.22-A3.3.28. Example: Table B7.4
2.1.2 Retained species mgmt strategy
RBF does not apply—use FAM PISGs
2.1.3 Retained species info/monitoring
When the RBF is used to score PI 2.1.1, the bracketed scoring issues within the FAM Scoring Guideposts for this PI need not be scored. Barring this exception, the FAM PISGs shall be used.
2.2.1 Bycatch species outcome
If the result of the SICA for the ―most vulnerable‖ bycatch species (see Section A3.2 step 1) is a consequence score of 1 or 2, the MSC score conversion from Table 4 shall apply here in the absence of additional information (see Paragraphs 4.3.2). If the result of the SICA is a consequence score greater than 2 (3 or higher) it is discarded and a PSA must be conducted on all (or ―main‖—see Paragraphs 4.4.6) identified scoring elements within the PI.
The PSA scored obtained for all, or ―main‖ (see Paragraph 4.4.6), bycatch species must be converted into an MSC score equivalent according to the equation in Paragraph 4.4.2 (a). Following the guidance in Paragraph 4.4.2 (c) step 2, an overall MSC score for the PI is determined based on the combination of MSC scores for the species evaluated within the PI. Note susceptibility attribute scores can be modified according to the guidance in Paragraphs A3.3.22-A3.3.28.
2.2.2 Bycatch species mgmt strategy
RBF does not apply—use FAM PISGs
2.2.3 Bycatch species info/monitoring
When the RBF is used to score PI 2.2.1, the bracketed scoring issues within the FAM Scoring Guideposts for this PI need not be scored. Barring this exception, the FAM PISGs shall be used.
2.3.1 ETP Species outcome
RBF not applicable to ETP species PIs1
2.3.2 ETP Species mgmt strategy
2.3.3 ETP Species info/monitoring
2.4.1 Habitats outcome
If the result of the SICA for the ―most vulnerable‖ habitat (see Section A3.2
No PSA is available for this PI2. If the
PI cannot be evaluated successfully

Document: Marine Stewardship Council Fisheries Assessment Methodology page 95 Date of issue: 1 May 2010 File: Fisheries_Assessment_Methodology_v2.1.pdf © Marine Stewardship Council, 2010
step 1) is a consequence score of 1 ,2, or 3, the MSC score conversion from Table 4 shall apply here in the absence of additional information (see Paragraph 4.3.2). If the resulting MSC score is between 60 and 80, a condition must be set for this PI. If the result of the SICA is a consequence score greater than 3 (4 or higher), the PI will ―fail‖ the assessment based on SICA. Subsequently, data may be gathered such that the scoring guideposts within the default assessment tree can be used. Example: Table B7.3
using the SICA, data may be gathered such that the scoring guideposts within the default assessment tree can be used.
2.4.2 Habitats mgmt strategy
RBF does not apply—use FAM PISGs
2.4.3 Habitats info/monitoring
RBF does not apply—use FAM PISGs
2.5.1 Ecosystem outcome
If the result of the SICA for the ―most vulnerable‖ ecosystem (see Section A3.2 step 1) is a consequence score of 1 ,2, or 3, the MSC score conversion from Table 4 shall apply here in the absence of additional information (Paragraphs 4.3.2). If the resulting MSC score is between 60 and 80, a condition must be set for this PI. If the result of the SICA is a consequence score greater than 3 (4 or higher), the PI will ―fail‖ the assessment based on SICA. Subsequently, data may be gathered such that the scoring guideposts within the default assessment tree can be used.
No PSA is available for this PI. If the PI cannot be evaluated successfully using the SICA, data must be gathered such that the scoring guideposts within the default assessment tree can be used.
2.5.2 Ecosystem mgmt strategy
RBF does not apply—use FAM PISGs
2.5.3 Ecosystem info/monitoring
RBF does not apply—use FAM PISGs
Principle 3 RBF not applicable to P33

Document: Marine Stewardship Council Fisheries Assessment Methodology page 96 Date of issue: 1 May 2010 File: Fisheries_Assessment_Methodology_v2.1.pdf © Marine Stewardship Council, 2010
Section B1: SICA scoring templates for MSC Principles 1 and 2
Table B1.1. Principle 1 SICA Scoring Template (Target Species). Only one subcomponent representing the worst plausible case is selected and scored. See example in Section B7.
Performance Indicator
Risk-causing activities
Spatial scale of activity
Temporal scale of activity
Intensity of activity
Relevant subcomponents
Consequence score
MSC Score
Target species outcome
Fishing activities from all fisheries including:
Direct capture
Unobserved mortality (e.g. gear loss)
Capture as bycatch in other fisheries
Other identified risk-causing activites (please specify)
Population size
Reproductive capacity
Age/size/sex structure
Geographic range
Rationale:
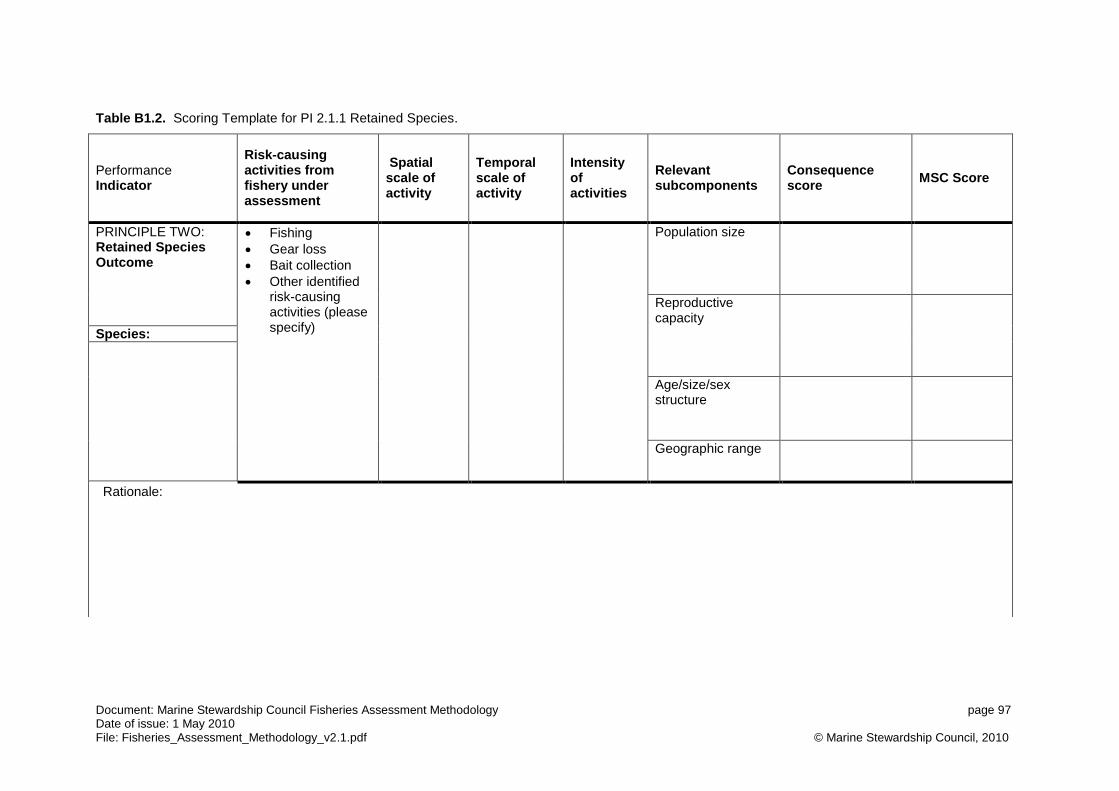
Document: Marine Stewardship Council Fisheries Assessment Methodology page 97 Date of issue: 1 May 2010 File: Fisheries_Assessment_Methodology_v2.1.pdf © Marine Stewardship Council, 2010
Table B1.2. Scoring Template for PI 2.1.1 Retained Species.
Performance Indicator
Risk-causing activities from fishery under assessment
Spatial scale of activity
Temporal scale of activity
Intensity of activities
Relevant subcomponents
Consequence score
MSC Score
PRINCIPLE TWO: Retained Species Outcome
Fishing
Gear loss
Bait collection
Other identified risk-causing activities (please specify)
Population size
Reproductive capacity
Species:
Age/size/sex structure
Geographic range
Rationale:

Document: Marine Stewardship Council Fisheries Assessment Methodology page 98 Date of issue: 1 May 2010 File: Fisheries_Assessment_Methodology_v2.1.pdf © Marine Stewardship Council, 2010
Table B1.3. Scoring Template for PI 2.2.1 Bycatch Species.
Performance Indicator
Risk-causing activities from fishery under assessment
Spatial scale of activity
Temporal scale of activity
Intensity of activities
Relevant subcomponents
Consequence score
MSC Score
PRINCIPLE TWO: Bycatch Species Outcome
Fishing
Gear loss
Bait collection
Other identified risk-causing activities (please specify)
Population size
Reproductive capacity
Species:
Age/size/sex structure
Geographic range
Rationale:

Document: Marine Stewardship Council Fisheries Assessment Methodology page 99 Date of issue: 1 May 2010 File: Fisheries_Assessment_Methodology_v2.1.pdf © Marine Stewardship Council, 2010
Table B1.4 Scoring Template for PI 2.4.1 Habitats.
Performance Indicator
Risk-causing activities from fishery under assessment
Spatial scale of activity
Temporal scale of activity
Intensity of activities
Relevant subcomponents
Consequence score
MSC Score
PRINCIPLE TWO: Habitats Outcome
Fishing
Gear loss
Bait collection
Anchoring/mooring
Other identified risk-causing activities (please specify)
Habitat typesHabitat types
Habitat:
Habitat structure and function
Rationale:

Document: Marine Stewardship Council Fisheries Assessment Methodology page 100 Date of issue: 1 May 2010 File: Fisheries_Assessment_Methodology_v2.1.pdf © Marine Stewardship Council, 2010
Table B1.5. Scoring Template for PI 2.5.1 Ecosystem.
Performance Indicator
Risk-causing activities from fishery under assessment
Spatial scale of activity
Temporal scale of activity
Intensity of activities
Relevant subcomponents
Consequence score
MSC Score
PRINCIPLE TWO: Ecosystem Outcome
Fishing
Gear loss
Bait collection
Other identified risk-causing activities (please specify)
Species composition
Functional group composition
Distribution of the community
Trophic size/structure

Document: Marine Stewardship Council Fisheries Assessment Methodology page 101 Date of issue: 1 May 2010 File: Fisheries_Assessment_Methodology_v2.1.pdf © Marine Stewardship Council, 2010
Section B2: SICA reference tables.
Table B2.1. SICA spatial scale score table. For Principle 1, the percentage pertains to the percentage of the total range of the stock that overlaps with all fishing activity affecting the stock. For Principle 2, only overlap of the stock, habitat, or ecosystem with the fishing activity of the Unit of Certification shall be considered
<1%:
1-15%:
16-30%: 31-45%: 46-60: >60%:
1 2 3 4 5 6
Table B2.2. SICA temporal scale score table.
Table B2.3. SICA intensity score table
Level Score Description
Negligible 1 remote likelihood of detection of activity at any spatial or temporal scale
Minor 2 activity occurs rarely or in few restricted locations and evidence of activity even at these scales is rare
Moderate 3 moderate detection of activity at broader spatial scale, or obvious but local detection
Major 4 detectable evidence of activity occurs reasonably often at broad spatial scale
Severe 5 easily detectable localized evidence of activity or widespread and frequent evidence of activity
Catastrophic 6 local to regional evidence of activity or continual and widespread evidence
Decadal (1 day every 10 years or
so)
Every several years (1 day every
several years)
Annual (1-100 days
per year)
Quarterly (100-200 days per
year)
Weekly (200-300 days per
year)
Daily (300-365 days per
year)
1 2 3 4 5 6

Document: Marine Stewardship Council Fisheries Assessment Methodology page 102 Date of issue: 1 May 2010 File: Fisheries_Assessment_Methodology_v2.1.pdf © Marine Stewardship Council, 2010
Section B3: SICA Consequence tables for MSC Principles 1 and 2. (To be used with Section B1, SICA scoring templates)
Table B3.1. SICA Consequence Table for Principle 1, Target Species, and Principle 2, Retained Species and Bycatch Species. Choose and justify one subcomponent that, when impacted by fishing activities, results in the worst plausible case. Note that ―changes‖ to subcomponents in this context means changes due to fishing activities only. This is particularly important to remember with respect to the ―geographic range‖ subcomponent, which might be affected by other considerations, eg natural or anthropogenic climate change or other anthropogenic factors.
Subcomponent
Consequence Category (MSC Score)
1 (100) 2 (80) 3 (60)
Population size
Insignificant change to population size/growth rate (r). Unlikely to be detectable against background variability for this population.
Possible detectable change in size/growth rate (r) but minimal impact on population size and none on dynamics.
Full exploitation rate but long-term recruitment dynamics not adversely damaged
Reproductive capacity
No detectable change in reproductive capacity. Unlikely to be detectable against background variability for this population.
Possible detectable change in reproductive capacity but minimal impact on population dynamics.
Detectable change in reproductive capacity, impact on population dynamics at maximum sustainable level, long-term recruitment dynamics not adversely damaged.
Age/size/sex structure
No detectable change in age/size/sex structure. Unlikely to be detectable against background variability for this population.
Possible detectable change in age/size/sex structure but minimal impact on population dynamics.
Detectable change in age/size/sex structure. Impact on population dynamics at maximum sustainable level, long-term recruitment dynamics not adversely damaged.
Geographic range
No detectable change in geographic range. Unlikely to be detectable against background variability for this population.
Possible detectable change in geographic range but minimal impact on population range and none on dynamics.
Clear change in geographic range due to fishing activities

Document: Marine Stewardship Council Fisheries Assessment Methodology page 103 Date of issue: 1 May 2010 File: Fisheries_Assessment_Methodology_v2.1.pdf © Marine Stewardship Council, 2010
Table B3.2. Principle 2 SICA Consequence Table for PI 2.4.1, Habitats. Choose and justify one subcomponent that, when impacted by fishing activities, results in
the worst plausible case. Note that ―changes‖ to subcomponents in this context means changes due to fishing activities only.
Subcomponent
Consequence Category (MSC Score)
1 (100) 2 (80) 3 (60)
Habitat types
No direct impact on habitat types. Impact unlikely to be detectable. Time taken to recover to pre-disturbed state on the scale of hours to days.
Detectable impact on distribution of habitat types. Time to recover from local impact on the scale of days to weeks, at larger spatial scales recovery time up to one year.
Impact reduces distribution of habitat types. Time to recover from local impact on the scale of months to a few years, at larger spatial scales recovery time of several years to less than two decades
iii.
Habitat structure and function
No detectable change to the internal dynamics of habitat or populations of species making up the habitat. Time taken to recover to pre-disturbed state on the scale of hours to days.
Detectable impact on habitat structure and function. Time to recover from impact on the scale up to one year, regardless of spatial scale.
Impact reduces habitat structure and function. For impacts on non-fragile habitat structure this may be for up to 50% of habitat affected, but for more fragile habitats, to stay in this category the % area affected needs to be smaller-- up to 20%. Time to recover from impact up to two decades.
iii The times referred to here are based on the FAO International Guidelines for the Management of Deep-sea Fisheries in the High Seas, which is Annex F to the Report of
the FAO Technical Consultation on International Guidelines for the Management of Deep-sea Fisheries in the High Seas, Rome, 4-8 February and 25-29 August 2008. The guidelines define ―temporary impacts‖ on sensitive habitats as being those that allow the habitat to recover in the order of 5-20 years; this range is used as the guide for recovery times acceptable at the Consequence level of 3 (MSC score of 60).

Document: Marine Stewardship Council Fisheries Assessment Methodology page 104 Date of issue: 1 May 2010 File: Fisheries_Assessment_Methodology_v2.1.pdf © Marine Stewardship Council, 2010
Table B3.3. Principle 2 SICA Consequence Table for PI 2.5.1, Ecosystem. Choose and justify one subcomponent that, when impacted by fishing activities, results in the worst plausible case. Note that ―changes‖ to subcomponents in this context means changes due to fishing activities only. This is particularly important to remember with respect to the ―geographic range‖ subcomponent, which might be affected by other considerations, eg natural or anthropogenic climate change or other anthropogenic factors.
Subcomponent
Consequence Category (MSC Score)
1 (100) 2 (80) 3 (60)
Species composition
Interactions may be occurring which affect the internal dynamics of communities leading to change in species composition not detectable against natural variation.
Impacted species do not play a keystone role (see Paragraph 7.6.3 (a) and (b)) – only minor changes in relative abundance of other constituents. Changes of species composition up to 5%. Time to recover from impact up to 5 years
Detectable changes to the community species composition without a major change in function (no loss of function). Changes to species composition up to 10%. Time to recover from impact on the scale of several years to 2 decades
iv
Functional group composition
Interactions which affect the internal dynamics of communities leading to change in functional group composition not detectable against natural variation.
Minor changes in relative abundance of community constituents up to 5%.
Changes in relative abundance of community constituents, up to 10% chance of flipping to an alternate state/ trophic cascade.
Distribution of the community
Interactions which affect the distribution of communities unlikely to be detectable against natural variation.
Possible detectable change in geographic range of communities but minimal impact on community dynamics change in geographic range up to 5 % of original.
Detectable change in geographic range of communities with some impact on community dynamics Change in geographic range up to 10 % of original. Time to recover from impact on the scale of several years to 2 decades
Trophic/size structure
which affect the internal dynamics unlikely to be detectable against natural variation.
Change in mean trophic level, biomass/ number in each size class up to 5%.
Changes in mean trophic level, biomass/ number in each size class up to 10%.. Time to recover from impact on the scale of several years to 2 decades.
iv In addition to footnote 4, this is consistent with CCAMLR‘s Article II which refers to recovery within 2 or 3 decades.

Document: Marine Stewardship Council Fisheries Assessment Methodology page 105 Date of issue: 1 May 2010 File: Fisheries_Assessment_Methodology_v2.1.pdf © Marine Stewardship Council, 2010
Section B4: PSA reference tables
Table B4.1. PSA Attribute table
Attribute
Productivity Average age at maturity
Average size at maturity
Average maximum age
Average maximum size
Fecundity
Reproductive strategy
Trophic level
Susceptibility Availability considers overlap of fishing effort with a species distribution
Encounterability considers the likelihood that a species will encounter fishing gear that is deployed within the geographic range of that species (based on two attributes: adult habitat and bathymetry)
Selectivity considers the potential of the gear to capture or retain species
Post capture mortality considers the condition and subsequent survival of a species that is captured and released (or discarded)
Table B4.2. PSA Productivity attributes and scores
Low productivity (high risk, score=3)
Medium productivity (medium risk,
score=2)
High productivity (Low risk, score=1)
Average age at maturity >15 years 5-15 years <5 years
Average maximum age >25 years 10-25 years <10 years
Fecundity <100 eggs per year
100-20,000 eggs per year
>20,000 eggs per year
Average maximum size >300 cm 100-300 cm <100 cm
Average size at maturity >200 cm 40-200 cm <40 cm
Reproductive strategy Live bearer Demersal egg layer Broadcast spawner
Trophic Level >3.25 2.75-3.25 <2.75
Table B4.3. PSA Susceptibility attributes and scores
Low susceptibility (low risk, score=1)
Medium susceptibility (medium risk,
score=2)
High susceptibility (High risk, score=3)
Availability 1. Overlap of species range with fishery
<10% overlap 10-30% overlap >30% overlap
Encounterability –Habitat and depth check (scores vary by fishery)
Low overlap with fishing gear
Medium overlap with fishing gear
High overlap with fishing gear
Selectivity (scores vary by gear type, this example is for set gillnets. Selectivity for hooks is found in Table B4.4)
< mesh size, or >5 m in length
1-2 times mesh size, 4-5 m in length
>2 times mesh size, to say, 4 m in length
Post-capture mortality (scores vary by fishery)
Evidence of post-capture release
and survival
Released alive Retained species, or majority dead when
released

Document: Marine Stewardship Council Fisheries Assessment Methodology page 106 Date of issue: 1 May 2010 File: Fisheries_Assessment_Methodology_v2.1.pdf © Marine Stewardship Council, 2010
Table B4.4. Selectivity attribute scores, example for hooks. Similar selectivity tables will need to be developed by assessment teams that are appropriate for the gear being considered in the certification. The report should include a justification for the factors used and cut-offs selected.
Low Susceptibility Medium Susceptibility High Susceptibility Selectivity for hooks:
Scores for hook susceptibility may be assigned using the categories to the right. If there are conflicting answers, e.g. Low on point 1 but medium on point 2, the higher risk score shall be used.
1. Does not eat bait (e.g. diet specialist), filter feeder (e.g. basking shark), small mouth (e.g. sea horse). Most robust scoring attribute.
1. Large species, with adults rarely caught, but juveniles captured by hooks.
1. Bait used in the fishery is selected for this type of species, and is a known diet preference (e.g. squid bait used for swordfish), or important in wild diet.
2. Species with capacity to break line when hooked (e.g. large toothed whales, and sharks).
2. Species with capacity to break snood when being landed.
2. Species unable to break snood when being landed
3. Selectivity known to be low from selectivity analysis/experiment (e.g. <33% of fish encountering gear are selected)
3. Selectivity known to be medium from selectivity analysis/experiment (e.g. 33-66% of fish encountering gear are selected).
3. Selectivity known to be high from selectivity analysis/experiment (e.g. >66% of fish encountering gear are selected)

Document: Marine Stewardship Council Fisheries Assessment Methodology page 107 Date of issue: 1 May 2010 File: Fisheries_Assessment_Methodology_v2.1.pdf © Marine Stewardship Council, 2010
Section B5. Guidance on identifying species, habitats, and ecosystems impacted by a fishery under assessment.
Section B5.1 Identification of species
B5.1.1 Identification of species units (target, and bycatch/retained species) potentially impacted by fishery activities is part of the scoping process. Identification of target, retained and bycatch species impacted in the fishery is often possible through existing data and reports. Expert judgment and anecdotal evidence is also used to compile this preliminary species list. Stakeholders are then consulted, individually and at fishery management meetings, on the preliminary list and additions and deletions made, with rationale recorded for the particular decisions.
B5.1.2 In the MSC RBF, all target species, and all ―main‖ retained and bycatch species, which interact with the fishery in assessment must be identified. For definitions of these scoring elements see Section 7.1.
Section B5.2 Identification of habitat types
B5.2.1 The MSC RBF is designed to assess habitat risk to a range of activities associated with fishing. The basic unit is a habitat type, defined as either pelagic (encompassing the water-column), or benthic (the seafloor structure including its attached invertebrate fauna). Scoping involves identifying the habitat units (‗types‘) occurring within the geographical range within which the fishery operates.
Benthic habitat identification B5.2.2 Identifying benthic habitat types has proven challenging due to the dispersed and variable
nature of habitat data generally. Whatever data does exist varies in type, scale, quality and consistency, and perhaps most importantly, accessibility. Therefore, here we use a standardized way of identifying benthic habitat units: Each benthic habitat unit is defined based on three attributes - substratum (sediment type) geomorphology (seafloor topography) and fauna (dominant faunal group) (SGF). For example, one habitat type could be fine sediments—flat seabed—mixed epifauna. Each SGF combination with which the fishery interacts should be noted.
Pelagic habitat identification B5.2.3 Pelagic habitat typically comprises the water-column and is usually delineated by pelagic
boundaries based on bioregionalisation schemes. In Australia, for example, pelagic habitats were delineated based on oceanographic properties in relation to their depth and proximity to land, and underlying water masses. Similar classification systems occur in other regions (e.g. Spaulding et al 2007, Figure B5.1).
B5.2.4 In the absence of any alternative, the Spaulding et al (2007) classification should be used for the RBF assessment. The vertical water column can be further subdivided into depth strata, reflecting the different biological communities. Most fisheries under MSC assessment will be operating within one pelagic habitat only.

Document: Marine Stewardship Council Fisheries Assessment Methodology page 108 Date of issue: 1 May 2010 File: Fisheries_Assessment_Methodology_v2.1.pdf © Marine Stewardship Council, 2010
Figure B5.1. Examples of worldwide pelagic habitat boundaries (Spaulding et al 2007).
Section B5.3 Identification of ecosystems (community assemblages)
B5.3.1 There can be many interpretations of community—from very large-scale, ocean basin species assemblages to the small-scale, such as assemblages of a single taxon or small-scale habitat associations such as infaunal invertebrate communities.
B5.3.2 Community members include all mobile fauna, vertebrate or invertebrate, but do not include sessile organisms such as coral that are largely structural and therefore classified as habitat. In most cases, the generated community lists will comprise largely vertebrate species because information is more readily available for them. Once the set of species for the ecosystem is defined, a generic foodweb can be populated based on information about species interactions and trophic relationships (Figure B5.2) by allocating the set of species to the appropriate boxes. A general understanding of these relationships is necessary to be able to assess the risks posed to an ecosystem by fishing activities which may impact on one or more ecosystem components.
Phytoplankton
Benthic grazers
(gastropod
molluscs,
echinoderms,
urchins)
Detritivores
sea cucumbers,
urchins, worms,
crustaceans
Gelatinous
zooplankton
Small
invertebrate
feeders &
omnivores
Medium
invertebrate
feeder
Squid Medium
planktivores
Large
demersal
piscivores
Rays
Demersal
piscivorous
sharksSeal Seabirds
Large pelagic
piscivores
Toothed
whales
Pelagic
piscivorous
sharks
Small
planktivores
Small
herbivoorus
zooplankton
Large
carnivorous
zooplankton
pelagic prawns
Detritus
Large
invertebrate
feeder
Small
demersal
piscivores
Thick lines indicate >40% wet weight
Normal lines indicate 10-39% wet weight
Baleen
whales
Microalgae Macroalgae Pelagic
Bacteria
Benthic
Bacteria
Infauna
(meiofanuna)
Filter feeders
bivalves
tubeworms,
seasquirts,
Megafauna
carnivorous
polychaetes,
crabs, crustacea,
octopus
Medium
demersal
piscivores
Demersal
invertebrate
feeding sharks
Medium
pelagic
piscivores
Small
pelagic
piscivores
Herbivorous
mammals &
reptiles
Pelagic
jelly eaters
Large
planktivores
Figure B5.2. Generic foodweb (courtesy Cathy Bulman, CSIRO). The thickness of the lines is not relevant to the presentation here.

Document: Marine Stewardship Council Fisheries Assessment Methodology page 109 Date of issue: 1 May 2010 File: Fisheries_Assessment_Methodology_v2.1.pdf © Marine Stewardship Council, 2010
Section B6: Hazard Identification Tables
This proforma table can be completed once for each stock. Table B6.1 provides a set of examples of fishing activities for the effects of fishing to be used as a guide to assist in scoring the hazards.
Direct impact of Fishing
Fishing Activity Score (0/1)
Documentation of Rationale
Capture Bait collection
Fishing
Incidental behaviour
Direct impact without capture
Bait collection
Fishing
Incidental behaviour
Gear loss
Anchoring/ mooring
Navigation/steaming
Addition/ movement of biological material
Translocation of species (boat launching, reballasting)
On board processing
Discarding catch
Stock enhancement
Provisioning
Organic waste disposal
Addition of non-biological material
Debris
Chemical pollution
Exhaust
Gear loss
Navigation/ steaming
Activity/ presence on water
Disturb physical processes
Bait collection
Fishing
Boat launching
Anchoring/ mooring
Navigation/ steaming
External Hazards (specify the particular example within each activity area)
Other capture fishery methods
Aquaculture
Coastal development
Other extractive activities
Other non-extractive activities
Other anthropogenic activities
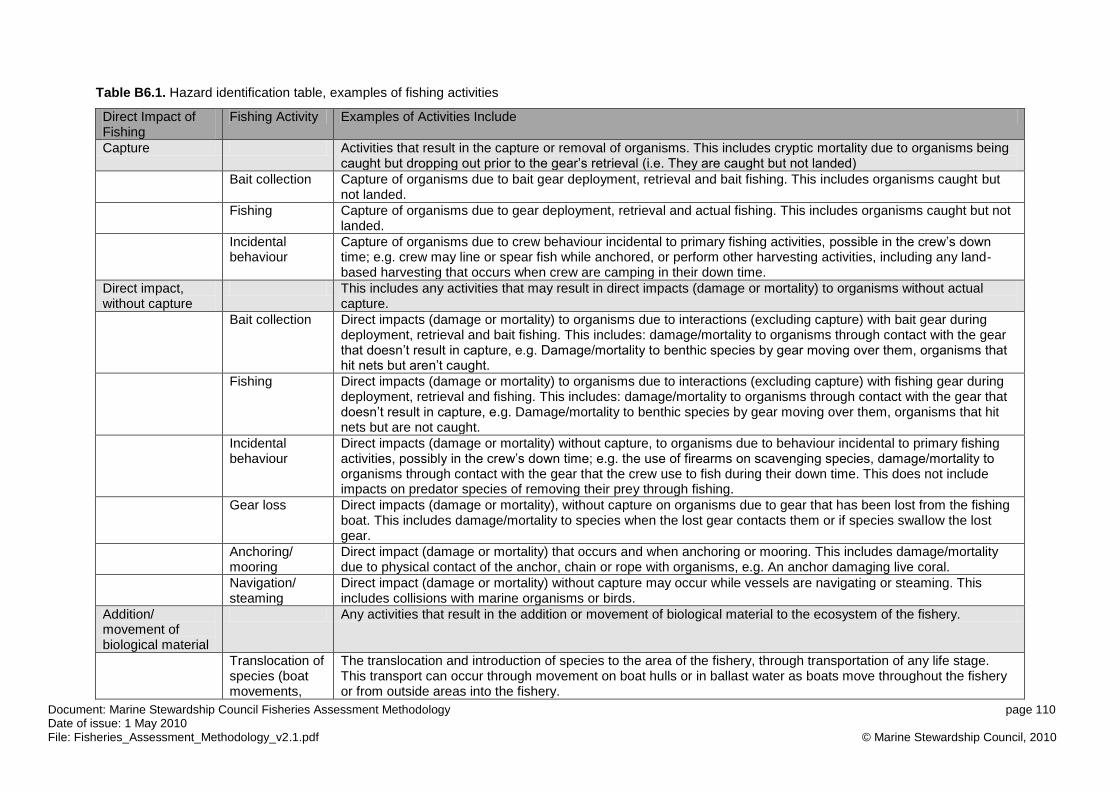
Document: Marine Stewardship Council Fisheries Assessment Methodology page 110 Date of issue: 1 May 2010 File: Fisheries_Assessment_Methodology_v2.1.pdf © Marine Stewardship Council, 2010
Table B6.1. Hazard identification table, examples of fishing activities
Direct Impact of Fishing
Fishing Activity Examples of Activities Include
Capture Activities that result in the capture or removal of organisms. This includes cryptic mortality due to organisms being caught but dropping out prior to the gear‘s retrieval (i.e. They are caught but not landed)
Bait collection Capture of organisms due to bait gear deployment, retrieval and bait fishing. This includes organisms caught but not landed.
Fishing Capture of organisms due to gear deployment, retrieval and actual fishing. This includes organisms caught but not landed.
Incidental behaviour
Capture of organisms due to crew behaviour incidental to primary fishing activities, possible in the crew‘s down time; e.g. crew may line or spear fish while anchored, or perform other harvesting activities, including any land-based harvesting that occurs when crew are camping in their down time.
Direct impact, without capture
This includes any activities that may result in direct impacts (damage or mortality) to organisms without actual capture.
Bait collection Direct impacts (damage or mortality) to organisms due to interactions (excluding capture) with bait gear during deployment, retrieval and bait fishing. This includes: damage/mortality to organisms through contact with the gear that doesn‘t result in capture, e.g. Damage/mortality to benthic species by gear moving over them, organisms that hit nets but aren‘t caught.
Fishing Direct impacts (damage or mortality) to organisms due to interactions (excluding capture) with fishing gear during deployment, retrieval and fishing. This includes: damage/mortality to organisms through contact with the gear that doesn‘t result in capture, e.g. Damage/mortality to benthic species by gear moving over them, organisms that hit nets but are not caught.
Incidental behaviour
Direct impacts (damage or mortality) without capture, to organisms due to behaviour incidental to primary fishing activities, possibly in the crew‘s down time; e.g. the use of firearms on scavenging species, damage/mortality to organisms through contact with the gear that the crew use to fish during their down time. This does not include impacts on predator species of removing their prey through fishing.
Gear loss Direct impacts (damage or mortality), without capture on organisms due to gear that has been lost from the fishing boat. This includes damage/mortality to species when the lost gear contacts them or if species swallow the lost gear.
Anchoring/ mooring
Direct impact (damage or mortality) that occurs and when anchoring or mooring. This includes damage/mortality due to physical contact of the anchor, chain or rope with organisms, e.g. An anchor damaging live coral.
Navigation/ steaming
Direct impact (damage or mortality) without capture may occur while vessels are navigating or steaming. This includes collisions with marine organisms or birds.
Addition/ movement of biological material
Any activities that result in the addition or movement of biological material to the ecosystem of the fishery.
Translocation of species (boat movements,
The translocation and introduction of species to the area of the fishery, through transportation of any life stage. This transport can occur through movement on boat hulls or in ballast water as boats move throughout the fishery or from outside areas into the fishery.

Document: Marine Stewardship Council Fisheries Assessment Methodology page 111 Date of issue: 1 May 2010 File: Fisheries_Assessment_Methodology_v2.1.pdf © Marine Stewardship Council, 2010
Direct Impact of Fishing
Fishing Activity Examples of Activities Include
reballasting)
On board processing
The discarding of unwanted sections of target after on board processing introduces or moves biological material, e.g. heading and gutting, retaining fins but discarding trunks.
Discarding catch
The discarding of unwanted organisms from the catch can introduce or move biological material. This includes individuals of target and byproduct species due to damage (e.g. shark or marine mammal predation), size, high grading and catch limits. Also includes discarding of all non-retained bycatch species. This also includes discarding of catch resulting from incidental fishing by the crew. The discards could be alive or dead.
Stock enhancement
The addition of larvae, juveniles or adults to the fishery or ecosystem to increase the stock or catches.
Provisioning The use of bait or berley in the fishery.
Organic waste disposal
The disposal of organic wastes (e.g. food scraps, sewage) from the boats.
Addition of non-biological material
Any activities that result in non-biological material being added to the ecosystem of the fishery, this includes physical debris, chemicals (in the air and water), lost gear, noise and visual stimuli.
Debris Non-biological material may be introduced in the form of debris from fishing vessels or mother ships. This includes debris from the fishing process: e.g. cardboard thrown over from bait boxes, straps and netting bags lost. Debris from non-fishing activities can also contribute to this e.g. Crew rubbish – discarding or food scraps, plastics or other rubbish. Discarding at sea is regulated by MARPOL, which forbids the discarding of plastics.
Chemical pollution
Chemicals can be introduced to water, sediment and atmosphere through: oil spills, detergents other cleaning agents, any chemicals used during processing or fishing activities.
Exhaust Exhaust can be introduced to the atmosphere and water through operation of fishing vessels
Gear loss The loss of gear will result in the addition of non-biological material, this includes hooks, line, sinkers, nets, otter boards, light sticks, buoys etc.
Navigation /steaming
The navigation and steaming of vessels will introduce noise and visual stimuli into the environment. Boat collisions and/or sinking of vessels. Echo-sounding may introduce noise that may disrupt some species (e.g. whales, orange roughy)
Activity /presence on water
The activity or presence of fishing vessels on the water will noise and visual stimuli into the environment.
Disturb physical processes
Any activities that will disturb physical processes, particularly processes related to water movement or sediment and hard substrate (e.g. boulders, rocky reef) processes.
Bait collection Bait collection may disturb physical processes if the gear contacts seafloor-disturbing sediment, or if the gear disrupts water flow patterns.
Fishing Fishing activities may disturb physical processes if the gear contacts seafloor-disturbing sediment, or if the gear disrupts water flow patterns.
Boat launching Boat launching may disturb physical processes, particularly in the intertidal regions, if dredging is required, or the boats are dragged across substrate. This would also include foreshore impacts where fishers drive along beaches

Document: Marine Stewardship Council Fisheries Assessment Methodology page 112 Date of issue: 1 May 2010 File: Fisheries_Assessment_Methodology_v2.1.pdf © Marine Stewardship Council, 2010
Direct Impact of Fishing
Fishing Activity Examples of Activities Include
to reach fishing locations and launch boats. Impacts of boat launching that occurs within established marinas are outside the scope of this assessment.
Anchoring /mooring
Anchoring/mooring may affect the physical processes in the area that anchors and anchor chains contact the seafloor.
Navigation /steaming
Navigation /steaming may affect the physical processes on the benthos and the pelagic by turbulent action of propellers or wake formation.
External hazards Any outside activities that will result in an impact on the component in the same location and period that the fishery operates. The particular activity as well as the mechanism for external hazards should be specified.
Other capture fishery methods
Take or habitat impact by other commercial, indigenous or recreational fisheries operating in the same region as the fishery under examination
Aquaculture Capture of feed species for aquaculture. Impacts of cages on the benthos in the region
Coastal development
Sewage discharge, ocean dumping, agricultural runoff
Other extractive activities
Oil and gas pipelines, drilling, seismic activity
Other non-extractive activities
Defense, shipping lanes, dumping of munitions, submarine cables
Other anthropogenic activities
Recreational activities, such as scuba diving leading to coral damage, power boats colliding with whales, dugongs, turtles. Shipping, oil spills
Document: Marine Stewardship Council Fisheries Assessment Methodology page 113 Date of issue: 1 May 2010 File: Fisheries_Assessment_Methodology_v2.1.pdf © Marine Stewardship Council, 2010
Section B7: RBF Scoring Examples
The following tables have been completed for a fictitious fishery using the RBF for several indicators. The fishery is a diving spear fishery for Marquesen Grouper which takes place on the reefs around the Marquesas Islands. The Marquesen Grouper is an endemic species to these islands, and is an expensive delicacy, served primarily to tourists in the many resort hotels on the islands. There are 25 fishermen involved in this fishery. They go out in small boats with outboard motors to the fishing grounds, drop anchor, and dive from the boat, using spears to catch grouper. They have a weekly bag limit of 40 fish each, and usually make 3-4 trips per week to catch up to their limit. While fishing, they sometimes take other encountered species for subsistence and local market, such as lobster, sea cucumber, and other reef-associated fin fishes. As there are no official fisheries for these other species, there is no harvest limit, nor official reporting of landings. There is no unretained bycatch, because of the highly selective nature of the gear. This fishery used the RBF to evaluate PIs 1.1.1, 2.1.1, and 2.4.1. The following tables were completed by the fictitious assessment team during the RBF assessment. NOTE: Since the assessment used the RBF for PI 1.1.1., the guidance on scoring 1.1.2 given in Paragraph 6.2.37 above, as well as the mandatory condition when the 1.1.1 scores between 60 and 80 (Paragraph 6.2.14), would have to be followed here.

Document: Marine Stewardship Council Fisheries Assessment Methodology page 114 Date of issue: 1 May 2010 File: Fisheries_Assessment_Methodology_v2.1.pdf © Marine Stewardship Council, 2010
Table B7.1. Sample SICA table for PI 1.1.1. The combination of risk-causing activity and subcomponent identified as the ―worst case‖ was direct capture impacting on population size.
Performance Indicator: 1.1.1
Risk-causing activities
Temporal scale of activity
Spatial scale of activity
Intensity of activity
Relevant subcomponents
Consequence score
MSC Score
Target species outcome
Fishing activities from all fisheries including:
Direct capture
Unobserved mortality (e.g. gear loss)
Capture as bycatch in other fisheries
Other identified risk-causing activites (please specify)
5 5 3
Population size 3 60
Reproductive capacity
Age/size/sex structure
Geographic range
Rationale: As this fishery uses a very selective gear resulting in no gear loss, and there are no other fisheries on this species, we were able to identify direct
capture as the activity related to the fishery posing the most risk to the target stock. Population was chosen as the most relevant subcomponent, because it is possible to discern changes to population size through proxies such as CPUE, and through speaking with stakeholders. Additionally, as the fishermen target individuals of a specific size, there is no fishery-dependant way of determining possible changes in size structure or reproductive capacity. The temporal scale score of 5 was given assuming the fishermen fish 4 days a week, 52 weeks per year. A spatial scale score of 5 was given because this is an endemic reef-associated species, therefore its range is restricted to the Marquesas Islands, and the fishermen observe no closed areas. An Intensity score of 3 was given because evidence of local depletion was given in that fishermen indicated they do not return to the same spot for fishing more than once per month because they feel their chances of finding enough fish there are diminished. Finally, a consequence score of 3 is given, in that there is a bag limit, set using some scientific, as well as economic, basis, and that limit is always fished. The assessment team and other stakeholders agreed that this is consistent with the ―full exploitation rate‖ language given in consequence score 3. Additionally, CPUE has not changed during the past 10 years of record keeping, and bag limits have also not been adjusted upward or downward,
Note: the rationale given here and highlighted in the table is only meant as a partial example of what can be included in this box and is not meant to be extensive or
complete.

Document: Marine Stewardship Council Fisheries Assessment Methodology page 115 Date of issue: 1 May 2010 File: Fisheries_Assessment_Methodology_v2.1.pdf © Marine Stewardship Council, 2010
Table B7.2. Sample SICA table for PI 2.2.1. The combination of risk-causing activity and subcomponent identified as the ―worst case‖ was fishing impacting on population size. The species determined ―most vulnerable‖ was the South Pacific rock lobster Panulirus penicillatus.
Performance Indicator
Risk-causing activities from fishery under assessment
Temporal scale of activities
Spatial scale of activities
Intensity of activities
Relevant subcomponents
Consequence score
MSC Score
PRINCIPLE TWO: Retained Species Outcome
Fishing
Gear loss
Bait collection
Other identified risk-causing activities (please specify)
5 5 2
Population size
3 60
Reproductive capacity
Species: South Pacific rock lobster Panulirus penicillatus
Age/size/sex structure
Geographic range
Rationale: The full list of retained species is given elsewhere in the report. Of the species taken, the stakeholder and expert groups determined that the rock lobster was
the most vulnerable due to ease of capture, and high market value. Grouper fishermen always take lobster when they encounter them, which is estimated to be once or twice per week. Fishermen and buyers for the local market concur that this fishery produces a maximum of 20 lobsters per week, of a species that ranges throughout all of the South Pacific Islands. However, as a matter of precaution, it was assumed that the Marquesas Islands are home to a self-contained sub-population, and local depletion is thus possible. As a result, it was determined that the grouper fishery could be causing a change to the population size or growth rate, and as there are no restrictions on the fishery at present in terms of bag limits for lobster, there is potential for more exploitation if it were to become more profitable…
Note: the rationale given here and highlighted in the table is only meant as a partial example of what can be included in this box and is not meant to be extensive or
complete.
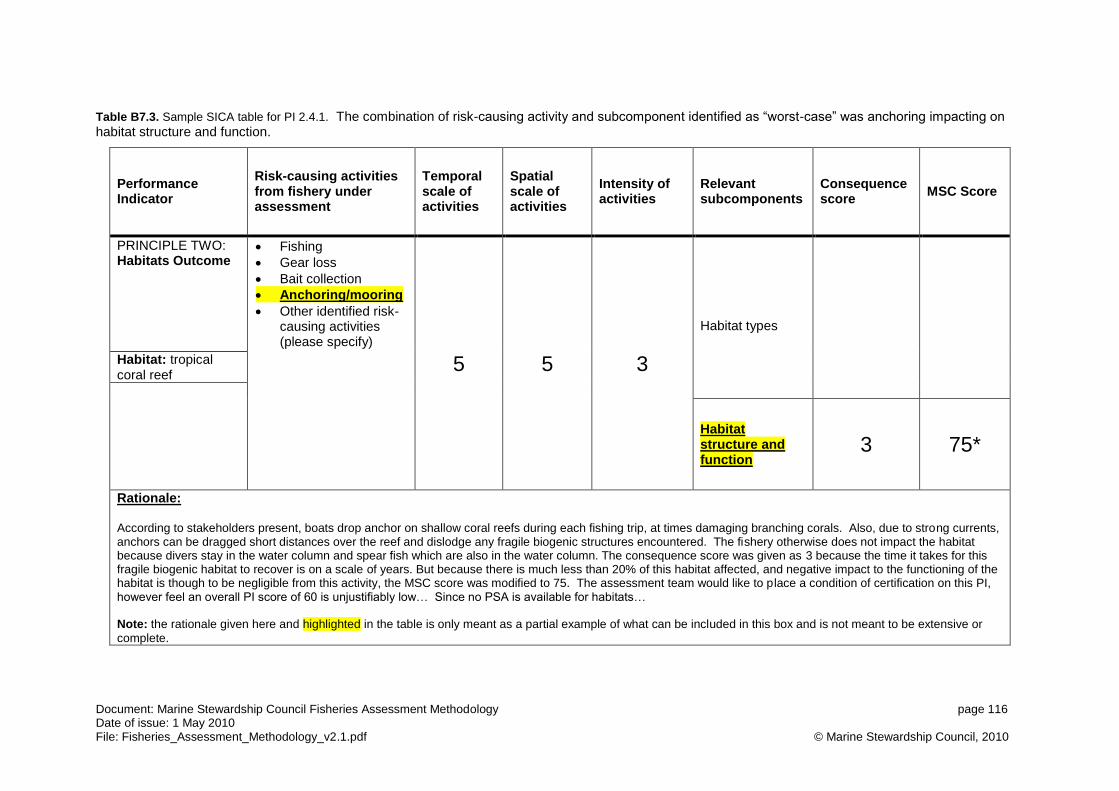
Document: Marine Stewardship Council Fisheries Assessment Methodology page 116 Date of issue: 1 May 2010 File: Fisheries_Assessment_Methodology_v2.1.pdf © Marine Stewardship Council, 2010
Table B7.3. Sample SICA table for PI 2.4.1. The combination of risk-causing activity and subcomponent identified as ―worst-case‖ was anchoring impacting on habitat structure and function.
Performance Indicator
Risk-causing activities from fishery under assessment
Temporal scale of activities
Spatial scale of activities
Intensity of activities
Relevant subcomponents
Consequence score
MSC Score
PRINCIPLE TWO: Habitats Outcome
Fishing
Gear loss
Bait collection
Anchoring/mooring
Other identified risk-causing activities (please specify)
5 5 3
Habitat types
Habitat: tropical coral reef
Habitat structure and function
3 75*
Rationale: According to stakeholders present, boats drop anchor on shallow coral reefs during each fishing trip, at times damaging branching corals. Also, due to strong currents, anchors can be dragged short distances over the reef and dislodge any fragile biogenic structures encountered. The fishery otherwise does not impact the habitat because divers stay in the water column and spear fish which are also in the water column. The consequence score was given as 3 because the time it takes for this fragile biogenic habitat to recover is on a scale of years. But because there is much less than 20% of this habitat affected, and negative impact to the functioning of the habitat is though to be negligible from this activity, the MSC score was modified to 75. The assessment team would like to place a condition of certification on this PI, however feel an overall PI score of 60 is unjustifiably low… Since no PSA is available for habitats… Note: the rationale given here and highlighted in the table is only meant as a partial example of what can be included in this box and is not meant to be extensive or
complete.
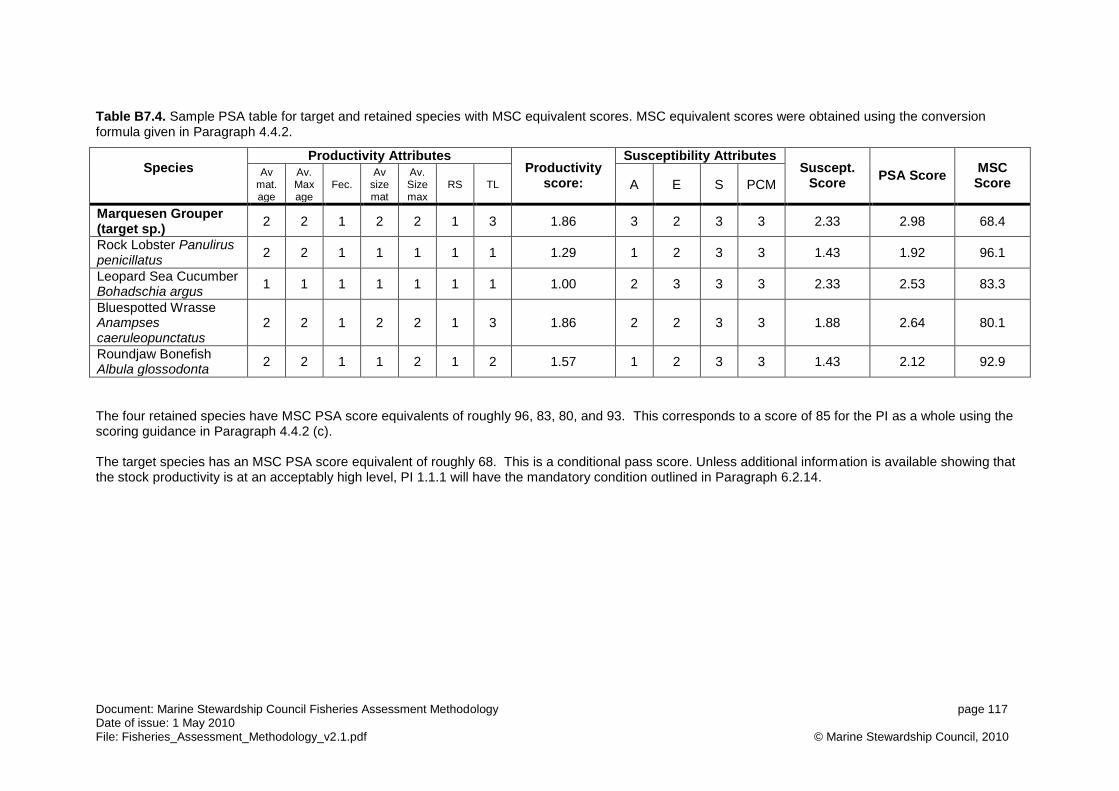
Document: Marine Stewardship Council Fisheries Assessment Methodology page 117 Date of issue: 1 May 2010 File: Fisheries_Assessment_Methodology_v2.1.pdf © Marine Stewardship Council, 2010
Table B7.4. Sample PSA table for target and retained species with MSC equivalent scores. MSC equivalent scores were obtained using the conversion formula given in Paragraph 4.4.2.
Species
Productivity Attributes Productivity
score:
Susceptibility Attributes Suscept.
Score PSA Score
MSC Score
Av mat. age
Av. Max age
Fec. Av
size mat
Av. Size max
RS TL A E S PCM
Marquesen Grouper (target sp.)
2 2 1 2 2 1 3 1.86 3 2 3 3 2.33 2.98 68.4
Rock Lobster Panulirus penicillatus
2 2 1 1 1 1 1 1.29 1 2 3 3 1.43 1.92 96.1
Leopard Sea Cucumber Bohadschia argus
1 1 1 1 1 1 1 1.00 2 3 3 3 2.33 2.53 83.3
Bluespotted Wrasse Anampses caeruleopunctatus
2 2 1 2 2 1 3 1.86 2 2 3 3 1.88 2.64 80.1
Roundjaw Bonefish Albula glossodonta
2 2 1 1 2 1 2 1.57 1 2 3 3 1.43 2.12 92.9
The four retained species have MSC PSA score equivalents of roughly 96, 83, 80, and 93. This corresponds to a score of 85 for the PI as a whole using the scoring guidance in Paragraph 4.4.2 (c). The target species has an MSC PSA score equivalent of roughly 68. This is a conditional pass score. Unless additional information is available showing that the stock productivity is at an acceptably high level, PI 1.1.1 will have the mandatory condition outlined in Paragraph 6.2.14.
Document: Marine Stewardship Council Fisheries Assessment Methodology page 118 Date of issue: 1 May 2010 File: Fisheries_Assessment_Methodology_v2.1.pdf © Marine Stewardship Council, 2010
Endnotes
1 The Outcome Performance Indicator for ETP species requires that the fishery ―meets national
and international requirements for protection of ETP species‖. Because these limits will be different in different management regimes is not possible to use a risk-based approach to evaluate the performance of a fishery against this PI. 2 A PSA for ecosystems is still under development by the CSIRO team responsible for the
Ecological Risk Assessment for the Effect of Fishing (ERAEF), upon which the MSC RBF methodologies are based. And, although PSAs have been developed for some specific habitats, further development needs to take place as new fisheries are assessed to ensure that risk cut-offs for habitat are consistent with the MSC Principles and Criteria. Thus it is anticipated that a set of appropriate habitat PSAs will be available in the future. 3 The Risk-Based Framework is designed to allow certifiers to determine the risk that a fishery is
posing undue harm to a species, habitat, or ecosystem. Principle 3 performance indicators ask for an evaluation of the fisheries management system. This is not amenable to a risk-based approach. 4 The FAO Guidelines on Ecolabelling for Fisheries and Fisheries Products from Marine Capture
Fisheries4 provide the conceptual basis for the adoption by the MSC of a risk-based approach to
the evaluation of fisheries against certain performance indicators in circumstances where information is inadequate to evaluate those performance indicators conventionally. In paragraph 32, the FAO guidelines state:
“…the use of less elaborate methods for assessment of stocks should not preclude fisheries from possible certification for ecolabelling”. It goes on to note ―...to the extent that the application of such methods results in greater uncertainty about the state of the „stock under consideration‟, more precautionary approaches to managing such resources will be required which may necessitate lower levels of utilization of the resource”.
The inference is that in the absence of detailed scientific information on fishery impacts and providing the existence of tools which provide a qualitative or semi-quantitative indication of the risk inherent in a fishery, it should be possible to assess such a fishery for certification based on the extent to which fishing activity is demonstrably ―precautionary‖ or of ―less risk‖.
The MSC has adopted an approach which considers a combination of risk-based indicators in order to arrive at a risk score which translates to a parallel MSC score. The risk-based indicators used in this process, include, amongst others, qualitative and semi-quantitative proxies for scale and intensity of fishing activity which correspond with the level of utilisation of the resource. In addition, the approach requires the assessment team to adopt the worst case scenario approach to scoring the risk indicators in the absence of credible evidence, information or logical reasoning to the contrary. In the event of the RBF being used for a particular PI, the likelihood of being scored high risk and therefore of receiving a low MSC scores on the specified indicator increases with increasing scale and intensity of utilisation of resources in the fishery. Furthermore, while the RBF accommodates the use of more qualitative information obtained under an extensive stakeholder consultation process, increased uncertainty around the information or evidence used, or the lack of consensus on particular information obtained in the process will result in the most cautious (worst plausible) score being applied, furthering the likelihood of lower MSC scores. In general this stepped approach to risk can be expressed by the following:
Document: Marine Stewardship Council Fisheries Assessment Methodology page 119 Date of issue: 1 May 2010 File: Fisheries_Assessment_Methodology_v2.1.pdf © Marine Stewardship Council, 2010
A SICA (section 3.2) will deliver a more precautionary assessment of risk using fewer data than a PSA or the standard FAM assessment;
A PSA (section 3.3) requires more information than a SICA, and will deliver a more precautionary assessment of risk using fewer data than the standard FAM assessment;
The intention of the MSC in allowing the use of a risk-based approach is to ensure that its assessment process is accessible to data-deficient fisheries that are readily demonstrated as operating in a precautionary manner. Implicit in the approach is a recognition that fisheries which are operating at relatively high levels of utilisation pose a greater risk to the ecological components with which they interact and that the assessment and management of such risks must be underpinned by comprehensive scientific information. For this reason, if detailed data exist for a fishery these must be used in a standard FAM assessment if such is possible; the RBF is offered as an alternative for when such data are not available, and it will deliver a more precautionary (risk averse) assessment. 5 There is a direct quadratic relationship (R
2=1) between overall PSA scores and MSC score
equivalents. This has been derived setting the highest possible risk score (i.e all attributes score high risk) as equivalent to an MSC score of 0; setting the lowest possible risk score (i.e. all attributes score low risk) as equivalent to an MSC score of 100; and setting the lower and upper bounds of the ―mediuim risk‖ range as equivalent to MSC scores of 60 and 80, respectively. A curve through these four points is described by the conversion equation presented in the text.
6 Use of the RBF for PI 1.1.1 implies risk-based reference points for PI 1.1.2, i.e. the limit
reference point is expressed as the likelihood of recruitment being impaired by all fishing activities on the target stock. In the RBF context, the level of impact at which recruitment is impaired is given by the SICA consequence level ―severe impact‖ (SICA score 5). Therefore, the limit and target reference points defined within this framework have been set such that there is at least a 70% likelihood that the true status of the stock is above this level, which is consistent with the requirements of Section 6.2.7. These reference points are pre-defined when using the RBF to score PI 1.1.1 as follows:
a. The limit reference point corresponds to an MSC score converted from PSA of 60 b. The target reference point corresponds to a SICA score of 2, or MSC score converted
from PSA of 80.
Note there is an extra level of precaution in the RBF in this context, as it is a SICA score of 3 which actually corresponds to ―full exploitation rate‖ (i.e. MSY fishing)—the 80 scoring guidepost within the default assessment tree. The RBF however uses a SICA score of 2 as the 80 scoring guidepost equivalent as an extra measure of precaution, and to always encourage the use of stock status data where available. 7 The RBF is designed to be used in cases where direct measures of stock status such as
estimates of biomass, are not available. Therefore, there is no direct measure to determine whether the stock is actually depleted, and therefore would need to consider rebuilding measures under PI 1.1.3. What is known after scoring PI 1.1.1 using the RBF is the risk of the stock being fished such that recruitment would be impaired. Therefore, rather than requiring a fishery scoring less than 80 on PI 1.1.1 using the RBF to score PI 1.1.3, when a fishery scores between 60 and 80 on PI 1.1.1 using the RBF, the conditions specified in Paragraph 6.2.14 for PI 1.1.1 shall apply. 8 It is recognized that, for data-limited fisheries, the application of the MSC RBF may be the only
―assessment of stock status‖ available. This assessment is made in relation to risk level reference points rather than biologically based reference points, so the logic for defaulting the score for PI 1.1.2 to 80 when the RBF is needed to assess PI 1.1.1 holds here for 1.2.4.as well.
Document: Marine Stewardship Council Fisheries Assessment Methodology page 120 Date of issue: 1 May 2010 File: Fisheries_Assessment_Methodology_v2.1.pdf © Marine Stewardship Council, 2010
9 Cut-off values for scoring the productivity attributes as low, medium and high were developed
afer considering the distribution of attribute values for a wide range of taxa from within Australia. In testing the approach in subsequent discussions around the world, and validating the attributes against intrinsic rate of increase (r), we have improved our understanding to recognize that taxa-specific cut-offs, and geographic (tropical, vs temperate, vs deep sea) may be appropriate. This will take some additional research, and we are progressing this at present. In the next year, it is likely we can suggest updated cut-offs. 10
Calculation of Euclidean distance: For each component unit (e.g. species) the attributes for productivity are scored [1 3] (high, medium, low productivity). These attribute scores are averaged to provide an overall productivity score in the interval [1 3]. Similarly for each unit the attributes within the four aspects of susceptibility are also scored [1 3] (low, medium, and high susceptibility). These aspects are multiplied and rescaled to the interval [1 3] to provide a susceptibility score. These two scores are then plotted on the PSA diagnostic plot. A single risk score is calculated as the Euclidean distance from the nominal origin [0,0], calculated as:
)( 22 SPR , where R is the risk score, which can fall in the interval [1.41 4.24], and P is the
productivity score, and S the susceptibility score. This single risk score allows a ranking of all units considered.