msc dissertation aerodynamic analysis and - cd-adapco
TRANSCRIPT
School of Technology
MSc Dissertation
Aerodynamic analysis and optimisation of the rear wing of a
WRC car
Oxford Brookes University
Student No.: 11090024
MSc in Motorsport Engineering
Oxford Brookes University School of Technology
September 2012
Project Supervisor: Daniel Bell
Aerodynamic analysis and optimisation of the rear wing of a WRC car FinalReport.docx Ed 1
Eduardo Cañada 3 of 82 27 September 2012
ABSTRACT
This project is an introduction on the aerodynamics of a World Rally Championship
car, a subject which has only been briefly covered by published literature. Because
of this, the main aim of the project is to fill this gap on the published literature using
CFD simulations on a 2008 Subaru Impreza WRC S14 developed by Prodrive.
The project has been focused on the design of the rear wing of the car, studying
the final design that the car used and the solutions adopted by the designers. To
do so, the effects that different parts from the rear wing have on the overall car
have been deducted using different simulations.
Then, the design has been evaluated under yawed conditions and on jump
situations, confirming the results with the results of similar studies from books and
SAE papers when possible.
Finally, a series of modifications have been proposed based upon the results from
the different analysis undertaken. One of them has been simulated and the results
confirm an increase of downforce in yaw, improving the original design.
Aerodynamic analysis and optimisation of the rear wing of a WRC car FinalReport.docx Ed 1
Eduardo Cañada 4 of 82 27 September 2012
ACKNOWLEDGEMENTS
I would like to thank Simon Farley for helping me with the initial steps of my project
and his enthusiasm about it, until he had to leave the University. I wish him luck
with his new job.
Of course, I would also like to thank Daniel Bell for giving me feedback on the
project after Simon’s departure.
I would also like to give my most sincere thank to Dr. Elspeth Mosedale and Dr
Konstantinos Karantonis from CD-Adapco for giving me the opportunity to run
Star-CCM+ on my laptop, so I could work from home.
Finally I would like to thank my family and everyone who has supported me during
this MSc degree.
Aerodynamic analysis and optimisation of the rear wing of a WRC car FinalReport.docx Ed 1
Eduardo Cañada 5 of 82 27 September 2012
TABLE OF CONTENTS
ABSTRACT .............................................................................................................. 3
ACKNOWLEDGEMENTS ........................................................................................ 4
TABLE OF CONTENTS ........................................................................................... 5
LIST OF FIGURES ................................................................................................... 7
LIST OF TABLES ..................................................................................................... 9
LIST OF SYMBOLS AND ABBREVIATIONS ........................................................ 10
1 INTRODUCTION ................................................................................................. 11
1.1 Introduction ...................................................................................................... 11
1.2 Background ...................................................................................................... 12
1.3 Aims and objectives ......................................................................................... 14
1.4 Dissertation Structure ....................................................................................... 15
1.5 Limitations and Dependencies ......................................................................... 16
2 LITERATURE REVIEW ....................................................................................... 17
2.1 Introduction ...................................................................................................... 17
2.2 Basic vehicle body concepts ............................................................................ 18
2.2.1 Ride Height ................................................................................................ 18
2.2.2 Body’s incidence ........................................................................................ 19
2.2.3 Wind side slip angle ................................................................................... 20
2.3 Air flow structure around a hatchback vehicle .................................................. 21
2.4 Wings ............................................................................................................... 22
2.5 CFD Simulations .............................................................................................. 25
2.6 Blockage effect................................................................................................. 27
2.7 WRC car aerodynamics ................................................................................... 29
2.8 Summary .......................................................................................................... 33
3 EXPERIMENTAL / NUMERICAL METODOLOGY .............................................. 34
3.1 Introduction ...................................................................................................... 34
3.2 Geometry development .................................................................................... 34
3.2.1 Initial method ............................................................................................. 35
3.2.2 Alternative method ..................................................................................... 37
3.3 CFD Simulations Setup .................................................................................... 38
3.3.1 Rolling road simulation ............................................................................... 40
Aerodynamic analysis and optimisation of the rear wing of a WRC car FinalReport.docx Ed 1
Eduardo Cañada 6 of 82 27 September 2012
3.3.2 Symmetric simulations mesh ..................................................................... 42
3.3.3 Symmetric mesh analysis .......................................................................... 44
3.3.4 Non-symmetric simulations settings ........................................................... 46
3.3.5 Non-symmetric simulations mesh .............................................................. 47
3.3.6 Non-symmetric mesh analysis ................................................................... 47
4 RESULTS AND DISCUSSIONS .......................................................................... 49
4.1 Introduction ...................................................................................................... 49
4.2 Original wing investigation ............................................................................... 49
4.2.1 Introduction ................................................................................................ 49
4.2.2 Experiments results ................................................................................... 50
4.2.3 Wake analysis ............................................................................................ 54
4.2.4 Analysis conclusions .................................................................................. 56
4.3 Large ride height variation ................................................................................ 56
4.3.1 Introduction ................................................................................................ 56
4.3.2 Experiments results ................................................................................... 56
4.3.3 Analysis conclusions .................................................................................. 60
4.4 Large yaw angle variation ................................................................................ 60
4.4.1 Introduction ................................................................................................ 60
4.4.2 Experiments results ................................................................................... 62
4.4.3 Analysis conclusions .................................................................................. 65
4.5 Proposed variations ......................................................................................... 66
4.5.1 Introduction ................................................................................................ 66
4.5.2 Modifications of the wing and dam profiles ................................................ 66
4.5.3 Vertical fins variation .................................................................................. 67
5 FUTURE WORK .................................................................................................. 72
6 CONCLUSIONS .................................................................................................. 73
REFERENCES ....................................................................................................... 74
BIBLIOGRAPHY .................................................................................................... 77
APPENDIX A .......................................................................................................... 78
APPENDIX B .......................................................................................................... 80
Aerodynamic analysis and optimisation of the rear wing of a WRC car FinalReport.docx Ed 1
Eduardo Cañada 7 of 82 27 September 2012
LIST OF FIGURES
Figure 1: Subaru Impreza WRC S14 [3] .............................................................................................. 11
Figure 2: Audi Sport Quattro S1 [4] .................................................................................................... 13
Figure 3: Ford Focus WRC 2003 [5] .................................................................................................... 14
Figure 4: Axis system .......................................................................................................................... 17
Figure 5: Lift and Drag coefficients versus ground clearance [6] ....................................................... 18
Figure 6: Lift and Drag coefficients versus Angle of Attack [6] .......................................................... 19
Figure 7: Lift, drag and side-force coefficient variation versus side slip angle [6] ............................. 20
Figure 8: Subaru Impreza 2008 side view [8] ..................................................................................... 21
Figure 9: Pressure coefficient and velocity vectors behind a Rover 200 model with spoiler [11] ..... 21
Figure 10: Aerofoil and wing terminology ......................................................................................... 22
Figure 11: Venturi tube [13] ............................................................................................................... 23
Figure 12: Shape of pressure distributions of symmetrical and a cambered aerofoil [6] ................. 24
Figure 13: Lift coefficient versus angle of attack for three symmetrical profiles [6] ......................... 25
Figure 14: Complexity of Geometry versus Complexity of Equations [6] .......................................... 26
Figure 15: Blockage effect explanation [6]......................................................................................... 28
Figure 16: Novikov’s rear bumper landing [22] ................................................................................. 31
Figure 17: Petter Solberg's nose landing [23] .................................................................................... 32
Figure 18: Top and rear views of the rear wing and car silhouette ................................................... 33
Figure 19: Provided 3ds geometry ..................................................................................................... 34
Figure 20: Completed geometry with 3ds Max .................................................................................. 36
Figure 21: Rebuilt simplified CAD geometry with blueprints setup ................................................... 37
Figure 22: Velocity scalar scene ......................................................................................................... 41
Figure 23: Fluid volume size ............................................................................................................... 42
Figure 24: Detailed view of the contact patch volumetric mesh ....................................................... 43
Figure 25: Symmetric case car and wake volumetric mesh ............................................................... 43
Figure 26: Mesh diagnostics for a symmetric simulation .................................................................. 44
Figure 27: Wall Y+ scalar scene of a symmetric case ......................................................................... 45
Figure 28: Non-symmetric case volumetric mesh (20 degrees of yaw) ............................................. 47
Figure 29: Mesh diagnostics for a non-symmetric simulation (20 degrees of yaw) .......................... 48
Figure 30: Wall Y+ scalar scene of a non-symmetric case (20 degrees of yaw) ................................. 48
Figure 31: Investigated variations of the original wing ...................................................................... 49
Figure 32: Variation 1 centre plane pressure coefficient scalar scene .............................................. 51
Figure 33: Downforce generated by body and wing plot .................................................................. 51
Figure 34: Underbody centre line pressure coefficient plot .............................................................. 52
Figure 35: Body centre line pressure coefficient plot ........................................................................ 52
Figure 36: Rear wing streamlines comparison ................................................................................... 53
Figure 37: Wings centre line pressure coefficient plot ...................................................................... 53
Figure 38: Pressure coefficient behind the car .................................................................................. 55
Figure 39: Rear wing vortex ............................................................................................................... 55
Figure 40: Drag and downforce variation with ride height ................................................................ 57
Figure 41: Aerodynamic balance variation with ride height .............................................................. 58
Figure 42: Underbody pressure coefficient comparison ................................................................... 59
Figure 43: Underbody pressure coefficient comparison (jump) ........................................................ 59
Aerodynamic analysis and optimisation of the rear wing of a WRC car FinalReport.docx Ed 1
Eduardo Cañada 8 of 82 27 September 2012
Figure 44: WRC car sliding on a corner [25] ....................................................................................... 61
Figure 45: Drag and downforce results for yawed simulations ......................................................... 62
Figure 46: Aero balance versus Yaw angle results ............................................................................. 63
Figure 47: X velocity (variation No. 4) ................................................................................................ 64
Figure 48: Shadow caused by an end plate in yaw [26] ..................................................................... 64
Figure 49: X velocity (variation No. 5) ................................................................................................ 65
Figure 50: Proposed wing and dam profile variation ......................................................................... 66
Figure 51: Upper wing mountings example ....................................................................................... 67
Figure 52: Vertical fins proposed variations ...................................................................................... 68
Figure 53: Downforce with different vertical fins designs ................................................................. 69
Figure 54: Measuring line ................................................................................................................... 69
Figure 55: Comparison of the wing with and without the original fins ............................................. 70
Figure 56: Comparison of the wing without the original fins and the new 5 fins design .................. 70
Figure 57: Pressure scalar plot of the test simulation ....................................................................... 79
Aerodynamic analysis and optimisation of the rear wing of a WRC car FinalReport.docx Ed 1
Eduardo Cañada 9 of 82 27 September 2012
LIST OF TABLES
Table 1: Meshing and physics models for all simulations .................................................................. 38
Table 2: General mesh settings for all simulations ............................................................................ 39
Table 3: Boundary settings for all simulations ................................................................................... 39
Table 4: Physics settings for all simulations ....................................................................................... 40
Table 5: Vehicle and flow volume dimensions for the symmetrical cases ........................................ 41
Table 6: Vehicle and flow volume dimensions for the non-symmetrical cases ................................. 46
Table 7: Wing variation results .......................................................................................................... 50
Table 8: Ride height experiments results ........................................................................................... 57
Table 9: Balance and moments with height variation ....................................................................... 58
Table 10: Yaw angle simulations results ............................................................................................ 62
Table 11: Initial test models ............................................................................................................... 78

Aerodynamic analysis and optimisation of the rear wing of a WRC car FinalReport.docx Ed 1
Eduardo Cañada 10 of 82 27 September 2012
LIST OF SYMBOLS AND ABBREVIATIONS
A: Car frontal area
AOA: Angle of attack
Ap: Plan area
b: Span
c: Chord
CD: Drag coefficient
CL: Lift coefficient
D: Drag force
e/c: Camber
FIA: Fédération Internationale de l'Automobile
L: Lift force
SAE: Society of Automotive Engineers
WRC: World Rally Championship
βw: Wind slip angle
Aerodynamic analysis and optimisation of the rear wing of a WRC car FinalReport.docx Ed 1
Eduardo Cañada 11 of 82 27 September 2012
1 INTRODUCTION
1.1 INTRODUCTION
This project aims to cover all the knowledge possible around the aerodynamics of
a Word Rally Championship vehicle, concentrating on the rear wing. A WRC car
has a lot of different requirements than a regular circuit racer, and some of them
will be investigated with CFD simulations.
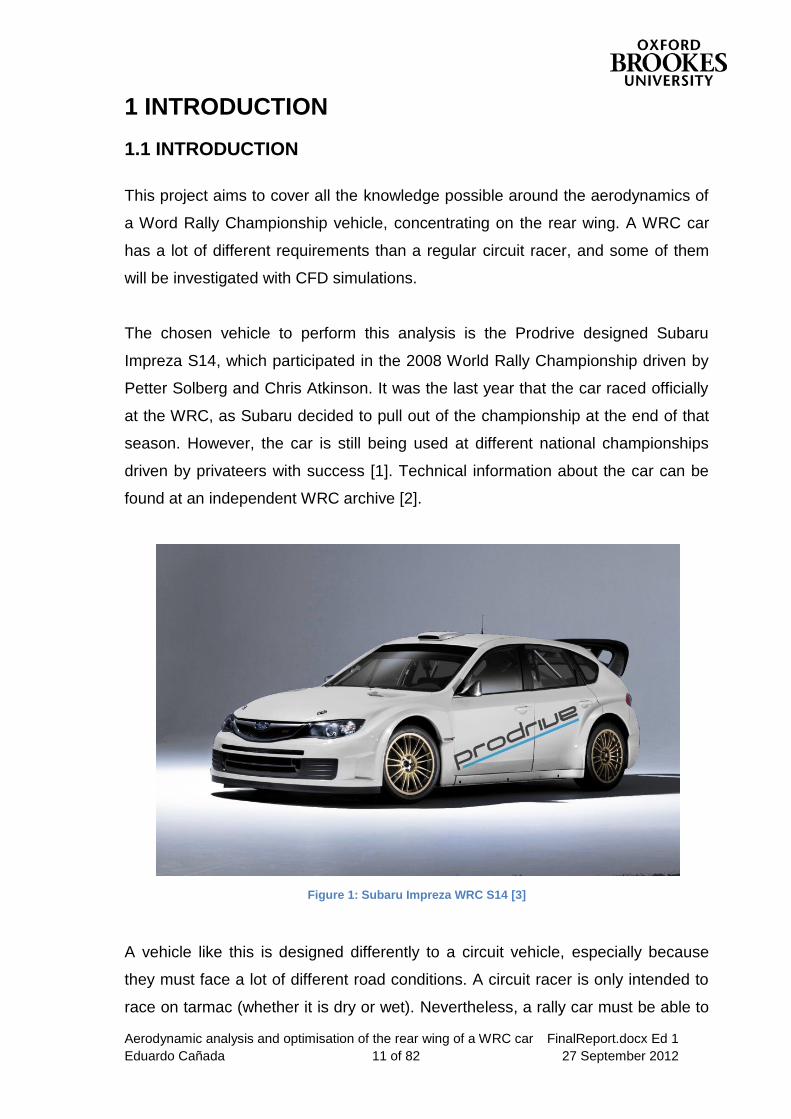
The chosen vehicle to perform this analysis is the Prodrive designed Subaru
Impreza S14, which participated in the 2008 World Rally Championship driven by
Petter Solberg and Chris Atkinson. It was the last year that the car raced officially
at the WRC, as Subaru decided to pull out of the championship at the end of that
season. However, the car is still being used at different national championships
driven by privateers with success [1]. Technical information about the car can be
found at an independent WRC archive [2].
Figure 1: Subaru Impreza WRC S14 [3]
A vehicle like this is designed differently to a circuit vehicle, especially because
they must face a lot of different road conditions. A circuit racer is only intended to
race on tarmac (whether it is dry or wet). Nevertheless, a rally car must be able to
Aerodynamic analysis and optimisation of the rear wing of a WRC car FinalReport.docx Ed 1
Eduardo Cañada 12 of 82 27 September 2012
race also on loose surfaces like gravel, mud or even snow, simply by modifying a
few suspension parameters and the tires.
During a rally stage, a rally driver will try to set a faster time than his competitors.
To achieve this, driving on a loose surface requires different techniques than
driving on tarmac. A rally driver will try to maximise the performance of the car on
corners by reaching very high yaw angles, often at a very high speed.
Also, due to the fact that the rally cars race on open roads and not on circuits, they
may also have to be able to separate from the ground over a crest, to avoid
reducing speed before it.
The aerodynamics of the vehicles that race on this category must be designed
taking these special situations into account.
1.2 BACKGROUND
The World Rally Championship has had different regulations that allowed different
levels of aerodynamics during time. Sometimes they were almost unrestricted, but
sometimes they were limited by the shape of the road car.
The golden age of WRC aerodynamics started during the Group B era (1982 –
1986). Until then, rally cars were limited by the shape of the road car they were
based on. However, with the introduction of this category, manufacturers could
develop almost freely their cars, including engine power and aerodynamics. These
regulations fostered some of the quickest, most powerful and sophisticated rally
cars ever built, until they became too dangerous for drivers and spectators and
they were banned.
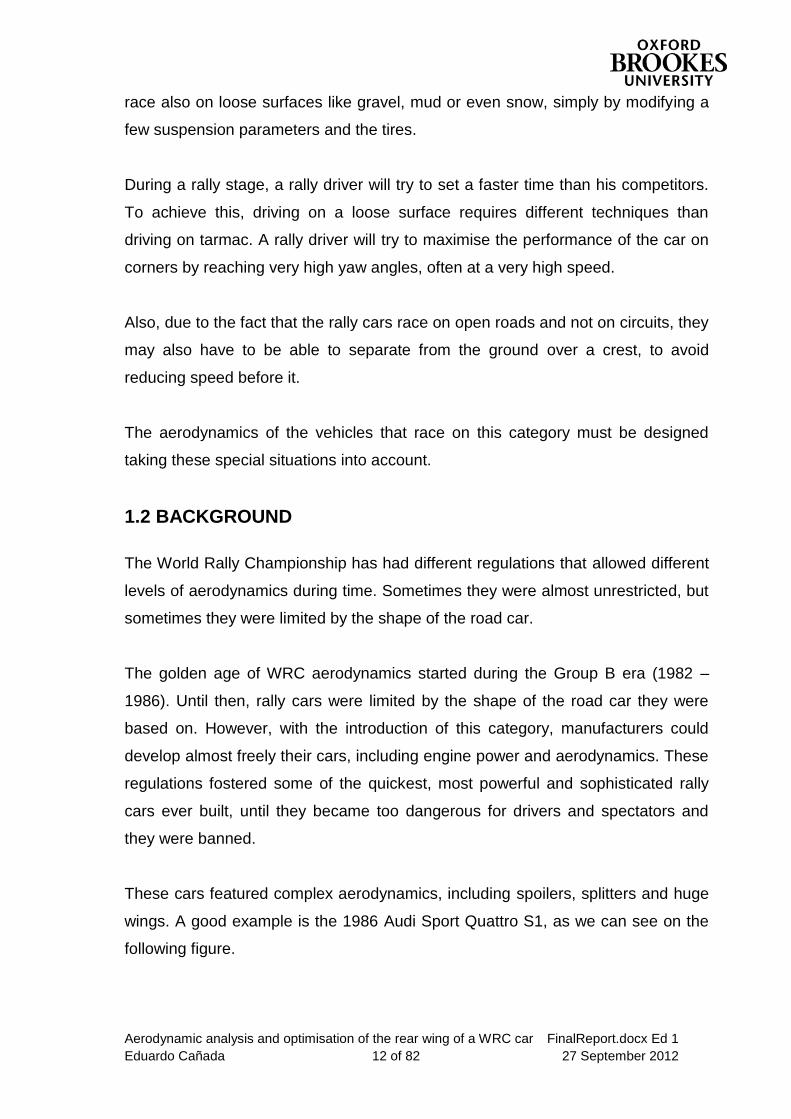
These cars featured complex aerodynamics, including spoilers, splitters and huge
wings. A good example is the 1986 Audi Sport Quattro S1, as we can see on the
following figure.
Aerodynamic analysis and optimisation of the rear wing of a WRC car FinalReport.docx Ed 1
Eduardo Cañada 13 of 82 27 September 2012
Figure 2: Audi Sport Quattro S1 [4]
After this category was banned, Group A (1987 – 1996) was created, limiting the
manufacturers again to keep their cars with the standard road car shape. In 1997,
the FIA created a new category called WRC, which allowed again aerodynamic
modifications to the cars.
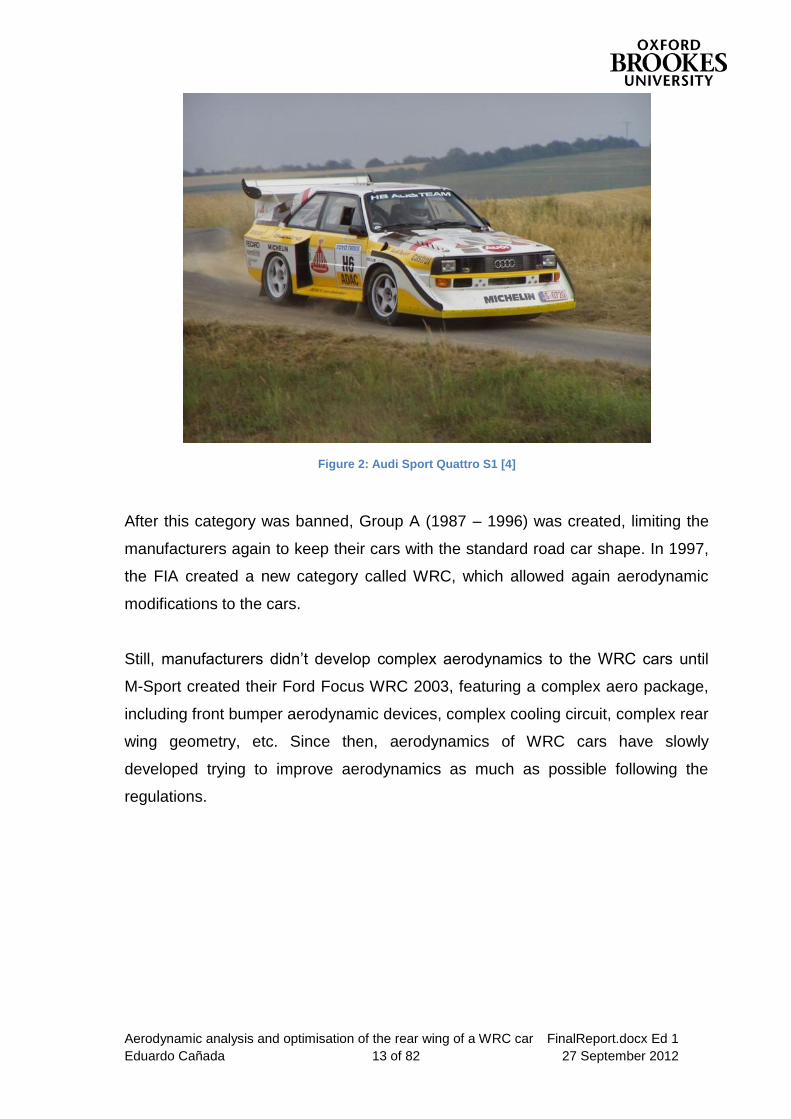
Still, manufacturers didn’t develop complex aerodynamics to the WRC cars until
M-Sport created their Ford Focus WRC 2003, featuring a complex aero package,
including front bumper aerodynamic devices, complex cooling circuit, complex rear
wing geometry, etc. Since then, aerodynamics of WRC cars have slowly
developed trying to improve aerodynamics as much as possible following the
regulations.
Aerodynamic analysis and optimisation of the rear wing of a WRC car FinalReport.docx Ed 1
Eduardo Cañada 14 of 82 27 September 2012
Figure 3: Ford Focus WRC 2003 [5]
An example of a specific aerodynamic device is the vertical fins located on the rear
wing, which are designed to keep a high level of downforce during high yaw angle
situations. Another example is the cooling outlets located on the bonnet, which
reduce drag and create downforce at the front of the car.
1.3 AIMS AND OBJECTIVES
The main aim of this project is to gather all the possible knowledge around the
aerodynamics of a Word Rally Championship vehicle, concentrating on the rear
wing, with the intention of filling the gap in the published literature about WRC
aerodynamics.
To achieve this aim, the main objectives that have been followed during the project
are as follows:
Analysis of air flow around the rear wing of a WRC car, paying attention to the
different parts that the designers added to the basic wing and their effects on
the car’s aerodynamics.
Aerodynamic analysis and optimisation of the rear wing of a WRC car FinalReport.docx Ed 1
Eduardo Cañada 15 of 82 27 September 2012
Analysis of the effects that a large ride height variation has on downforce, drag,
balance and other defining parameters. This analysis focuses on jumping
situations, where the vehicle’s wheels lose contact with the ground.
Analysis of the effects that yawed flow have on the vehicle, focusing on the
differences that vertical fins have on the vehicle responses in yawed situations.
Based on the results of the different analyses, different variations of the rear
wing geometry are proposed for improvement of the rear wing’s downforce in
straight line and yaw.
1.4 DISSERTATION STRUCTURE
This report starts with a literature review covering basic knowledge about
aerodynamics and specific theory determinant for this project, followed by a
research on specific WRC literature.
After the literature review, the methodology followed through this project is
explained, especially the methodology concerning the settings of Star-CCM+
software, which is the CFD package used to generate all the results included on
the project.
Right after the methodology is explained, the results from the different analysis are
displayed and explained in a way that anyone could understand them, even if he
or she doesn’t have extended aerodynamics knowledge. This section also
includes recommended variations that could be done on the rear wing geometry to
improve the vehicle’s performance if they were implemented.
Finally, conclusions and future work are included so this project can be extended
by anyone interested on it.
Aerodynamic analysis and optimisation of the rear wing of a WRC car FinalReport.docx Ed 1
Eduardo Cañada 16 of 82 27 September 2012
1.5 LIMITATIONS AND DEPENDENCIES
The main limitation of this project was computer power. The simulations have
been run on a laptop with a 2000 MHz CPU formed by eight cores with 8 Gb of
RAM memory. However, the license only allowed the usage of a single core.
Because of this limitation, the simulations needed at least twelve hours of
iterations before achieving reasonable levels of residuals. This limitation also
forced the meshes to be as optimised as possible, and the geometry had to be
simplified in order to reduce the cell number.
Apart from the simplifications undertaken on the geometry to reduce cell number,
other important simplifications were done to the model. The model is missing any
internal flow, so the downforce generated by the bonnet vents flow, together with
the drag generated by the cooling systems is missing are missing from the
simulations. Both simplifications can potentially change the flow over the vehicle
and the results from the simulations significantly.
Although a loss of time was caused by the first method of generating the
geometry, more than enough simulations were run to achieve the aims of the
project successfully.
Aerodynamic analysis and optimisation of the rear wing of a WRC car FinalReport.docx Ed 1
Eduardo Cañada 17 of 82 27 September 2012
2 LITERATURE REVIEW
2.1 INTRODUCTION
To provide a clear explanation of the theory applicable to this project subject, the
literature review has been split up into six different sections. These sections cover
basic aerodynamic knowledge and the effects that different parameters like ride
height and pitch cause on moving vehicles. Then, CFD simulation is covered and
specific WRC literature is reviewed.
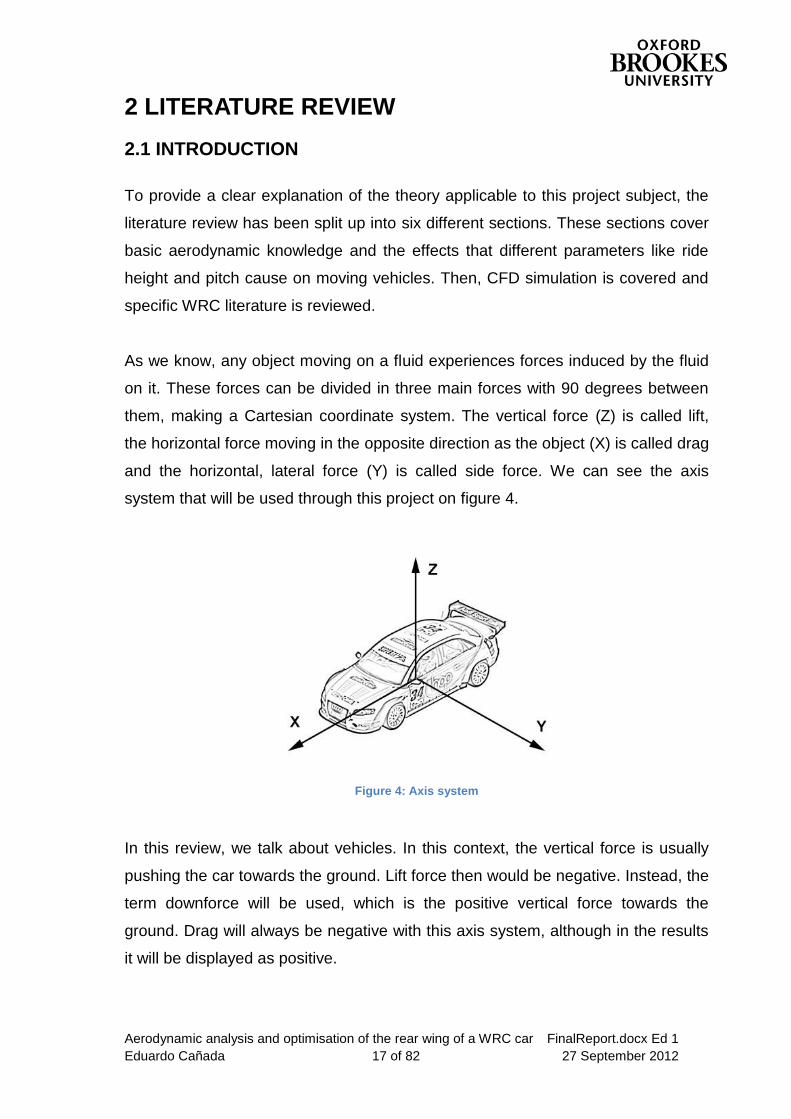
As we know, any object moving on a fluid experiences forces induced by the fluid
on it. These forces can be divided in three main forces with 90 degrees between
them, making a Cartesian coordinate system. The vertical force (Z) is called lift,
the horizontal force moving in the opposite direction as the object (X) is called drag
and the horizontal, lateral force (Y) is called side force. We can see the axis
system that will be used through this project on figure 4.
Figure 4: Axis system
In this review, we talk about vehicles. In this context, the vertical force is usually
pushing the car towards the ground. Lift force then would be negative. Instead, the
term downforce will be used, which is the positive vertical force towards the
ground. Drag will always be negative with this axis system, although in the results
it will be displayed as positive.
Aerodynamic analysis and optimisation of the rear wing of a WRC car FinalReport.docx Ed 1
Eduardo Cañada 18 of 82 27 September 2012
2.2 BASIC VEHICLE BODY CONCEPTS
The basics of the aerodynamics of a saloon car are described on multiple theory
books. Joseph Katz explains that there are three typical parameters that affect the
aerodynamic performance of any car. These are usually ride height, body’s
incidence and side-slip angle, and they depend heavily on the vehicle’s shape [6].
2.2.1 Ride Height
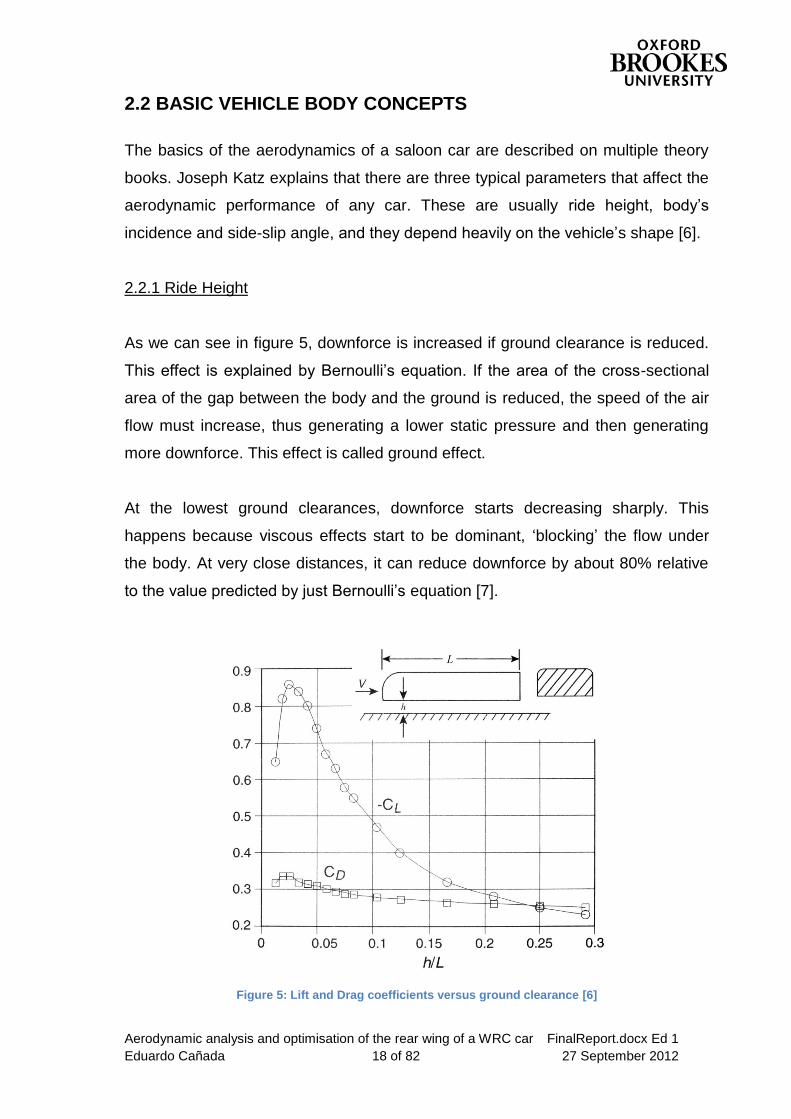
As we can see in figure 5, downforce is increased if ground clearance is reduced.
This effect is explained by Bernoulli’s equation. If the area of the cross-sectional
area of the gap between the body and the ground is reduced, the speed of the air
flow must increase, thus generating a lower static pressure and then generating
more downforce. This effect is called ground effect.
At the lowest ground clearances, downforce starts decreasing sharply. This
happens because viscous effects start to be dominant, ‘blocking’ the flow under
the body. At very close distances, it can reduce downforce by about 80% relative
to the value predicted by just Bernoulli’s equation [7].
Figure 5: Lift and Drag coefficients versus ground clearance [6]
Aerodynamic analysis and optimisation of the rear wing of a WRC car FinalReport.docx Ed 1
Eduardo Cañada 19 of 82 27 September 2012
A rally car running on a gravel setup must have a high ground clearance.
However, when it’s set for a tarmac stage it will have a much smaller ground
clearance. It’s important to optimise the vehicle for both situations, and not only to
a low ground clearance.
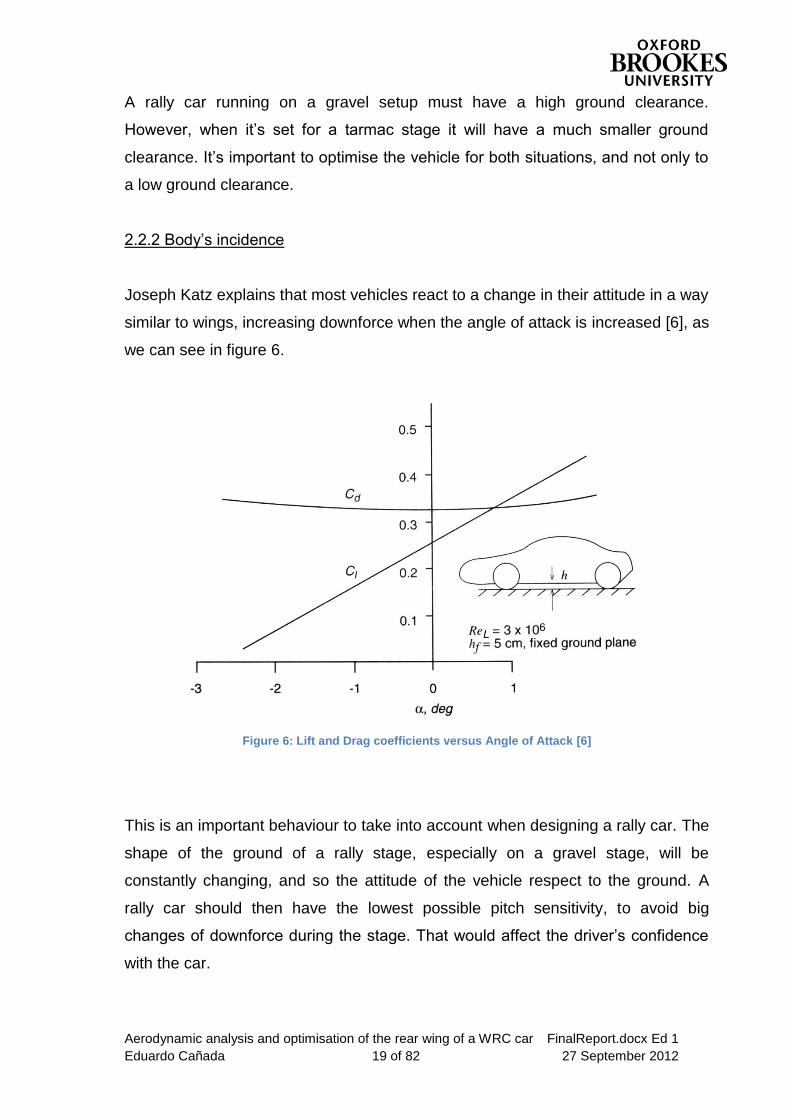
2.2.2 Body’s incidence
Joseph Katz explains that most vehicles react to a change in their attitude in a way
similar to wings, increasing downforce when the angle of attack is increased [6], as
we can see in figure 6.
Figure 6: Lift and Drag coefficients versus Angle of Attack [6]
This is an important behaviour to take into account when designing a rally car. The
shape of the ground of a rally stage, especially on a gravel stage, will be
constantly changing, and so the attitude of the vehicle respect to the ground. A
rally car should then have the lowest possible pitch sensitivity, to avoid big
changes of downforce during the stage. That would affect the driver’s confidence
with the car.
Aerodynamic analysis and optimisation of the rear wing of a WRC car FinalReport.docx Ed 1
Eduardo Cañada 20 of 82 27 September 2012
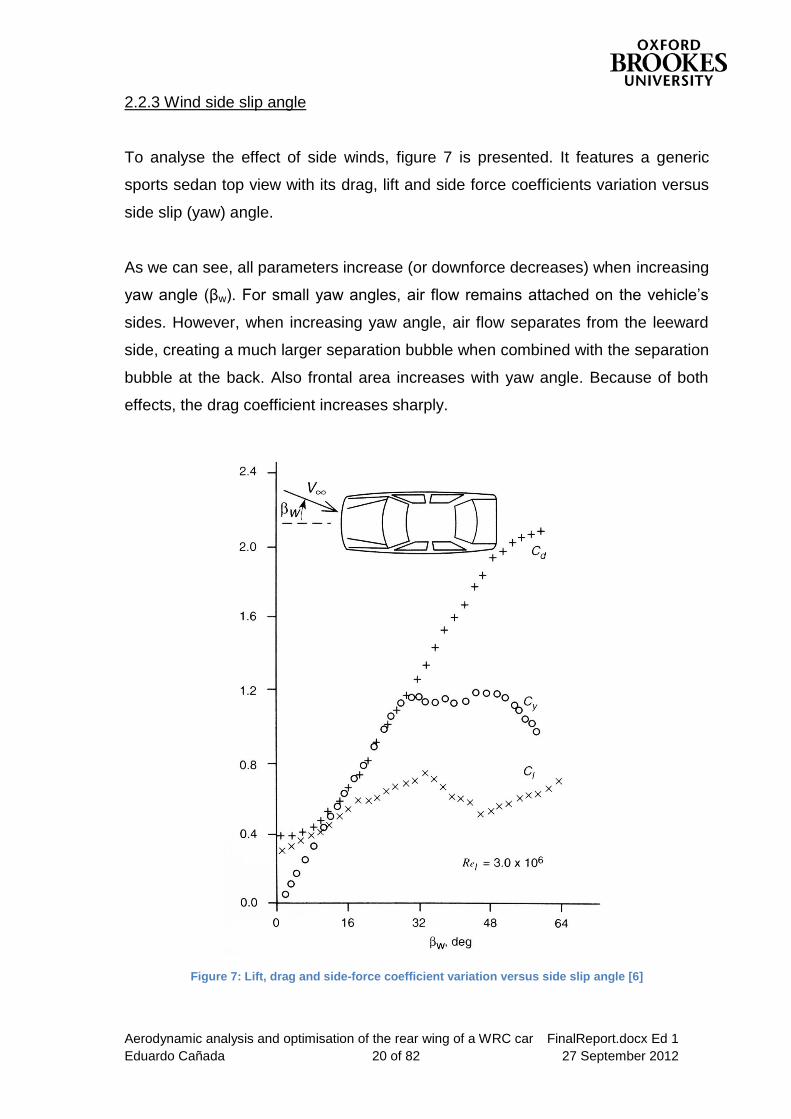
2.2.3 Wind side slip angle
To analyse the effect of side winds, figure 7 is presented. It features a generic
sports sedan top view with its drag, lift and side force coefficients variation versus
side slip (yaw) angle.
As we can see, all parameters increase (or downforce decreases) when increasing
yaw angle (βw). For small yaw angles, air flow remains attached on the vehicle’s
sides. However, when increasing yaw angle, air flow separates from the leeward
side, creating a much larger separation bubble when combined with the separation
bubble at the back. Also frontal area increases with yaw angle. Because of both
effects, the drag coefficient increases sharply.
Figure 7: Lift, drag and side-force coefficient variation versus side slip angle [6]
Aerodynamic analysis and optimisation of the rear wing of a WRC car FinalReport.docx Ed 1
Eduardo Cañada 21 of 82 27 September 2012
This is a very important analysis for a rally car, and its aerodynamics should be
optimised to minimise as much as possible the losses of downforce caused by
high yaw angle situations.
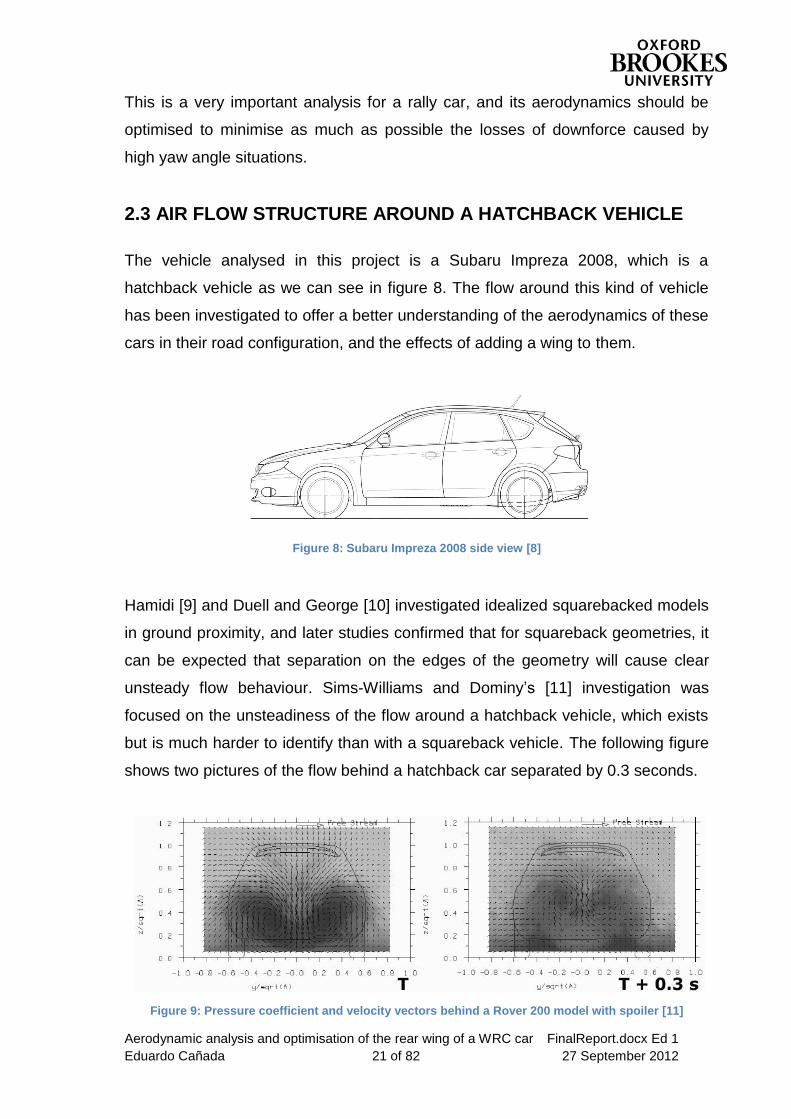
2.3 AIR FLOW STRUCTURE AROUND A HATCHBACK VEHICLE
The vehicle analysed in this project is a Subaru Impreza 2008, which is a
hatchback vehicle as we can see in figure 8. The flow around this kind of vehicle
has been investigated to offer a better understanding of the aerodynamics of these
cars in their road configuration, and the effects of adding a wing to them.
Figure 8: Subaru Impreza 2008 side view [8]
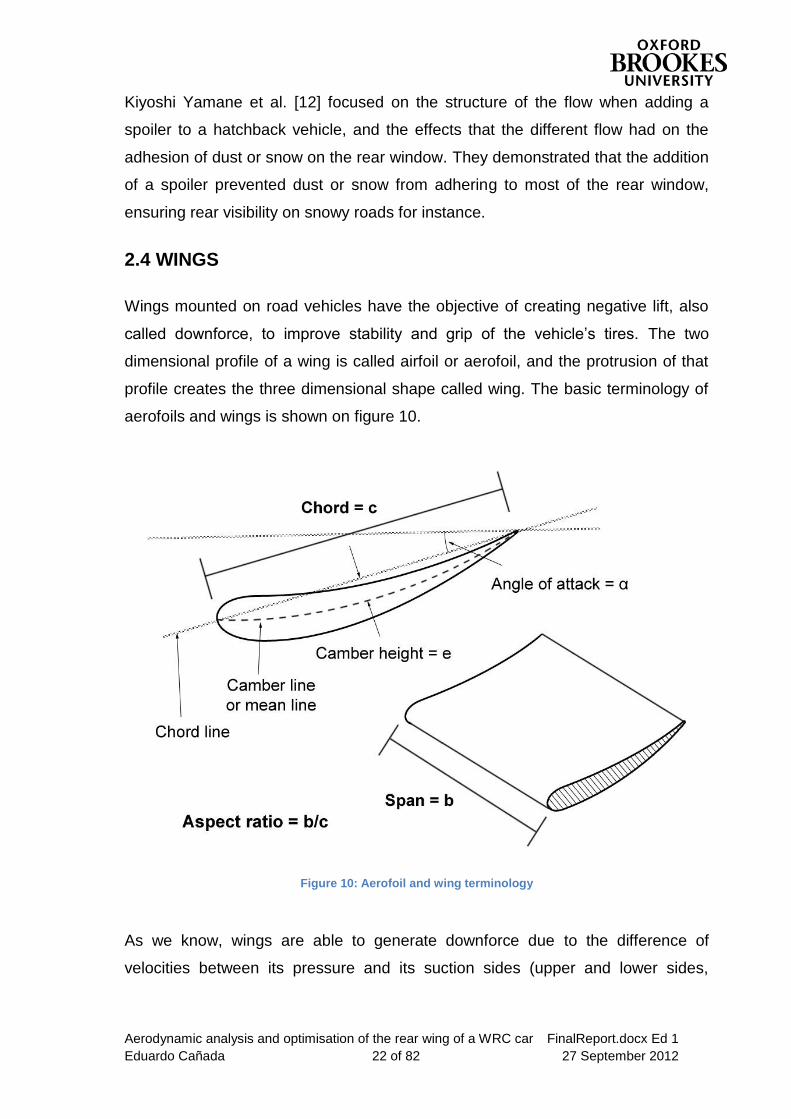
Hamidi [9] and Duell and George [10] investigated idealized squarebacked models
in ground proximity, and later studies confirmed that for squareback geometries, it
can be expected that separation on the edges of the geometry will cause clear
unsteady flow behaviour. Sims-Williams and Dominy’s [11] investigation was
focused on the unsteadiness of the flow around a hatchback vehicle, which exists
but is much harder to identify than with a squareback vehicle. The following figure
shows two pictures of the flow behind a hatchback car separated by 0.3 seconds.
Figure 9: Pressure coefficient and velocity vectors behind a Rover 200 model with spoiler [11]
Aerodynamic analysis and optimisation of the rear wing of a WRC car FinalReport.docx Ed 1
Eduardo Cañada 22 of 82 27 September 2012
Kiyoshi Yamane et al. [12] focused on the structure of the flow when adding a
spoiler to a hatchback vehicle, and the effects that the different flow had on the
adhesion of dust or snow on the rear window. They demonstrated that the addition
of a spoiler prevented dust or snow from adhering to most of the rear window,
ensuring rear visibility on snowy roads for instance.
2.4 WINGS
Wings mounted on road vehicles have the objective of creating negative lift, also
called downforce, to improve stability and grip of the vehicle’s tires. The two
dimensional profile of a wing is called airfoil or aerofoil, and the protrusion of that
profile creates the three dimensional shape called wing. The basic terminology of
aerofoils and wings is shown on figure 10.
Figure 10: Aerofoil and wing terminology
As we know, wings are able to generate downforce due to the difference of
velocities between its pressure and its suction sides (upper and lower sides,
Aerodynamic analysis and optimisation of the rear wing of a WRC car FinalReport.docx Ed 1
Eduardo Cañada 23 of 82 27 September 2012
[Equation 1]
[Equation 2]
respectively). This difference causes different pressures on the different sides,
generating downforce.
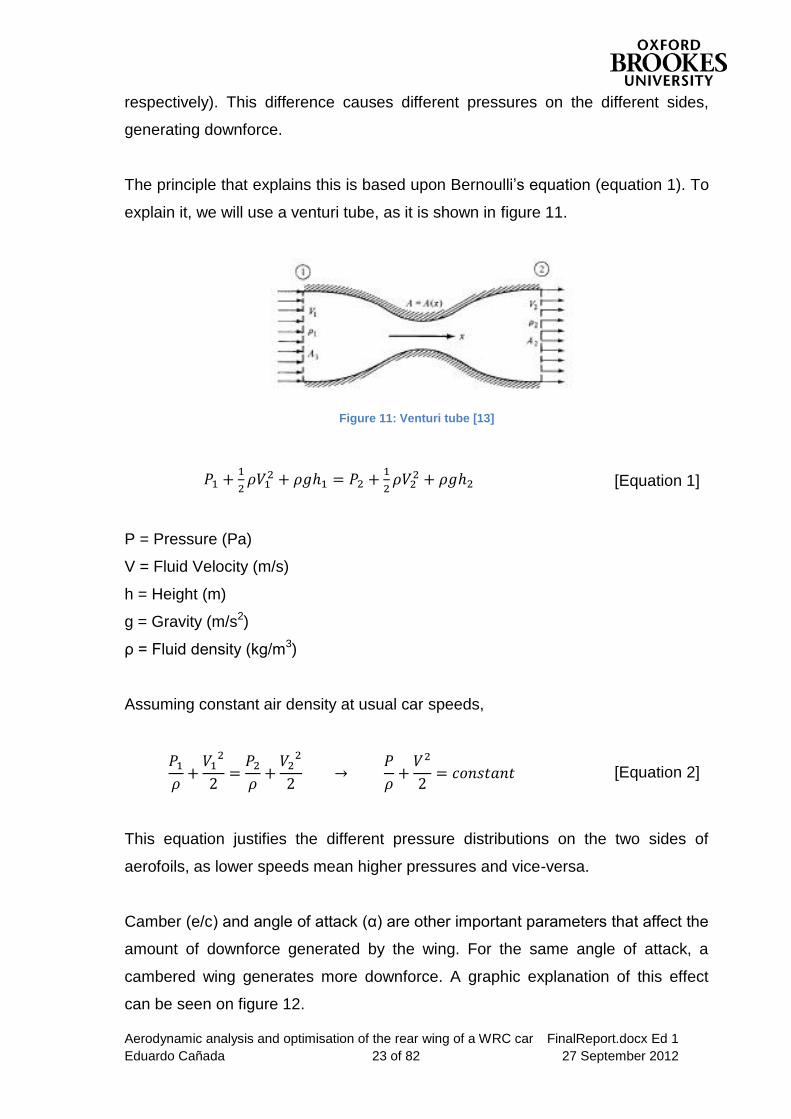
The principle that explains this is based upon Bernoulli’s equation (equation 1). To
explain it, we will use a venturi tube, as it is shown in figure 11.
Figure 11: Venturi tube [13]
P = Pressure (Pa)
V = Fluid Velocity (m/s)
h = Height (m)
g = Gravity (m/s2)
ρ = Fluid density (kg/m3)
Assuming constant air density at usual car speeds,
This equation justifies the different pressure distributions on the two sides of
aerofoils, as lower speeds mean higher pressures and vice-versa.
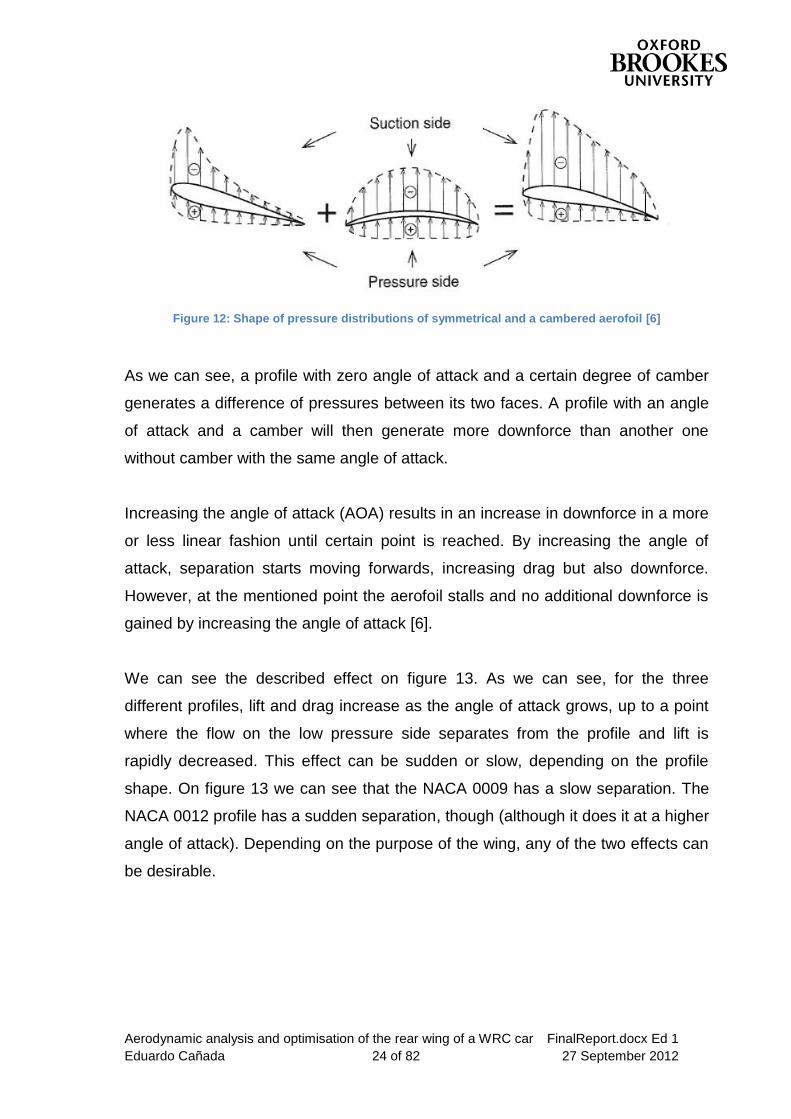
Camber (e/c) and angle of attack (α) are other important parameters that affect the
amount of downforce generated by the wing. For the same angle of attack, a
cambered wing generates more downforce. A graphic explanation of this effect
can be seen on figure 12.
Aerodynamic analysis and optimisation of the rear wing of a WRC car FinalReport.docx Ed 1
Eduardo Cañada 24 of 82 27 September 2012
Figure 12: Shape of pressure distributions of symmetrical and a cambered aerofoil [6]
As we can see, a profile with zero angle of attack and a certain degree of camber
generates a difference of pressures between its two faces. A profile with an angle
of attack and a camber will then generate more downforce than another one
without camber with the same angle of attack.
Increasing the angle of attack (AOA) results in an increase in downforce in a more
or less linear fashion until certain point is reached. By increasing the angle of
attack, separation starts moving forwards, increasing drag but also downforce.
However, at the mentioned point the aerofoil stalls and no additional downforce is
gained by increasing the angle of attack [6].
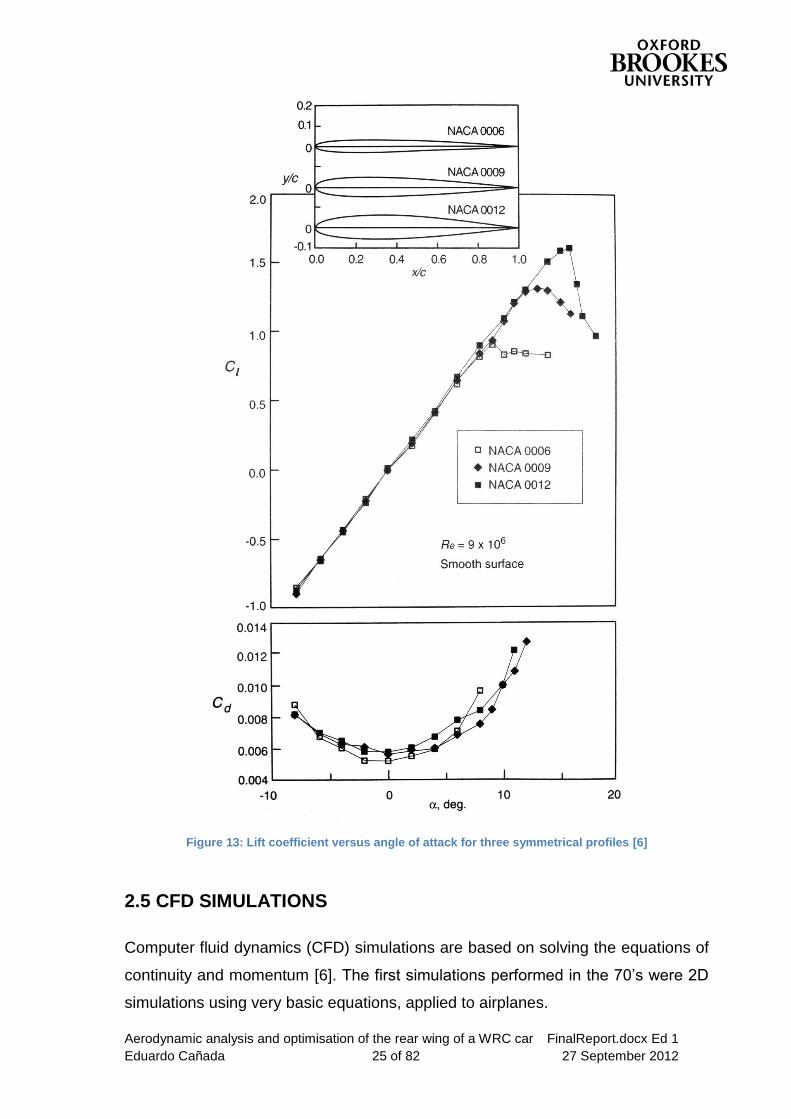
We can see the described effect on figure 13. As we can see, for the three
different profiles, lift and drag increase as the angle of attack grows, up to a point
where the flow on the low pressure side separates from the profile and lift is
rapidly decreased. This effect can be sudden or slow, depending on the profile
shape. On figure 13 we can see that the NACA 0009 has a slow separation. The
NACA 0012 profile has a sudden separation, though (although it does it at a higher
angle of attack). Depending on the purpose of the wing, any of the two effects can
be desirable.
Aerodynamic analysis and optimisation of the rear wing of a WRC car FinalReport.docx Ed 1
Eduardo Cañada 25 of 82 27 September 2012
Figure 13: Lift coefficient versus angle of attack for three symmetrical profiles [6]
2.5 CFD SIMULATIONS
Computer fluid dynamics (CFD) simulations are based on solving the equations of
continuity and momentum [6]. The first simulations performed in the 70’s were 2D
simulations using very basic equations, applied to airplanes.
Aerodynamic analysis and optimisation of the rear wing of a WRC car FinalReport.docx Ed 1
Eduardo Cañada 26 of 82 27 September 2012
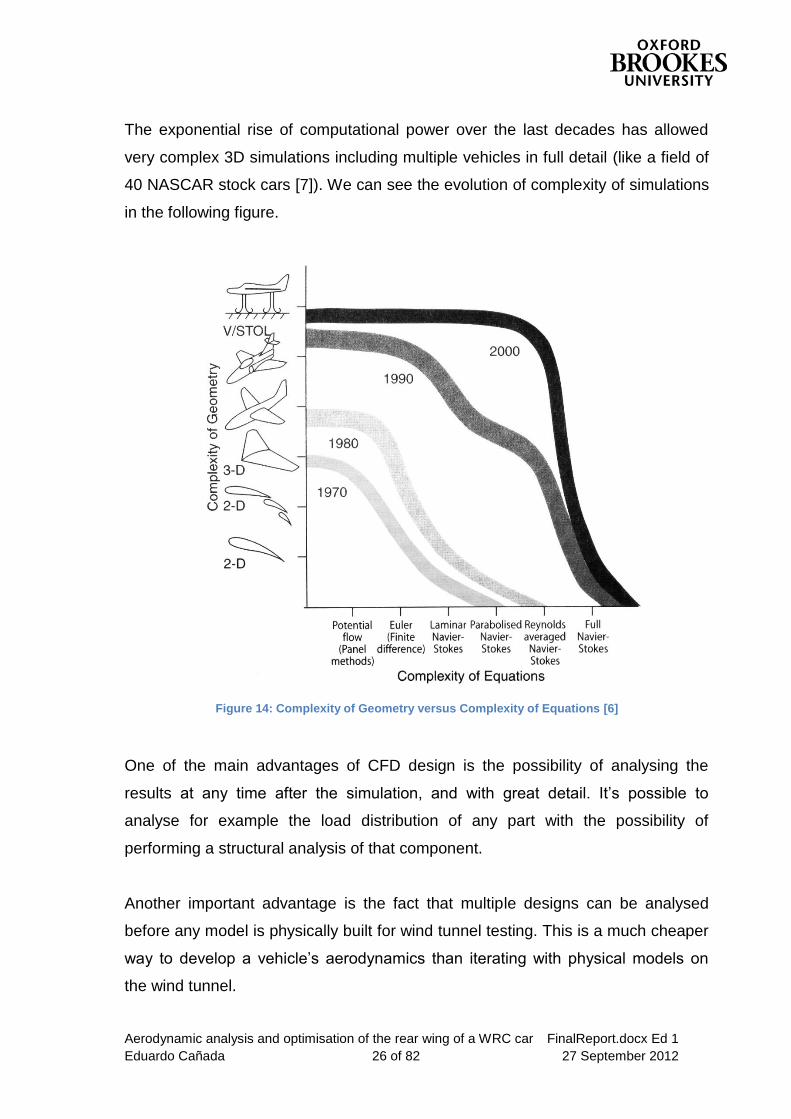
The exponential rise of computational power over the last decades has allowed
very complex 3D simulations including multiple vehicles in full detail (like a field of
40 NASCAR stock cars [7]). We can see the evolution of complexity of simulations
in the following figure.
Figure 14: Complexity of Geometry versus Complexity of Equations [6]
One of the main advantages of CFD design is the possibility of analysing the
results at any time after the simulation, and with great detail. It’s possible to
analyse for example the load distribution of any part with the possibility of
performing a structural analysis of that component.
Another important advantage is the fact that multiple designs can be analysed
before any model is physically built for wind tunnel testing. This is a much cheaper
way to develop a vehicle’s aerodynamics than iterating with physical models on
the wind tunnel.
Aerodynamic analysis and optimisation of the rear wing of a WRC car FinalReport.docx Ed 1
Eduardo Cañada 27 of 82 27 September 2012
A CFD simulation is capable of solving the mentioned simulations by dividing the
fluid volume in a finite number of blocks (with different possible shapes) called
cells. To obtain a finite number of cells, a finite volume around the test object has
to be created, making it big enough so the blockage effect1 is minimised. The
accuracy of the calculations depends on the size and structure of the cells. As an
example of the different cell shapes that can be used, CD Adapco’s Star-CCM+
offers the following possibilities [14]:
Tetrahedral: tetrahedral cell shape based core mesh.
Polyhedral: arbitrary polyhedral cell shape based core mesh.
Trimmed: trimmed hexahedral cell shape based core mesh.
Thin mesh: tetrahedral or polyhedral based prismatic thin mesh.
The calculation process consists in the iterative communication of information
between the cells in the mesh. Through the different iterations, the software tries
to find the balance of forces and mass flows in every cell until the errors (also
called residuals) are low enough, and a solution is achieved.
2.6 BLOCKAGE EFFECT
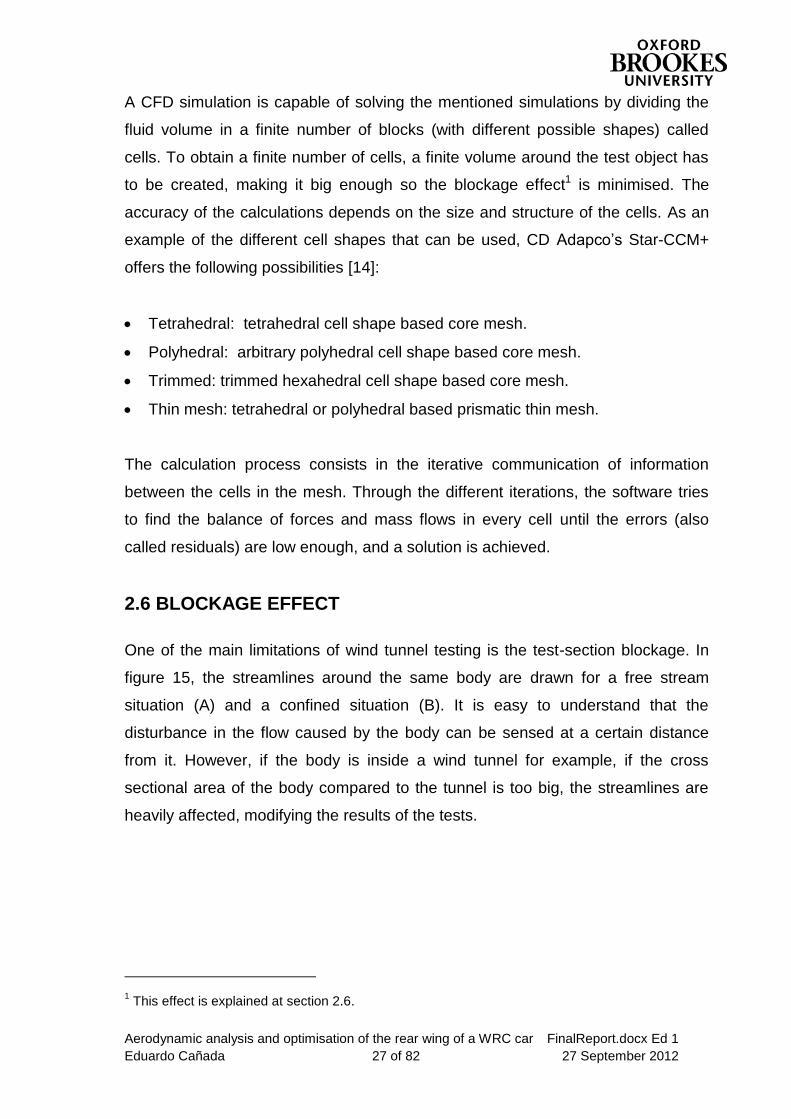
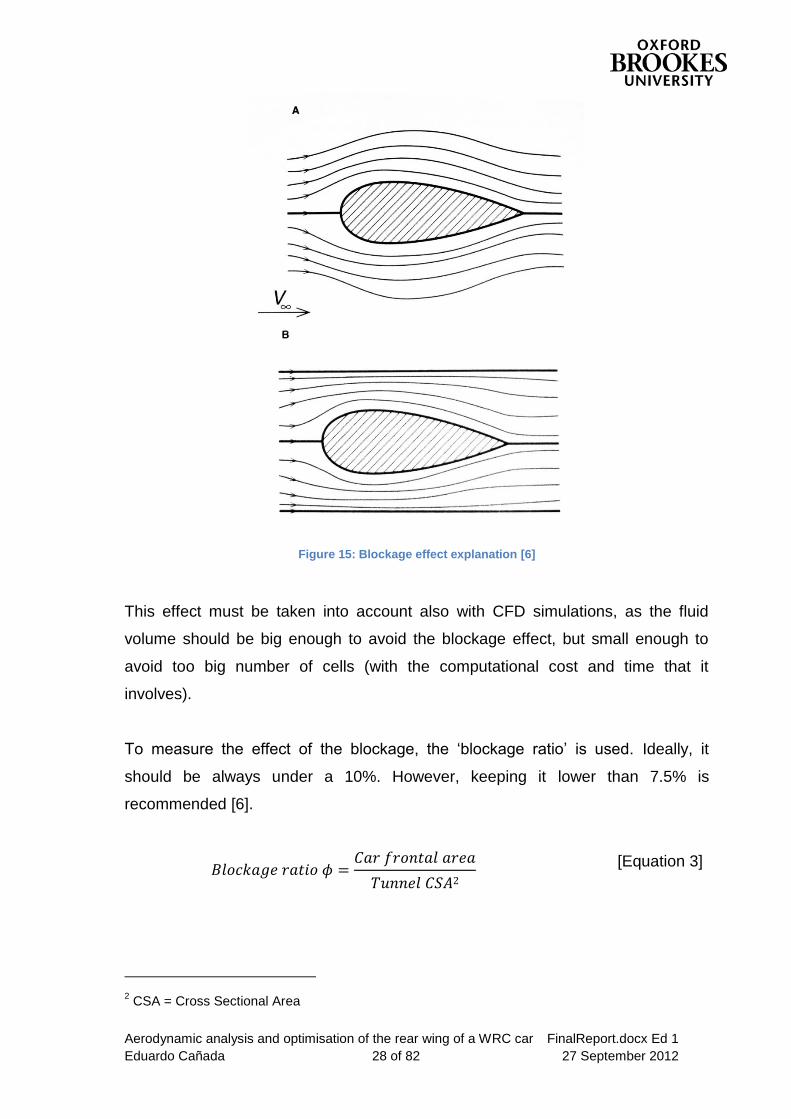
One of the main limitations of wind tunnel testing is the test-section blockage. In
figure 15, the streamlines around the same body are drawn for a free stream
situation (A) and a confined situation (B). It is easy to understand that the
disturbance in the flow caused by the body can be sensed at a certain distance
from it. However, if the body is inside a wind tunnel for example, if the cross
sectional area of the body compared to the tunnel is too big, the streamlines are
heavily affected, modifying the results of the tests.
1 This effect is explained at section 2.6.
Aerodynamic analysis and optimisation of the rear wing of a WRC car FinalReport.docx Ed 1
Eduardo Cañada 28 of 82 27 September 2012
[Equation 3]
Figure 15: Blockage effect explanation [6]
This effect must be taken into account also with CFD simulations, as the fluid
volume should be big enough to avoid the blockage effect, but small enough to
avoid too big number of cells (with the computational cost and time that it
involves).
To measure the effect of the blockage, the ‘blockage ratio’ is used. Ideally, it
should be always under a 10%. However, keeping it lower than 7.5% is
recommended [6].
2
2 CSA = Cross Sectional Area
Aerodynamic analysis and optimisation of the rear wing of a WRC car FinalReport.docx Ed 1
Eduardo Cañada 29 of 82 27 September 2012
2.7 WRC CAR AERODYNAMICS
There is not a lot of public information available about rally car aerodynamics.
Several sources from different sources are presented in this section.
The first of the sources is a specialised magazine. Race Tech Magazine covered
in April 2011 the design of the new Mini WRC [15]. They briefly explain the
aerodynamic package of the car, mentioning the importance of the consistency of
aerodynamic response across a wide range of yaw and pitch angles. They also
mention that the aerodynamic package must be robust enough to resist the
extreme off track situations that a WRC car must face during a rally.
The official page of the World Rally Championship tried to explain in an easy way
the overall aerodynamics of a WRC car [16]. This article outlines the most
important characteristics of the aerodynamics, taking into account the limitations
determined by the FIA. Quoting:
In rallying we use it for three things; Cooling, reducing drag and creating
downforce.
The two places we want downforce is at the front and rear. At the front we achieve
a bit of downforce by managing the airflow around the cooling package, through
the bonnet and back out. But also we have some features on the front bumper
which make it wider and generate some downward force. The trick is to have as
much as possible without generating drag. That's the difficult thing.
At the rear of the car we have obviously the wing. The size is defined by
regulations, and so is its position, but after that we do a lot of testing in a wind
tunnel to try to have the most efficient shape; generating as much downforce and
as little drag as possible.
The article also mentions the importance of the aerodynamics during high slip
angle situations, and the way that the internal aerodynamics (cooling system) is
designed.
Aerodynamic analysis and optimisation of the rear wing of a WRC car FinalReport.docx Ed 1
Eduardo Cañada 30 of 82 27 September 2012
The third source is another specialised magazine article. Simon McBeath explains
in his article called ‘Yaw changes things’ [17] the effects of a yawed flow on a
champ car using CFD simulations. He finds out that at 4 degrees of yaw, the
downforce of the vehicle is decreased a 5% and the drag a 3%.
McBeath also talks about yaw in his book ‘Competition Car Aerodynamics’ [7]. He
also produced CFD simulations to investigate the effect of yaw on a LMP1
prototype car. Interestingly, he finds out that the car increased its downforce with
yaw up to between 4 and 6 degrees of yaw angle, decreasing from there. He also
discovered that the aerodynamic balance shifts forward as soon as yaw is applied.
At 10 degrees of yaw the aerodynamic balance has shifted from 40% to 45%.
Another source is a SAE paper which covers the effects of end plates on
downforce in yaw [18]. Gogel and Sakurai use CFD simulations and wind tunnel
testing to learn about the effect that different end plates have on the aerodynamics
of a Toyota Atlantic series car. They conclude that the end plates can be optimised
to reduce the losses of downforce in yaw, especially by reducing the ‘shadow’ that
the end plates produce on the wing.
There is another SAE paper covering WRC car aerodynamics, focusing on the
characteristics of a high slip angle situation [19]. This paper covers a possible
solution to perform this kind of experiment on a wind tunnel including a moving
ground.
The difficult part of this experiment is that for a regular yawed situation experiment,
the moving ground moves in the direction of the vehicle. Nevertheless, for a rally
car sliding, the speed of the moving ground must be the same as the speed of the
wind. This creates important issues, as large side loads are generated because of
the slip angle between the tires and the moving ground.
The paper then shows the results of wind tunnel experiments performed using this
method, which confirm an increase of drag and positive lift when increasing yaw
angle, as expected.
Aerodynamic analysis and optimisation of the rear wing of a WRC car FinalReport.docx Ed 1
Eduardo Cañada 31 of 82 27 September 2012
This paper also covers a small CFD evaluation. The paper authors first confirm
that the simulation correctly replicates the attached flow down the backlight without
the rear wing attached, and then they use the gathered data to simulate a run on a
generic rally stage.
Another SAE paper by Hideyuki Iwata covers the development of a rally car, but
there is no reference about aerodynamics [20].
Another article from the WRC webpage talks about jumps at high speeds [21].
One of the fastest Finnish drivers, Jari-Matti Latvala, explains that in order to keep
the car steady during jumps, the driver must brake before the jump starts, or the
front of the car would rise.
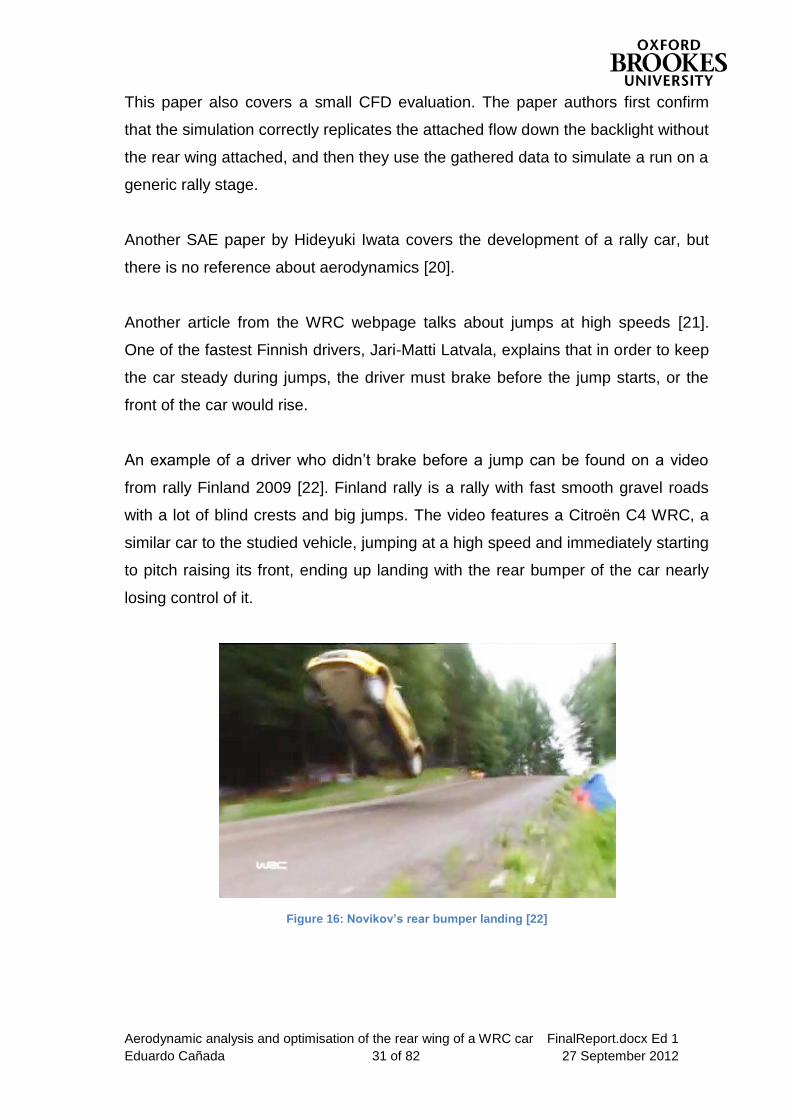
An example of a driver who didn’t brake before a jump can be found on a video
from rally Finland 2009 [22]. Finland rally is a rally with fast smooth gravel roads
with a lot of blind crests and big jumps. The video features a Citroën C4 WRC, a
similar car to the studied vehicle, jumping at a high speed and immediately starting
to pitch raising its front, ending up landing with the rear bumper of the car nearly
losing control of it.
Figure 16: Novikov’s rear bumper landing [22]
Aerodynamic analysis and optimisation of the rear wing of a WRC car FinalReport.docx Ed 1
Eduardo Cañada 32 of 82 27 September 2012
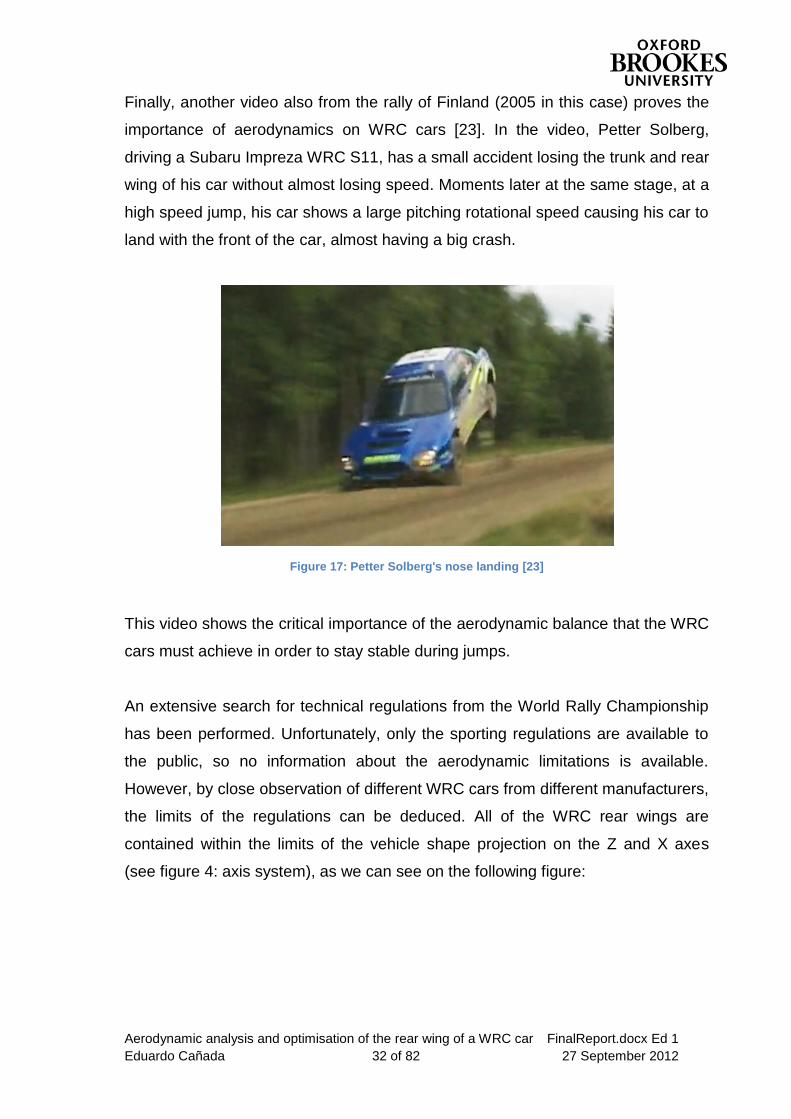
Finally, another video also from the rally of Finland (2005 in this case) proves the
importance of aerodynamics on WRC cars [23]. In the video, Petter Solberg,
driving a Subaru Impreza WRC S11, has a small accident losing the trunk and rear
wing of his car without almost losing speed. Moments later at the same stage, at a
high speed jump, his car shows a large pitching rotational speed causing his car to
land with the front of the car, almost having a big crash.
Figure 17: Petter Solberg's nose landing [23]
This video shows the critical importance of the aerodynamic balance that the WRC
cars must achieve in order to stay stable during jumps.
An extensive search for technical regulations from the World Rally Championship
has been performed. Unfortunately, only the sporting regulations are available to
the public, so no information about the aerodynamic limitations is available.
However, by close observation of different WRC cars from different manufacturers,
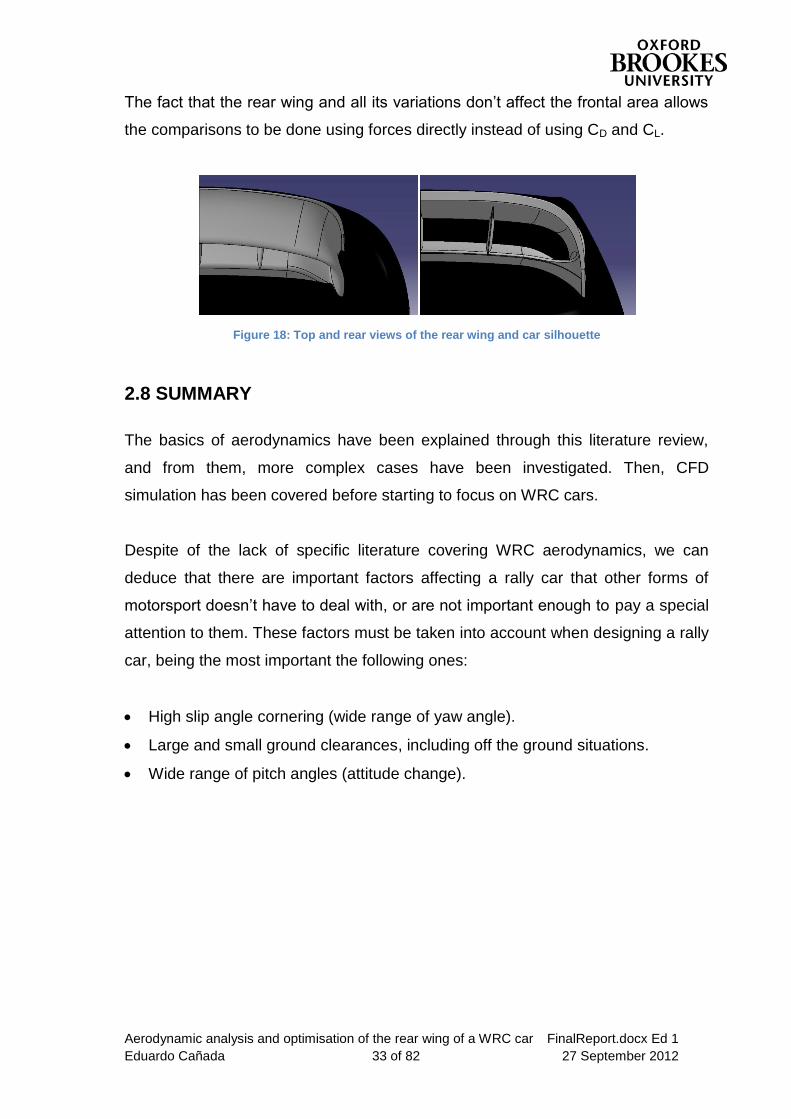
the limits of the regulations can be deduced. All of the WRC rear wings are
contained within the limits of the vehicle shape projection on the Z and X axes
(see figure 4: axis system), as we can see on the following figure:
Aerodynamic analysis and optimisation of the rear wing of a WRC car FinalReport.docx Ed 1
Eduardo Cañada 33 of 82 27 September 2012
The fact that the rear wing and all its variations don’t affect the frontal area allows
the comparisons to be done using forces directly instead of using CD and CL.
Figure 18: Top and rear views of the rear wing and car silhouette
2.8 SUMMARY
The basics of aerodynamics have been explained through this literature review,
and from them, more complex cases have been investigated. Then, CFD
simulation has been covered before starting to focus on WRC cars.
Despite of the lack of specific literature covering WRC aerodynamics, we can
deduce that there are important factors affecting a rally car that other forms of
motorsport doesn’t have to deal with, or are not important enough to pay a special
attention to them. These factors must be taken into account when designing a rally
car, being the most important the following ones:
High slip angle cornering (wide range of yaw angle).
Large and small ground clearances, including off the ground situations.
Wide range of pitch angles (attitude change).
Aerodynamic analysis and optimisation of the rear wing of a WRC car FinalReport.docx Ed 1
Eduardo Cañada 34 of 82 27 September 2012
3 EXPERIMENTAL / NUMERICAL METODOLOGY
3.1 INTRODUCTION
This project consists in the CFD simulation of a WRC vehicle in Star-CCM+. A
geometry was provided and the different steps taken to be able to introduce this
geometry in the CFD program are described in this section, followed by the
methodology and settings of the simulations.
3.2 GEOMETRY DEVELOPMENT
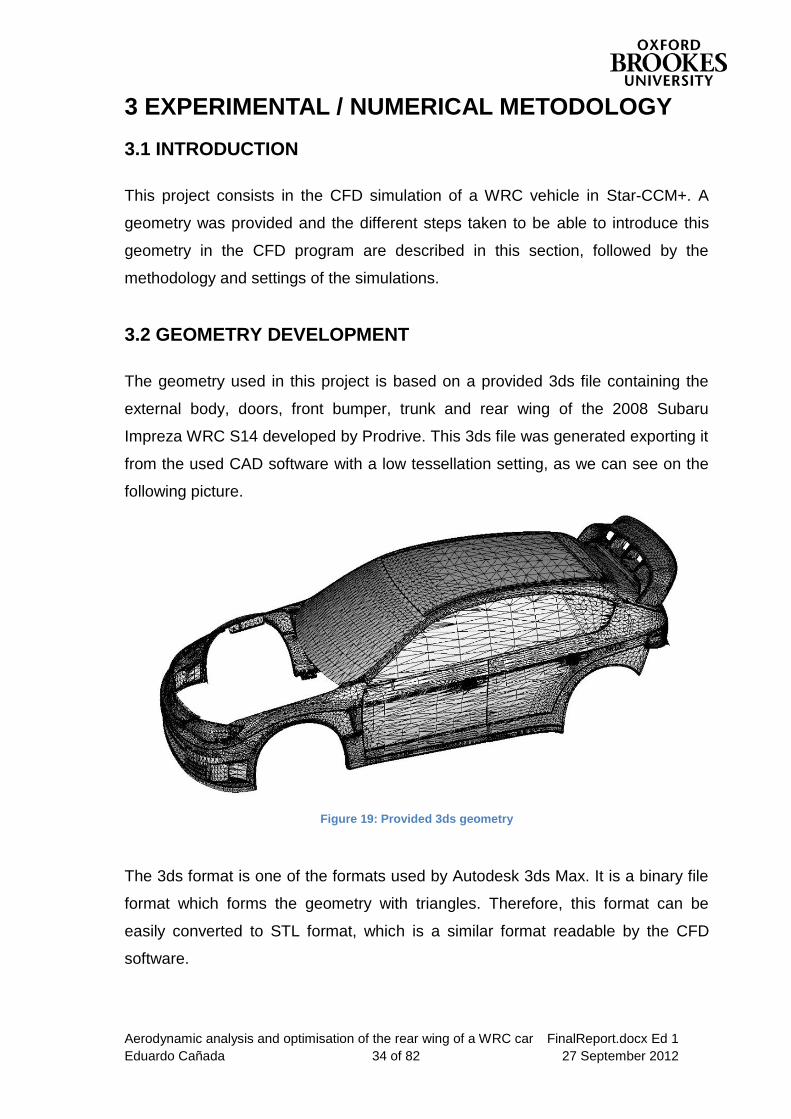
The geometry used in this project is based on a provided 3ds file containing the
external body, doors, front bumper, trunk and rear wing of the 2008 Subaru
Impreza WRC S14 developed by Prodrive. This 3ds file was generated exporting it
from the used CAD software with a low tessellation setting, as we can see on the
following picture.
Figure 19: Provided 3ds geometry
The 3ds format is one of the formats used by Autodesk 3ds Max. It is a binary file
format which forms the geometry with triangles. Therefore, this format can be
easily converted to STL format, which is a similar format readable by the CFD
software.
Aerodynamic analysis and optimisation of the rear wing of a WRC car FinalReport.docx Ed 1
Eduardo Cañada 35 of 82 27 September 2012
To be able to use this geometry to perform CFD simulations, it needed to be
completed and converted to STL to open it with Star-CCM+. The first method
taken to achieve this objective was a failure, so a second method was taken to
achieve it with success. Both methods are explained in this section.
3.2.1 Initial method
The initial method was to complete this geometry with non-CAD software and then
export it as STL. This decision was taken because it was judged to be faster to do
this than rebuilding the geometry with a CAD software, as the geometry was
provided as a 3ds file. A test of this method had previously been done with a
simpler geometry to check the validity of this method (with success). This test
simulation details can be read at appendix A.
The chosen software to complete the geometry was Autodesk 3ds Max. The main
reason to choose this program was that the author of this project already had
experience with this program, so it was faster to complete the geometry with it and
then export it as STL than rebuilding the geometry in CAD.
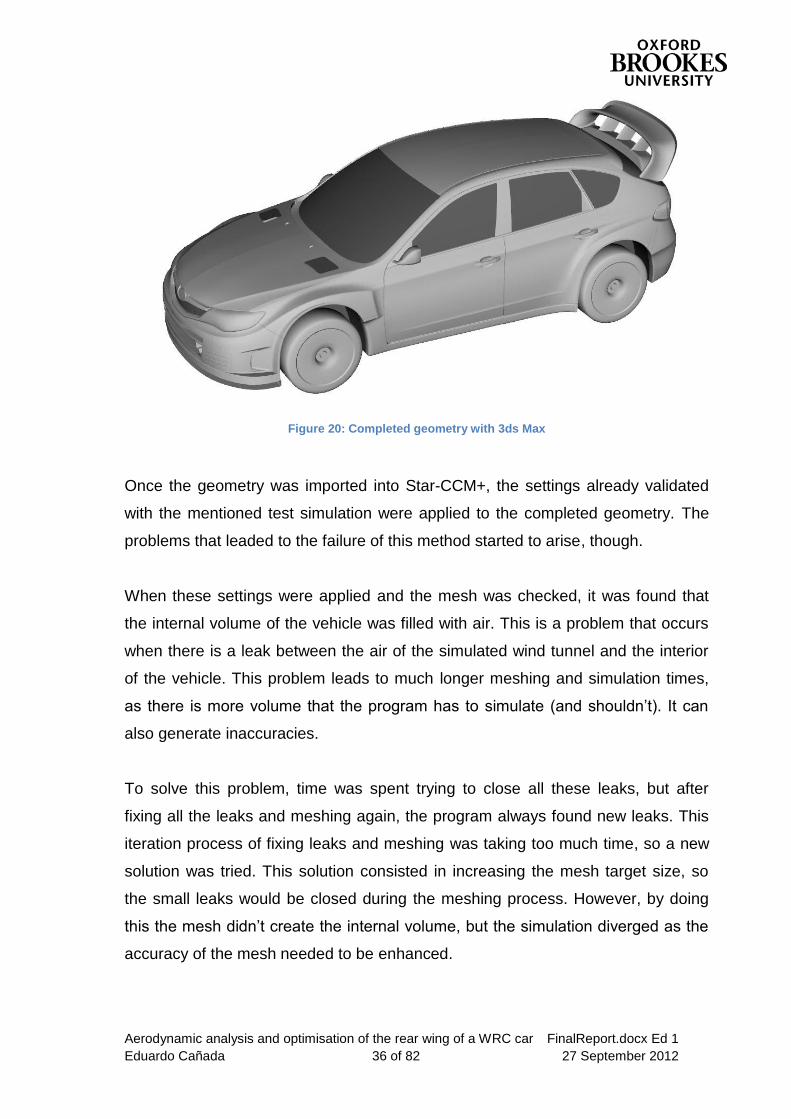
The first part of this method was completing the geometry with the chosen
program. The missing parts of the car like the underbody3, hood, rear bumper,
wheels and front splitter were created and added to the vehicle geometry. The
completed geometry with this method can be seen on figure 20. Then, this
geometry was exported as STL and imported into Star-CCM+.
3 The real car has panels fitted on its underbody to protect the chassis and mechanical parts from
hitting rocks and avoid other possible damages. These panels are smooth, so the underbody of the model has been modelled smooth to simulate this.
Aerodynamic analysis and optimisation of the rear wing of a WRC car FinalReport.docx Ed 1
Eduardo Cañada 36 of 82 27 September 2012
Figure 20: Completed geometry with 3ds Max
Once the geometry was imported into Star-CCM+, the settings already validated
with the mentioned test simulation were applied to the completed geometry. The
problems that leaded to the failure of this method started to arise, though.
When these settings were applied and the mesh was checked, it was found that
the internal volume of the vehicle was filled with air. This is a problem that occurs
when there is a leak between the air of the simulated wind tunnel and the interior
of the vehicle. This problem leads to much longer meshing and simulation times,
as there is more volume that the program has to simulate (and shouldn’t). It can
also generate inaccuracies.
To solve this problem, time was spent trying to close all these leaks, but after
fixing all the leaks and meshing again, the program always found new leaks. This
iteration process of fixing leaks and meshing was taking too much time, so a new
solution was tried. This solution consisted in increasing the mesh target size, so
the small leaks would be closed during the meshing process. However, by doing
this the mesh didn’t create the internal volume, but the simulation diverged as the
accuracy of the mesh needed to be enhanced.
Aerodynamic analysis and optimisation of the rear wing of a WRC car FinalReport.docx Ed 1
Eduardo Cañada 37 of 82 27 September 2012
3.2.2 Alternative method
After realising that the time needed to solve all the problems generated by the 3ds
Max completed geometry was much longer than expected, the decision of
rebuilding the geometry with CAD software was taken.
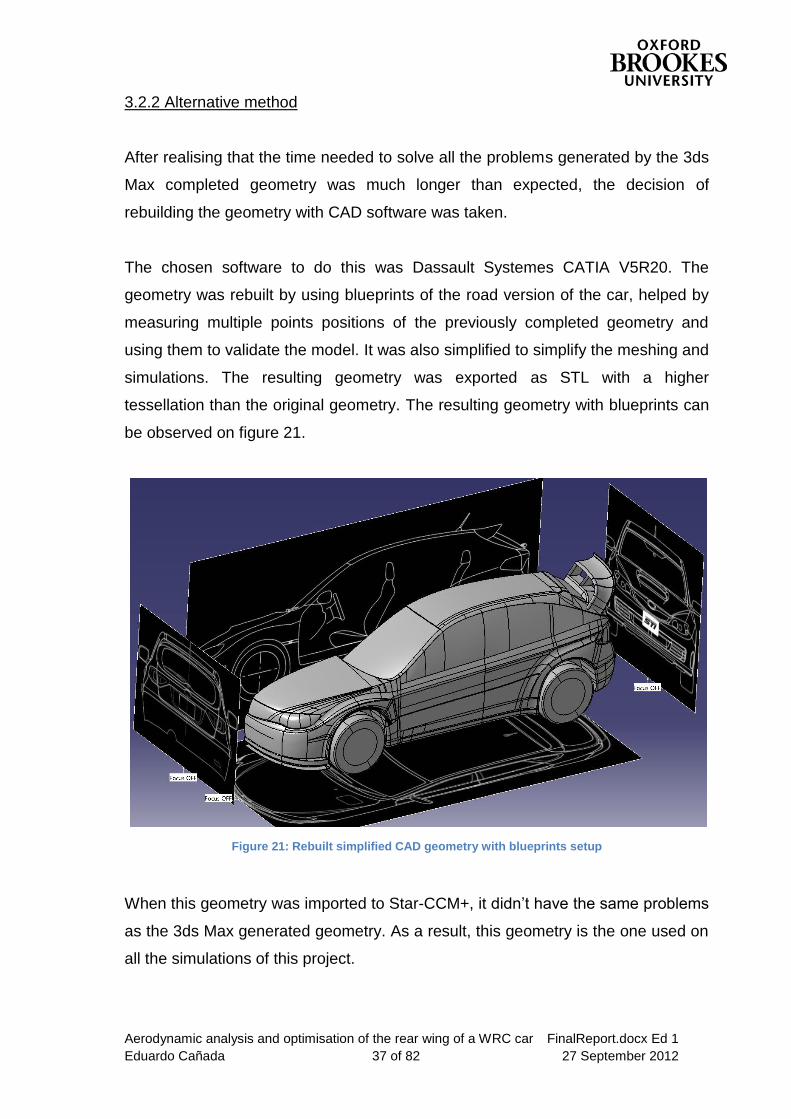
The chosen software to do this was Dassault Systemes CATIA V5R20. The
geometry was rebuilt by using blueprints of the road version of the car, helped by
measuring multiple points positions of the previously completed geometry and
using them to validate the model. It was also simplified to simplify the meshing and
simulations. The resulting geometry was exported as STL with a higher
tessellation than the original geometry. The resulting geometry with blueprints can
be observed on figure 21.
Figure 21: Rebuilt simplified CAD geometry with blueprints setup
When this geometry was imported to Star-CCM+, it didn’t have the same problems
as the 3ds Max generated geometry. As a result, this geometry is the one used on
all the simulations of this project.
Aerodynamic analysis and optimisation of the rear wing of a WRC car FinalReport.docx Ed 1
Eduardo Cañada 38 of 82 27 September 2012
3.3 CFD SIMULATIONS SETUP
The first step was importing the geometry into Star-CCM+ as different surface
meshes previously split at the CAD software for easier post processing. Then, the
flow volume was created as a block part at Star-CCM+ and its six faces were split
so they would be different region boundaries when the region was created. The
mentioned region is a flow domain surrounded by different boundaries that can
have different settings. The inlet, outlet, symmetry plane, etc are set through their
own boundary settings. After all the boundaries are correctly configured, meshing
can be done, and when it’s correctly generated, the simulation is started.
Two different types of simulations were done: A symmetric case, which only
needed half car to be simulated using a symmetry plane; and a non-symmetric
case which needed the complete car to be meshed.
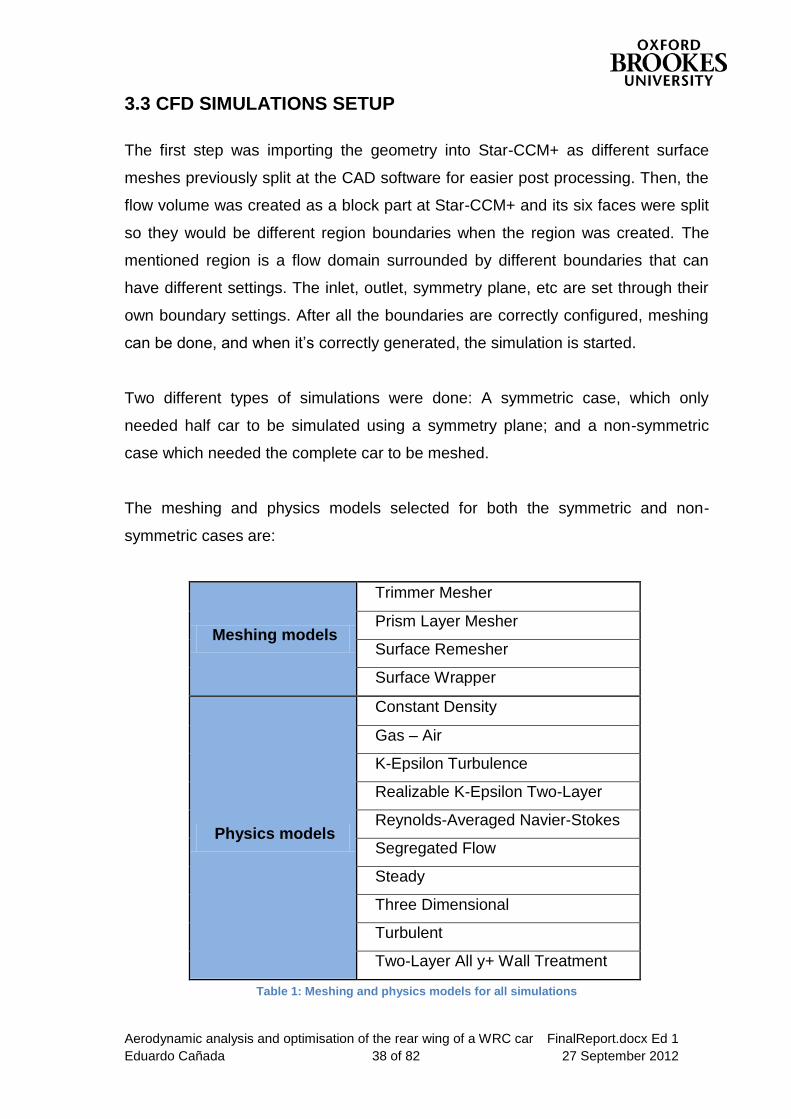
The meshing and physics models selected for both the symmetric and non-
symmetric cases are:
Meshing models
Trimmer Mesher
Prism Layer Mesher
Surface Remesher
Surface Wrapper
Physics models
Constant Density
Gas – Air
K-Epsilon Turbulence
Realizable K-Epsilon Two-Layer
Reynolds-Averaged Navier-Stokes
Segregated Flow
Steady
Three Dimensional
Turbulent
Two-Layer All y+ Wall Treatment
Table 1: Meshing and physics models for all simulations
Aerodynamic analysis and optimisation of the rear wing of a WRC car FinalReport.docx Ed 1
Eduardo Cañada 39 of 82 27 September 2012
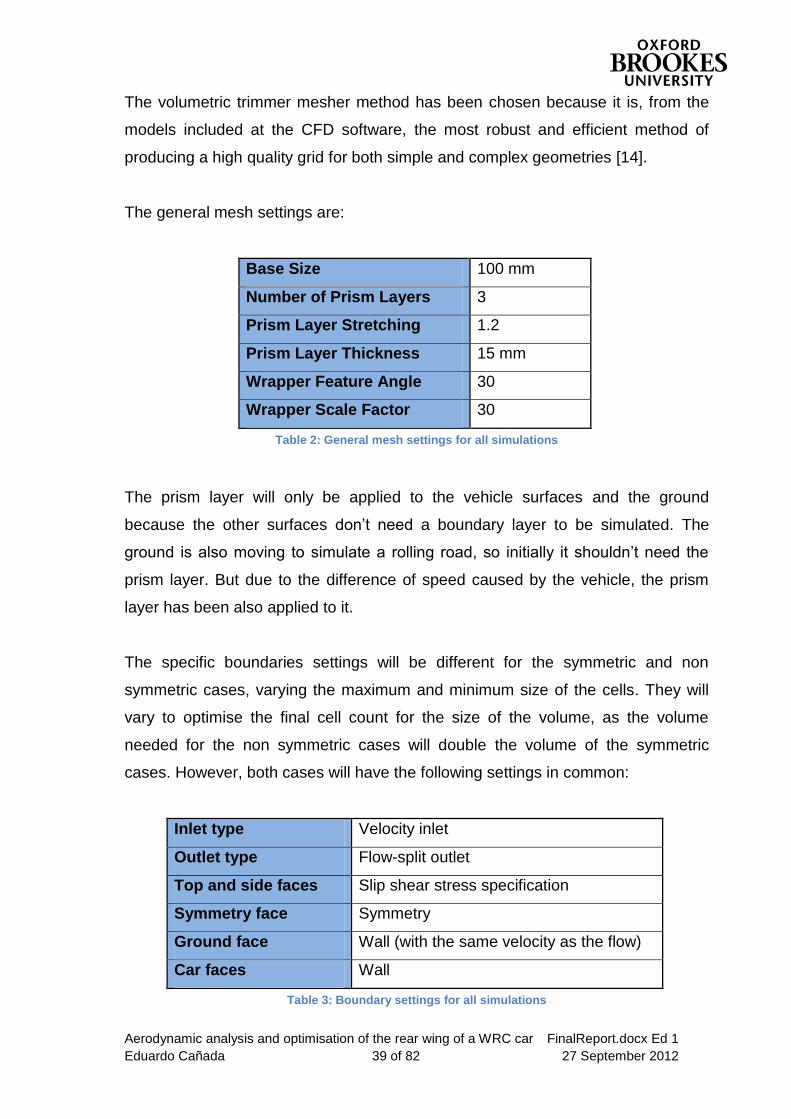
The volumetric trimmer mesher method has been chosen because it is, from the
models included at the CFD software, the most robust and efficient method of
producing a high quality grid for both simple and complex geometries [14].
The general mesh settings are:
Base Size 100 mm
Number of Prism Layers 3
Prism Layer Stretching 1.2
Prism Layer Thickness 15 mm
Wrapper Feature Angle 30
Wrapper Scale Factor 30
Table 2: General mesh settings for all simulations
The prism layer will only be applied to the vehicle surfaces and the ground
because the other surfaces don’t need a boundary layer to be simulated. The
ground is also moving to simulate a rolling road, so initially it shouldn’t need the
prism layer. But due to the difference of speed caused by the vehicle, the prism
layer has been also applied to it.
The specific boundaries settings will be different for the symmetric and non
symmetric cases, varying the maximum and minimum size of the cells. They will
vary to optimise the final cell count for the size of the volume, as the volume
needed for the non symmetric cases will double the volume of the symmetric
cases. However, both cases will have the following settings in common:
Inlet type Velocity inlet
Outlet type Flow-split outlet
Top and side faces Slip shear stress specification
Symmetry face Symmetry
Ground face Wall (with the same velocity as the flow)
Car faces Wall
Table 3: Boundary settings for all simulations
Aerodynamic analysis and optimisation of the rear wing of a WRC car FinalReport.docx Ed 1
Eduardo Cañada 40 of 82 27 September 2012
The only difference between the symmetric and non symmetric cases will be the
symmetry plane, which obviously won’t exist on the yawed cases.
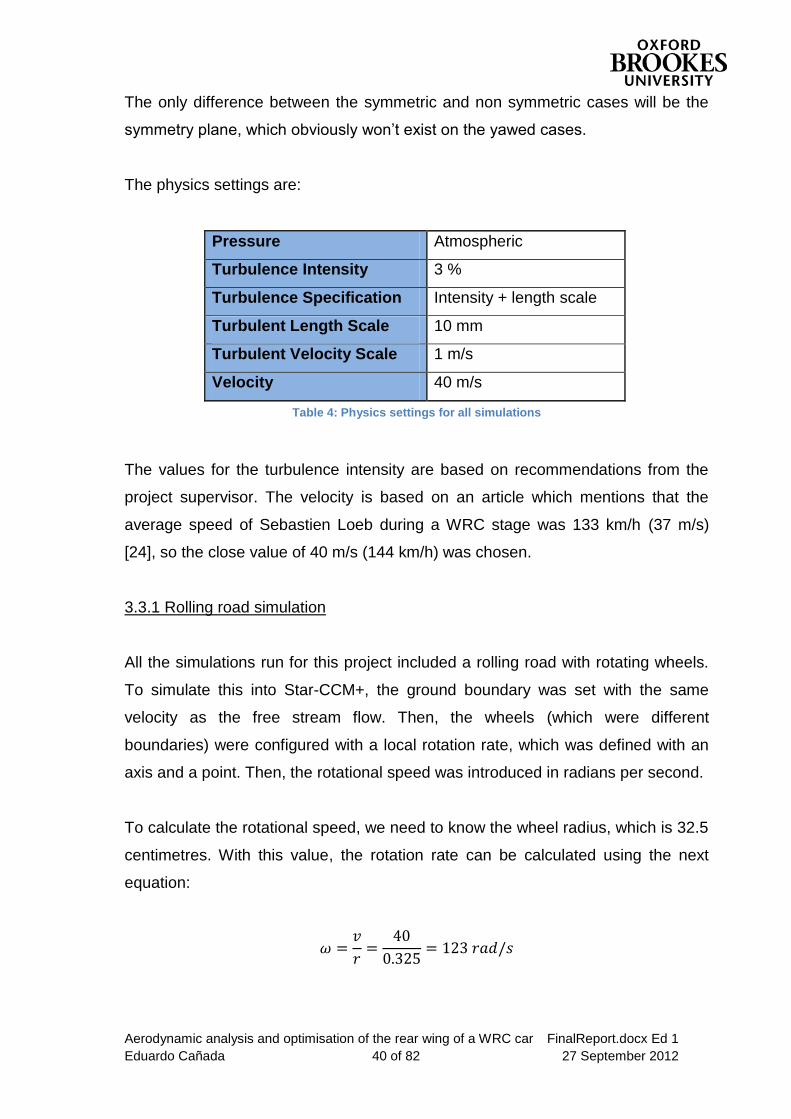
The physics settings are:
Pressure Atmospheric
Turbulence Intensity 3 %
Turbulence Specification Intensity + length scale
Turbulent Length Scale 10 mm
Turbulent Velocity Scale 1 m/s
Velocity 40 m/s
Table 4: Physics settings for all simulations
The values for the turbulence intensity are based on recommendations from the
project supervisor. The velocity is based on an article which mentions that the
average speed of Sebastien Loeb during a WRC stage was 133 km/h (37 m/s)
[24], so the close value of 40 m/s (144 km/h) was chosen.
3.3.1 Rolling road simulation
All the simulations run for this project included a rolling road with rotating wheels.
To simulate this into Star-CCM+, the ground boundary was set with the same
velocity as the free stream flow. Then, the wheels (which were different
boundaries) were configured with a local rotation rate, which was defined with an
axis and a point. Then, the rotational speed was introduced in radians per second.
To calculate the rotational speed, we need to know the wheel radius, which is 32.5
centimetres. With this value, the rotation rate can be calculated using the next
equation:
Aerodynamic analysis and optimisation of the rear wing of a WRC car FinalReport.docx Ed 1
Eduardo Cañada 41 of 82 27 September 2012
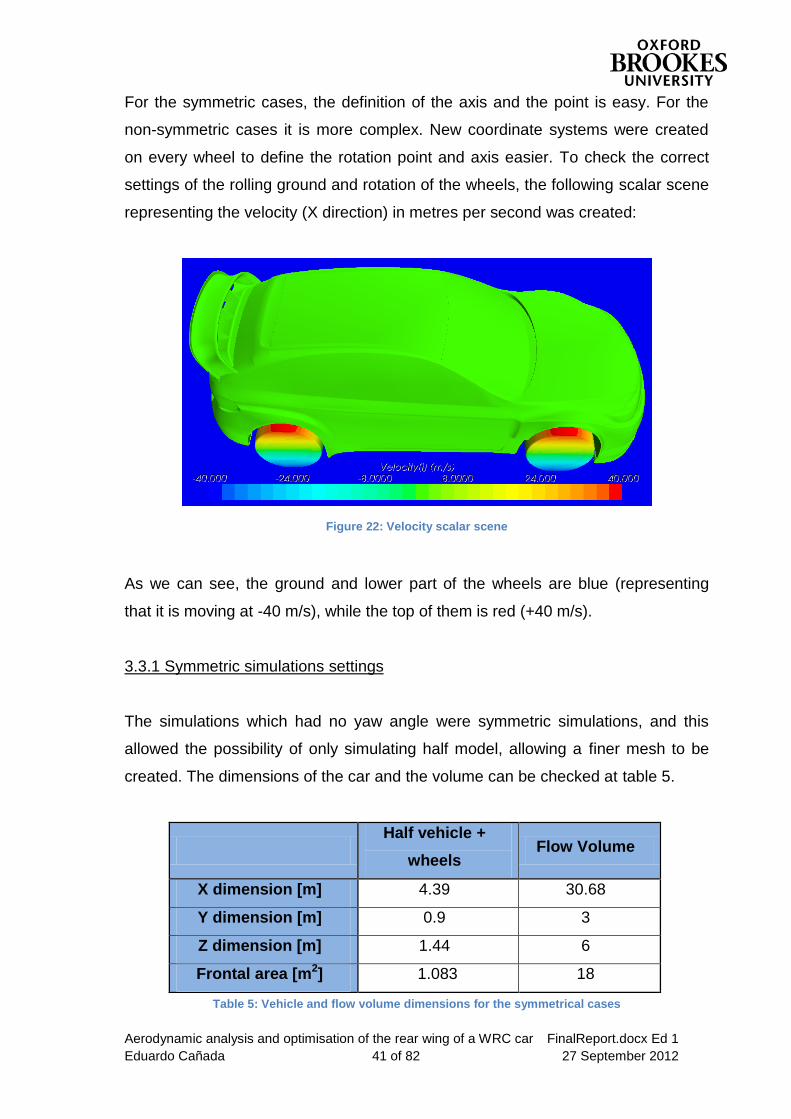
For the symmetric cases, the definition of the axis and the point is easy. For the
non-symmetric cases it is more complex. New coordinate systems were created
on every wheel to define the rotation point and axis easier. To check the correct
settings of the rolling ground and rotation of the wheels, the following scalar scene
representing the velocity (X direction) in metres per second was created:
Figure 22: Velocity scalar scene
As we can see, the ground and lower part of the wheels are blue (representing
that it is moving at -40 m/s), while the top of them is red (+40 m/s).
3.3.1 Symmetric simulations settings
The simulations which had no yaw angle were symmetric simulations, and this
allowed the possibility of only simulating half model, allowing a finer mesh to be
created. The dimensions of the car and the volume can be checked at table 5.
Half vehicle +
wheels Flow Volume
X dimension [m] 4.39 30.68
Y dimension [m] 0.9 3
Z dimension [m] 1.44 6
Frontal area [m2] 1.083 18
Table 5: Vehicle and flow volume dimensions for the symmetrical cases
Aerodynamic analysis and optimisation of the rear wing of a WRC car FinalReport.docx Ed 1
Eduardo Cañada 42 of 82 27 September 2012
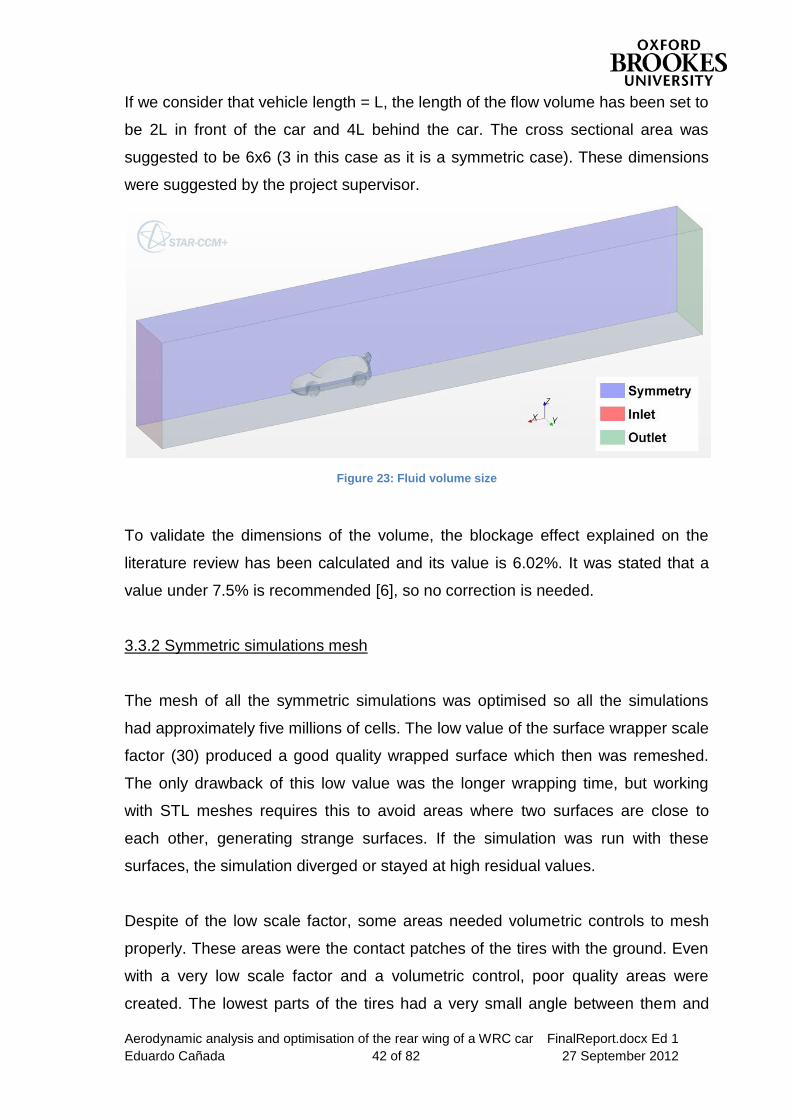
If we consider that vehicle length = L, the length of the flow volume has been set to
be 2L in front of the car and 4L behind the car. The cross sectional area was
suggested to be 6x6 (3 in this case as it is a symmetric case). These dimensions
were suggested by the project supervisor.
Figure 23: Fluid volume size
To validate the dimensions of the volume, the blockage effect explained on the
literature review has been calculated and its value is 6.02%. It was stated that a
value under 7.5% is recommended [6], so no correction is needed.
3.3.2 Symmetric simulations mesh
The mesh of all the symmetric simulations was optimised so all the simulations
had approximately five millions of cells. The low value of the surface wrapper scale
factor (30) produced a good quality wrapped surface which then was remeshed.
The only drawback of this low value was the longer wrapping time, but working
with STL meshes requires this to avoid areas where two surfaces are close to
each other, generating strange surfaces. If the simulation was run with these
surfaces, the simulation diverged or stayed at high residual values.
Despite of the low scale factor, some areas needed volumetric controls to mesh
properly. These areas were the contact patches of the tires with the ground. Even
with a very low scale factor and a volumetric control, poor quality areas were
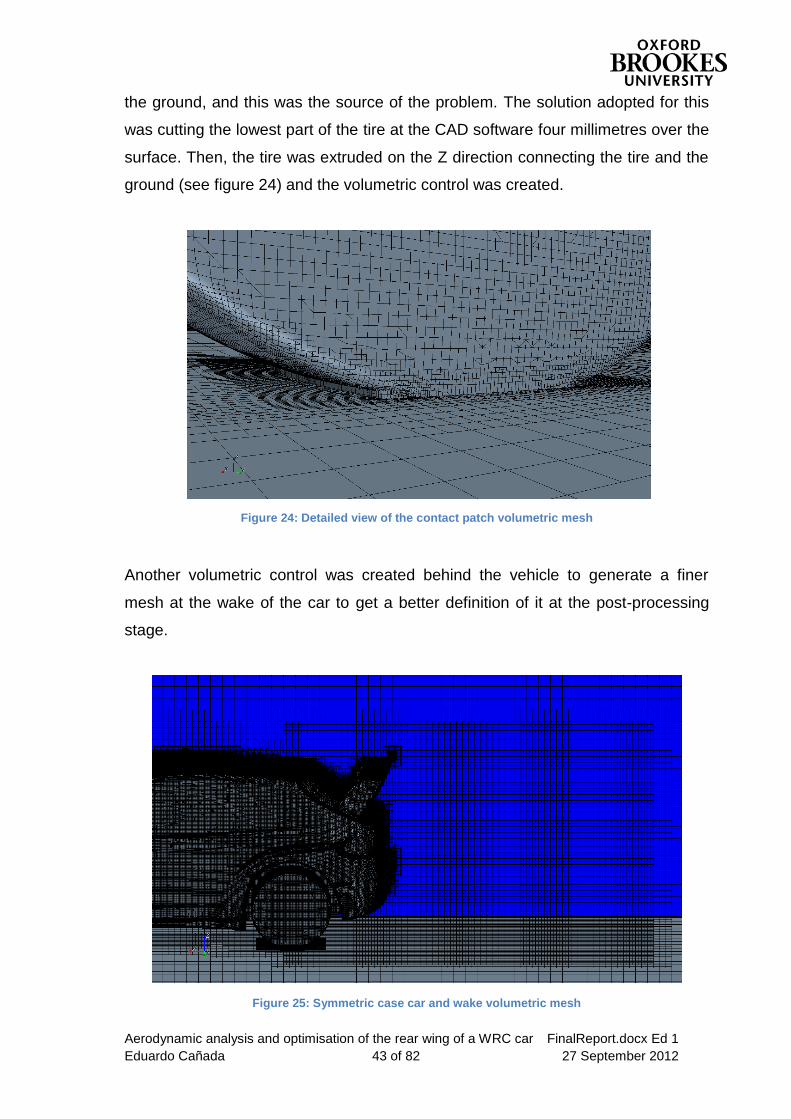
created. The lowest parts of the tires had a very small angle between them and
Aerodynamic analysis and optimisation of the rear wing of a WRC car FinalReport.docx Ed 1
Eduardo Cañada 43 of 82 27 September 2012
the ground, and this was the source of the problem. The solution adopted for this
was cutting the lowest part of the tire at the CAD software four millimetres over the
surface. Then, the tire was extruded on the Z direction connecting the tire and the
ground (see figure 24) and the volumetric control was created.
Figure 24: Detailed view of the contact patch volumetric mesh
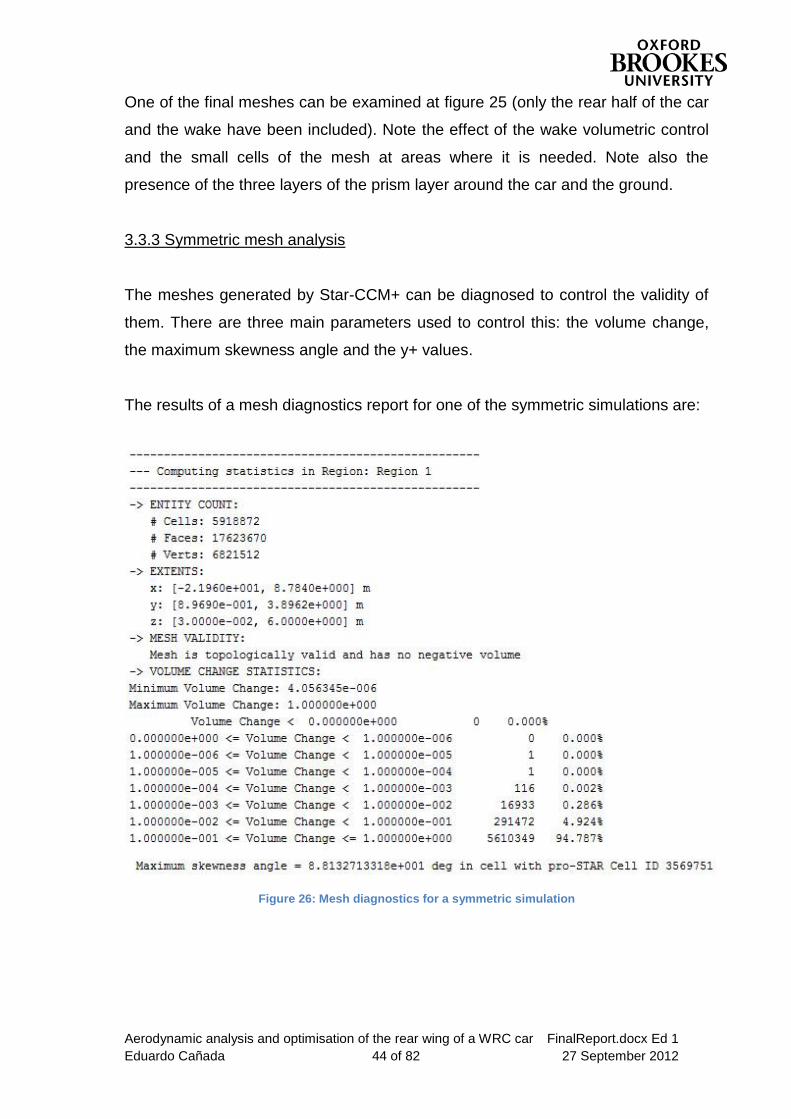
Another volumetric control was created behind the vehicle to generate a finer
mesh at the wake of the car to get a better definition of it at the post-processing
stage.
Figure 25: Symmetric case car and wake volumetric mesh
Aerodynamic analysis and optimisation of the rear wing of a WRC car FinalReport.docx Ed 1
Eduardo Cañada 44 of 82 27 September 2012
One of the final meshes can be examined at figure 25 (only the rear half of the car
and the wake have been included). Note the effect of the wake volumetric control
and the small cells of the mesh at areas where it is needed. Note also the
presence of the three layers of the prism layer around the car and the ground.
3.3.3 Symmetric mesh analysis
The meshes generated by Star-CCM+ can be diagnosed to control the validity of
them. There are three main parameters used to control this: the volume change,
the maximum skewness angle and the y+ values.
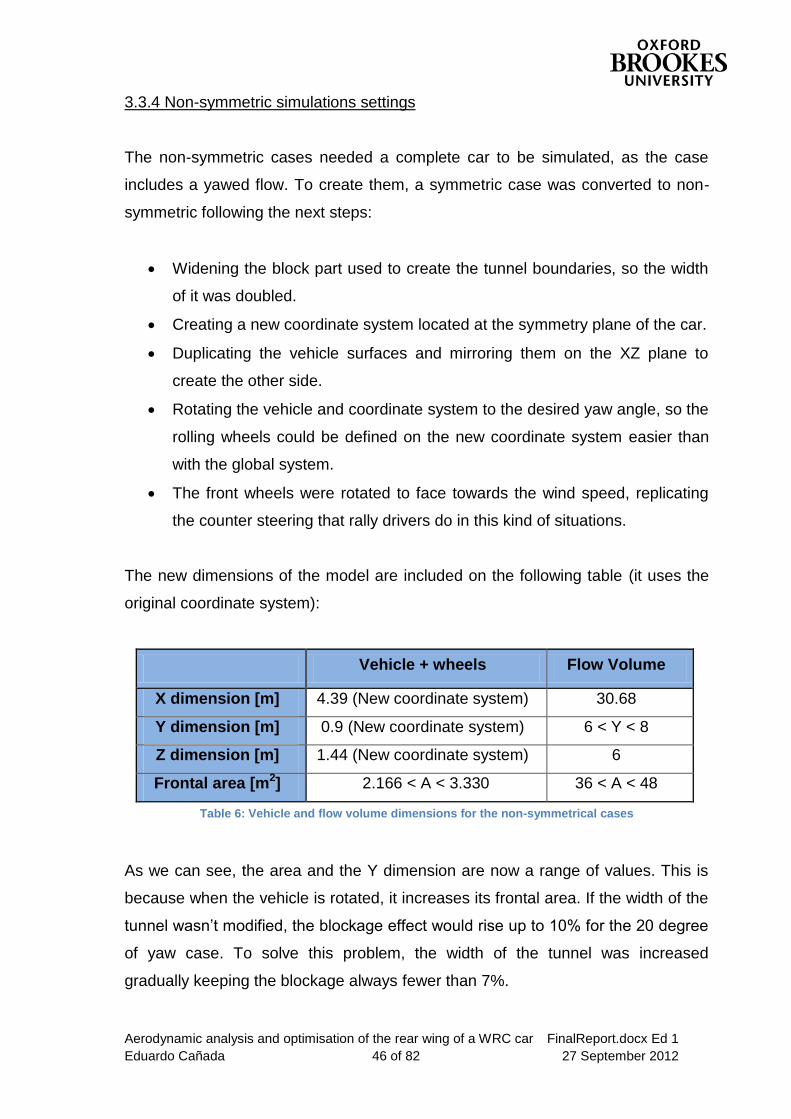
The results of a mesh diagnostics report for one of the symmetric simulations are:
Figure 26: Mesh diagnostics for a symmetric simulation
Aerodynamic analysis and optimisation of the rear wing of a WRC car FinalReport.docx Ed 1
Eduardo Cañada 45 of 82 27 September 2012
We can conclude that the whole mesh is accurate, as it has a rate of 94.7% of the
mesh with a very good accuracy. Also, we can see that the maximum skewness
angle is 88.1 degrees. Star-CCM+ help file states that this value should not be
higher than 85 degrees for the mesh to be robust. However, values between 85
and 90 degrees are also acceptable.
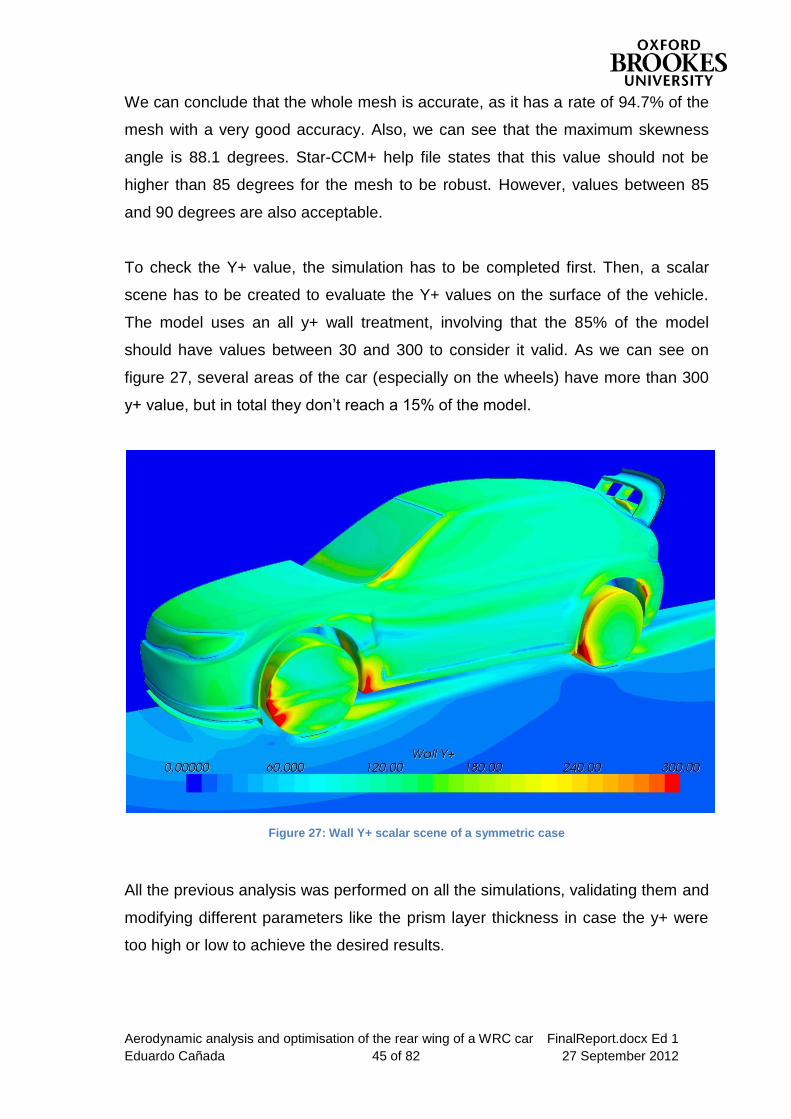
To check the Y+ value, the simulation has to be completed first. Then, a scalar
scene has to be created to evaluate the Y+ values on the surface of the vehicle.
The model uses an all y+ wall treatment, involving that the 85% of the model
should have values between 30 and 300 to consider it valid. As we can see on
figure 27, several areas of the car (especially on the wheels) have more than 300
y+ value, but in total they don’t reach a 15% of the model.
Figure 27: Wall Y+ scalar scene of a symmetric case
All the previous analysis was performed on all the simulations, validating them and
modifying different parameters like the prism layer thickness in case the y+ were
too high or low to achieve the desired results.
Aerodynamic analysis and optimisation of the rear wing of a WRC car FinalReport.docx Ed 1
Eduardo Cañada 46 of 82 27 September 2012
3.3.4 Non-symmetric simulations settings
The non-symmetric cases needed a complete car to be simulated, as the case
includes a yawed flow. To create them, a symmetric case was converted to non-
symmetric following the next steps:
Widening the block part used to create the tunnel boundaries, so the width
of it was doubled.
Creating a new coordinate system located at the symmetry plane of the car.
Duplicating the vehicle surfaces and mirroring them on the XZ plane to
create the other side.
Rotating the vehicle and coordinate system to the desired yaw angle, so the
rolling wheels could be defined on the new coordinate system easier than
with the global system.
The front wheels were rotated to face towards the wind speed, replicating
the counter steering that rally drivers do in this kind of situations.
The new dimensions of the model are included on the following table (it uses the
original coordinate system):
Vehicle + wheels Flow Volume
X dimension [m] 4.39 (New coordinate system) 30.68
Y dimension [m] 0.9 (New coordinate system) 6 < Y < 8
Z dimension [m] 1.44 (New coordinate system) 6
Frontal area [m2] 2.166 < A < 3.330 36 < A < 48
Table 6: Vehicle and flow volume dimensions for the non-symmetrical cases
As we can see, the area and the Y dimension are now a range of values. This is
because when the vehicle is rotated, it increases its frontal area. If the width of the
tunnel wasn’t modified, the blockage effect would rise up to 10% for the 20 degree
of yaw case. To solve this problem, the width of the tunnel was increased
gradually keeping the blockage always fewer than 7%.
Aerodynamic analysis and optimisation of the rear wing of a WRC car FinalReport.docx Ed 1
Eduardo Cañada 47 of 82 27 September 2012
3.3.5 Non-symmetric simulations mesh
The only difference between the meshes of the symmetric cases and the non
symmetric cases was the increase of the minimum and target values of the mesh,
to avoid creating a too high amount of cells if kept with the same values. The first
mesh generated with the original symmetric values had an amount higher than ten
millions of cells, a too high amount for the laptop to simulate it.
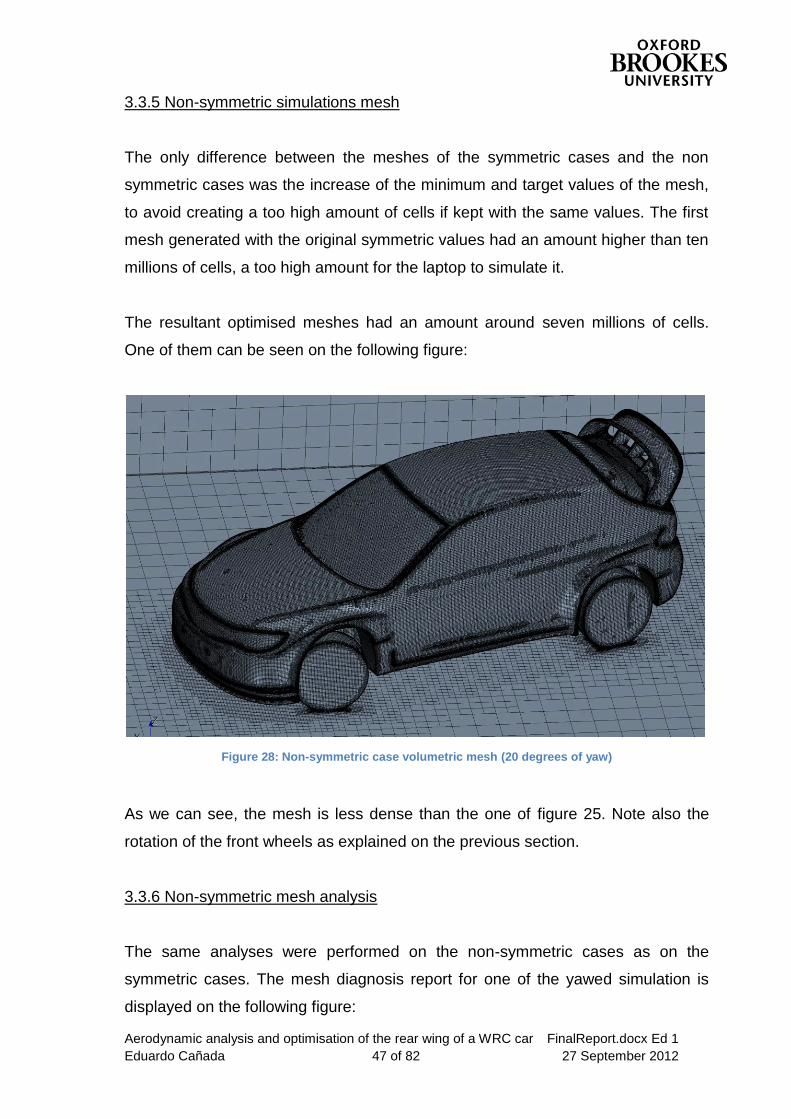
The resultant optimised meshes had an amount around seven millions of cells.
One of them can be seen on the following figure:
Figure 28: Non-symmetric case volumetric mesh (20 degrees of yaw)
As we can see, the mesh is less dense than the one of figure 25. Note also the
rotation of the front wheels as explained on the previous section.
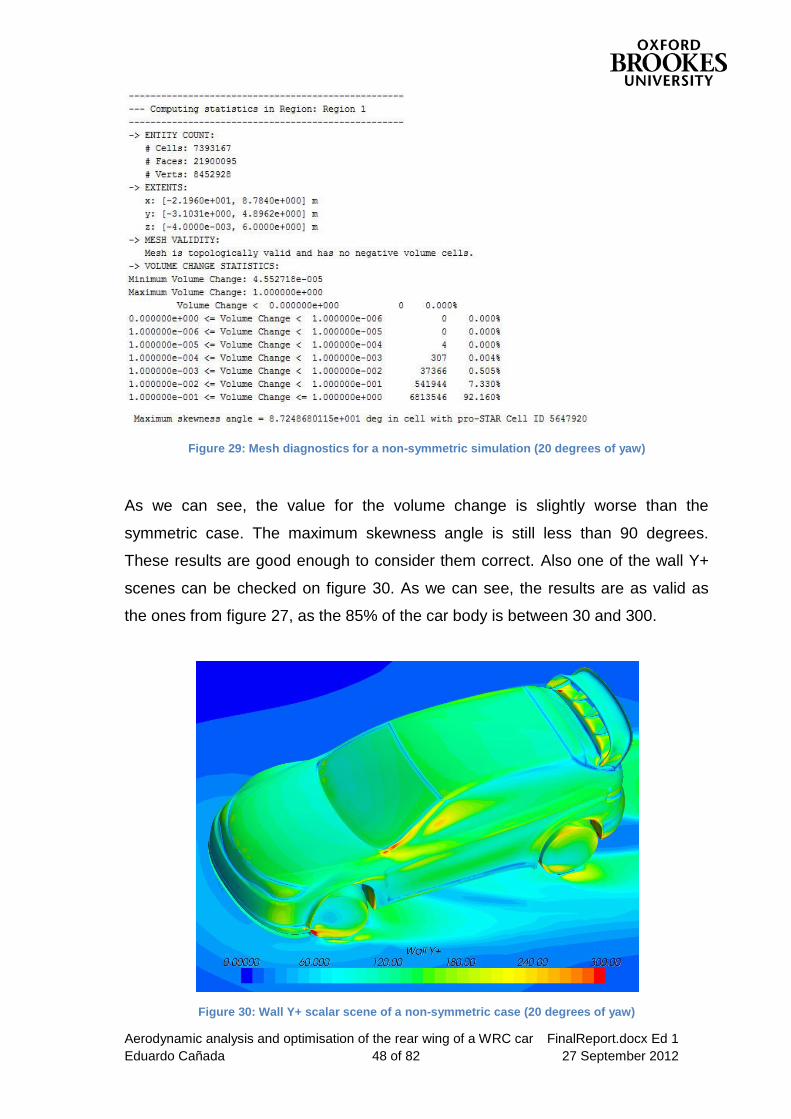
3.3.6 Non-symmetric mesh analysis
The same analyses were performed on the non-symmetric cases as on the
symmetric cases. The mesh diagnosis report for one of the yawed simulation is
displayed on the following figure:
Aerodynamic analysis and optimisation of the rear wing of a WRC car FinalReport.docx Ed 1
Eduardo Cañada 48 of 82 27 September 2012
Figure 29: Mesh diagnostics for a non-symmetric simulation (20 degrees of yaw)
As we can see, the value for the volume change is slightly worse than the
symmetric case. The maximum skewness angle is still less than 90 degrees.
These results are good enough to consider them correct. Also one of the wall Y+
scenes can be checked on figure 30. As we can see, the results are as valid as
the ones from figure 27, as the 85% of the car body is between 30 and 300.
Figure 30: Wall Y+ scalar scene of a non-symmetric case (20 degrees of yaw)
Aerodynamic analysis and optimisation of the rear wing of a WRC car FinalReport.docx Ed 1
Eduardo Cañada 49 of 82 27 September 2012
4 RESULTS AND DISCUSSIONS
4.1 INTRODUCTION
This section covers all the results from the simulations undertaken with the state-
of-the-art CFD software Star-CCM+. The results have been displayed with tables,
plots and scalar scenes, together with explanations of them. The results are
followed by different recommended rear wing geometry variations based on the
achieved results.
4.2 ORIGINAL WING INVESTIGATION
4.2.1 Introduction
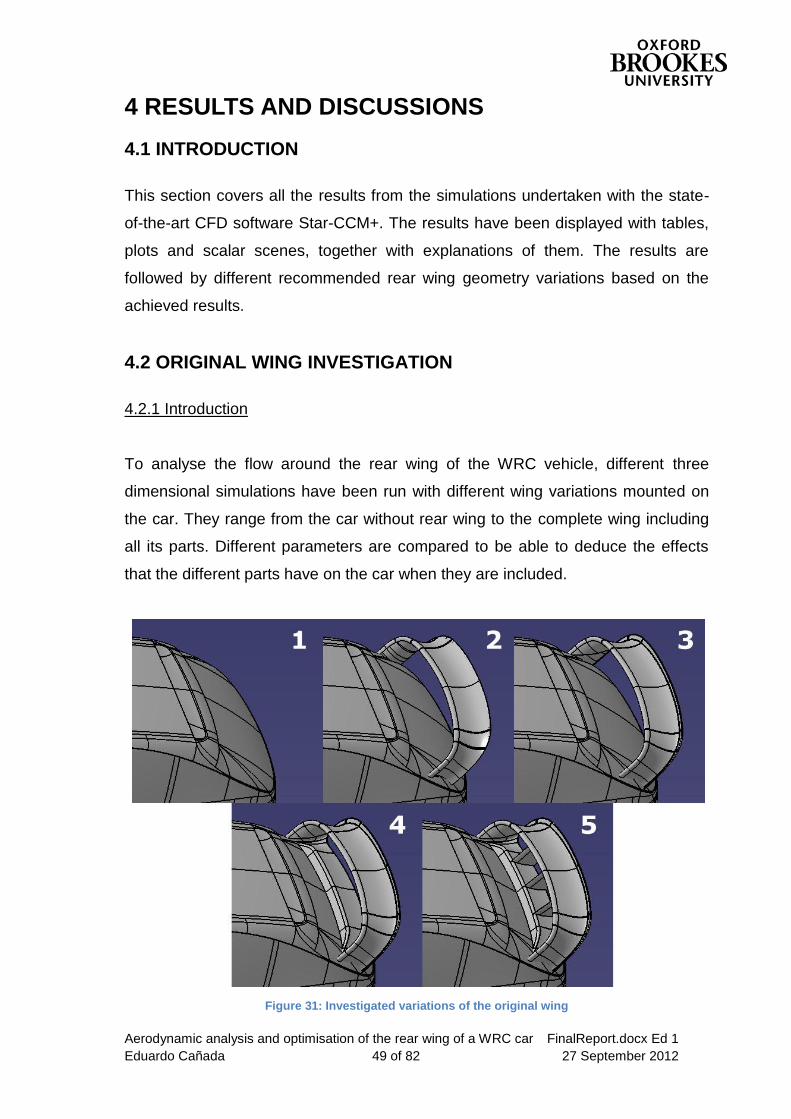
To analyse the flow around the rear wing of the WRC vehicle, different three
dimensional simulations have been run with different wing variations mounted on
the car. They range from the car without rear wing to the complete wing including
all its parts. Different parameters are compared to be able to deduce the effects
that the different parts have on the car when they are included.
Figure 31: Investigated variations of the original wing
Aerodynamic analysis and optimisation of the rear wing of a WRC car FinalReport.docx Ed 1
Eduardo Cañada 50 of 82 27 September 2012
The different variations investigated in this section can be seen on figure 31.
These variations are:
1. Without any rear wing.
2. Simple rear wing (without Gurney flap4).
3. Original rear wing (with Gurney flap).
4. Original rear wing with the dam addition.
5. Original rear wing and dam with vertical fins5.
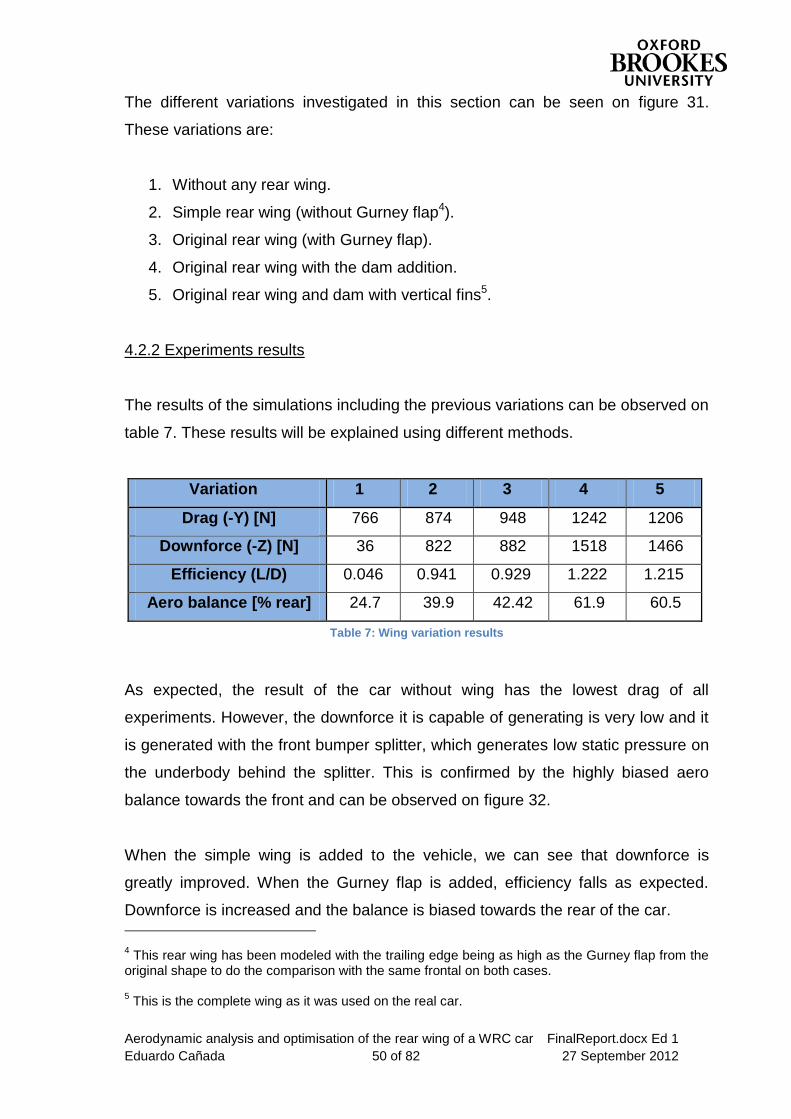
4.2.2 Experiments results
The results of the simulations including the previous variations can be observed on
table 7. These results will be explained using different methods.
Variation 1 2 3 4 5
Drag (-Y) [N] 766 874 948 1242 1206
Downforce (-Z) [N] 36 822 882 1518 1466
Efficiency (L/D) 0.046 0.941 0.929 1.222 1.215
Aero balance [% rear] 24.7 39.9 42.42 61.9 60.5
Table 7: Wing variation results
As expected, the result of the car without wing has the lowest drag of all
experiments. However, the downforce it is capable of generating is very low and it
is generated with the front bumper splitter, which generates low static pressure on
the underbody behind the splitter. This is confirmed by the highly biased aero
balance towards the front and can be observed on figure 32.
When the simple wing is added to the vehicle, we can see that downforce is
greatly improved. When the Gurney flap is added, efficiency falls as expected.
Downforce is increased and the balance is biased towards the rear of the car.
4 This rear wing has been modeled with the trailing edge being as high as the Gurney flap from the
original shape to do the comparison with the same frontal on both cases. 5 This is the complete wing as it was used on the real car.
Aerodynamic analysis and optimisation of the rear wing of a WRC car FinalReport.docx Ed 1
Eduardo Cañada 51 of 82 27 September 2012
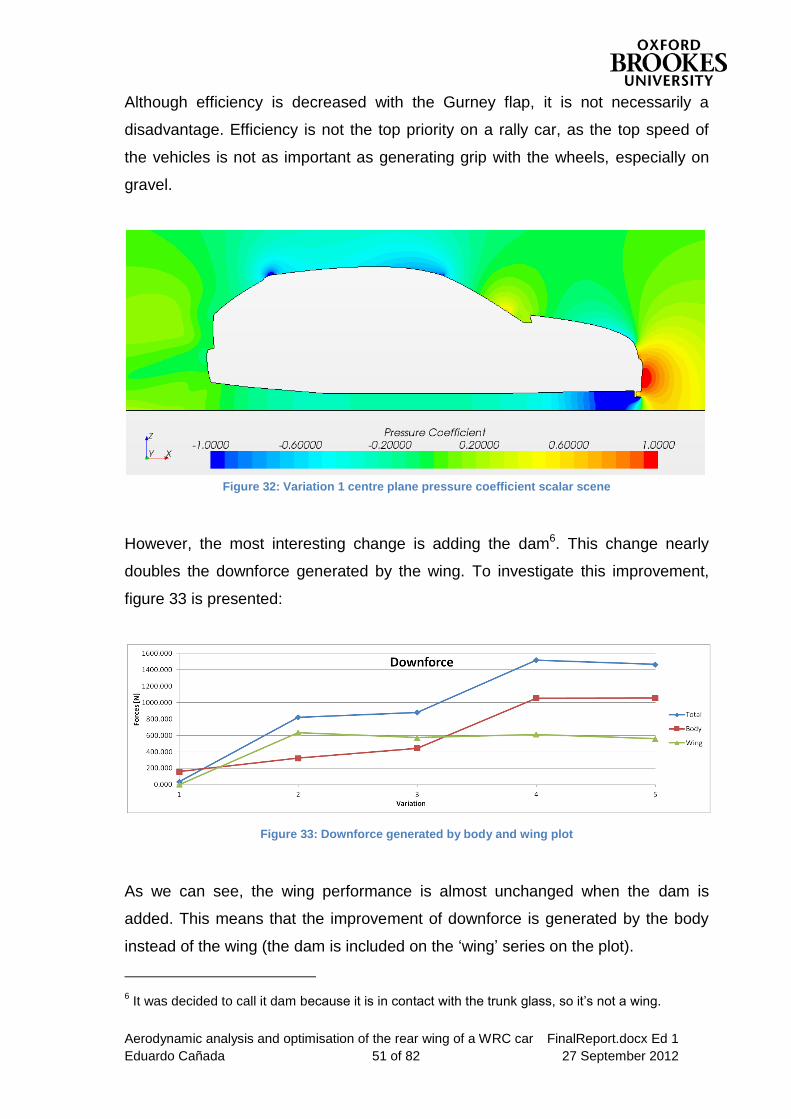
Although efficiency is decreased with the Gurney flap, it is not necessarily a
disadvantage. Efficiency is not the top priority on a rally car, as the top speed of
the vehicles is not as important as generating grip with the wheels, especially on
gravel.
Figure 32: Variation 1 centre plane pressure coefficient scalar scene
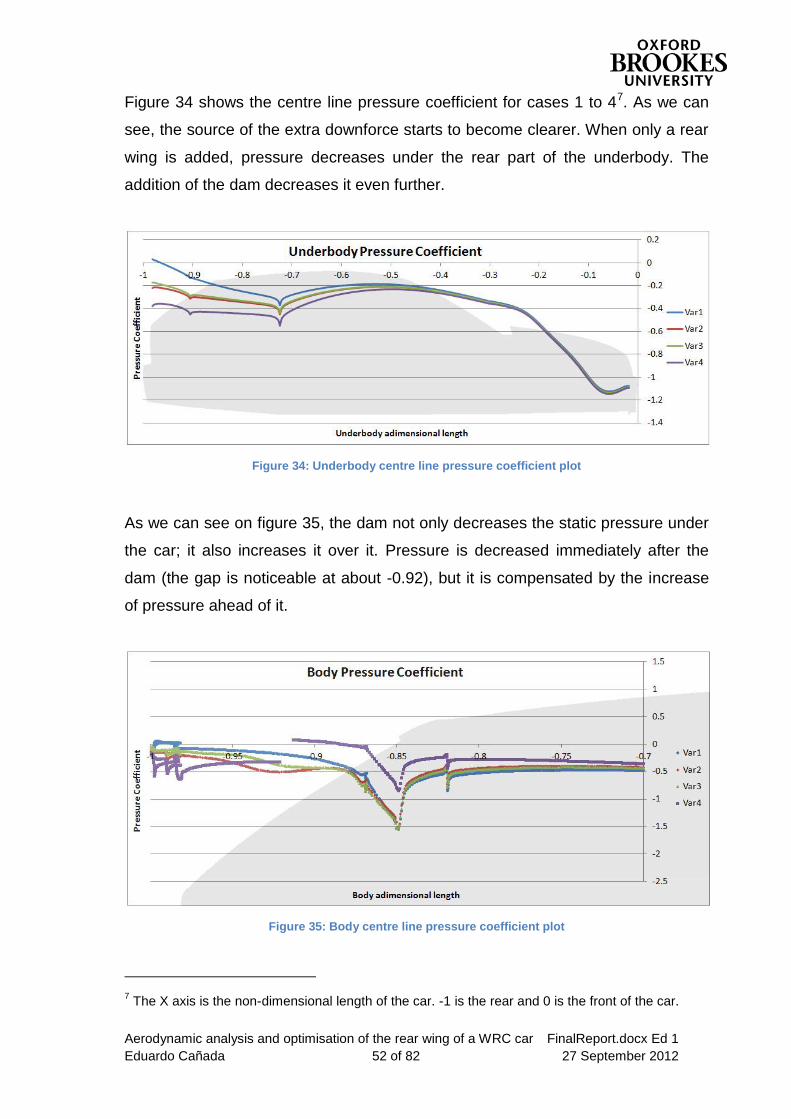
However, the most interesting change is adding the dam6. This change nearly
doubles the downforce generated by the wing. To investigate this improvement,
figure 33 is presented:
Figure 33: Downforce generated by body and wing plot
As we can see, the wing performance is almost unchanged when the dam is
added. This means that the improvement of downforce is generated by the body
instead of the wing (the dam is included on the ‘wing’ series on the plot).
6 It was decided to call it dam because it is in contact with the trunk glass, so it’s not a wing.
Aerodynamic analysis and optimisation of the rear wing of a WRC car FinalReport.docx Ed 1
Eduardo Cañada 52 of 82 27 September 2012
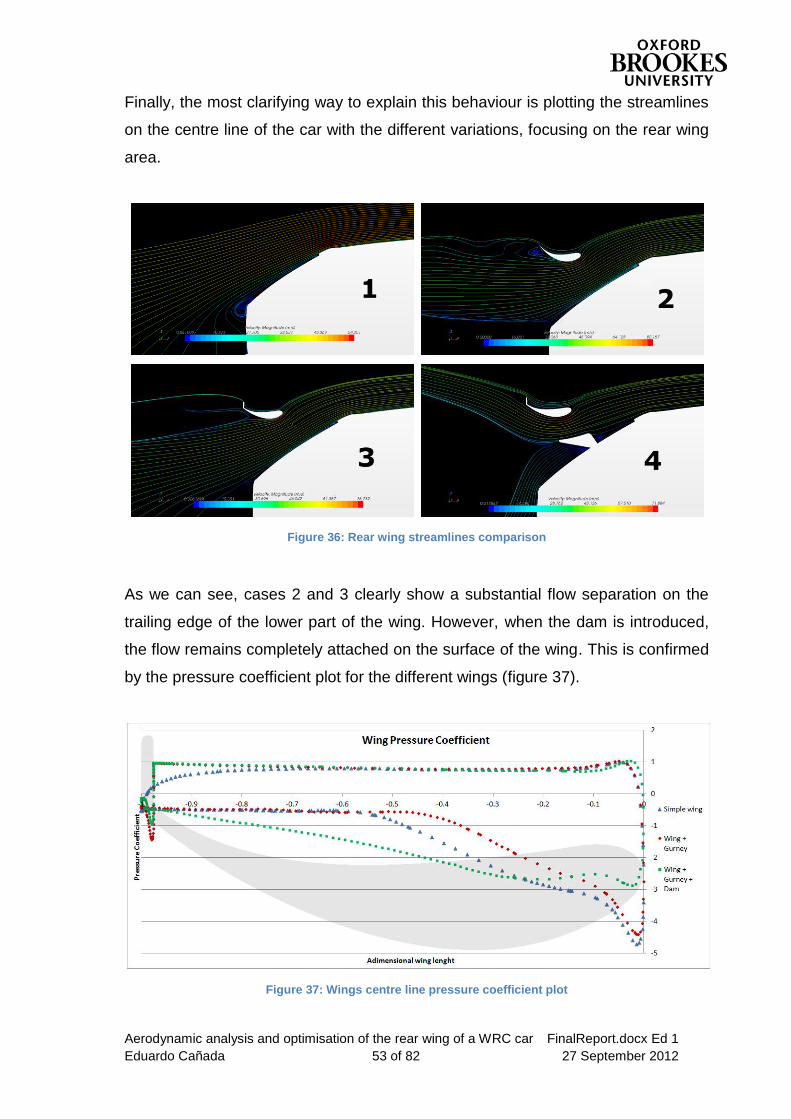
Figure 34 shows the centre line pressure coefficient for cases 1 to 47. As we can
see, the source of the extra downforce starts to become clearer. When only a rear
wing is added, pressure decreases under the rear part of the underbody. The
addition of the dam decreases it even further.
Figure 34: Underbody centre line pressure coefficient plot
As we can see on figure 35, the dam not only decreases the static pressure under
the car; it also increases it over it. Pressure is decreased immediately after the
dam (the gap is noticeable at about -0.92), but it is compensated by the increase
of pressure ahead of it.
Figure 35: Body centre line pressure coefficient plot
7 The X axis is the non-dimensional length of the car. -1 is the rear and 0 is the front of the car.
Aerodynamic analysis and optimisation of the rear wing of a WRC car FinalReport.docx Ed 1
Eduardo Cañada 53 of 82 27 September 2012
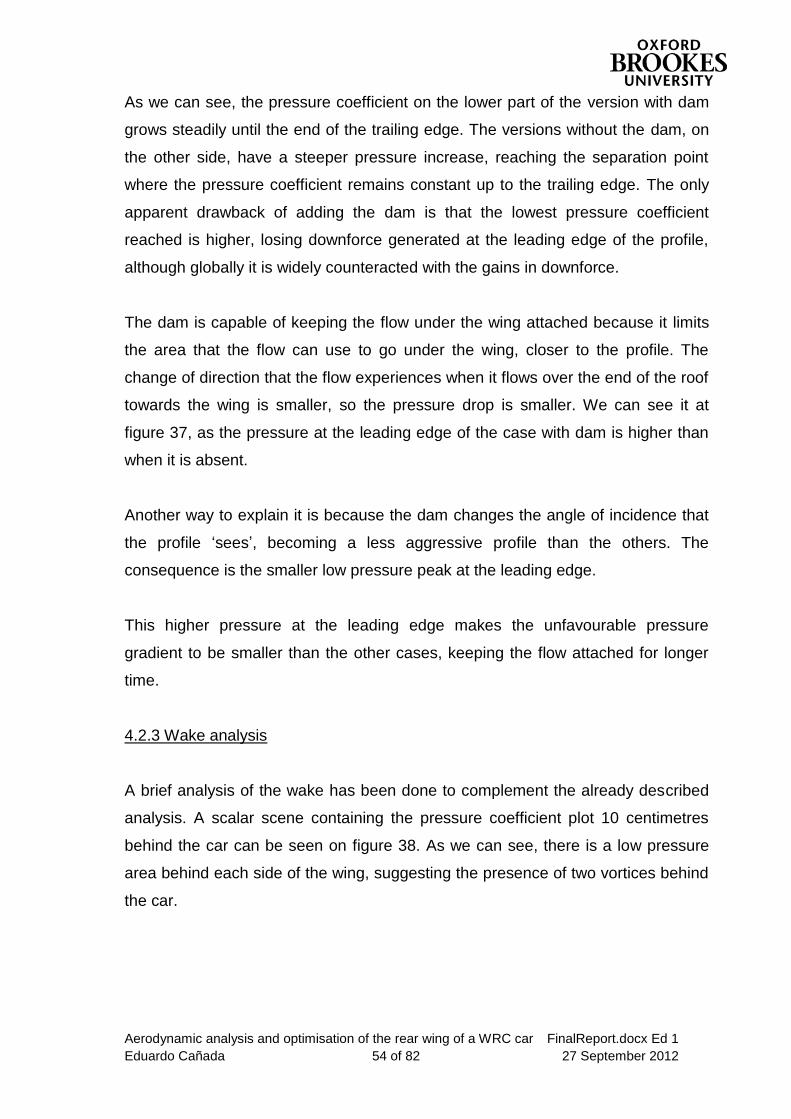
Finally, the most clarifying way to explain this behaviour is plotting the streamlines
on the centre line of the car with the different variations, focusing on the rear wing
area.
Figure 36: Rear wing streamlines comparison
As we can see, cases 2 and 3 clearly show a substantial flow separation on the
trailing edge of the lower part of the wing. However, when the dam is introduced,
the flow remains completely attached on the surface of the wing. This is confirmed
by the pressure coefficient plot for the different wings (figure 37).
Figure 37: Wings centre line pressure coefficient plot
Aerodynamic analysis and optimisation of the rear wing of a WRC car FinalReport.docx Ed 1
Eduardo Cañada 54 of 82 27 September 2012
As we can see, the pressure coefficient on the lower part of the version with dam
grows steadily until the end of the trailing edge. The versions without the dam, on
the other side, have a steeper pressure increase, reaching the separation point
where the pressure coefficient remains constant up to the trailing edge. The only
apparent drawback of adding the dam is that the lowest pressure coefficient
reached is higher, losing downforce generated at the leading edge of the profile,
although globally it is widely counteracted with the gains in downforce.
The dam is capable of keeping the flow under the wing attached because it limits
the area that the flow can use to go under the wing, closer to the profile. The
change of direction that the flow experiences when it flows over the end of the roof
towards the wing is smaller, so the pressure drop is smaller. We can see it at
figure 37, as the pressure at the leading edge of the case with dam is higher than
when it is absent.
Another way to explain it is because the dam changes the angle of incidence that
the profile ‘sees’, becoming a less aggressive profile than the others. The
consequence is the smaller low pressure peak at the leading edge.
This higher pressure at the leading edge makes the unfavourable pressure
gradient to be smaller than the other cases, keeping the flow attached for longer
time.
4.2.3 Wake analysis
A brief analysis of the wake has been done to complement the already described
analysis. A scalar scene containing the pressure coefficient plot 10 centimetres
behind the car can be seen on figure 38. As we can see, there is a low pressure
area behind each side of the wing, suggesting the presence of two vortices behind
the car.
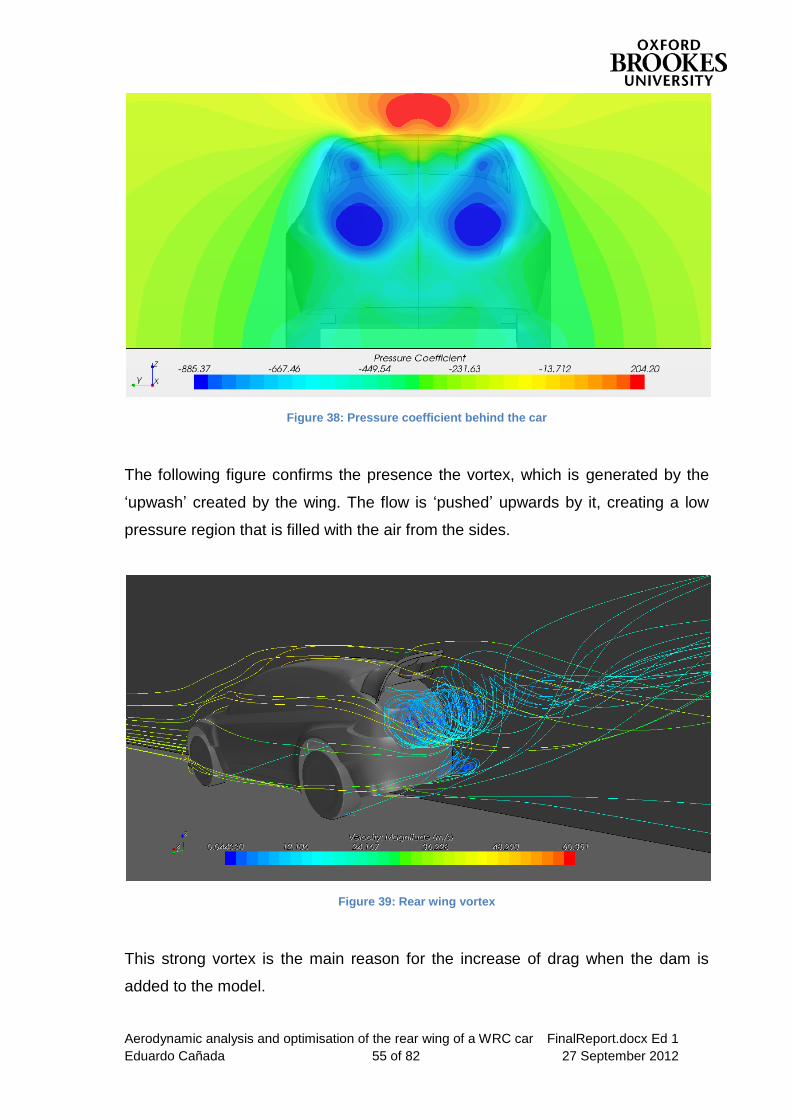
Aerodynamic analysis and optimisation of the rear wing of a WRC car FinalReport.docx Ed 1
Eduardo Cañada 55 of 82 27 September 2012
Figure 38: Pressure coefficient behind the car
The following figure confirms the presence the vortex, which is generated by the
‘upwash’ created by the wing. The flow is ‘pushed’ upwards by it, creating a low
pressure region that is filled with the air from the sides.
Figure 39: Rear wing vortex
This strong vortex is the main reason for the increase of drag when the dam is
added to the model.
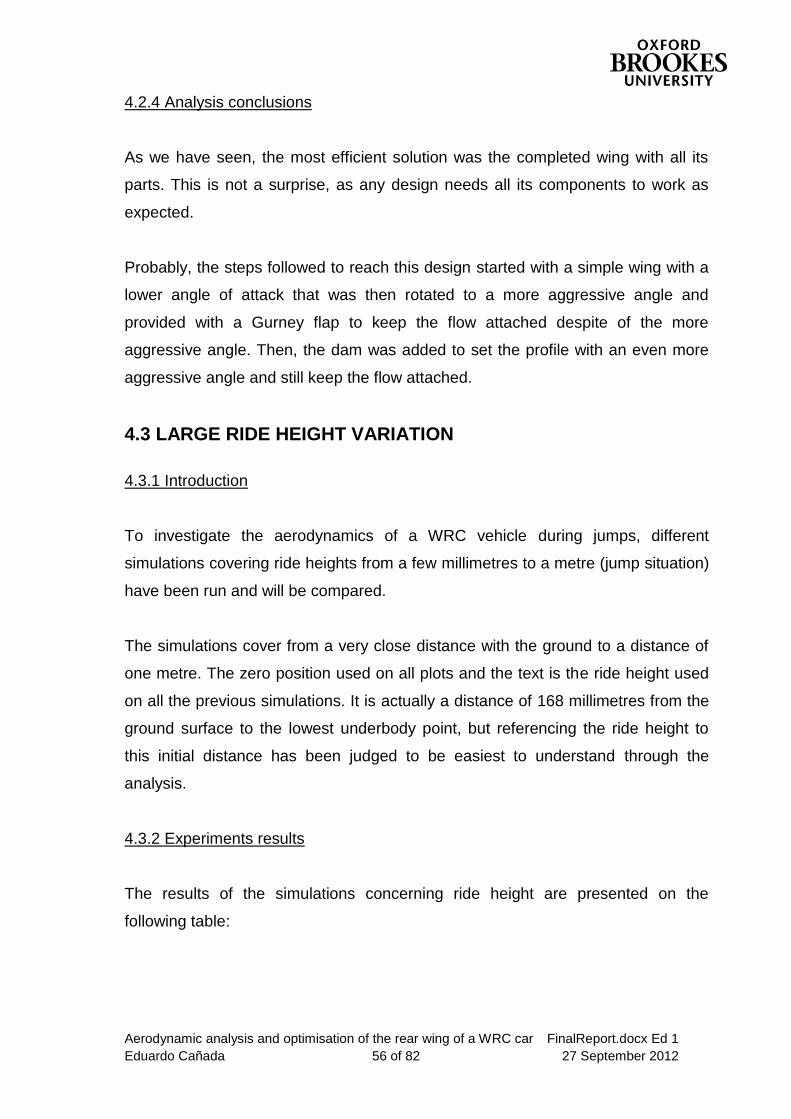
Aerodynamic analysis and optimisation of the rear wing of a WRC car FinalReport.docx Ed 1
Eduardo Cañada 56 of 82 27 September 2012
4.2.4 Analysis conclusions
As we have seen, the most efficient solution was the completed wing with all its
parts. This is not a surprise, as any design needs all its components to work as
expected.
Probably, the steps followed to reach this design started with a simple wing with a
lower angle of attack that was then rotated to a more aggressive angle and
provided with a Gurney flap to keep the flow attached despite of the more
aggressive angle. Then, the dam was added to set the profile with an even more
aggressive angle and still keep the flow attached.
4.3 LARGE RIDE HEIGHT VARIATION
4.3.1 Introduction
To investigate the aerodynamics of a WRC vehicle during jumps, different
simulations covering ride heights from a few millimetres to a metre (jump situation)
have been run and will be compared.
The simulations cover from a very close distance with the ground to a distance of
one metre. The zero position used on all plots and the text is the ride height used
on all the previous simulations. It is actually a distance of 168 millimetres from the
ground surface to the lowest underbody point, but referencing the ride height to
this initial distance has been judged to be easiest to understand through the
analysis.
4.3.2 Experiments results
The results of the simulations concerning ride height are presented on the
following table:
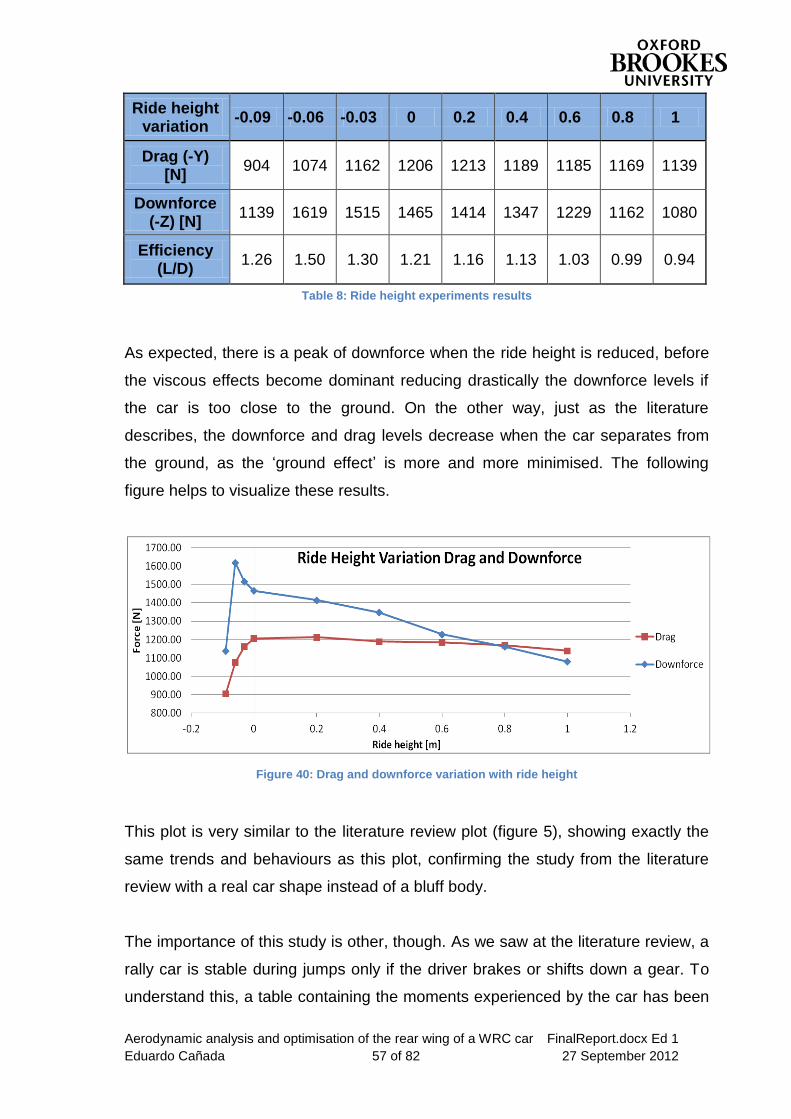
Aerodynamic analysis and optimisation of the rear wing of a WRC car FinalReport.docx Ed 1
Eduardo Cañada 57 of 82 27 September 2012
Ride height variation
-0.09 -0.06 -0.03 0 0.2 0.4 0.6 0.8 1
Drag (-Y) [N]
904 1074 1162 1206 1213 1189 1185 1169 1139
Downforce (-Z) [N]
1139 1619 1515 1465 1414 1347 1229 1162 1080
Efficiency (L/D)
1.26 1.50 1.30 1.21 1.16 1.13 1.03 0.99 0.94
Table 8: Ride height experiments results
As expected, there is a peak of downforce when the ride height is reduced, before
the viscous effects become dominant reducing drastically the downforce levels if
the car is too close to the ground. On the other way, just as the literature
describes, the downforce and drag levels decrease when the car separates from
the ground, as the ‘ground effect’ is more and more minimised. The following
figure helps to visualize these results.
Figure 40: Drag and downforce variation with ride height
This plot is very similar to the literature review plot (figure 5), showing exactly the
same trends and behaviours as this plot, confirming the study from the literature
review with a real car shape instead of a bluff body.
The importance of this study is other, though. As we saw at the literature review, a
rally car is stable during jumps only if the driver brakes or shifts down a gear. To
understand this, a table containing the moments experienced by the car has been
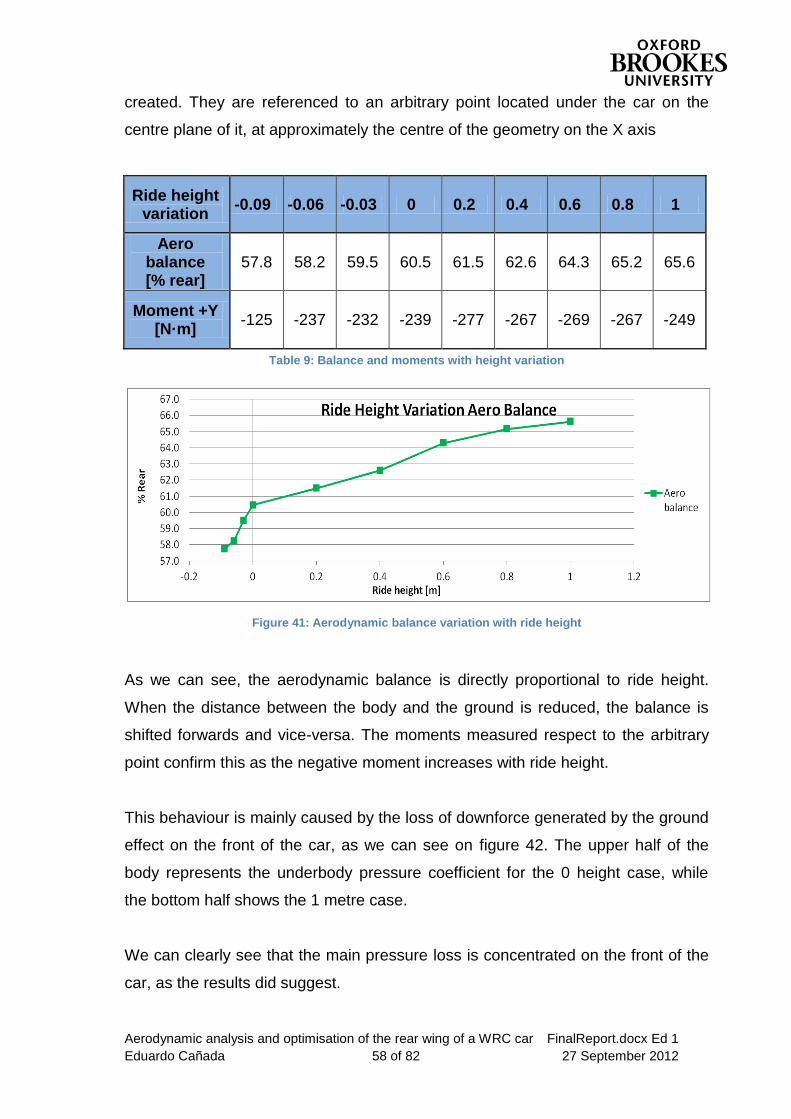
Aerodynamic analysis and optimisation of the rear wing of a WRC car FinalReport.docx Ed 1
Eduardo Cañada 58 of 82 27 September 2012
created. They are referenced to an arbitrary point located under the car on the
centre plane of it, at approximately the centre of the geometry on the X axis
Ride height variation
-0.09 -0.06 -0.03 0 0.2 0.4 0.6 0.8 1
Aero balance [% rear]
57.8 58.2 59.5 60.5 61.5 62.6 64.3 65.2 65.6
Moment +Y [N·m]
-125 -237 -232 -239 -277 -267 -269 -267 -249
Table 9: Balance and moments with height variation
Figure 41: Aerodynamic balance variation with ride height
As we can see, the aerodynamic balance is directly proportional to ride height.
When the distance between the body and the ground is reduced, the balance is
shifted forwards and vice-versa. The moments measured respect to the arbitrary
point confirm this as the negative moment increases with ride height.
This behaviour is mainly caused by the loss of downforce generated by the ground
effect on the front of the car, as we can see on figure 42. The upper half of the
body represents the underbody pressure coefficient for the 0 height case, while
the bottom half shows the 1 metre case.
We can clearly see that the main pressure loss is concentrated on the front of the
car, as the results did suggest.
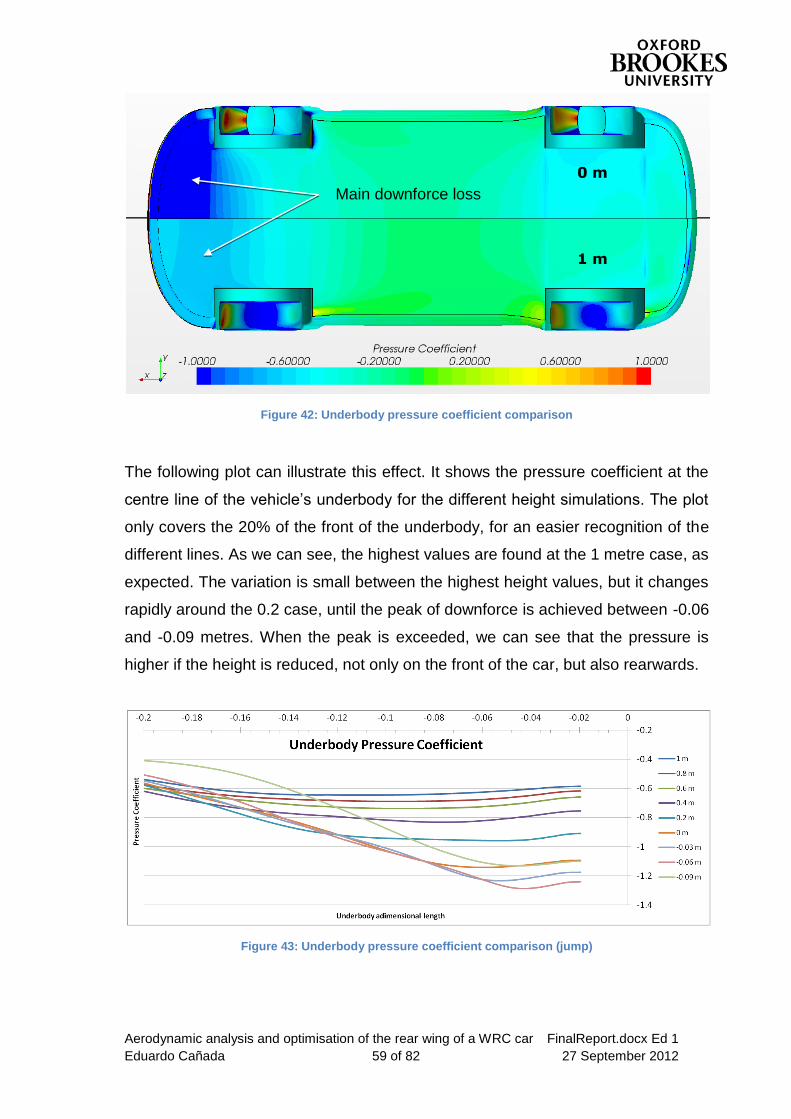
Aerodynamic analysis and optimisation of the rear wing of a WRC car FinalReport.docx Ed 1
Eduardo Cañada 59 of 82 27 September 2012
Figure 42: Underbody pressure coefficient comparison
The following plot can illustrate this effect. It shows the pressure coefficient at the
centre line of the vehicle’s underbody for the different height simulations. The plot
only covers the 20% of the front of the underbody, for an easier recognition of the
different lines. As we can see, the highest values are found at the 1 metre case, as
expected. The variation is small between the highest height values, but it changes
rapidly around the 0.2 case, until the peak of downforce is achieved between -0.06
and -0.09 metres. When the peak is exceeded, we can see that the pressure is
higher if the height is reduced, not only on the front of the car, but also rearwards.
Figure 43: Underbody pressure coefficient comparison (jump)
Main downforce loss
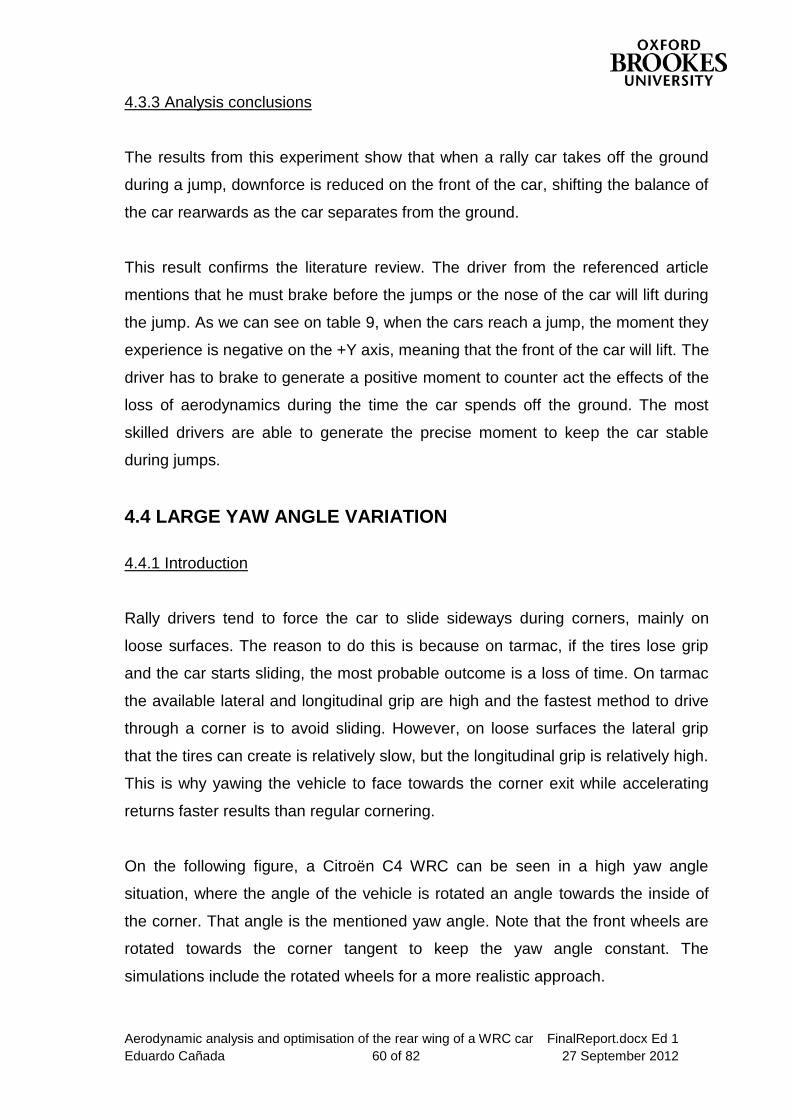
Aerodynamic analysis and optimisation of the rear wing of a WRC car FinalReport.docx Ed 1
Eduardo Cañada 60 of 82 27 September 2012
4.3.3 Analysis conclusions
The results from this experiment show that when a rally car takes off the ground
during a jump, downforce is reduced on the front of the car, shifting the balance of
the car rearwards as the car separates from the ground.
This result confirms the literature review. The driver from the referenced article
mentions that he must brake before the jumps or the nose of the car will lift during
the jump. As we can see on table 9, when the cars reach a jump, the moment they
experience is negative on the +Y axis, meaning that the front of the car will lift. The
driver has to brake to generate a positive moment to counter act the effects of the
loss of aerodynamics during the time the car spends off the ground. The most
skilled drivers are able to generate the precise moment to keep the car stable
during jumps.
4.4 LARGE YAW ANGLE VARIATION
4.4.1 Introduction
Rally drivers tend to force the car to slide sideways during corners, mainly on
loose surfaces. The reason to do this is because on tarmac, if the tires lose grip
and the car starts sliding, the most probable outcome is a loss of time. On tarmac
the available lateral and longitudinal grip are high and the fastest method to drive
through a corner is to avoid sliding. However, on loose surfaces the lateral grip
that the tires can create is relatively slow, but the longitudinal grip is relatively high.
This is why yawing the vehicle to face towards the corner exit while accelerating
returns faster results than regular cornering.
On the following figure, a Citroën C4 WRC can be seen in a high yaw angle
situation, where the angle of the vehicle is rotated an angle towards the inside of
the corner. That angle is the mentioned yaw angle. Note that the front wheels are
rotated towards the corner tangent to keep the yaw angle constant. The
simulations include the rotated wheels for a more realistic approach.
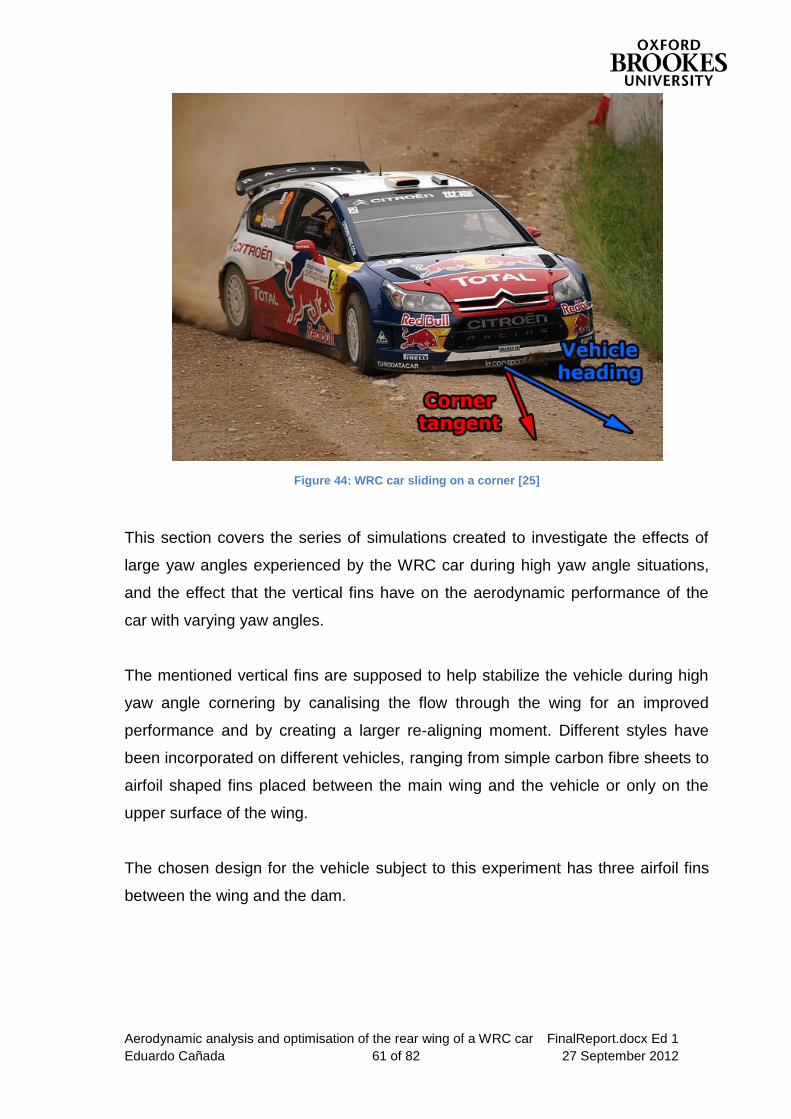
Aerodynamic analysis and optimisation of the rear wing of a WRC car FinalReport.docx Ed 1
Eduardo Cañada 61 of 82 27 September 2012
Figure 44: WRC car sliding on a corner [25]
This section covers the series of simulations created to investigate the effects of
large yaw angles experienced by the WRC car during high yaw angle situations,
and the effect that the vertical fins have on the aerodynamic performance of the
car with varying yaw angles.
The mentioned vertical fins are supposed to help stabilize the vehicle during high
yaw angle cornering by canalising the flow through the wing for an improved
performance and by creating a larger re-aligning moment. Different styles have
been incorporated on different vehicles, ranging from simple carbon fibre sheets to
airfoil shaped fins placed between the main wing and the vehicle or only on the
upper surface of the wing.
The chosen design for the vehicle subject to this experiment has three airfoil fins
between the wing and the dam.
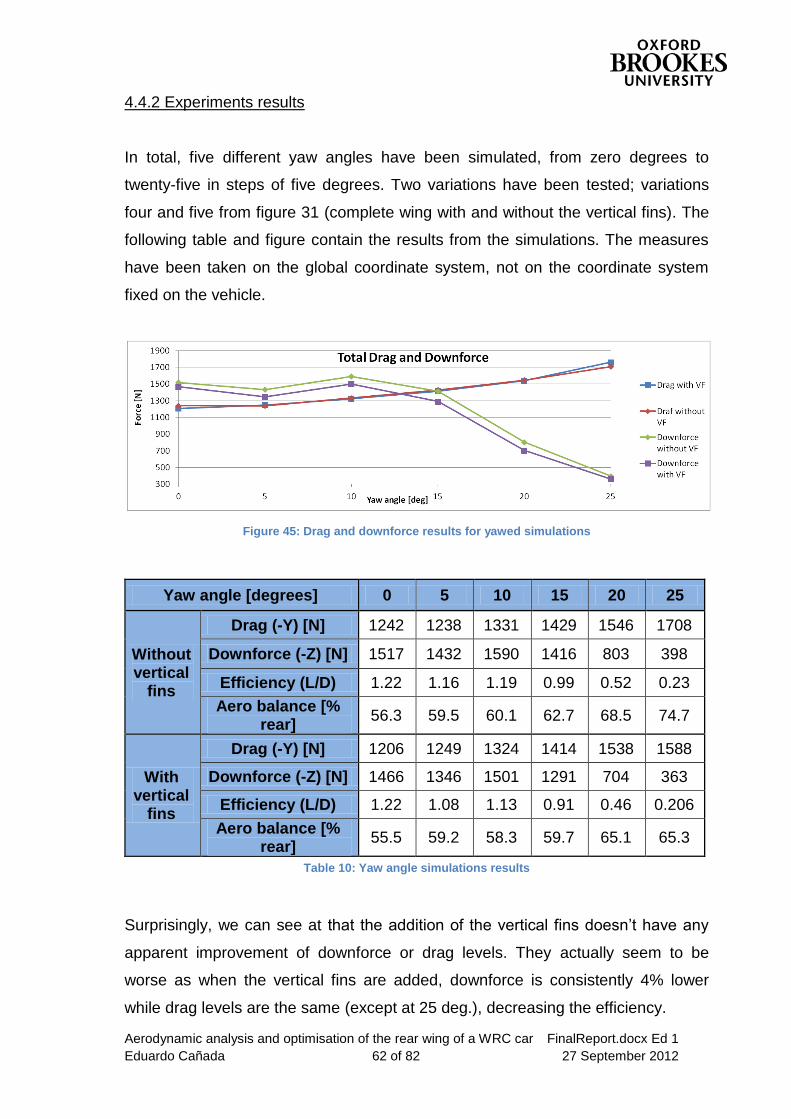
Aerodynamic analysis and optimisation of the rear wing of a WRC car FinalReport.docx Ed 1
Eduardo Cañada 62 of 82 27 September 2012
4.4.2 Experiments results
In total, five different yaw angles have been simulated, from zero degrees to
twenty-five in steps of five degrees. Two variations have been tested; variations
four and five from figure 31 (complete wing with and without the vertical fins). The
following table and figure contain the results from the simulations. The measures
have been taken on the global coordinate system, not on the coordinate system
fixed on the vehicle.
Figure 45: Drag and downforce results for yawed simulations
Yaw angle [degrees] 0 5 10 15 20 25
Without vertical
fins
Drag (-Y) [N] 1242 1238 1331 1429 1546 1708
Downforce (-Z) [N] 1517 1432 1590 1416 803 398
Efficiency (L/D) 1.22 1.16 1.19 0.99 0.52 0.23
Aero balance [% rear]
56.3 59.5 60.1 62.7 68.5 74.7
With vertical
fins
Drag (-Y) [N] 1206 1249 1324 1414 1538 1588
Downforce (-Z) [N] 1466 1346 1501 1291 704 363
Efficiency (L/D) 1.22 1.08 1.13 0.91 0.46 0.206
Aero balance [% rear]
55.5 59.2 58.3 59.7 65.1 65.3
Table 10: Yaw angle simulations results
Surprisingly, we can see at that the addition of the vertical fins doesn’t have any
apparent improvement of downforce or drag levels. They actually seem to be
worse as when the vertical fins are added, downforce is consistently 4% lower
while drag levels are the same (except at 25 deg.), decreasing the efficiency.
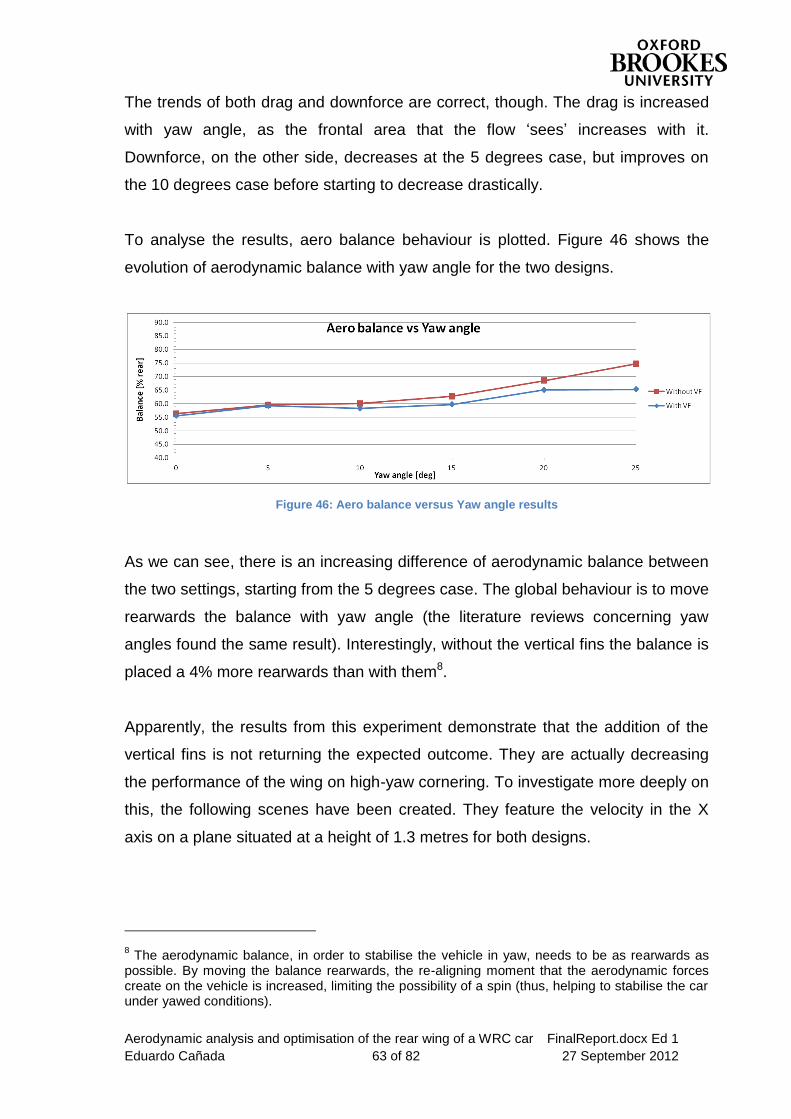
Aerodynamic analysis and optimisation of the rear wing of a WRC car FinalReport.docx Ed 1
Eduardo Cañada 63 of 82 27 September 2012
The trends of both drag and downforce are correct, though. The drag is increased
with yaw angle, as the frontal area that the flow ‘sees’ increases with it.
Downforce, on the other side, decreases at the 5 degrees case, but improves on
the 10 degrees case before starting to decrease drastically.
To analyse the results, aero balance behaviour is plotted. Figure 46 shows the
evolution of aerodynamic balance with yaw angle for the two designs.
Figure 46: Aero balance versus Yaw angle results
As we can see, there is an increasing difference of aerodynamic balance between
the two settings, starting from the 5 degrees case. The global behaviour is to move
rearwards the balance with yaw angle (the literature reviews concerning yaw
angles found the same result). Interestingly, without the vertical fins the balance is
placed a 4% more rearwards than with them8.
Apparently, the results from this experiment demonstrate that the addition of the
vertical fins is not returning the expected outcome. They are actually decreasing
the performance of the wing on high-yaw cornering. To investigate more deeply on
this, the following scenes have been created. They feature the velocity in the X
axis on a plane situated at a height of 1.3 metres for both designs.
8 The aerodynamic balance, in order to stabilise the vehicle in yaw, needs to be as rearwards as
possible. By moving the balance rearwards, the re-aligning moment that the aerodynamic forces create on the vehicle is increased, limiting the possibility of a spin (thus, helping to stabilise the car under yawed conditions).
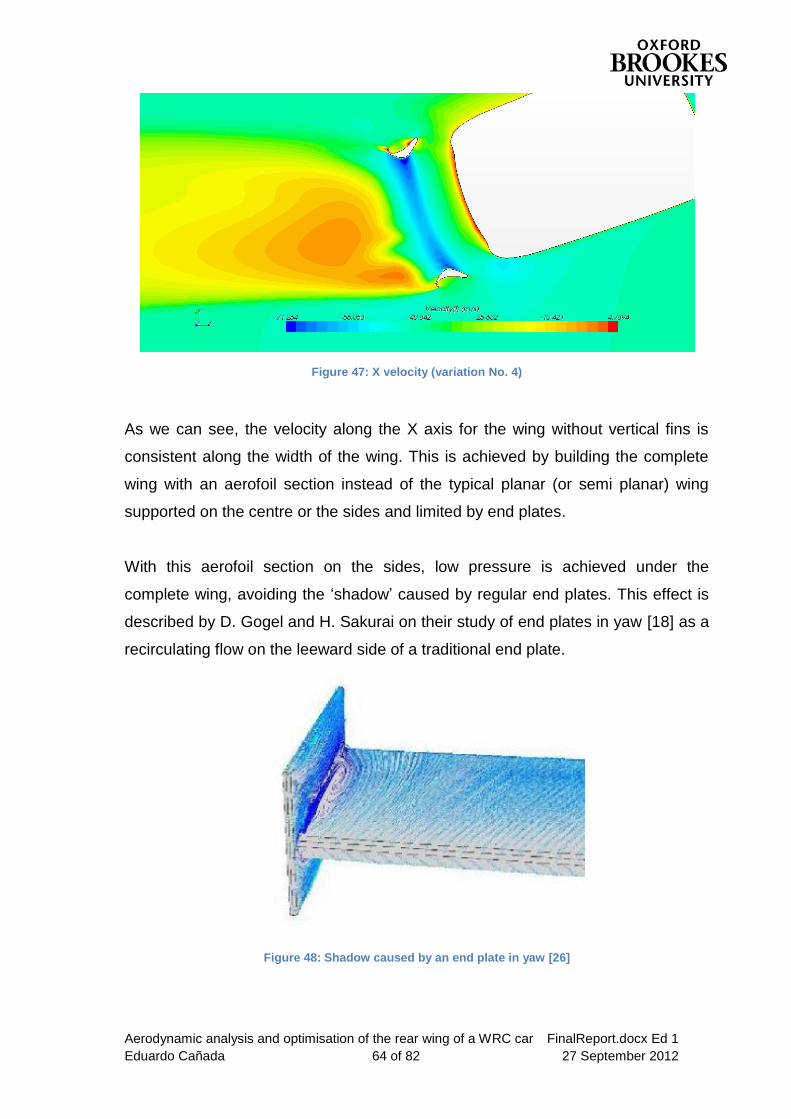
Aerodynamic analysis and optimisation of the rear wing of a WRC car FinalReport.docx Ed 1
Eduardo Cañada 64 of 82 27 September 2012
Figure 47: X velocity (variation No. 4)
As we can see, the velocity along the X axis for the wing without vertical fins is
consistent along the width of the wing. This is achieved by building the complete
wing with an aerofoil section instead of the typical planar (or semi planar) wing
supported on the centre or the sides and limited by end plates.
With this aerofoil section on the sides, low pressure is achieved under the
complete wing, avoiding the ‘shadow’ caused by regular end plates. This effect is
described by D. Gogel and H. Sakurai on their study of end plates in yaw [18] as a
recirculating flow on the leeward side of a traditional end plate.
Figure 48: Shadow caused by an end plate in yaw [26]
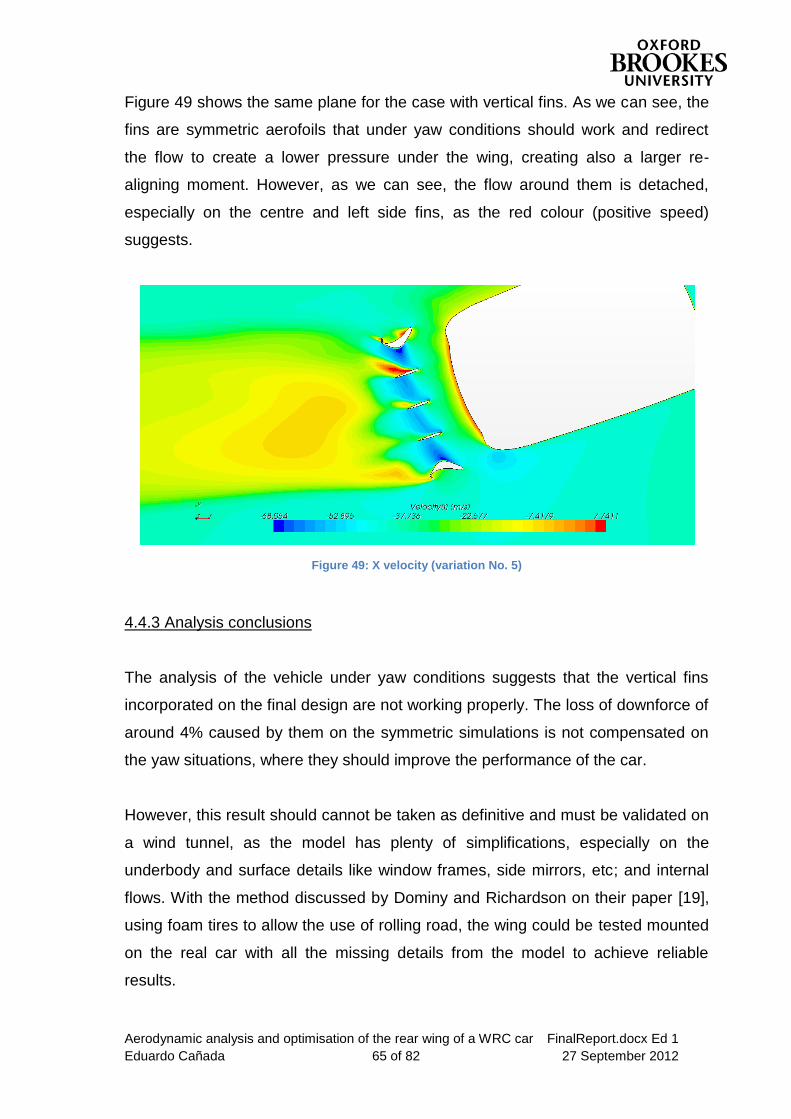
Aerodynamic analysis and optimisation of the rear wing of a WRC car FinalReport.docx Ed 1
Eduardo Cañada 65 of 82 27 September 2012
Figure 49 shows the same plane for the case with vertical fins. As we can see, the
fins are symmetric aerofoils that under yaw conditions should work and redirect
the flow to create a lower pressure under the wing, creating also a larger re-
aligning moment. However, as we can see, the flow around them is detached,
especially on the centre and left side fins, as the red colour (positive speed)
suggests.
Figure 49: X velocity (variation No. 5)
4.4.3 Analysis conclusions
The analysis of the vehicle under yaw conditions suggests that the vertical fins
incorporated on the final design are not working properly. The loss of downforce of
around 4% caused by them on the symmetric simulations is not compensated on
the yaw situations, where they should improve the performance of the car.
However, this result should cannot be taken as definitive and must be validated on
a wind tunnel, as the model has plenty of simplifications, especially on the
underbody and surface details like window frames, side mirrors, etc; and internal
flows. With the method discussed by Dominy and Richardson on their paper [19],
using foam tires to allow the use of rolling road, the wing could be tested mounted
on the real car with all the missing details from the model to achieve reliable
results.
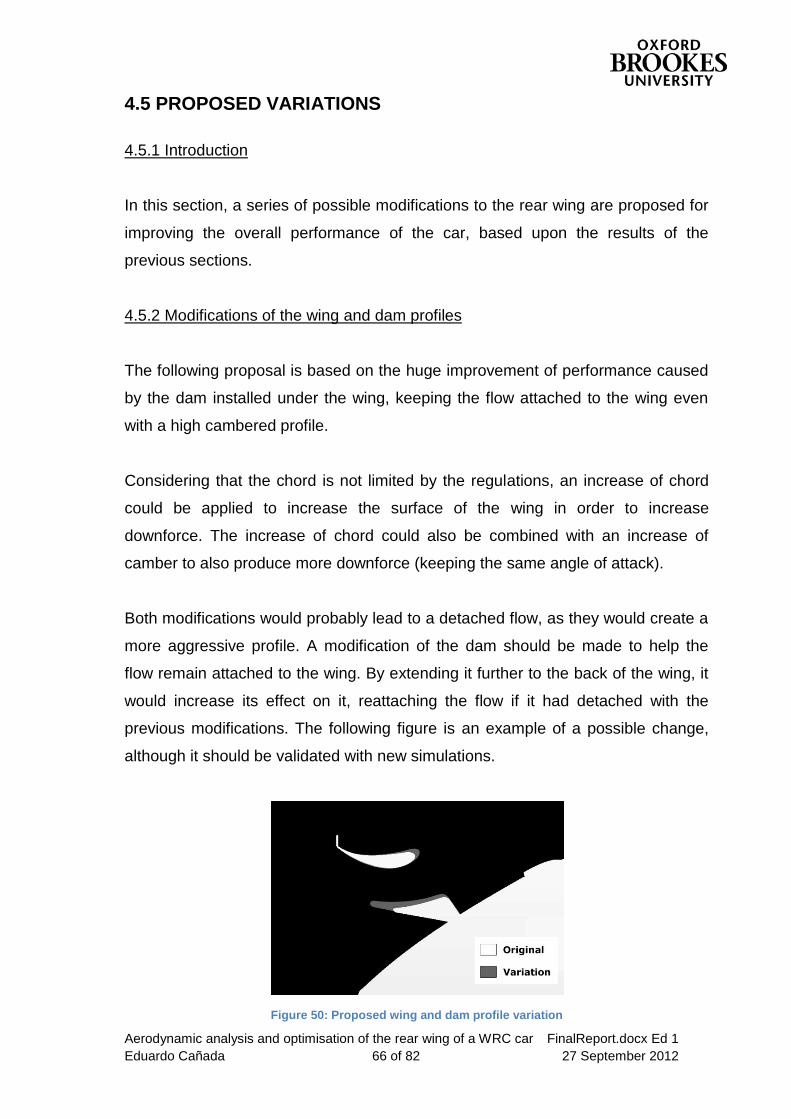
Aerodynamic analysis and optimisation of the rear wing of a WRC car FinalReport.docx Ed 1
Eduardo Cañada 66 of 82 27 September 2012
4.5 PROPOSED VARIATIONS
4.5.1 Introduction
In this section, a series of possible modifications to the rear wing are proposed for
improving the overall performance of the car, based upon the results of the
previous sections.
4.5.2 Modifications of the wing and dam profiles
The following proposal is based on the huge improvement of performance caused
by the dam installed under the wing, keeping the flow attached to the wing even
with a high cambered profile.
Considering that the chord is not limited by the regulations, an increase of chord
could be applied to increase the surface of the wing in order to increase
downforce. The increase of chord could also be combined with an increase of
camber to also produce more downforce (keeping the same angle of attack).
Both modifications would probably lead to a detached flow, as they would create a
more aggressive profile. A modification of the dam should be made to help the
flow remain attached to the wing. By extending it further to the back of the wing, it
would increase its effect on it, reattaching the flow if it had detached with the
previous modifications. The following figure is an example of a possible change,
although it should be validated with new simulations.
Figure 50: Proposed wing and dam profile variation
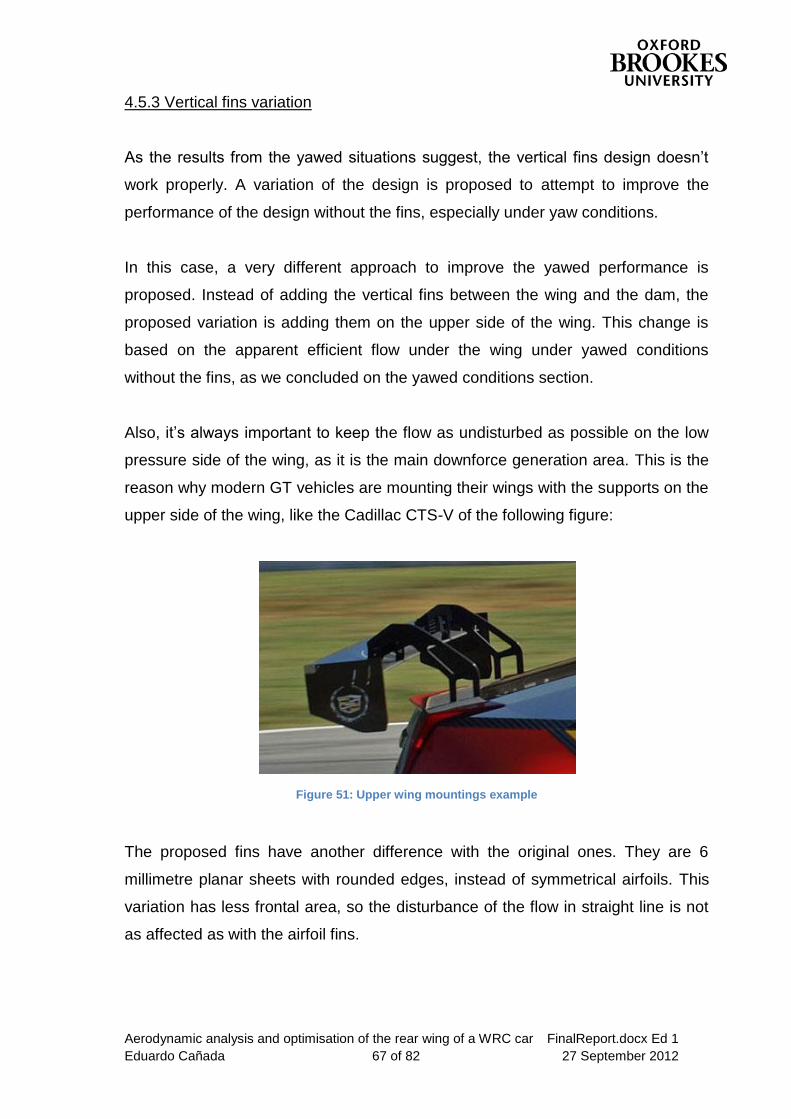
Aerodynamic analysis and optimisation of the rear wing of a WRC car FinalReport.docx Ed 1
Eduardo Cañada 67 of 82 27 September 2012
4.5.3 Vertical fins variation
As the results from the yawed situations suggest, the vertical fins design doesn’t
work properly. A variation of the design is proposed to attempt to improve the
performance of the design without the fins, especially under yaw conditions.
In this case, a very different approach to improve the yawed performance is
proposed. Instead of adding the vertical fins between the wing and the dam, the
proposed variation is adding them on the upper side of the wing. This change is
based on the apparent efficient flow under the wing under yawed conditions
without the fins, as we concluded on the yawed conditions section.
Also, it’s always important to keep the flow as undisturbed as possible on the low
pressure side of the wing, as it is the main downforce generation area. This is the
reason why modern GT vehicles are mounting their wings with the supports on the
upper side of the wing, like the Cadillac CTS-V of the following figure:
Figure 51: Upper wing mountings example
The proposed fins have another difference with the original ones. They are 6
millimetre planar sheets with rounded edges, instead of symmetrical airfoils. This
variation has less frontal area, so the disturbance of the flow in straight line is not
as affected as with the airfoil fins.
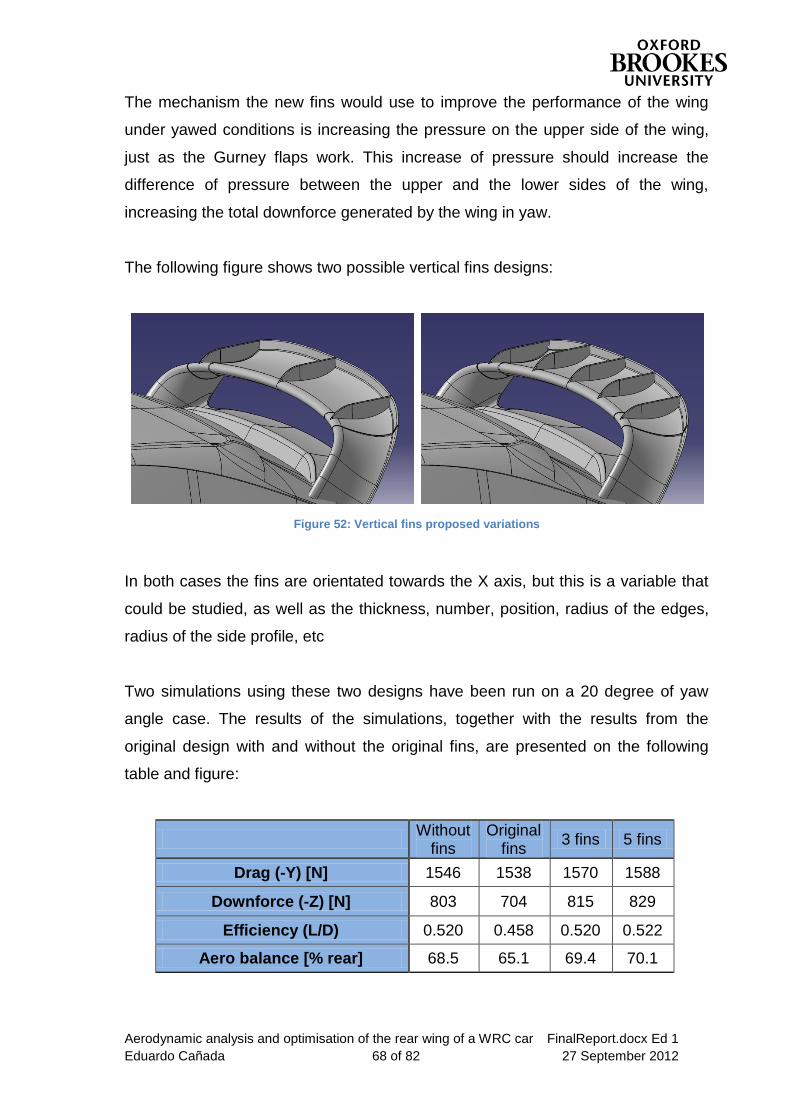
Aerodynamic analysis and optimisation of the rear wing of a WRC car FinalReport.docx Ed 1
Eduardo Cañada 68 of 82 27 September 2012
The mechanism the new fins would use to improve the performance of the wing
under yawed conditions is increasing the pressure on the upper side of the wing,
just as the Gurney flaps work. This increase of pressure should increase the
difference of pressure between the upper and the lower sides of the wing,
increasing the total downforce generated by the wing in yaw.
The following figure shows two possible vertical fins designs:
Figure 52: Vertical fins proposed variations
In both cases the fins are orientated towards the X axis, but this is a variable that
could be studied, as well as the thickness, number, position, radius of the edges,
radius of the side profile, etc
Two simulations using these two designs have been run on a 20 degree of yaw
angle case. The results of the simulations, together with the results from the
original design with and without the original fins, are presented on the following
table and figure:
Without
fins Original
fins 3 fins 5 fins
Drag (-Y) [N] 1546 1538 1570 1588
Downforce (-Z) [N] 803 704 815 829
Efficiency (L/D) 0.520 0.458 0.520 0.522
Aero balance [% rear] 68.5 65.1 69.4 70.1
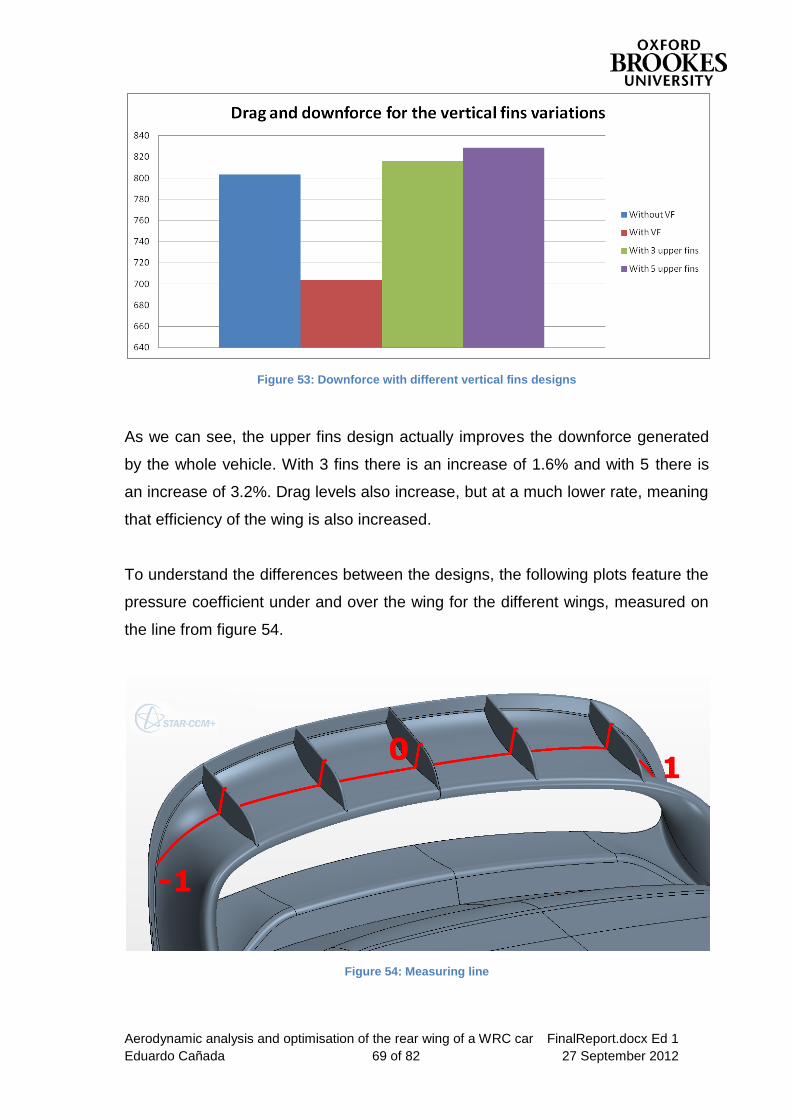
Aerodynamic analysis and optimisation of the rear wing of a WRC car FinalReport.docx Ed 1
Eduardo Cañada 69 of 82 27 September 2012
Figure 53: Downforce with different vertical fins designs
As we can see, the upper fins design actually improves the downforce generated
by the whole vehicle. With 3 fins there is an increase of 1.6% and with 5 there is
an increase of 3.2%. Drag levels also increase, but at a much lower rate, meaning
that efficiency of the wing is also increased.
To understand the differences between the designs, the following plots feature the
pressure coefficient under and over the wing for the different wings, measured on
the line from figure 54.
Figure 54: Measuring line
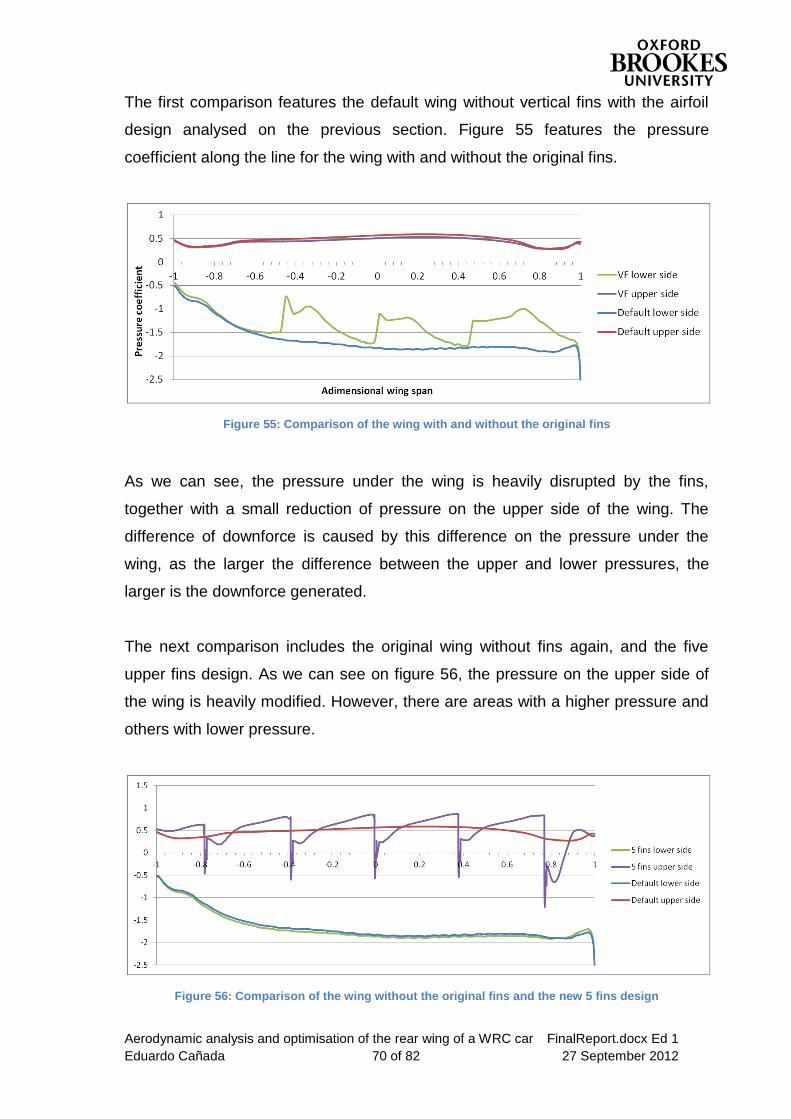
Aerodynamic analysis and optimisation of the rear wing of a WRC car FinalReport.docx Ed 1
Eduardo Cañada 70 of 82 27 September 2012
The first comparison features the default wing without vertical fins with the airfoil
design analysed on the previous section. Figure 55 features the pressure
coefficient along the line for the wing with and without the original fins.
Figure 55: Comparison of the wing with and without the original fins
As we can see, the pressure under the wing is heavily disrupted by the fins,
together with a small reduction of pressure on the upper side of the wing. The
difference of downforce is caused by this difference on the pressure under the
wing, as the larger the difference between the upper and lower pressures, the
larger is the downforce generated.
The next comparison includes the original wing without fins again, and the five
upper fins design. As we can see on figure 56, the pressure on the upper side of
the wing is heavily modified. However, there are areas with a higher pressure and
others with lower pressure.
Figure 56: Comparison of the wing without the original fins and the new 5 fins design
Aerodynamic analysis and optimisation of the rear wing of a WRC car FinalReport.docx Ed 1
Eduardo Cañada 71 of 82 27 September 2012
The source of the extra downforce generated by this design (and the 3 fins design)
is located on the upper side of it, as the areas with an increased pressure are
larger than the areas with a lower pressure, increasing the total pressure over the
wing. Also, the lower side of the wing has a slightly lower pressure along the 95%
of its length, adding another small increase to the total downforce.
The new designs were only tested on the 20 degrees of yaw case. Extra
simulations should be done to test the performance of the wing also on straight
line. However, it can be predicted that the downforce generated on straight line will
be slightly lower than the version without fins, as a small fraction of area is lost on
the upper side of the wing. However, this loss should be much smaller than the
original fins design.
An optimisation of this design could be done, as there are many variables
(previously mentioned) that should be studied. An especially interesting variable to
study would be the number of fins, as it seems that increasing them improves the
downforce of the wing. However, if too many fins are added, the performance
would start to decrease, finding the optimum number before that point.
It is also important to note that any improvement of the rear wing performance
would create a bigger pitching moment during jumps, making it harder for the
driver to keep the car stable during jumps. Any improvement on the rear of the
vehicle should be accompanied by a similar improvement on the front to minimise
this adverse effect of improving the rear wing.
Aerodynamic analysis and optimisation of the rear wing of a WRC car FinalReport.docx Ed 1
Eduardo Cañada 72 of 82 27 September 2012
5 FUTURE WORK
This project is just a general introduction into WRC aerodynamics. Because of
this, a lot of possible future work can be undertaken taking this project as base to
start from.
For instance, in order to understand further the aerodynamics of a complete car,
simulations with varying roll and pitch angles should be created. With this
information, together with yaw simulations with a smaller degree step, an aeromap
could be developed. This is a very useful tool that gives a lot of information about
the trends and behaviours of the complete car.
As mentioned on the results section; new simulations using a more detailed model
including more accurate underbody and surface details like window frames, side
mirrors, etc; should be run, including also internal flows for a more accurate result.
On the other side, if a generic shape is used for the same simulations, the results
could be applied to any WRC car, as the singularities of the specific model used
for this project would be discarded. But more importantly, it would also make it
much easier to create a model which could be tested on a wind tunnel to validate
the results from CFD.
Another important point would be confirming or invalidating the conclusion of the
rear wing fins not working properly, as its failure is probably a result of the multiple
simplifications applied to the model. The optimisation of the proposed upper fins
design could also be undertaken.
Finally, due to the heavily unsteady behaviour of vehicles’ wake, an investigation
including unsteady simulations would be important to complement this project.
Aerodynamic analysis and optimisation of the rear wing of a WRC car FinalReport.docx Ed 1
Eduardo Cañada 73 of 82 27 September 2012
6 CONCLUSIONS
From the results of the simulations undertaken on this project, we can conclude
that it is really important to design a rear wing taking into account that a rally car
must face situations far more extreme than regular racing vehicles, including
formula one cars.
For instance, rally cars must perform well even at high yaw angle cornering
(power-sliding) and with a wide range of ride heights, including low ride heights on
tarmac stages and off the ground situations during jumps.
The first analysis of this project demonstrates the benefits of using a complex
geometry including different elements like a Gurney flap and a dam under the
wing. It also explains the general trends and behaviour of a WRC car on straight
line through downforce, drag, balance, etc results.
The second analysis covers the results of simulations at different distances from
the ground, and the effects that separating from the ground has on the vehicle
stability during jumps, confirming the general behaviour already predicted on the
published literature.
The last analysis covers the high yaw situations by simulating a wide range of
angles, and analyses the effects of the part included on the wing design to
improve the stability of the car on this situation. Surprisingly, the results suggest
that the adopted solution decreases the performance of the car on this situation,
and an evaluation of the sources of this result is undertaken to conclude why it
fails
Finally, a series of variations are proposed based upon the previous conclusions.
Aerodynamic analysis and optimisation of the rear wing of a WRC car FinalReport.docx Ed 1
Eduardo Cañada 74 of 82 27 September 2012
REFERENCES
[1] Shacki and eWRC.cz, ewrc-results.com, [Online]. Available: http://ewrc-
results.com/cars.php?cid=20&title=Subaru-Impreza-WRC-08. [Accessed 25
August 2012].
[2] Jonkka, juwra.com, [Online]. Available:
http://www.juwra.com/subaru_impreza_wrc2008.html. [Accessed 12
September 2012].
[3] D. Chin, flappypaddle-heads, 25 March 2011. [Online]. Available:
http://flappypaddle-heads.blogspot.com.es/2011/03/japan-week-mitsubishi-
and-subaru.html. [Accessed 28 May 2012].
[4] TDR, La casa del Tuercas, 20 November 2011. [Online]. Available:
http://lacasadeltuercas.blogspot.com.es/2011/11/grupo-b-la-epoca-dorada-
de-los-rallyes.html. [Accessed 28th May 2012].
[5] Nealo, passionford.com, 09 October 2010. [Online]. Available:
http://passionford.com/forum/restorations-rebuilds-and-projects/369668-my-
focus-wrc.html. [Accessed 28 May 2012].
[6] J. Katz, Race Car Aerodynamics: Designing for Speed, 2nd ed.,
Cambridge: Bentley Publishers, 2006.
[7] S. McBeath, Competition Car Aerodynamics: A Practical Handbook, 2nd
ed., Sparkford: Haynes Publishing, 2011.
[8] L. Mutsaers, carblueprints.info, [Online]. Available:
http://carblueprints.info/eng/prints/subaru/subaru-impreza-5-door-2008-2.
[Accessed 29 May 2012].
[9] E. Hamidy, The Structure of Wakes of 3-D Bluff Bodies in Proximity to the
Ground, PhD Theses, Department of Aeronautics, Imperial College,
London, 1991.
[10] E. G. Duell and A. R. George, Unsteady Near Wake Flows of Ground
Vehicle Bodies, AIAA Paper 92-264-CP, AIAA 10th Applied Aerodynamics
Conference, June 1992.
[11] D. B. Sims-Williams and R. G. Dominy, An Investigation into Large Scale
Aerodynamic analysis and optimisation of the rear wing of a WRC car FinalReport.docx Ed 1
Eduardo Cañada 75 of 82 27 September 2012
Unsteady Structures in the Wake of Real and Idealized Hatchback Car
Models, SAE Paper 2001-01-1041, 2001.
[12] K. Yamane, N. Hase, S. Fujita, R. Isomura and I. Takeda, Concurrent CFD
Analysis for Development of Rear Spoiler for Hatchback Vehicles, SAE
Paper 970410, 1997.
[13] J. D. Anderson, Fundamentals of Aerodynamics, 3rd ed., New York:
McGraw-Hill, 2001.
[14] CD Adapco, Star-CCM+ help file, 2012.
[15] ‘The perfect rally car?’, Race Tech Magazine, no. 126, pp. 34 - 39, 2011.
[16] WRC, ‘wrc.com,’ 2nd March 2009. [Online]. Available:
http://www.wrc.com/news/features/wrc-explained-
aerodynamics/?fid=1418&page=708. [Accessed 7 June 2012].
[17] S. McBeath, ‘Yaw changes things’, Racecar Engineering, vol. 15, no. 12,
pp. 91-92, 2005.
[18] D. Gogel and H. Sakurai, The Effects of End Plates on Downforce in Yaw,
SAE Paper 2006-01-3647, 2006.
[19] R. G. Dominy and S. Richardson, The Aerodynamic Characteristics of a
WRC Rally Car at High Slip Angles, SAE Paper 2004-01-3508, 2004.
[20] H. Iwata, Development of MMC Rally Car, SAE Paper 983066, 1998.
[21] WRC, wrc.com, 27 July 2012. [Online]. Available:
http://www.wrc.com/news/features/latvala-reveals-finnish-jump-
secrets/?fid=17099. [Accessed 21 August 2012].
[22] Sahikan, youtube.com, 01 August 2009. [Online]. Available:
http://www.youtube.com/watch?v=cudXigEQvB8. [Accessed 02 September
2012].
[23] WRC, wrc.com, 03 December 2009. [Online]. Available:
http://www.youtube.com/watch?v=Y-R15G9nmMo&t=19m55s. [Accessed
02 September 2012].
[24] WRC, wrc.com, 30 July 2010. [Online]. Available:
http://www.wrc.com/news/friday-wrap-latvala-on-top-on-neste-oil-rally-
finland/?fid=13426. [Accessed 23 June 2012].
Aerodynamic analysis and optimisation of the rear wing of a WRC car FinalReport.docx Ed 1
Eduardo Cañada 76 of 82 27 September 2012
[25] S. Nagy, flickr.com, 26 June 2009. [Online]. Available:
http://www.flickr.com/photos/8524343@N03/3893630006. [Accessed 06
September 2012].
[26] D. Gogel and H. Sakurai, The Effects of End Plates on Downforce in Yaw,
Colorado State University, 2006.
Aerodynamic analysis and optimisation of the rear wing of a WRC car FinalReport.docx Ed 1
Eduardo Cañada 77 of 82 27 September 2012
BIBLIOGRAPHY
R. H. Barnard, Road Vehicle Aerodynamic Design, 2nd ed., Hertfordshire: Mech
Aero Publishing, 2001.
W.H. Hucho, Aerodynamics of Road Vehicles, 4th ed., Warrendale: SAE
International, 1998.
J. Katz and L. Dykstra, Effect of Wing/Body lnteraction on the Aerodynamics of
Two Generic Racing Cars, SAE Paper 920349, 1992.
W. F. Milliken and D. L. Milliken, Race Car Dynamics, SAE International, chapter 3
and 15, 1995.
Y. Okada, T. Nouzawa, T. Nakamura and S. Okamoto, Flow Structures above the
Trunk Deck of Sedan-Type Vehicles and Their Influence on High-Speed Vehicle
Stability, SAE Paper 2009-01-0004, 2009.
S. Shoop, B. Coutermarsh and J. Stanley, High-Speed Vehicle Operations on
Gravel Surfaces, SAE Paper 2010-01-0640, 2010.
A. Huminic and G. Huminic, On the Aerodynamics of the Racing Cars, SAE Paper
2008-01-0099
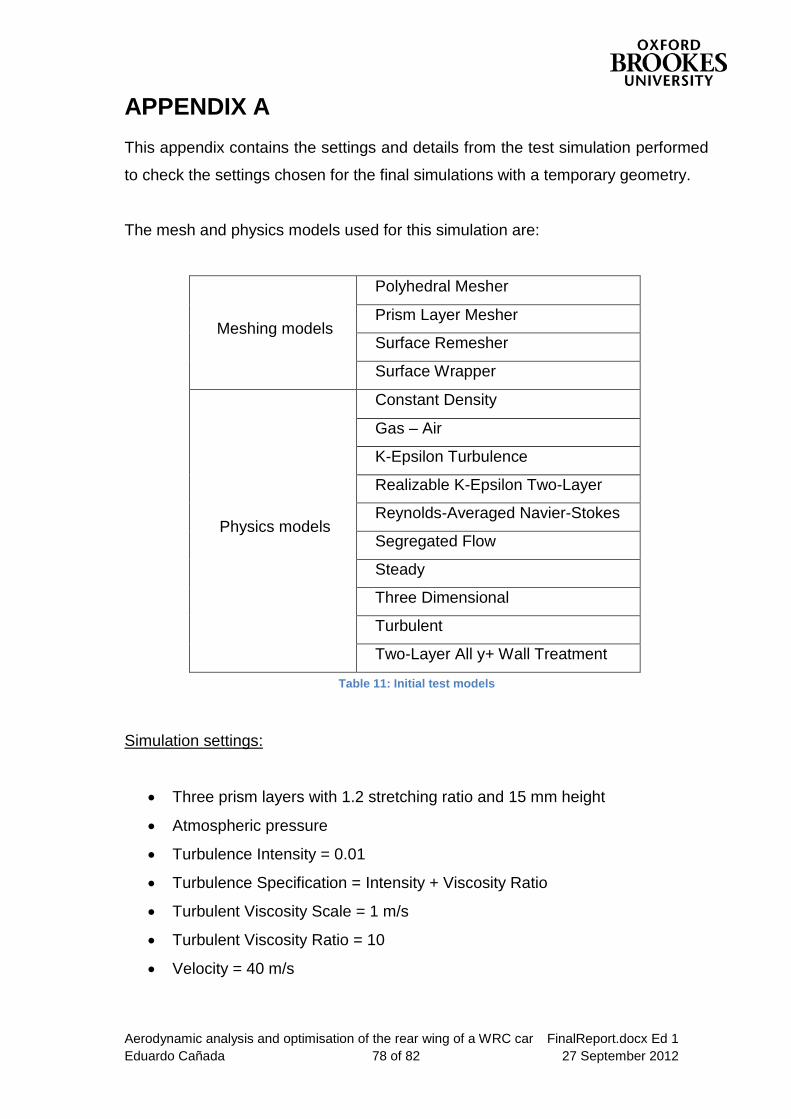
Aerodynamic analysis and optimisation of the rear wing of a WRC car FinalReport.docx Ed 1
Eduardo Cañada 78 of 82 27 September 2012
APPENDIX A
This appendix contains the settings and details from the test simulation performed
to check the settings chosen for the final simulations with a temporary geometry.
The mesh and physics models used for this simulation are:
Meshing models
Polyhedral Mesher
Prism Layer Mesher
Surface Remesher
Surface Wrapper
Physics models
Constant Density
Gas – Air
K-Epsilon Turbulence
Realizable K-Epsilon Two-Layer
Reynolds-Averaged Navier-Stokes
Segregated Flow
Steady
Three Dimensional
Turbulent
Two-Layer All y+ Wall Treatment
Table 11: Initial test models
Simulation settings:
Three prism layers with 1.2 stretching ratio and 15 mm height
Atmospheric pressure
Turbulence Intensity = 0.01
Turbulence Specification = Intensity + Viscosity Ratio
Turbulent Viscosity Scale = 1 m/s
Turbulent Viscosity Ratio = 10
Velocity = 40 m/s
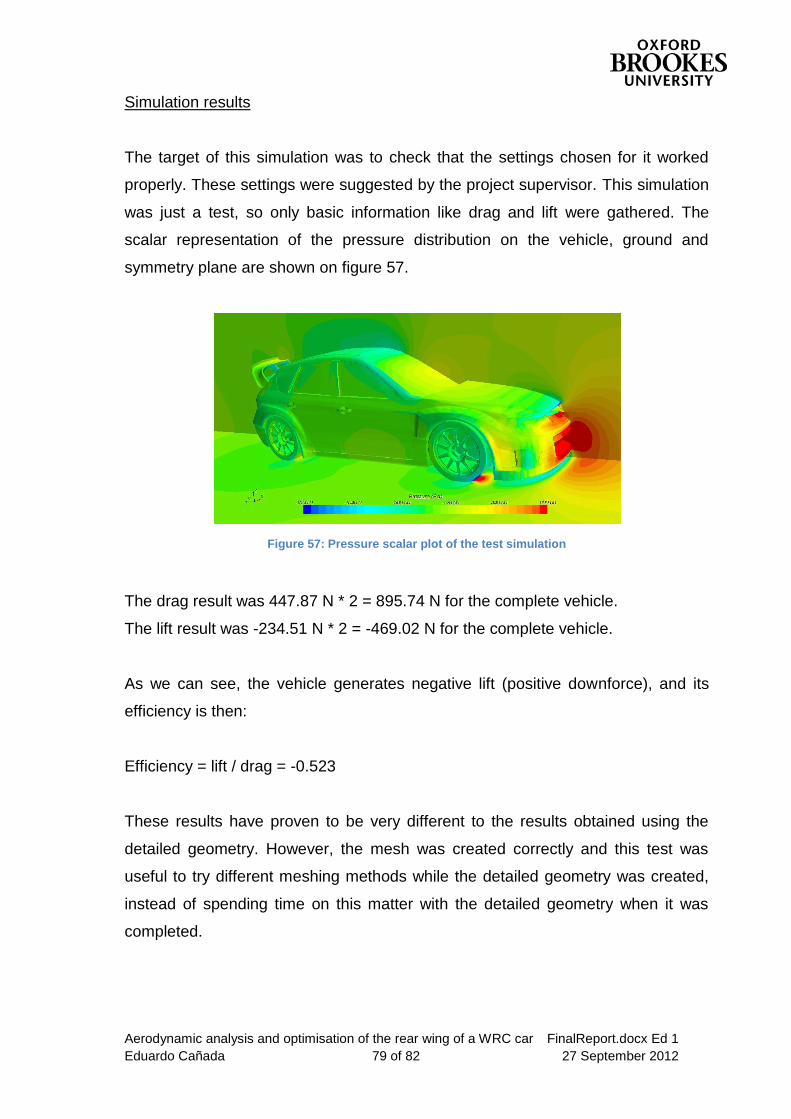
Aerodynamic analysis and optimisation of the rear wing of a WRC car FinalReport.docx Ed 1
Eduardo Cañada 79 of 82 27 September 2012
Simulation results
The target of this simulation was to check that the settings chosen for it worked
properly. These settings were suggested by the project supervisor. This simulation
was just a test, so only basic information like drag and lift were gathered. The
scalar representation of the pressure distribution on the vehicle, ground and
symmetry plane are shown on figure 57.
Figure 57: Pressure scalar plot of the test simulation
The drag result was 447.87 N * 2 = 895.74 N for the complete vehicle.
The lift result was -234.51 N * 2 = -469.02 N for the complete vehicle.
As we can see, the vehicle generates negative lift (positive downforce), and its
efficiency is then:
Efficiency = lift / drag = -0.523
These results have proven to be very different to the results obtained using the
detailed geometry. However, the mesh was created correctly and this test was
useful to try different meshing methods while the detailed geometry was created,
instead of spending time on this matter with the detailed geometry when it was
completed.
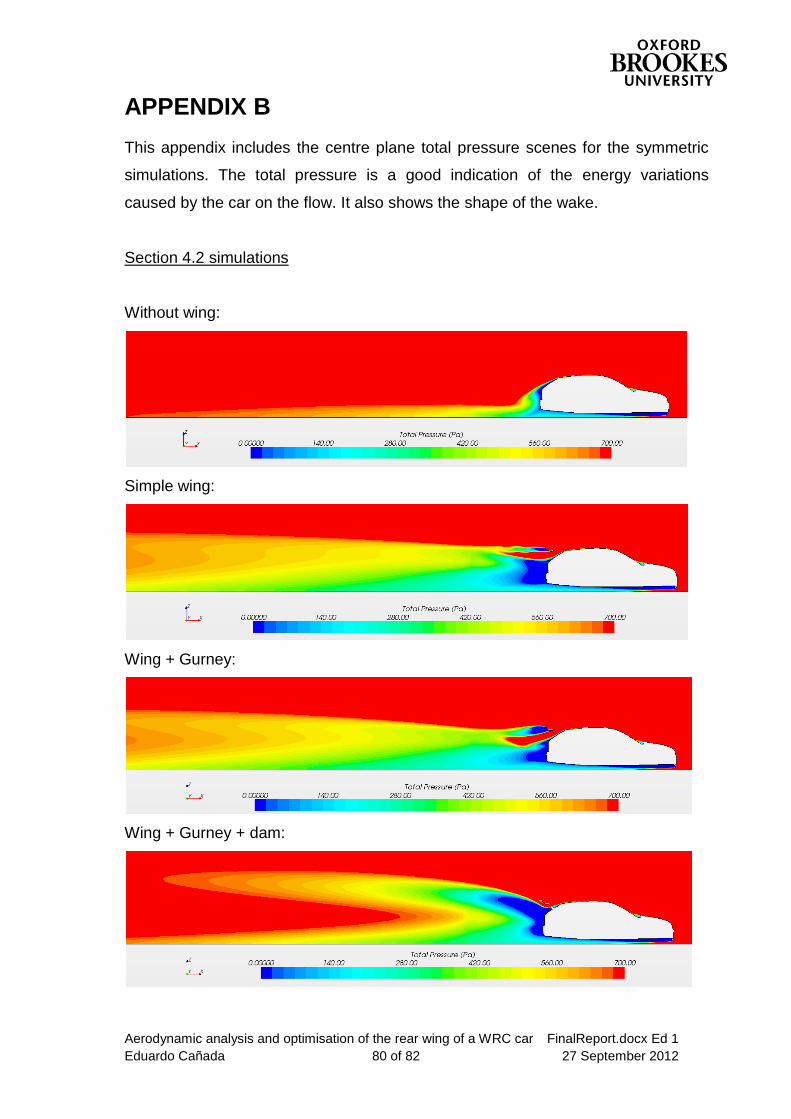
Aerodynamic analysis and optimisation of the rear wing of a WRC car FinalReport.docx Ed 1
Eduardo Cañada 80 of 82 27 September 2012
APPENDIX B
This appendix includes the centre plane total pressure scenes for the symmetric
simulations. The total pressure is a good indication of the energy variations
caused by the car on the flow. It also shows the shape of the wake.
Section 4.2 simulations
Without wing:
Simple wing:
Wing + Gurney:
Wing + Gurney + dam:
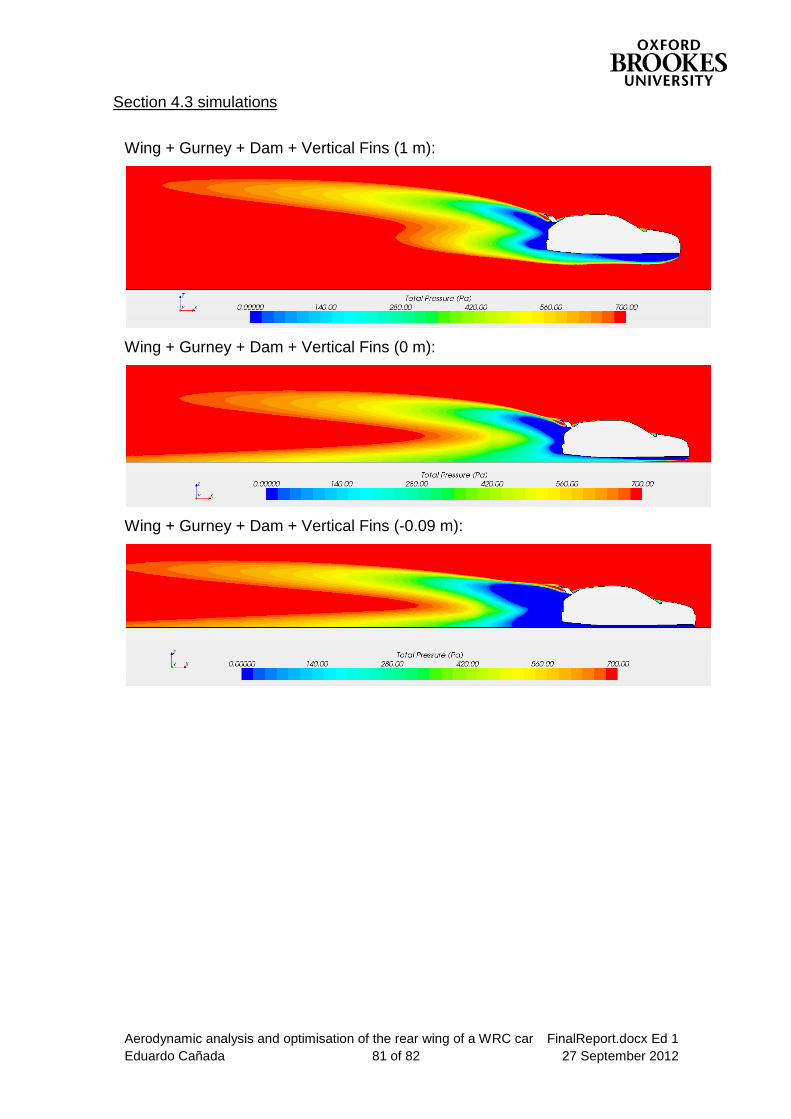
Aerodynamic analysis and optimisation of the rear wing of a WRC car FinalReport.docx Ed 1
Eduardo Cañada 81 of 82 27 September 2012
Section 4.3 simulations
Wing + Gurney + Dam + Vertical Fins (1 m):
Wing + Gurney + Dam + Vertical Fins (0 m):
Wing + Gurney + Dam + Vertical Fins (-0.09 m):

Aerodynamic analysis and optimisation of the rear wing of a WRC car FinalReport.docx Ed 1
Eduardo Cañada 82 of 82 27 September 2012
END OF DOCUMENT