ms q exactive tomorrows quantitation › tfs-assets › cmd › ... · monitoring and management...
TRANSCRIPT

Tomorrow's quantitation
Table of contents
Introduction
Food safety testing
Environmental contaminants analysis
Clinical research
Forensic toxicology
Pharmaceutical discovery

Introduction
For laboratories performing quantitation, liquid chromatography-triple quadrupole mass spectrometry (LC-QQQ MS) technology has been the standard for quantitation of many types of compounds, from pesticide residues in food and feed, to testosterone in plasma and urine for research applications. Coupling these techniques is powerful due to their combined selectivity and sensitivity. Additionally, quadrupole-based mass analyzers provide reliable, cost-efficient quantitation and identification of target analytes.
With the introduction of Thermo Scientific™ hybrid quadrupole-Orbitrap™ high-resolution accurate-mass (HRAM) mass spectrometers, a new equally powerful alternative for quantitation has emerged. Orbitrap mass spectrometer technology has revolutionized the field of MS by combining high-performance quadrupole precursor selection with HRAM detection to provide superior resolution and selectivity.
Regardless of which technique is used, the ability to develop robust assays is possible with both triple quadrupole and HRAM instruments. Both technologies enable confident quantitation in a variety of sample types. Choosing between either technique for targeted quantitation requires asking the following questions:
• How important is speed, sensitivity, and selectivity for the analyses?
• Will samples need to be potentially interrogated in the future?
• Even if your analyses are focused on known analytes, could that change in the future?
• Are the samples complex or unique?
• What is your budget and how flexible is it?
Evolution of techniques used for quantitation Table of contents
Introduction
Food safety testing
Environmental contaminants analysis
Clinical research
Forensic toxicology
Pharmaceutical discovery

Introduction
Targeted quantitation: choosing the right LC-MS system
If a laboratory is focused on gaining ultimate sensitivity for their analyses, QQQ MS is the best option. These types of instruments consist of tandem quadrupole mass analyzers where, when operated in selected-reaction monitoring (SRM) mode, two of the quadrupoles (referred to as Q1 and Q3) act as double mass filters, and the other, Q2, between Q1 and Q3, acts as the collision cell. The SRM mode provides short QQQ dwell times, permitting the detection of multiple different transitions and reliable analysis of large quantities of samples. New, higher-end QQQ instruments enhance selectivity by increasing the width of Q1 and Q3 to enable high-resolution selected reaction monitoring (H-SRM), which is beneficial for analyzing complex matrices.
Although triple quadrupole MS instruments provide the highest sensitivity for targeted quantitation, HRAM MS instruments should be considered for quantifying low molecular weight compounds in complex samples. HRAM instruments provide market-leading resolving power to separate ions of interest from matrix ions, providing improved selectivity. As shown in approximately 5000 peer-reviewed publications, Orbitrap mass spectrometer technology provides HRAM, together with a high dynamic range, to rigorously characterize complex mixtures.
Why is high resolution important? High resolving power is particularly important for experiments involving complex mixtures, such as biological, environmental, and food samples generated from a matrix. These samples contain a significant number of background ions in addition to the analytes of interest. Due to the masking effect of isobaric interferences, high resolving power can make the difference between detecting and not detecting analytes at low concentrations. In other words, accurate quantitation relies on high selectivity, which is the ability to resolve compounds of interest from background interferences.
Triple quadrupole MS instruments can only perform targeted screening using predefined lists of analytes. If the need to perform untargeted screening arises, HRAM instruments become extremely useful because they collect data on all analytes in each sample, allowing retrospective analysis of that data. For untargeted and targeted screening applications, HRAM instruments provide retention time, isotopes, fragment ions, and exact mass. In addition to resolving the ions of interest from the background, a key advantage of HRAM instruments is that they can be used to determine the elemental composition of individual fragment ions allowing differentiation between structurally similar analytes.
Both technologies deliver robustness, reproducibility, and reliability for any application. Deciding which technology to purchase really depends on current and anticipated application needs and your organization’s profitability goals.
Evolution of techniques used for quantitation
Needs HRAM QQQ
Untargeted screening
Targeted screening
Untargeted and targeted quantitation
Targeted quantitation only
Retrospective analysis
Advantages of HRAM and QQQ LC/MS technologies
= Not applicable = Poor = Good = Better = Best
Table of contents
Introduction
Food safety testing
Environmental contaminants analysis
Clinical research
Forensic toxicology
Pharmaceutical discovery

© 2019 Thermo Fisher Scientific Inc. All rights reserved. All trademarks are the property of Thermo Fisher Scientific and its subsidiaries unless otherwise specified. AD65600-EN 1019S
MS Support CenterOne resource for your instrument and software FAQs
Time spent searching for answers to pressing everyday questions results in a frustrating out-of-the-box experience with new systems and future undesired downtime. Keep your laboratory moving with our online Mass Spectrometry Instrument and Software Support Centers. As you get started or to retain everyday success, access a host of frequently asked questions (FAQs) to support MS instrument operation, application based technical resources and how-to videos to ensure optimal results for your analyses.
Find out more at thermofisher.com/mssupport
Table of contents
Introduction
Food safety testing
Environmental contaminants analysis
Clinical research
Forensic toxicology
Pharmaceutical discovery

Introduction
Data analysis: making the most of your data and your time
Acquiring data is easy, it’s making sense of it that’s difficult.
Whether you’re acquiring data from QQQ or high-resolution mass spectrometers, you expect these platforms to ‘just work’ and to deliver high-quality data. Turning these potentially large and complex datasets into knowledge is a common laboratory bottleneck.
Choosing the right tools to screen and quantify, and potentially elucidate unknowns can have a significant impact on laboratory productivity and efficiency.
Additional laboratory challenges can include:
• Multiple instruments and software packages to learn
• Increasing or changing regulations
• Emerging contaminants, designer drugs, and expanded screening panels
• Rapid sample turnaround requirements
The solutions chosen can address these challenges with efficient method development, data acquisition, analysis, reporting, management, knowledge sharing, and remote monitoring and system management.
Quantitation softwareTable of contents
Introduction
Food safety testing
Environmental contaminants analysis
Clinical research
Forensic toxicology
Pharmaceutical discovery

Introduction
High-throughput data analysis
When you have large numbers of samples and analytes, rapid access to confident results should not be hampered by complicated software not designed for your application. Using Thermo Scientific™ TraceFinder™ software, you can acess environmental, clinical, food safety, forensics and pharma/biopharma specific nomenclature, and customize access, views, and control based on the needs of your laboratory and individual users.
Tailored views and simplification ensures TraceFinder software is easy to learn, and more productive with rapid access to reporting high-quality results obtained from IC, LC and GC quadrupole and high-resolution mass spectrometers. Pre-configured methods, reporting templates, and compound databases streamlines tailoring of assays. Need information quickly? Real-time processing provides near-instant access to information, avoiding lengthy post-acquisition processing.
The ability to quantify, screen with quantitation, and to identify unknowns by accessing NIST, Thermo Scientific™ mzVault™ and other libraries provides exceptional versatility to access the full value of your data. Now you can screen for what you know while capturing tomorrow’s threats.
Regulated and enterprise data analysis
Many applications are experiencing increasing requirements to acquire and process data under compliant conditions. Streamlining multiple routine quantitative MS workflows regardless of inlet, while keeping up with evolving regulations (e.g. GLP/GMP and 21 CFR part 11) is easier using Thermo Scientific™ Chromeleon™ Chromatography Data System (CDS) software.
Drive productivity through consistent control of multiple laboratory instruments, open access capabilities, and lab management software. From method creation to reporting, these capabilities can be conveniently bundled into eWorkflows, allowing anyone to access, run, and report specific assays based upon their access privileges.
Additional benefits:
• Multiple instrument workflows for quantitation: Unified workflows for routine quantitative analyses using GC, LC, and IC instruments with QQQ or HRAM-MS instruments
• Consistent, flexible, and customizable: With one software to learn across multiple instruments, and the flexibility to view and report data how you need to, training becomes easy
• First CDS to include MS workflows
• Control your lab, or all your labs: It’s not just complete integration of Thermo Scientific™ hardware, but of more than 500 instrument modules from over 20 LC and GC vendors that enable you to streamline your lab, or multiple labs globally, across your enterprise
Quantitation software
See what you need to see, when you need it
Whether you are quantifying, screening, screening with quantitation, or performing unknown identification, you can display what you need in a way that suits your work. With easy flagging and tolerance setting data filtering and visualization tools, understanding your samples isn’t laborious with TraceFinder software.
Table of contents
Introduction
Food safety testing
Environmental contaminants analysis
Clinical research
Forensic toxicology
Pharmaceutical discovery

Introduction
Monitor your MS analyses anywhere, anytime
The ability to remotely access and manage your LC-MS and GC-MS systems lets you focus on other important tasks during your day.
Using the Thermo Scientific™ Almanac™ phone App, Instrument Connect or web-based application, you can check real-time system status and acquisitions, set up automated e-mails to notify you of a completed acquisition or error, schedule instrument access, monitor utilization, or submit information to service personnel to aid in system diagnostics.
• What’s going on? “At a glance” dashboards provide high-level information for all your connected systems
• Need more information? View sequence status and real-time data acquisition
• No more scribbled notes or lost instrument logbooks: Instrument logbooks document maintenance history, and allow users to record and add relevant information
Quantitation software
With customizable reports, understanding utilization of laboratory instrumentation over time can increase productivity, harmonize utilization across systems, and faciliate planning.
Table of contents
Introduction
Food safety testing
Environmental contaminants analysis
Clinical research
Forensic toxicology
Pharmaceutical discovery

© 2019 Thermo Fisher Scientific Inc. All rights reserved. All trademarks are the property of Thermo Fisher Scientific and its subsidiaries unless otherwise specified. AD65600-EN 1019S
Almanac web-based monitoring and management
Monitor your mass spectrometry analyses anywhere, anytime The ability to remotely access and manage your MS systems lets you focus on value-added activities during your day. With the Thermo Scientific™ Almanac™ web-based application, you can check real-time system status and acquisitions, set up automated e-mails to notify you of a completed acquisition or error, schedule instrument access, monitor system utilization, or if you require assistance, send service files to aid in system diagnostics and maximize your up-time.
Find out more at thermofisher.com/almanac
Table of contents
Introduction
Food safety testing
Environmental contaminants analysis
Clinical research
Forensic toxicology
Pharmaceutical discovery
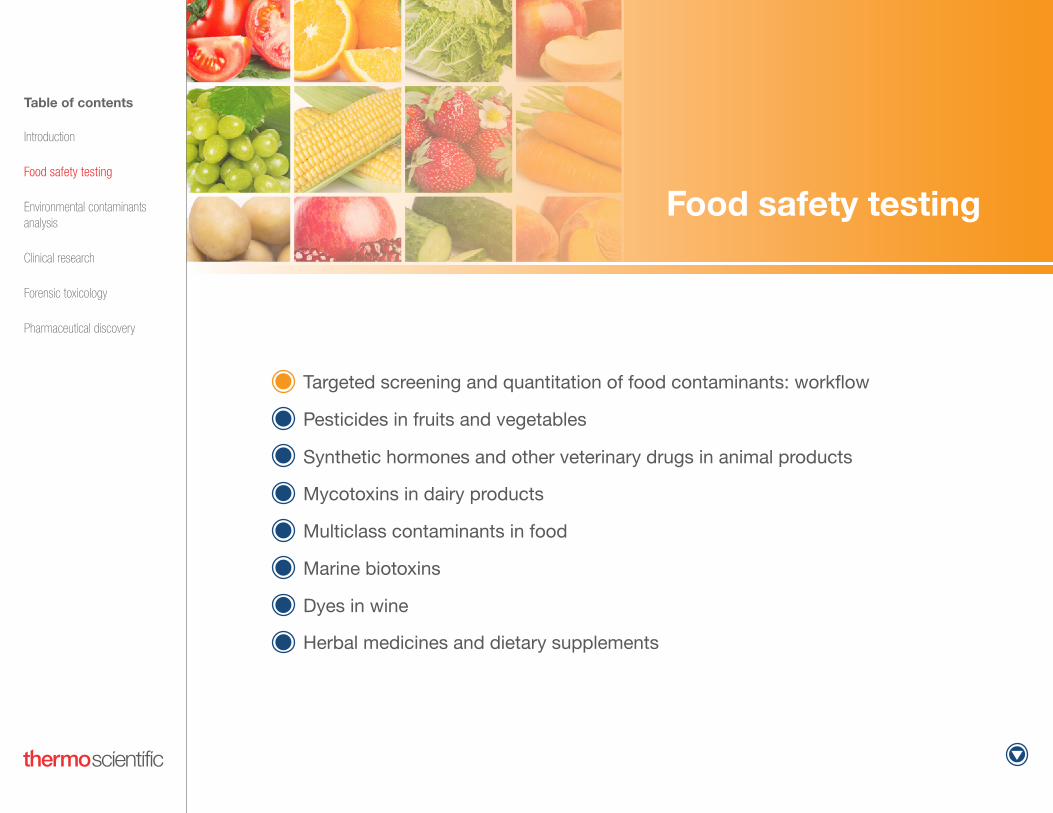
Targeted screening and quantitation of food contaminants: workflow
Pesticides in fruits and vegetables
Synthetic hormones and other veterinary drugs in animal products
Mycotoxins in dairy products
Multiclass contaminants in food
Marine biotoxins
Dyes in wine
Herbal medicines and dietary supplements
Food safety testing
Table of contents
Introduction
Food safety testing
Environmental contaminants analysis
Clinical research
Forensic toxicology
Pharmaceutical discovery

Ensuring the safety of food supplies is of utmost importance for public health and safety. Screening and quantitating foodstuffs for known and unknown contaminants, such as pesticides, herbicides, antibiotics, and adulterants in complex matrices must be fast and simple. Samples are processed and contaminants are extracted using various methods such as QuEChERS and online and offline solid phase extraction (SPE), and then are analyzed by LC-MS/MS using either QQQ or Orbitrap mass spectrometer technology. Data is scrutinized and the amount of contaminate is determined using automated software.
Food safety testing
Targeted screening and quantitation of food contaminants: workflow
The FarmWhere our crops and food begin
Application of PesticidesTo keep our crops healthy from the pests and diseases and improve crop yields.
Analysis by LC-MS/MSPerform targeted screening and/or quantitation using HRAM MS or QQQ MS, depending upon the experimental requirements
Simplified Data AnalysisAutomated data analysis using TraceFinder or Chromeleon CDS software
Sample Extraction StepsHomogenize, SPE or QuEChERS, spin to remove matrix, and dispense in HPLC vial
Table of contents
Introduction
Food safety testing
Environmental contaminants analysis
Clinical research
Forensic toxicology
Pharmaceutical discovery

Pesticides in fruits and vegetables: HRAM technology application note
Food safety testing
Pesticide residues screening analysis in tea and honey using a Q Exactive Focus High-Resolution Mass Spectrometer
Pesticide residues screening in tea and honey
European Commission directive EC 396/2005 presents significant analytical challenges with respect to low limits of quantification and high number of target pesticide-residue analytes. Thermo Scientific Application Note 665 validated a multi-residue Thermo Scientific™ Q Exactive Focus™ mass spectrometer method for high-throughput screening and semi-quantitation of 328 target pesticide residues in tea and honey matrices at or below legislative requirements. Leveraging HRAM as a highly selective detection mechanism, the method enabled convenient, fast, and effective determination of hundreds of polar to non-polar pesticides in difficult matrices.
Method selectivity was evaluated by comparing blank and spiked samples (n=5) based on the accurate mass of the analyte at the specified retention time window. Full-scan-based isotopic pattern (IP) match, presence of fragment ions (FI), and high-resolution library match (LS) were also applied to make identifications, but only mass accuracy and retention time for the parent ion and presence of FI were taken as identification criteria. False positives were less than 3% of the total number of detectable compounds. Calibration curve linearity from 0 to 100 ng/mL was better than 0.985, demonstrating the effectiveness of the method for quantitative analysis. Instrument detection limits (IDL) for 315 compounds in standard solution, 297 in tea matrix, and 305 compounds in honey matrix were at or lower than 10 ng/g. Intermediate method precision values (%RSD) for each matrix at 10 ng/g in 6 replicates were within 25% for the vast majority (266) of target compounds.
Relative percentages of different IDL values [ng/g] for the target compounds (328) in solvent, tea, and honey matrices. More than 85% of target compounds can be detected at ≤10 ng/g, and ~70% of target compounds can be detected at ≤1 ng/g.
80
16
2 2
Solvent
67
23
4 5
Tea
71
22
3 4
Honey
IDL ≤ 1 ppb
IDL < 10 ppb
10 ppb < IDL
Not detectable
Table of contents
Introduction
Food safety testing
Environmental contaminants analysis
Clinical research
Forensic toxicology
Pharmaceutical discovery

Pesticides in fruits and vegetables: HRAM technology application note
Food safety testing
Quantitative and Qualitative Confi rmation of Pesticides in Beet Extract Using a Hybrid Quadrupole-Orbitrap Mass Spectrometer
Quantitative and qualitative confirmation of pesticides in beet extract
By specifying limits of 10 μg/kg (ppb) for pesticide residues for which no maximum residue levels (MRLs) have been established, the regulations set forth by the EU and Japan are among the most stringent in the world. These regulations have fueled the need for faster and more sensitive analytical methods for cost-efficient, high-throughput screening and quantitation of multi-class pesticide residues. Thermo Scientific Application Note 617 presents an approach that uses a full-scan data-dependent MS/MS (FS-ddMS2) Q Exactive Focus mass spectrometer method with HRAM library searching and fragment confirmation. Spiked matrix samples were analyzed by HRAM LC-MS/MS to generate calibration curves and quantitate target compounds. Preset confirmation settings streamlined method development. Data processing and analysis was performed using TraceFinder software with the environmental and food safety HRAM spectral library.
The benchtop Q Exactive Focus mass spectrometer provided easy access to full quantitative, confirmation and screening data in a single injection. The HRAM data enabled quantification of the compounds over a wide dynamic range (0.05–200 ng/mL) with linear fit, correlation better than 0.99, and %RSD below 15%. Confirmation by the precursor-selected MS/MS permitted use of spectral and library matching and pattern recognition within TraceFinder software.
Increasingly, more and more compounds are being analyzed in a single run, which can cause issues with co-elutors.The HRAM MS/MS spectral library and compound database is fully integrated and searchable using TraceFinder software to identify compounds with high levels of confidence. An Azoxystrobin library match confirmation with fragmentation confirmation at 1 ppb, shows a library match score of 80% confidence is shown in the lower right pane.
Table of contents
Introduction
Food safety testing
Environmental contaminants analysis
Clinical research
Forensic toxicology
Pharmaceutical discovery

Food safety testing
Pesticides in fruits and vegetables: HRAM technology in peer-reviewed publications
Del Mar Gómez-Ramos et al. applied the Thermo Scientific™ Q Exactive™ mass spectrometer to LC-MS analysis of 139 pesticide residues in QuEChERS extracts of tomato, pepper, orange and green tea.1 An analysis of 100 real samples was performed to evaluate the mass spectrometer’s identification and quantitation capability and the results were compared to a QQQ MS/MS analysis of the same samples. When the authors analyzed the samples using QQQ MS/MS, the results were consistent with those produced by the Q Exactive mass spectrometer–the same pesticides were found and false positives and false negatives were not reported. The authors noted that compared to the QQQ instrument, the Q Exactive mass spectrometer increased selectivity and, in full-scan mode, permitted retrospective analysis of data.
Wang et al. applied the Q Exactive mass spectrometer to LC-MS analysis of 166 pesticide residues in fruits and vegetables.2 Pesticides were extracted using the QuEChERS method. Full-scan data (full MS) were used for quantitation. Data-dependent MS/MS (ddMS2) product-ion spectra were used for confirmation. Matrix-matched standard calibration curves with isotopically labeled standards, or chemical analogues as internal standards, were used for quantitation. The authors evaluated overall recovery, intermediate precision, and measurement uncertainty. Approximately 90.3 to 91.5% of the pesticides had good recoveries between 81 and 110%, 92.1 to 97.6% had intermediate precision of ≤ 20%, and 89.7 to 95.2% had measurement uncertainty of ≤ 40%. Confirmation of targets was based on a mass accuracy ≤ 5 ppm and LC retention time tolerance within ±2.5%. The authors concluded that for quantitation and confirmation of pesticide residues in fresh fruits and vegetables, the Q Exactive mass spectrometer demonstrated good performance.
1. Del Mar Gómez-Ramos, M.; Rajski, Ł.; Heinzen, H.; Fernández-Alba, A. R. Liquid chromatography Orbitrap mass spectrometry with simultaneous full scan and tandem MS/MS for highly selective pesticide residue analysis. Anal. Bioanal. Chem. 2015 Aug; 407(21):6317-26.
2. Wang, J.; Chow, W.; Leung, D.; Chang, J. Application of ultrahigh-performance liquid chromatography and electrospray ionization quadrupole orbitrap high-resolution mass spectrometry for determi-nation of 166 pesticides in fruits and vegetables. J. Agric. Food Chem. 2012, Dec 12;60(49):12088-104.
3. Wang, J.; Chow, W.; Chang, J.; Wong, J. W. Ultrahigh-performance liquid chromatography electrospray ionization Q-Orbitrap mass spectrometry for the analysis of 451 pesticide residues in fruits and vegetables: method development and validation. J. Agric. Food Chem. 2014, Oct 22;62(42):10375-91.
Wang et al. went on to apply the Q Exactive mass spectrometer to the determination of 451 pesticide residues in ten fruit and vegetable matrices.3 As before, the QuEChERS method was used to extract target pesticides. Full-scan data were used for quantitation and full MS/dd-MS2 generated product ion spectra were used to identify compounds. To achieve optimal method accuracy, quantitation was performed using matrix-matched standard calibration curves along with isotopically labeled standards, or a chemical analogue, as internal standards. The method was validated based on overall recovery, intermediate precision, and measurement uncertainty. In the ten matrices studied, 94.5% of the pesticides in fruits and 90.7% in vegetables had recoveries between 81 and 110%; 99.3% of the pesticides in fruits and 99.1% of the pesticides in vegetables had an intermediate precision of ≤ 20%; and 97.8% of the pesticides in fruits and 96.4% of the pesticides in vegetables showed measurement uncertainty of ≤ 50%. The measurement uncertainty met the recommended default value of the European Commission SANCO/12495/2011 method validation and quality control procedures for pesticide residues analysis in food and feed. The authors concluded that the method demonstrated acceptable performance for the quantitation of pesticide residues in fruits and vegetables. Further, full MS/dd-MS2 with library matching demonstrated the potential to improve pesticide identification in routine practice.
• Attain selectivity surpassing QQQ instruments• Analyze full-scan data retrospectively
Benefits of HRAM technology
Table of contents
Introduction
Food safety testing
Environmental contaminants analysis
Clinical research
Forensic toxicology
Pharmaceutical discovery

Pesticides in fruits and vegetables: HRAM technology in peer-reviewed publications
Because complex matrices present a challenge to fast and accurate screening and quantitation of pesticides in food, Yang et al. studied the relationship between matrix effects and LC separation and elution of pesticides and matrix components using an Orbitrap mass spectrometer.4 The study used two LC columns containing different adsorbents. The 108 samples were prepared in solvent and five different sample matrices (avocado, spinach, orange, hazelnut, and honey) using calibration standards of 381 pesticides at three dilution levels of 1×, 1/10×, and 1/100×.
Principal component analysis and slope ratios of calibration curves demonstrated that the 1/100× sample dilution could minimize ion suppression (matrix effects) for most of the pesticides analyzed. If a pesticide coeluting with matrix components had a peak intensity of 25 times or higher, the suppression for the pesticide persisted to 1/100× dilution.
The effect and optimization of mass spectrometer parameters on the analysis of pesticide residues in complex food matrices is of great interest. Rajski et al. evaluated of the impact of Orbitrap mass spectrometer operating parameters such as resolution on analytical performance.5 Analyses were performed on QuEChERS extracts of tomato, pepper, orange, and green tea. The extracts were spiked with 170 pesticides at concentrations of 10 μg/kg, 50 μg/kg, 100 μg/kg, and 500 μg/kg and were diluted 5-fold prior to UHPLC-MS analysis in the full-scan mode. Three resolution settings—17,500, 35,000, and 70,000—were tested at each concentration level.
Using a resolution setting of 17,500 with 5 ppm of mass tolerance, the percent pesticides detected at 10 μg/kg ranged from 91% in tomato to 83% in green tea. The percent pesticides detected increased when higher resolution settings were used. Analysis at 35,000 resolution produced better results—peak areas were more reproducible and more pesticides were detected—and was sufficient for analysis of the tomato, pepper and orange matrices. Green tea, the most problematic matrix, required analysis at 70,000 resolution. The rates of compounds detected at 70,000 resolution ranged from 98% in tomato to 88% in green tea, thus the authors determined the resolution of 70,000 to be best with the smallest percentage of false negatives at low concentrations. False negative detects were mainly due to a lack of sensitivity for a particular compound, combined with ion suppression effects of the matrix.
Reproducibility improved at resolution levels of 35,000 or higher. Linearity was evaluated from 2–100 ng/mL (10–500 μg/kg in the sample). Unlike other high-resolution MS technologies such as TOF, the Orbitrap mass spectrometer did not experience poor linearity due to detector saturation. The results obtained in this study were comparable those obtained using QQQ MS technology.
Food safety testing
4. Yang, P.; Chang, J. S.; Wong, J. W.; Zhang, K.; Krynitsky, A. J.; Bromirski, M.; Wang, J. Effect of Sample Dilution on Matrix Effects in Pesticide Analysis of Several Matrices by Liquid Chromatogra-phy-High-Resolution Mass Spectrometry. J. J. Agric. Food Chem. 2015, Jun 3;63(21):5169-77.
5. Rajski, Ł.; Gómez-Ramos Mdel, M.; Fernández-Alba, A. R. Large pesticide multiresidue screening method by liquid chromatography-Orbitrap mass spectrometry in full scan mode applied to fruit and vegetables. J. Chromatogr. A. 2014, Sep 19;1360:119-27.
Table of contents
Introduction
Food safety testing
Environmental contaminants analysis
Clinical research
Forensic toxicology
Pharmaceutical discovery

Pesticides in fruits and vegetables: HRAM technology in peer-reviewed publications
Zomer et al. developed and validated a Q Exactive mass spectrometer-based method using DIA for the simultaneous quantitation, identification, and qualitative screening of pesticides in fruits and vegetables.6 TraceFinder software was used to process data. Both quantitative and qualitative performance was evaluated. The goal of the quantitative assessment was to determine whether non-targeted full-scan MS can replace QQQ MS. Quantitative performance was assessed by spiking 184 pesticide compounds in lettuce and orange matrices at 10 and 50 ng/g and quantitative validation was performed according SANCO/12571/2013. The goal of the qualitative assessment was to determine the ability of the method to detect the presence or absence of pesticides in an automated fashion. Qualitative performance was tested by analyzing nine additional matrices (apple, French bean, broccoli, carrot, celery, grape, leek, nectarine, and tomato) spiked with the same 184 compounds at 10, 50, and 200 ng/g. Reproducibility of qualitative performance was tested by repeating the analysis on new extracts, about 4 weeks later.
Data-independent acquisition provided a fully non-targeted approach for data acquisition. As described by the authors, a full-scan acquisition event without fragmentation at resolving power 70,000 was followed by five consecutive DIA fragmentation events at resolving power 35,000. According to the authors, the advantages of using a full-scan technique are that it is not necessary to decide or know beforehand which compounds should be targeted and the ease with which the number of compounds in a method can be increased beyond the practical maximum number of compounds typical of a QQQ MS method.
The quantitative validation demonstrated that the majority of the compounds met the criteria for trueness and precision set forth in SANCO/12571/2013. For the qualitative validation of the untargeted screening capabilities of the method, an overall detection rate of 92% was achieved at 10 ng/g, which increased to 98% at 200 ng/g. A screening detection limit (SDL) of 10 ng/g was achieved for 134 of the pesticides. For 39 of the compounds, the SDL was 50 ng/g. For two pesticides, the SDL was 200 ng/g. For the other nine compounds no SDL could be established. The recommended ion ratio identification criteria were met for 93% of the detected pesticide/matrix/concentration combinations. Based on these results, the authors concluded that the method can be used to combine, in one measurement, the quantification and identification of pesticides typically detected using QQQ MS/MS with qualitative screening to find a range of less frequently detected compounds. Qualitative screening uses the same data with another data-processing approach involving automatic detection by the TraceFinder software.
Food safety testing
6. Zomer, P. and Mol H. G. J. Simultaneous quantitative determination, identification and qualitative screening of pesticides in fruits and vegetables using LC-Q-Orbitrap™-MS. Food Addit. Contam: Part A. 2015 Sep 15:1-9. [Epub ahead of print].
• Detect both target and untargeted compounds in full scan mode• Analyze more compounds per run• Quantify, identify, and screen in a single run
Benefits of HRAM technology
Table of contents
Introduction
Food safety testing
Environmental contaminants analysis
Clinical research
Forensic toxicology
Pharmaceutical discovery

Pesticides in fruits and vegetables: Triple quadrupole MS technology application note
Food safety testing
Trace-level quantitation of pesticide residues in red chili powder
The difficulties and cost of analyzing a large number of pesticides in a complex spice matrix are high. Though few pesticides are registered for chili crop management, the Rapid Alert System for Food and Feed (RASFF) has issued an alert due to flonicamid and formentate residues found in chili powder, for which the EU sets limits of 0.1 and 0.05 mg/kg, respectively. The lowest MRL for chili powder is 0.005 mg/kg for the sum of fipronil and fipronil sulfone. For this reason, a robust and sensitive analytical method is needed to ensure spices are compliant.
Thermo Scientific Application Note 73016 validated a robust LC-MS/MS multi-residue method for the analysis of pesticides in chili powder using QuEChERS sample cleanup and the Thermo Scientific™ TSQ Quantis™ triple quadrupole mass spectrometer. Data acquisition and processing used TraceFinder software. The method was verified per SANTE/11813/ 2017 guidelines, and for compliance with the EU and Food Safety and Standards Authority of India (FSSAI) MRL requirements for chili powder.
The method provided a robust analytical solution for trace-level quantitation of more than 120 pesticides in chili powder, making it suitable for routine analysis in a high-throughput food-testing laboratory. dSPE cleanup followed by dilution minimized the need for cleaning, increasing system up time so at least 70 injections could be completed in a day. MS response was linear from 0.0001–0.025 mg/L, with correlation coefficients >0.99 and <15% residuals for all the target analytes. LOQs were 0.005 mg/kg with acceptable recoveries (70–120%) and precision <20%) for >96% of the target analytes. Method repeatability over a continuous set of 50 injections was <15% for area and < ± 0.05 min retention time.
Trace-level quantitation of pesticide residues in red chili powder using LC-(HESI)-MS/MS
User-defined data processing parameters, including two transitions per analyte, retention time, correlation coefficient, and residuals, were set in the TraceFinder software master method and the data processed automatically. Color-coding flagged whether results passed or failed acceptance criteria. The results that passed user-defined criteria (SANTE guidelines) are shown in green.
Table of contents
Introduction
Food safety testing
Environmental contaminants analysis
Clinical research
Forensic toxicology
Pharmaceutical discovery

Pesticides in fruits and vegetables: Triple quadrupole MS technology application note
Food safety testing
Trace level quantitation of pesticide residues in fresh fruits using LC-MS/MS
Trace level quantitation of pesticide residues in fresh fruits
Until recently, Indian food testing laboratories analyzed pesticide residues in class-specific groups using a combination of GC- and HPLC-based methods, an approach requiring several days to complete. However, with grape and apple production increasing substantially, faster methods with shorter turnaround times are needed. Currently, 282 pesticides are registered in India under the Central Insecticide Board and Registration Committee (CIBRC) with 51 chemicals registered and recommended for grapes per APEDA. The European Commission and FSSAI have set MRLs for pesticides and their metabolites in grape and apples.
Thermo Scientific Application Note 73021 describes a LC-MS/MS multi-residue method for the quantitative analysis of 160 pesticides (parent, isomers, and metabolites) in grapes and apples using QuEChERS sample cleanup and the TSQ Quantis triple quadrupole mass spectrometer. Data acquisition and processing used TraceFinder software. The method was validated to meet EU SANTE/11813/ 2017 guidelines and for compliance with the FSSAI and EU MRLs. After validated, the method was applied to real grape and apple samples.
The authors determined the acetonitrile extract dilute-and-shoot method sensitive, robust, and low-cost. The method linearity was excellent from 0.0005 to 0.025 mg/L, with correlation coefficients >0.99 and < 20% residuals for all the target analytes in both solvents and in both matrices. Sub-ppm LOQs were 0.005 mg/kg, except carbofuran and 3-hydroxy carbofuran in both matrices. Recoveries were 76–116% with <15 % RSD, which were within SANTE guideline criteria. The time required to process the data using TraceFinder software was approximately 90 minutes including manual revision.The approach enabled analysis of at least 70 injections per day, addressing needs for increased sample throughput in commercial laboratories.
Area repeatability for dicrotophos and dimethoate in grape (n=50), and for isoproturon and carbendazim in apple (n=55).
0
10000
20000
30000
40000
50000
60000
70000
Are
a
Number of injections
Grape
Dicrotophos Dimethoate
0
15000
30000
45000
60000
75000
90000
Are
a
Number of injections
Apple
Isoproturon Carbendazim
%RSD= 6.56 %RSD= 10.42
% RSD= 6.81 % RSD= 5.50
403020100 50
40302010 50 0 60
Table of contents
Introduction
Food safety testing
Environmental contaminants analysis
Clinical research
Forensic toxicology
Pharmaceutical discovery

Pesticides in fruits and vegetables: Ion chromatography coupled with triple quadrupole MS technology application note
Food safety testing
A good IC-MS/MS separation was achieved to resolve 16 analytes in different SRM channels. Fosetyl tends to degrade into phosphonic acid both in solution and in the IC-MS/MS via in-source fragmentation. Phosphonic acid and fosetyl were fully separated on the Dionex IonPac AS19-4µm column with retention times of 8.92 min and 3.56 min, respectively.
Determination of polar pesticides in grapes
TThough polar ionic pesticides include some of the most frequently used pesticides, they have been infrequently monitored in food-testing programs. Lack of testing is in part due to the analytical difficulties and higher costs associated with single-residue methods that were, until recently, the only ones available. Polar ionic pesticides are challenging analytes due to very low recovery when using liquid/liquid partition methods based on QuEChERS, ethyl acetate, and mini-Luke; and poor retention in reversed-phase LC. Derivatization to overcome poor retention can be time consuming and have a negative impact on analytical precision. However, ion chromatography (IC)-MS is a robust solution that offers excellent chromatographic resolution in a wide range of matrices coupled with the low detection limits and high selectivity of triple quadrupole mass spectrometry.
Thermo Scientific Application Note 72915 described an IC-MS/MS multi-residue workflow for determination of 16 polar pesticides and their metabolites in grapes, which uses modified quick polar pesticides (QuPPe) sample cleanup with a Dionex IonPac AS19-4μm column set and compact IC system coupled to the TSQ Quantis triple quadrupole mass spectrometer. Workflow sensitivity, linearity, retention time precision, and recovery met SANTE/11813/2017 method performance criteria, and provided lower LOQs than EU specified MRLs. Calibration curves were linear from 1 to 50 μg/L with correlation coefficients >0.99. Recoveries were 70–120% and retention time stability of was ±0.1 min for five replicates spiked at 10 μg/L.
Determination of polar pesticides in grapes using a compact ion chromatography system coupled with tandem mass spectrometry
0
5.0E3
1.0E4
Inte
nsit y
0
5.0E2
Inte
nsit y
0
1.0E4
2.0E4
Inte
nsit y
0
5.0E3
Inte
nsit y
0
2.0E3
Inte
nsit y
8.28
6.94
7.29
12.29
9.26
NL: 3.81E3
TIC MS F: AMPA:- c ESI SRM
ms2 110.000 [62.999-63.001,
78.999-79.001, 80.999-81.001]
10ppbmix2
NL: 7.88E3
TIC MS F: Bialaphos:- c ESI
SRM ms2 322.000
[171.999-172.001,
215.999-216.001,
232.999-233.001] 10ppbmix2
NL: 2.47E4
TIC MS F: Chlorate:- c ESI SRM
ms2 83.000 [50.999-51.001,
66.999-67.001] 10ppbmix2
NL: 9.82E2
TIC MS F: Cyanuric acid:- c ESI
SRM ms2 128.000
[41.999-42.001, 84.999-85.001]
10ppbmix2
NL: 1.20E4
TIC MS F: Ethephon:- c ESI
SRM ms2 143.000
[78.999-79.001, 106.999-107.001]
10ppbmix2
AMPA
Bialaphos
Chlorate
Cyanuric acid
Ethephon
0
5.0E3
1.0E4
Inte
nsit y
0
5.0E3
1.0E4
Inte
nsit y
0
1.0E4
2.0E4
Inte
nsit y
3.56
8.00
11.88
NL: 1.04E4
TIC MS F: Glufosinate:- c ESI
SRM ms2 180.000
[94.999-95.001, 135.999-136.001]
10ppbmix2
NL: 1.48E4
TIC MS F: Glyphosate:- c ESI
SRM ms2 168.000
[62.999-63.001, 78.999-79.001]
10ppbmix2
Fosetyl
Glufosinate
Glyphosate
NL: 2.12E4
TIC MS F: Fosetyl- Al:- c ESI SRM ms2 109.000
[62.999-63.001, 80.999-81.001] 10ppbmix2
0 1 2 3 4 5 6 7 8 9 10 11 12 13 14 15 16 17 18 19Time (min)
Table of contents
Introduction
Food safety testing
Environmental contaminants analysis
Clinical research
Forensic toxicology
Pharmaceutical discovery

Pesticides in fruits and vegetables: Triple quadrupole MS technology application note
Food safety testing
Identification of ametryn in wheat grain was demonstrated with two transitions 228.1→186.1 (quantitative) and 228.1→96.0 (confirmatory) at the same retention (5.85 min, ±0.1) with ion ratios of 17.23% (11.71–21.76%) observed in wheat grain in comparison with a neat standard. For the quantitative approach, the linearity provided correlation coefficient >0.999 with <15% residuals.
Trace-level quantitation of pesticide residues in wheat grain
With insecticides, fungicides, herbicides, and plant growth regulators widely spread on wheat plantations, cereals may be a significant source of pesticide exposure. The European Commission and FSSAI have established MRLs for pesticides in wheat grain at of 0.01 mg/kg except for fipronil and fipronil sulfone (0.005 mg/kg). Thermo Scientific Application Note 72982 validated an LC-MS/MS method for trace-level quantitation of 145 pesticide residues in wheat grain using QuEChERS sample cleanup and the TSQ Quantis triple quadrupole mass spectrometer. Data acquisition and processing used TraceFinder software. The method was validated per SANTE guidelines and evaluated for fulfillment of FSSAI standards and European Commission MRLs.
The LC-MS/MS method conditions optimized for the pesticide residues analysis provided excellent sensitivity for the compounds. Linearity was excellent from 0.0005 to 0.1 mg/kg with correlation coefficients >0.99 and with <20% residuals. LOQ values in wheat grain matrix were 0.01 mg/kg with acceptable recoveries of 70–120% and precision <20%. Repeatability over 50 injections was <15% for the area and <±0.05 min retention time, demonstrating the method’s potential for excellent reproducibility. Overall, the method met SANTE guidelines and complied with EU and FSSAI MRL requirements. The method permitted completion of at least 50 injections per day, addressing commercial laboratory needs for increased productivity.
A simple and robust method for trace level quantitation of pesticide residues in wheat grain using LC-MS/MS
Table of contents
Introduction
Food safety testing
Environmental contaminants analysis
Clinical research
Forensic toxicology
Pharmaceutical discovery

Synthetic hormones and other veterinary drugs in animal products: HRAM technology application note
Quick and sensitive analysis of multiclass veterinary drug residues in meat, plasma, and milk
Often a time-consuming process, quantitative analysis of multiclass veterinary drug residues in animal products can require multiple sample injections to achieve optimal conditions for individual classes of compounds. Multiple chromatographic and MS methods specifically directed to small groups of compounds are often deployed. Thermo Scientific Application Note 614 described a single-injection method that uses ultrafast chromatography with the Q Exactive Focus mass spectrometer to provide short analysis time, superior selectivity, and high sensitivity for the analysis of 44 multiclass veterinary drug residues in muscle, kidney, milk, and plasma extracts.
The method exceeded EU regulatory requirements (EC/657/2002) for LODs and ability to confirm compound identities using retention time, accurate m/z, isotopic ratio, and fragment ions. HRAM LC-MS/MS data were collected in variable data-independent acquisition (vDIA) mode where fragments from wide isolation windows covering the entire mass range were detected in multiple MS2 scans, maintaining very high levels of sensitivity and selectivity while keeping a full digital record of the sample for retrospective data analysis.
Quick and Sensitive Analysis of Multiclass Veterinary Drug Residues in Meat, Plasma, and Milk on a Q Exactive Focus LC-MS System
A non-targeted screen using a 1500 component built-in database was conducted, providing several strong matches to additional components present in the sample. Here, cortisol (hydrocortisone), was confirmed by isotopic pattern match, fragment search, and library match.
Food safety testing
Table of contents
Introduction
Food safety testing
Environmental contaminants analysis
Clinical research
Forensic toxicology
Pharmaceutical discovery

Because the synthetic steroid hormones used to treat animals have been found to affect cancer risk, consumers are concerned about exposure via the animal products they eat. However, the complexity of food matrices makes it difficult to confidently detect and quantify these contaminants at low concentrations. Kumar et al. studied the application of the Q Exactive mass spectrometer in four acquisition modes: full MS/AIF, full MS/tMS2, full MS/ddMS2, and t-SIM/ddMS2, to the analysis of synthetic hormones.7
Finding it most suitable, the authors developed a t-SIM/ddMS2 confirmation method for the analysis of eight synthetic hormones (trenbolone, 17α ethinylestradiol, zeranol, stanozolol, dienestrol, diethylstilbestrol, hexestrol, taleranol) and one naturally occurring hormone (zearalenone) in animal urine. Quadrupole precursor ion selection (SIM) acted as a powerful filter to reduce ion suppression. The method was validated according to the European Commission Decision 2002/657/EC for analysis of residues of veterinary medicinal products. The decision limit (CCα) and the detection capability (CCβ) ranged from 0.11 μg/L to 0.69 μg/L, and 0.29 μg/L and 0.90 μg/L, respectively. Overall, the results suggested that the Q Exactive mass spectrometer provides sensitivity similar to that of QQQ instruments, with enhanced selectivity.
Kaufmann et al. applied the Q Exactive mass spectrometer to the quantitation of over 100 compounds belonging to a variety of veterinary drug classes in milk.8 Instead of traditional extraction and clean up approaches such as solid phase extraction (SPE), QuEChERS and ultra-filtration, the authors introduced a new technique—salting out supported liquid extraction (SOSLE)—to enhance extraction efficiency and sample clean-up of polar analytes. The method was validated based on European Commission Decision 2002/957/EC as it applies to quantitative veterinary drug analysis methods. The authors concluded that the Q Exactive mass spectrometer provided good quantitative data and superior compound confirmation. The SOSLE technique produced extracts of equal or superior cleanliness and with higher average recoveries than those obtained using QuEChERS or SPE. The largest improvement was obtained for polar analytes as such penicillines, quinolones, and tetracyclines.
7. Kumar, P.; Rúbies, A.; Centrich, F.; Granados, M.; Cortés-Francisco, N.; Caixach, J.; Companyó, R. Targeted analysis with benchtop quadrupole-orbitrap hybrid mass spectrometer: application to determination of synthetic hormones in animal urine. Anal. Chim. Acta. 2013, May 30;780:65-73.
8. Kaufmann, A.; Butcher, P.; Maden, K.; Walker, S.; Widmer, M. Multi-residue quantification of veterinary drugs in milk with a novel extraction and clean up technique: salting out supported liquid extraction (SOSLE). Anal. Chim. Acta. 2014, Apr 11;820:56-68.
Synthetic hormones and other veterinary drugs in animal products: HRAM technology in peer-reviewed publications
Food safety testing
• Reduce ion suppression with quadruple precursor ion selection• Attain sensitivity equal to QQQ instruments, with improved selectivity
Benefits of HRAM technology
Table of contents
Introduction
Food safety testing
Environmental contaminants analysis
Clinical research
Forensic toxicology
Pharmaceutical discovery

Food safety testing
Mycotoxin contamination can occur when molds grow on dairy products or when dairy cattle eat contaminated feeds. Jia et al. developed a Q Exactive mass spectrometer-based UHPLC-MS method for simultaneous analysis of 58 mycotoxins in dairy products.9 The QuEChERS sample preparation method was used. The authors validated the method using the guidelines specified in European Commission Decision 2002/657/EC and 401/2006/EC.
Extraction recoveries ranged from 86.6 to 113.7%, with a coefficient of variation of < 6.2%. All target compounds were detected within the range of 0.001 to 100 μg/kg, with a correlation coefficient of > 0.99. The limits of detection (LOD) ranged from 0.001 to 0.92 μg/kg. The decision limit (CCα) values were comparable to those of previously reported QQQ methods. Repeatability was less than 6.4%. Three consecutive on-column injections of 1 μg/kg were made to detect any decrease in mass accuracy. No significant decrease was observed and the maximum mass deviation ranged from 0.2 to 2.5 ppm, demonstrating the wide dynamic range of Q Exactive mass spectrometer at resolution 70,000 (FWHM). Compared with other methods, the method increased sensitivity and mass accuracy by more than five times. In summary, the authors found the method useful for fast screening of mycotoxins in dairy products.
9. Jia, W.; Chu, X.; Ling, Y.; Huang, J.; Chang, J. Multi-mycotoxin analysis in dairy products by liquid chromatography coupled to quadrupole orbitrap mass spectrometry. J. Chromatogr. A. 2014, Jun 6;1345:107-14.
Mycotoxins in dairy products: HRAM technology in peer-reviewed publications
• Realize a wider dynamic range of detection • Increase sensitivity and mass accuracy by a factor of five
Benefits of HRAM technology
Table of contents
Introduction
Food safety testing
Environmental contaminants analysis
Clinical research
Forensic toxicology
Pharmaceutical discovery

Multiclass contaminants in food: HRAM technology technical note
Full-scan fragmentation options for the detection of food contaminants by an affordable LC-Q-Orbitrap MS
Analysis of food toxicants is challenging because of the number of substances that need to be analyzed. Foods may contain a range of toxins including pesticides, mycotoxins, plant toxins, and veterinary drugs, which together are difficult to handle in a single run using targeted, triple quadrupole MS/MS measurements due to scan speed limits. LC coupled with full-scan HRAM enables simultaneous screening, quantitative determination, and identification of multiple analytes in one run.
Thermo Scientific Technical Note 64394 compared two of the scan options of the Q Exactive Focus mass spectrometer: vDIA and all-ion fragmentation (AIF). Both modes record all possible fragments over the full chromatographic time range, providing full scan measurements for non-targeted screening and retrospective data analysis, while complying with the identification criteria in SANCO 12571/2013 which requires the detection of two diagnostic ions, at least one of which is a fragment. With AIF, all precursor ions are sent to the collision cell and fragmented, and the resulting fragments are measured in the Orbitrap mass analyzer. With vDIA, the mass range for precursor ions is split into multiple MS events. The authors showed that vDIA improved sensitivity, selectivity, and the ability to identify target analytes.
Full-Scan Fragmentation Options for the Detection of Food Contaminants by an Affordable LC-Q-Orbitrap MS
Number of compounds out of a total number of 37 automatically detected by TraceFinder software at different levels in five matrices, comparing vDIA mode (left) with AIF mode (right).
Food safety testing
vDIA
Matrix 1 ng/g 10 ng/g 50 ng/g 200 ng/g
Solvent 33 37 37 37
Apple 31 37 37 37
Liver 28 35 37 37
Food Supplement*
26 32 37 37
Wheat 21 33 37 37
Compound Feed 9 13 24 34
*Spiking levels in food supplement 10x higher.
AIF
Matrix 1 ng/g 10 ng/g 50 ng/g 200 ng/g
Solvent 32 37 37 37
Apple 26 35 37 37
Liver 24 35 37 37
Food Supplement*
14 23 37 37
Wheat 11 30 36 37
Compound Feed 1 19 21 31
Table of contents
Introduction
Food safety testing
Environmental contaminants analysis
Clinical research
Forensic toxicology
Pharmaceutical discovery

Food safety testing
Analytical methods for screening and quantitating the many contaminants found in foods must be reliable and meet regulatory requirements for recoveries and limits of quantification (LOQ). Dzuman et al. presented a reliable and sensitive method that used HPLC separation in combination with HRAM Orbitrap mass spectrometer-based detection for the determination of 323 pesticide residues, 55 mycotoxins, and 11 plant toxins.10 The efficiency of a special core-shell HPLC column with relatively high particle size (2.6 mm) with lower operational pressures was also examined. The authors validated the method in three sample matrices, leek, wheat, and tea, which differed in the type and amount of components causing matrix effects. QuEChERs was used for sample preparation and extraction of target analytes. A HRAM MS/MS spectral library containing the spectrum of fragment ions for each analyte was created to facilitate identification and confirmation of the target compounds.
The core-shell analytical column demonstrated good separation efficiency and robustness, yielding retention-time RSDs of less than 0.3% after 2000 injections. Method LOQs for the target analytes were less than 10 μg/kg for 82%, 81%, and 61% for the leek, wheat, and tea matrices, respectively. For the majority of the target analytes, recoveries were 70 to 120%, a range acceptable according to SANCO/12571/2013 analytical quality control and validation procedures for pesticide residues analysis in food and feed. The exception was the highly polar mycotoxin deoxynivalenol-3-glucoside with recoveries of 35%, 47%, and 42% for leek, wheat, and tea matrices, respectively. Calibration curve linearity expressed as coefficients of determination ranged from of 0.9661 to 1.000. Repeatability at the LOQ ranged from 0.25 to 13.51% RSD.
Ensuring the safety of baby food is of utmost importance, but screening and quantitating hundreds of known and unknown contaminants such as pesticides and antibiotics can be challenging. Jia et al. developed an UHPLC-ESI Q Exactive mass spectrometer method for simultaneous analysis of 333 pesticides and veterinary drug residues in baby food.11 QuEChERs was used for sample preparation and extraction.
The method was validated according to the European Commission Decision 2002/657/EC and SANCO/12571/2013. QuEChERs extraction recoveries ranged of 79.8 to 110.7%, with coefficients of variation < 8.3%. The 333 compounds ranged from 0.1 to 1000 μg/kg in concentration, with a correlation coefficient > 0.99. The LODs ranged from 0.01 to 5.35 μg/kg. The LOQs were in the range of 0.01 to 9.27 μg/kg. After successfully screening 93 commercial baby food samples for pesticide and veterinary drug residues, the authors concluded the method is appropriate for rapid screening of foods. In particular, tilmicosin, fenbendazole, tylosin tartrate, and thiabendazole were detected in some samples.
10. Dzuman, Z.; Zachariasova, M.; Veprikova, Z.; Godula, M.; Hajslova J. Multi-analyte high performance liquid chromatography coupled to high resolution tandem mass spectrometry method for control of pesticide residues, mycotoxins, and pyrrolizidine alkaloids. Anal. Chim. Acta. 2015, Mar 10;863:29-40.
11. Jia, W.; Chu, X.; Ling, Y.; Huang, J.; Chang, J. High-throughput screening of pesticide and veterinary drug residues in baby food by liquid chromatography coupled to quadrupole Orbitrap mass spectrometry. J. Chromatogr. A. 2014, Jun 20;1347:122-8.
Multiclass contaminants in food: HRAM technology in peer-reviewed publications
• Screen and quantify multiclass contaminants, reliably and in accordance with regulatory requirements• Identify and confirm target compounds
Benefits of HRAM technology
Table of contents
Introduction
Food safety testing
Environmental contaminants analysis
Clinical research
Forensic toxicology
Pharmaceutical discovery

Food safety testing
More than 300 compounds belonging to several classes of veterinary drugs and pesticides have been found in animal feed. Because medium and high-resolution mass spectrometers provide advantages in multi-residue analysis, Gómez-Pérez et al. compared the performance of medium-resolution (MRMS) TOF and high-resolution Orbitrap mass spectrometers for the analysis of toxic compounds in 18 different chicken, hen, rabbit, and horse feed samples.12 Sample cleanup procedure was evaluated and several validation parameters were established including matrix effect, linearity, recovery and sensitivity.
The authors obtained better results using the Orbitrap mass spectrometer with sensitivity of 1 to 12.5 μg/kg (below MRL), recovery values of 60–125%, and fewer compounds experienced signal suppression or enhancement. The TOF LOQ values ranged from 5 to 100 μg/kg. Sulfadiazine, trimethoprim, robenidine and monensin sodium veterinary drugs, and the pesticide chlorpyrifos, were identified when the method was applied to the feed samples, demonstrating its applicability as a quantitative method regardless of the type of feed. Other advantages provided by the Orbitrap mass spectrometer important for routine analysis were short analysis time (14 minutes), ability to perform fast screening using Thermo Scientific™ ToxID™ automated screening software* (which processed more than 450 compounds in less than 5 minutes), and lack of need for a lock mass.
12. Gómez-Pérez, M. L.; Romero-González, R.; Martínez Vidal, J. L.; Garrido Frenich, A. Analysis of veterinary drug and pesticide residues in animal feed by high-resolution mass spectrometry: comparison between time-of-flight and Orbitrap. Food Addit. Contam. Part A Chem. Anal. Control Expo. Risk. Assess. 2015, Mar 18:1-10.
*Thermo Scientific TraceFinder software is currently available solution as Thermo Scientific ToxID automated screening software has been discontinued
Multiclass contaminants in food: HRAM technology in peer-reviewed publications
• Reduce signal suppression and enhancement compared to Q TOF technology
Benefits of HRAM technology
Table of contents
Introduction
Food safety testing
Environmental contaminants analysis
Clinical research
Forensic toxicology
Pharmaceutical discovery

Multiclass contaminants in food: Triple quadrupole MS technology application note
Rapid analysis of fipronil and fipronil sulfone in eggs
Eggs contaminated with the insecticide fipronil have become a serious concern because in certain cases, levels were found to be significantly higher (up to 1.2 mg/kg) than the EU MRL of 0.005 mg/kg for the sum of fipronil and fipronil sulfone. For this reason, there is a demand for a quick and efficient method for their determination in egg matrix. Thermo Scientific Application Brief 72483 presented a rapid and simple method for the LC-MS/MS determination of fipronil and fipronil sulfone in eggs using a modified QuEChERS acetonitrile extraction protocol and the Thermo Scientific™ UltiMate™ 3000 RSLC system coupled to the TSQ Quantis mass spectrometer.
The method LOQ and LOD of 0.0005 mg/kg for both fipronil and fipronil sulfone was five times below the EU statutory MRL for the The method LOQ and LOD of 0.0005 mg/kg for both fipronil and fipronil sulfone was five times below the EU statutory MRL for the sum of fipronil and fipronil sulfone, and the method results were in full compliance with SANTE11945/2015 analytical quality control guidelines. Method recovery (89–104%) and repeatability (RSD 6.1-8.5%) were excellent. Sample preparation using the modified QuEChERS protocol took only 15 minutes, and Thermo Scientific™ Accucore™ aQ columns provided 8-minute run times with excellent separation efficiency. Overall the LC-MS/MS system allowed uninterrupted analysis of 100 egg samples without loss of signal, enabling routine high-throughput analysis.
Rapid analysis of fipronil and fipronil sulfone in eggs by liquid chromatography and triple quadrupole mass spectrometry
Food safety testing
Compound name
Recovery (%)0.5 ng/g
spike level
Recovery (%)1 ng/g
spike level
Recovery (%)5 ng/g
spike levelFipronil 104 89 99
Fipronil sulfone 99 95 102
Compound name
LOD[ng/g]
LOQ[ng/g]
Repeatability (%)0.5 ng/g
spike level
Repeatability (%)5 ng/g
spike levelFipronil 0.1 0.5 8.5 6.1
Fipronil sulfone 0.1 0.5 7.7 6.4
Recoveries at 3 different concentration levels
Detection and quantification limits and repeatability expressed in % RSD (n=6)
Table of contents
Introduction
Food safety testing
Environmental contaminants analysis
Clinical research
Forensic toxicology
Pharmaceutical discovery
Food safety testing
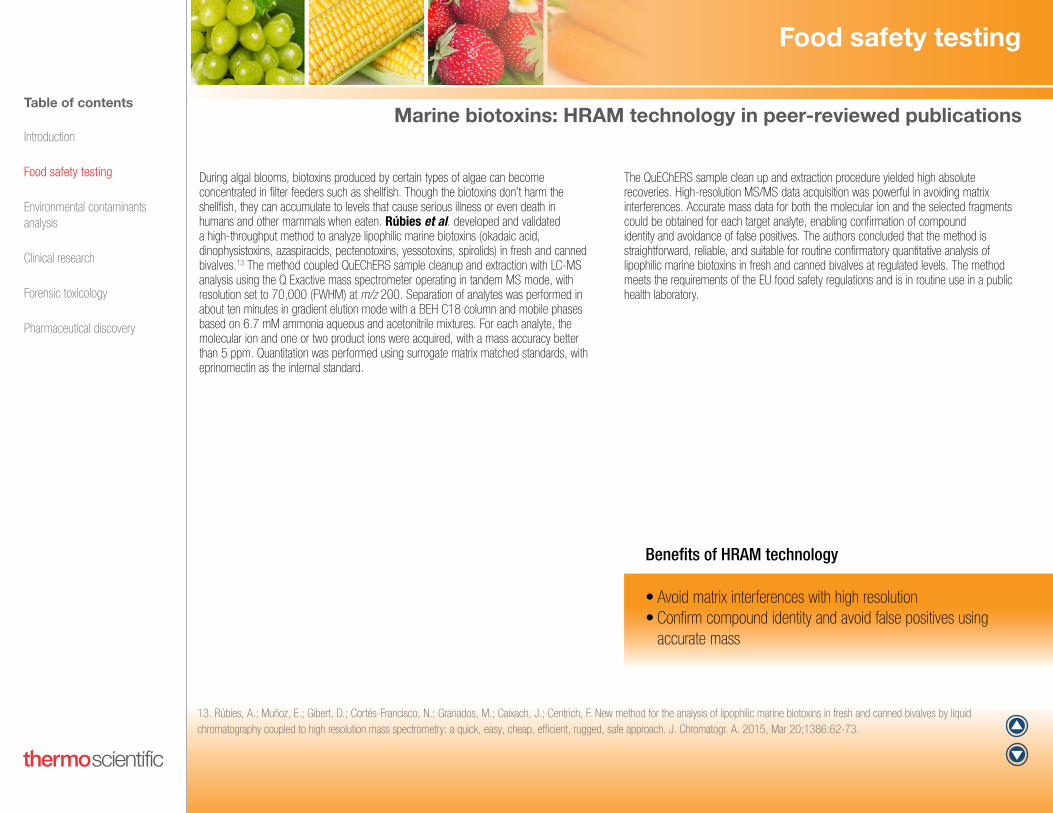
During algal blooms, biotoxins produced by certain types of algae can become concentrated in filter feeders such as shellfish. Though the biotoxins don’t harm the shellfish, they can accumulate to levels that cause serious illness or even death in humans and other mammals when eaten. Rúbies et al. developed and validated a high-throughput method to analyze lipophilic marine biotoxins (okadaic acid, dinophysistoxins, azaspiracids, pectenotoxins, yessotoxins, spirolids) in fresh and canned bivalves.13 The method coupled QuEChERS sample cleanup and extraction with LC-MS analysis using the Q Exactive mass spectrometer operating in tandem MS mode, with resolution set to 70,000 (FWHM) at m/z 200. Separation of analytes was performed in about ten minutes in gradient elution mode with a BEH C18 column and mobile phases based on 6.7 mM ammonia aqueous and acetonitrile mixtures. For each analyte, the molecular ion and one or two product ions were acquired, with a mass accuracy better than 5 ppm. Quantitation was performed using surrogate matrix matched standards, with eprinomectin as the internal standard.
The QuEChERS sample clean up and extraction procedure yielded high absolute recoveries. High-resolution MS/MS data acquisition was powerful in avoiding matrix interferences. Accurate mass data for both the molecular ion and the selected fragments could be obtained for each target analyte, enabling confirmation of compound identity and avoidance of false positives. The authors concluded that the method is straightforward, reliable, and suitable for routine confirmatory quantitative analysis of lipophilic marine biotoxins in fresh and canned bivalves at regulated levels. The method meets the requirements of the EU food safety regulations and is in routine use in a public health laboratory.
13. Rúbies, A.; Muñoz, E.; Gibert, D.; Cortés-Francisco, N.; Granados, M.; Caixach, J.; Centrich, F. New method for the analysis of lipophilic marine biotoxins in fresh and canned bivalves by liquid chromatography coupled to high resolution mass spectrometry: a quick, easy, cheap, efficient, rugged, safe approach. J. Chromatogr. A. 2015, Mar 20;1386:62-73.
Marine biotoxins: HRAM technology in peer-reviewed publications
• Avoid matrix interferences with high resolution • Confirm compound identity and avoid false positives using accurate mass
Benefits of HRAM technology
Table of contents
Introduction
Food safety testing
Environmental contaminants analysis
Clinical research
Forensic toxicology
Pharmaceutical discovery

Likewise, Domènech et al. developed and validated a Q Exactive mass spectrometer-based LC-MS method for the quantitation and confirmation of lipophilic marine biotoxins in mussels.14 Compounds representative of each lipophilic toxin group were analyzed: Okadaic acid (OA), yessotoxin, azaspiracid-1, gymnodimine, 13-desmethyl spirolide C, pectenotoxin-2 and Brevetoxin B. Identification and confirmation criteria were established. Fragment and isotope ions and ion ratios were evaluated for use in confirmation. The authors found that both fragment ion and isotope ion ratios can be used to confirm a positive result, but for each compound one or the other can be more suitable.
Accuracy (trueness and precision), linearity, calibration curve check, LOQ and specificity were used as method validation parameters and the validation was performed at 0.5 times the European Union permitted levels. Overall, the method performed very well for the parameters investigated. Trueness (recovery) ranged from 80% to 94%, precision (intra-laboratory reproducibility), ranged from 5% to 22%, and LOQs were from 0.9 to 4.8 pg on column. Overall method uncertainty of 38% was estimated for OA, using certified reference material and a top-down approach considering contributions arising from the trueness and precision studies. The authors concluded that the Orbitrap mass spectrometer-based method enables full-scan acquisition with good sensitivity and better selectivity than other approaches, and can help avoid false positives when confirmation criteria are used.
14. Domènech, A.; Cortés-Francisco, N.; Palacios, O.; Franco, J. M.; Riobó, P.; Llerena, J. J., Vichi, S.; Caixach, J. Determination of lipophilic marine toxins in mussels. Quantification and confirmation criteria using high resolution mass spectrometry. J. Chromatogr. A. 2014, Feb 7;1328:16-25.
Food safety testing
Marine biotoxins: HRAM technology in peer-reviewed publications
• Exceed EU-specified levels for accuracy, linearity, LOQ, and specificity• Enjoy full-scan data acquisition with enhanced sensitivity and selectivity • Avoid false positives using confirmation criteria
Benefits of HRAM technology
Table of contents
Introduction
Food safety testing
Environmental contaminants analysis
Clinical research
Forensic toxicology
Pharmaceutical discovery

White wines can contain dyes added to produce a richer color and these dyes can cause reactions in susceptible people. Jia et al. developed a method combining QuEChERS sample preparation and extraction with Q Exactive mass spectrometer detection for accurate and sensitive screening of 69 dyes in wine.15 After optimization of the QuEChERS procedure, the maximum predicted recovery was 99.48% for canacert indigo carmine. Recovery rates of the other 68 compounds ranged from 87.2 to 107.4%, with a coefficient of variation < 6.4%. The mass accuracy obtained was routinely better than 1.6 ppm with once-per-week calibration. The LODs ranged from 1 to 1000 μg/kg. The authors concluded that the method is very useful for fast screening of dyes in commercial wines.
15. Jia, W.; Chu, X.; Ling, Y.; Huang, J.; Lin, Y.; Chang, J. Simultaneous determination of dyes in wines by HPLC coupled to quadrupole orbitrap mass spectrometry. J. Sep. Sci. 2014,
Apr;37(7):782-91.
Food safety testing
Dyes in wine: HRAM technology in peer-reviewed publications
Screen rapidly, accurately, and with high sensitivity
Benefits of HRAM technology
Table of contents
Introduction
Food safety testing
Environmental contaminants analysis
Clinical research
Forensic toxicology
Pharmaceutical discovery

The active ingredients in herbal medicines and dietary supplements can augment or antagonize the actions of other prescription and non-prescription drugs. In the US, antidiabetics are prescription-only medicines designed to be taken only with physician supervision. Guo et al. developed a Q Exactive mass spectrometer-based method for rapid screening, confirmation, and quantitation of 11 illegal antidiabetic adulterants in herbal medicines and dietary supplements.16 Sixty-three batches of herbal medicine, and 34 batches of dietary supplement samples were tested. The mass spectrometer was operated in the full MS/ddMS2 mode. Full-scan data was used for identification and provided superior accuracy, precision, and sensitivity for quantitation. The data-dependent MS/MS scans produced product ion spectra for unambiguous compound confirmation. Quantitation was performed using matrix-matched standard calibration curves with phenacetin as the internal standard. Method validation parameters were selectivity, sensitivity, calibration curve, accuracy and precision, recovery, matrix effects, and stability.
Response was linear over wide analyte concentration ranges (e.g., 0.0004 to 1 μg/g for metformin) with coefficients of correlation r2 > 0.9991. The LODs ranged from 0.05 to 0.5 ng/g. Recoveries were higher than 74.3%. Accuracy ranged from -6.75 to 3.85% and the intra- and inter-day precision ranged from 0.048 to 11.5%. The adulterants metformin, phenformin, and glibenclamide were detected in seven of the dietary supplements tested, but in none of the herbal medicines. The authors concluded that the method demonstrated very good performance for the identification, confirmation, and quantitation of antidiabetics in herbal medicines and dietary supplements.
16. Guo, C.; Shi, F.; Jiang, S.; Gong, L.; Zhao, Y.; Zhang, J.; Zeng, S. Simultaneous identification, confirmation and quantitation of illegal adulterated antidiabetics in herbal medicines and dietary supplements using high-resolution benchtop quadrupole-Orbitrap mass spectrometry. J. Chromatogr. B. Analyt. Technol. Biomed. Life. Sci. 2014, Sep 15;967:174-82.
Food safety testing
Herbal medicines and dietary supplements: HRAM technology in peer-reviewed publications
• Use full-scan data for compound ID as well as accurate quantitation• Confirm compounds confidently using data-dependent MS/MS
Benefits of HRAM technology
Table of contents
Introduction
Food safety testing
Environmental contaminants analysis
Clinical research
Forensic toxicology
Pharmaceutical discovery

Vaclavik et al. developed and validated a Q Exactive mass spectrometer method for the simultaneous determination of 96 pharmaceuticals, plant toxins, and other plant metabolites in herbal dietary supplements.17 Target analytes were extracted using the QuEChERS method. The mass spectrometer was operated in full MS/ddMS2 acquisition mode, which provided high-resolution full-scan data for quantitation and high-resolution MS/MS data for confirmation in a single analytical run.
The method provided excellent selectivity in both full MS and ddMS2 modes. Confirmation of analytes was with a high degree of confidence. Method LODs and LOQs differed significantly depending on the sample matrix tested. Across the five different matrices, the LODs ≤ 10 μg/kg and LOQs ≤ 50 μg/kg were obtained for 48 to 81% of the target compounds. With the exception of the highly polar analytes, the QuEChERS extraction provided acceptable recoveries in the range of 70% to 120%. The precision of the method, defined as the relative standard deviation (RSD, n = 5), was ≤ 25% and ≤ 18% at spiked concentrations of 50 μg/kg and 500 μg/kg, respectively. Because of sample-to-sample variation in matrix effects of the extracts, the method of standard additions and an approach based on dilution of matrix components followed by quantitation using solvent standards were applied to the quantitative analysis.
17. Vaclavik, L.; Krynitsky, A. J.; Radar, J. Targeted analysis of multiple pharmaceuticals, plant toxins and other secondary metabolites in herbal dietary supplements by ultra-high performance liquid
chromatography-quadrupole-orbital ion trap mass spectrometry. Anal. Chim. Acta. 2014, Jan 31;810:45-60.
Food safety testing
Herbal medicines and dietary supplements: HRAM technology in peer-reviewed publications
Quantitate and confirm in a single run
Benefits of HRAM technology
Table of contents
Introduction
Food safety testing
Environmental contaminants analysis
Clinical research
Forensic toxicology
Pharmaceutical discovery

Targeted screening and quantitation of environmental contaminants: workflow
Contaminants in drinking water
Contaminants in wastewater
Contaminants in surface waters
Contaminants in biosolids
Contaminants in multiple matrices
Environmental contaminants analysis
Table of contents
Introduction
Food safety testing
Environmental contaminants analysis
Clinical research
Forensic toxicology
Pharmaceutical discovery
Environmental contaminants analysis
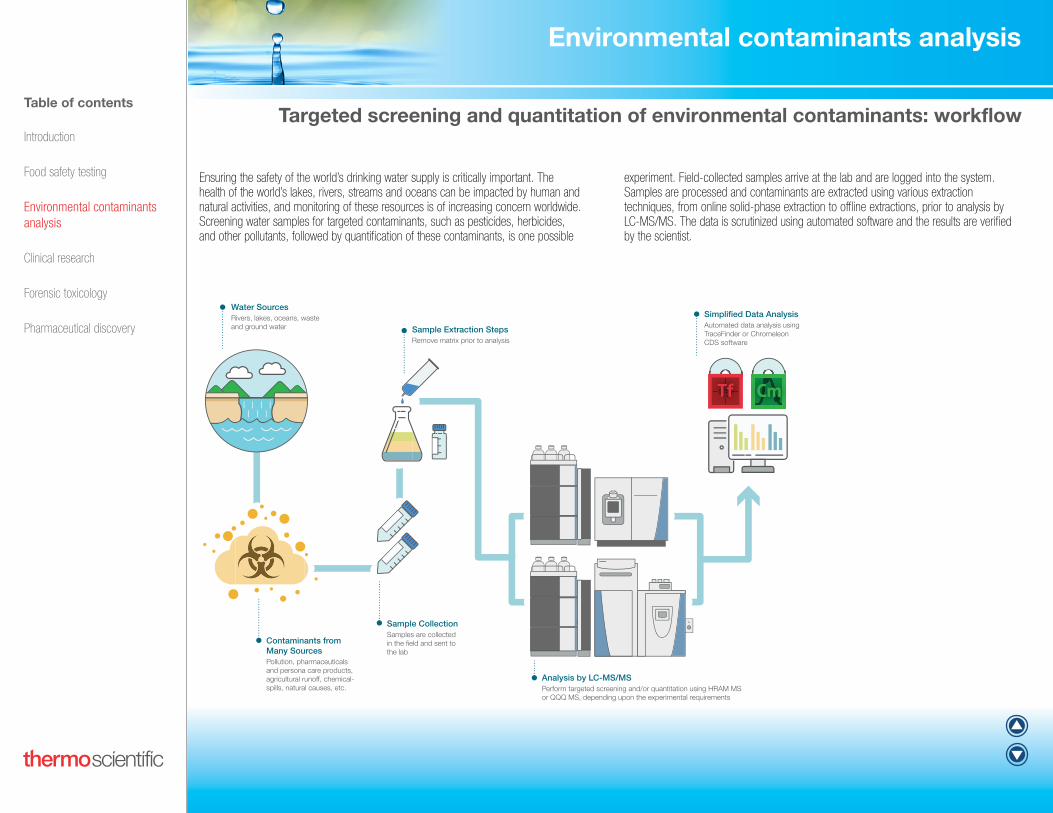
Targeted screening and quantitation of environmental contaminants: workflow
Water SourcesRivers, lakes, oceans, waste and ground water
Contaminants from Many SourcesPollution, pharmaceuticals and persona care products,
spills, natural causes, etc.
Simplified Data AnalysisAutomated data analysis using TraceFinder or Chromeleon CDS software
Sample CollectionSamples are collected in the field and sent to the lab
Sample Extraction StepsRemove matrix prior to analysis
Analysis by LC-MS/MSPerform targeted screening and/or quantitation using HRAM MS or QQQ MS, depending upon the experimental requirements
Ensuring the safety of the world’s drinking water supply is critically important. The health of the world’s lakes, rivers, streams and oceans can be impacted by human and natural activities, and monitoring of these resources is of increasing concern worldwide. Screening water samples for targeted contaminants, such as pesticides, herbicides, and other pollutants, followed by quantification of these contaminants, is one possible
experiment. Field-collected samples arrive at the lab and are logged into the system. Samples are processed and contaminants are extracted using various extraction techniques, from online solid-phase extraction to offline extractions, prior to analysis by LC-MS/MS. The data is scrutinized using automated software and the results are verified by the scientist.
Table of contents
Introduction
Food safety testing
Environmental contaminants analysis
Clinical research
Forensic toxicology
Pharmaceutical discovery

Quantitation of cyanotoxins in drinking water according to EPA 544 guidelines
Harmful algal blooms known as red tides, blue-green algae, or cyanobacteria, can have severe impacts on human health, aquatic ecosystems, and the economy. As a result, the US EPA developed Method 544 for the Unregulated Contaminant Monitoring Rule 4 (UCMR 4) program. The EPA has strict requirements that must be met before sample analysis that are referred to as the Initial Demonstration of Capability (IDC). These include demonstrating low background noise, precision by analyzing four laboratory fortified reagent water blanks (LFB) at mid-level, accuracy, and the ability to meet the MRL. In addition, the %RSD of the results of replicate analyses must be ≤ 20%, and the average percent recovery for each analyte must be within ± 30% of the true value.
Thermo Scientific Application Note 64968 demonstrated the performance of the Thermo Scientific™ TSQ Quantis™ triple quadrupole mass spectrometer for determining Microcystins in drinking water using EPA Method 544. The TSQ Quantis mass spectrometer proved sensitive, accurate, reproducible, and reliable for the quantitation of microcystins and nodularin according to EPA requirements. Linearity was excellent from the UCMR 4 MRL to 20-fold at the highest calibration standard. Adequate sensitivity was obtained using a 5 μL injection volume.
.
Contaminants in drinking water: Triple quadrupole MS technology application note
Environmental contaminants analysis
Quantitation of cyanotoxins in drinking water according to EPA 544 guidelines
Low background noise for all EPA Method 544 analytes was observed.
Analyte MRL (ng/L)
1/3 MRL (ng/L)
Detectable at the
Method Blank
MC-LA-[M+H]+ 8 2.7 0
MC-LF-[M+H]+ 6 2 0
MC-LR-[M+H]+ 20 6.7 1.4
MC-LY-[M+H]+ 9 3 1.6
MC-RR-[M+2H]2+ 6 2 0
MC-YR-[M+2H]2+ 20 6.7 4
Nodularin-R-[M+H]+ 5 1.7 0
C2D5-MC-LR (SUR) 108%
Table of contents
Introduction
Food safety testing
Environmental contaminants analysis
Clinical research
Forensic toxicology
Pharmaceutical discovery

Reduced injection volume applied to the quantitation of cylindrospermopsin and anatoxin-a in drinking water according to EPA Method 545
Cyanobacteria naturally occur in surface waters. Under certain conditions, they can form harmful algal blooms (HABs) that can produce toxins known as cyanotoxins. Anatoxin-a is a neurotoxin that is monitored and regulated in several countries. Cylindrospermopsin is toxic to liver and kidney tissues. As a result, the US EPA developed Method 545 for the UCMR 4 program. The EPA has strict requirements that must be met before sample analysis that are referred to as the Initial Demonstration of Capability (IDC). These include demonstrating low background noise, precision by analyzing four laboratory fortified reagent water blanks (LFB) at mid-level, accuracy, and ability to meet the MRL. In addition, the %RSD of the results of the replicate analyses must be ≤ 20%, and the average percent recovery for each analyte must be within ± 30% of the true value.
Thermo Scientific Application Note 64972 demonstrated the performance of the Thermo Scientific™ TSQ Quantis™ triple quadrupole mass spectrometer for the determination of cylindrospermopsin and anatoxin-a in drinking water using EPA Method 545. 5 μL, 10 μL, and 25 μL injections of drinking water were examined. The TSQ Quantis mass spectrometer proved sensitive, accurate, reproducible, and reliable for quantitation of target compounds in drinking water per to EPA Method 545. Though adequate sensitivity was obtained at every injection volume, an up to 10-fold reduction in the injection volume compared to the EPA recommendation resulted in less matrix injected, reducing maintenance of the LC-MS system.
Contaminants in drinking water: Triple quadrupole MS technology application note
Environmental contaminants analysis
Reduced injection volume applied to the quantitation of cylindrospermopsin and anatoxin-a in drinking water according to EPA Method 545
Results for a water sample analyzed using the TSQ Quantis mass spectrometer per EPA method 545 using 5 μL, 10 μL, and 25 μL injection volumes.
Analyte Actual (µg/L) FS LFSM LFSMD %Rec %RSD
5 µL Injection
Anatoxin-a 0.3 0 0.337 0.367 117% 6%
Cylindrospermopsin 0.9 0 0.954 0.966 107% 1%
IS-Phenylalanine-d5 120% 111%
IS-Uracil-d4 142% 130%
10 µL Injection
Anatoxin-a 0.3 0 0.347 0.352 117% 1%
Cylindrospermopsin 0.9 0 1.162 1.085 125% 5%
IS-Phenylalanine-d5 119% 109%
IS-Uracil-d4 89% 113%
25 µL Injection
Date Analyzed 4/7/2017 4/7/2017
Anatoxin-a 0.3 0 0.35 0.341 115% 2%
Cylindrospermopsin 0.9 0 0.788 0.843 91% 5%
IS-Phenylalanine-d5 96% 87%
IS-Uracil-d4 122% 107%
IS criteria 50–150%
%Recovery 70–130%
%RSD <30
FS stands for Field Sample. LFSM stands for Laboratory Fortified Sample Matrix. LFSMD stands for Laboratory Fortified Sample Matrix Duplicate.
Table of contents
Introduction
Food safety testing
Environmental contaminants analysis
Clinical research
Forensic toxicology
Pharmaceutical discovery

Tomorrow’s quantitation: robust, reproducible quantitation workflows of perchlorate in water with IC-MS/MS
In 1997, low-level perchlorate contamination in drinking water (<50 ng/mL) was discovered in the Western U.S, and since then, has been found in additional sites around the US. Although the US EPA has not established a regulation for perchlorate in drinking water, it placed perchlorate on the contaminant candidate list (CCL) and the unregulated contaminants monitoring rule (UCMR). While LC QQQ MS/MS offers very selective analysis of polar molecules such as perchlorate, it requires derivatization of samples, which can be time consuming. IC offers significant benefits due to its suitability for the analysis of polar compounds.
Thermo Scientific Application Note 65021 reported a reproducible quantitation assay for the determination of perchlorate in drinking water using the Thermo Scientific™ Dionex™ ICS-5000+ Hybrid HPIC™ system, coupled with the Thermo Scientific™ TSQ Fortis™ triple quadrupole mass spectrometer. Using the method, target analytes were detected to the lowest calibration level, and the accuracy was within required criteria. The LOD was less than 0.002 μg/L based on a signal-to-noise ratio of >3. The QC samples were found to be within the vendor acceptance limits of 8.88 to 12.3 μg/L, with % RSDs of 0.7 and 1.5 for the parent ions of m/z 99 and 101, respectively.
Contaminants in drinking water: Ion chromatography coupled with triple quadrupole MS technology application note
Environmental contaminants analysis
Tomorrow’s quantitation: robust, reproducible quantitation workflows of perchlorate in water with IC-MS/MS
Extended calibration curve of perchlorate ion in water with parent ion m/z = 101. Calibration levels 3–11 showed %RSD < 4% and signal-to-noise ratios greater than 3 for seven injections.
SampleCalculated
Concentration (µg/L)%RSD S/N
Cal 1 0.002 1.8 >3
Cal 2 0.004 2.3 >3
Cal 3 0.01 3.7 >3
Cal 4 0.04 4.0 >3
Cal 5 0.10 3.5 >3
Cal 6 0.42 2.9 >3
Cal 7 1.0 1.5 >3
Cal 8 4.1 1.4 >3
Cal 9 10.2 1.1 >3
Cal 10 19.3 2.8 >3
Cal 11 50.3 0.5 >3
ERA-QC 9.94 1.5 >3
Table of contents
Introduction
Food safety testing
Environmental contaminants analysis
Clinical research
Forensic toxicology
Pharmaceutical discovery

Contaminants in drinking water: Ion chromatography coupled with triple quadrupole MS application note
Environmental contaminants analysis
Tomorrow’s quantitation with the TSQ Fortis mass spectrometer: robust, reproducible quantitation workflows of haloacetic acids, bromate, and dalapon in water according to EPA Method 557
Robust, reproducible quantitation workflows of haloacetic acids, bromate, and dalapon in water according to EPA Method 557
Disinfection plays an essential role in ensuring clean drinking water, however, byproducts of the process can result in health risks. For example, haloacetic acids (HAAs) form as a result of chlorination, and bromate is formed when disinfecting ozone reacts with naturally occurring bromide. Of the nine known HAAs, the EPA currently regulates five. EPA Method 557 describes LC-MS/MS for the determination of haloacetic acids, bromate, and dalapon. However, analysis of these polar molecules using LC requires derivatization, which can be time consuming. As an alternative, IC offers significant benefits due to its suitability for the analysis of polar compounds, especially in matrices.
Thermo Scientific Application Note 65196 presented a robust, reliable, reproducible quantitation assay for the determination of HAAs, bromate, and dalapon in drinking water using the Thermo Scientific™ ICS-5000+ Hybrid HPIC™ system coupled with the TSQ Fortis triple quadrupole mass spectrometer. As a direct injection method, it offered significant time and cost savings compared GC-ECD methods such as EPA Method 552 that require up to four hrs of sample preparation per sample. Linearity greater than 0.99 was obtained, and all analytes were detected to the lowest calibration level with accuracy within established criteria. The resolution between the matrix peaks and HAAs was excellent, which minimized interferences and contamination of the mass spectrometer ion source.
Ion chromatograms of HAAs: (A) MCAA, (B) MBAA, (C) Bromate, (D) Dalapon, (E) DCAA, (F) BCAA, (G) DBAA, (H) TCAA, (I) BDCAA, (J) DBCAA and (K) TBAA at 1 μg/L.
Table of contents
Introduction
Food safety testing
Environmental contaminants analysis
Clinical research
Forensic toxicology
Pharmaceutical discovery

A comparison between HRAM MS technology and MS/MS for the analysis of polyfluoroalkyl substances by EPA Method 537
The unique water-, oil-, grease-, stain- and heat-resistant properties of perfluoroalkyl substances (PFASs) have led to their widespread use in industrial applications and consumer products. Unfortunately, PFASs have notorious environmental and chemical stability. In animal studies, PFASs have been shown to disrupt normal endocrine activity; reduce immune function; and cause adverse effects on multiple organs and developmental problems. As a result, the US EPA developed Method 537 for the Unregulated Contaminant Monitoring Rule (UCMR 3) program, and in 2012, six PFASs were added to the UCMR 3 list to be monitored. EPA Method 537 describes LC-triple quadrupole MS/MS detection for the quantitation of the target PFASs in drinking water. However, screening strategies that use HRAM ful-scanning with advanced MS/MS scanning modes offer a valuable alternative to triple-quadruple based SRM methods.
Thermo Scientific Application Note 667 compared the sensitivity of HRAMQ Exactive mass spectrometer to triple quadrupole-MS based quantitation of the PFASs in EPA Method 537. The results showed that HRAM MS technology provided equal or better full scan quantitation of target PFASs, with MS/MS confirmation in the full scan mode, compared to triple quadrupole based SRM, with the additional ability to screen for unknown PFASs. Screening for other contaminants was streamlined using Thermo Scientific™ Compound Discoverer™ software and comprehensive compound databases and spectral libraries.
Contaminants in drinking water: HRAM and triple quadrupole MS technology application note
Environmental contaminants analysis
A comparison between HRAM Orbitrap technology and MS/MS for the analysis of polyfluoroalkyl substances by EPA Method 537
2.5 ppt standard of PFOA analyzed using the Q Exactive mass spectrometer and a triple quadrupole mass spectrometer under similar conditions. Excellent quantitative performance and sensitivity was obtained using the Q Exactive mass spectrometer in both full scan and PRM modes. The results obtained were equal to or better than the published LCMRLs using triple quadrupole SRM methods.
a) SRM Analysis
c) HRAM Orbitrap PRM
b) HRAM Orbitrap Full Scan
Table of contents
Introduction
Food safety testing
Environmental contaminants analysis
Clinical research
Forensic toxicology
Pharmaceutical discovery

Quantitative and semi-quantitative determination of PPCPs and their byproducts in wastewater treatment plant samples using UHPLC-Orbitrap MS and data mining technologies
To address needs for PCPPs analysis, Thermo Scientific Poster Note 64109 presented a method to determine PPCP concentrations in wastewater samples, and to examine the transformation of selected PPCPs during treatment. Samples were prepared by solid phase extraction (SPE) and analyzed by HPLC-MS using the UltiMate 3000 HPLC system coupled with the Exactive Plus mass spectrometer. Thermo Scientific™ TraceFinder™ software was used for quantitative analysis of target PPCPs and for non-targeted screening using a database of 312 compounds that included pharmaceutically active compounds and their metabolites, steroids, hormones, surfactants, and perfluorohydrocarbons. The TraceFinder software results were used to perform a ChemSpider™ search and principal component analysis.
The method was applied to permeate samples obtained from a pilot anaerobic membrane bioreactor. Quantitative results showed the prevalence of various PPCPs in the wastewater, particularly of compounds with high usage and/or poor elimination (e.g., caffeine, carbamazepine (CBZ), DEET, lidocaine, lincomycin, ketoprofen, and bezafibrate). For PPCP byproducts, the authors identified insitu microbial degradation as the dominant pathway for triclocarban (TCC) removal, while triclosan (TCS), diclofenac (DCF) and CBZ were eliminated by a combination of photodegradation and metabolism. Thirty by-products were detected, including the toxic compounds chlorophenol and acridone.
Contaminants in wastewater: HRAM technology poster note
Environmental contaminants analysis
Quantitative and Semi-Quantitative Determination of PPCPs and Their By-products in Wastewater Treatment Plants Samples Using UHPLC-Orbitrap MS and Data Mining Technologies
Quantitative results for PPCPS with >75% occurrence in the 35 samples analyzed.
Compound Name Usage CAS # Occur.
Concentration (ng/L)
Min Max Median
Caffeine Stimulant 58-08-2 100% 2.95E+02 2.52E+04 5.45E+03
Carbamazepine Antiepileptic/antidepressant 298-46-4 100% 6.96E+02 1.12E+04 2.52E+03
DEET insect repellent 134-62-3 100% 2.19E+02 1.81E+03 6.52E+02
Lidocaine anesthetic/anti-arrhythmic 137-58-6 100% 1.75E+02 3.41E+03 6.48E+02
Lincomycin Antibiotic 154-21-2 100% 5.18E+01 9.29E+03 6.36E+02
Ketoprofen analgesic/anti-inflammatory 22071-15-4 100% 4.56E+01 3.51E+02 1.27E+02
Bezafibrate lipid regulator 41859-67-0 100% 3.41E+01 3.24E+02 7.16E+01
Sulfamethazine Antibiotic 57-68-1 97% 1.16E+01 1.14E+02 3.12E+01
Bisphenol A commercial additive 80-05-7 95% 1.60E+03 2.80E+06 9.42E+03
Acetaminophen analgesic/anti-inflammatory 103-90-2 95% 3.52E+02 7.86E+05 8.03E+03
Diclofenac analgesic/anti-inflammatory 15307-86-5 95% 2.70E+00 2.08E+04 1.27E+03
Norfloxacin antibiotic 70458-96-7 95% 1.91E+02 1.03E+03 4.33E+02
Triclocarban antimicrobial/antifungal 101-20-2 95% 1.04E+01 1.27E+03 2.97E+02
Triclosan antibacterial/antifungal 3380-34-5 87% 2.07E+02 1.26E+05 3.30E+03
Estrone estrogen 53-16-7 85% 5.10E+00 1.64E+03 2.65E+02
Oxolinic acid antibiotic 14698-29-4 85% 7.89E+01 6.42E+03 1.62E+02
Oxybenzone sunscreen 131-57-7 82% 1.80E+00 1.43E+04 2.95E+02
Norethindrone ovulation inhibitor 68-22-4 82% 4.64E+01 1.46E+03 2.75E+02
Ciprofloxacin antibiotic 85721-33-1 79% 9.34E+02 5.76E+04 4.00E+03
Estriol estrogen 50-27-1 79% 2.69E+01 2.31E+04 6.57E+02
Ibuprofen analgesic/anti-inflammatory 15687-27-1 77% 1.49E+01 1.25E+05 4.37E+03
Table of contents
Introduction
Food safety testing
Environmental contaminants analysis
Clinical research
Forensic toxicology
Pharmaceutical discovery

New ways to correlate the amounts of drug residues in wastewater with drug consumption are driving growing interest in their quantitation. Due to this interest, Fedorova et al. compared the quantitative performance of hybrid quadrupole-Orbitrap-based mass spectrometry with that of QQQ MS for LC-MS analysis of drug residues in wastewater.19 The Q Exactive mass spectrometer was operated at resolution of 70,000 (FWHM) at m/z 200 in full-scan (HRFS) mode and 17,500 (FWHM) at m/z 200 in product ion scan (HRPIS) mode. For the SRM analyses, the first and third quadrupoles of the QQQ mass spectrometer were set to 0.7 FWHM. A mass-extracted window of 5 ppm around the theoretical m/z of each target analyte was used to construct mass chromatograms.
While all three methods showed good linearity and repeatability, the HRPIS mode delivered better sensitivity and selectivity for certain compounds. The selectivity and sensitivity advantages of the Q Exactive mass spectrometer result from quadrupole precursor ion selection combined with HRAM Orbitrap mass-analyzer detection. The LOQs ranged from 0.46 to 20 ng/L. Both the QQQ and the HRPIS Orbitrap mass spectrometer-based MS/MS methods showed good selectivity. The HRFS-based method suffered from more interferences and showed some false positive results when confronted with co-extracted matrix interferences. The authors concluded that the Q Exactive mass spectrometer is suited for trace-level detection and quantitation of most of the drugs tested in complex wastewater matrices and offers potentially better selectivity than QQQ MS instruments for certain compounds.
When exposed to chemical disinfectants used in wastewater treatment, many pharmaceuticals degrade into by-products that can be more toxic than the parent compound itself. To address this problem, Negregaria et al. investigated the stability of a widely used cytostatic etoposide in chlorinated water using the HRAM capability of the Q Exactive mass spectrometer.20 The authors identified two new etoposide oxidation by-products and were able to measure the time course of etoposide degradation into its by-products at different pH values and free chlorine concentrations, and in different water matrices.
19. Fedorova, G.; Randak, T.; Lindberg, R.H.; Grabic, R. Comparison of the quantitative performance of a Q-Exactive high-resolution mass spectrometer with that of a triple quadrupole tandem mass spectrometer for the analysis of illicit drugs in wastewater. Rapid. Commun. Mass Spectrom. 2013, Aug 15;27(15):1751-62.
20. Negreira, N.; López de Alda, M.; Barceló, D. Degradation of the cytostatic etoposide in chlorinated water by liquid chromatography coupled to quadrupole-Orbitrap mass spectrometry: identification
and quantification of by-products in real water samples. Sci. Total Environ. 2015, Feb 15;506-507:36-45.
Environmental contaminants analysis
Contaminants in wastewater: HRAM technology in peer-reviewed publications
• Detect and quantify trace-level compounds in wastewater matrices• Experience superior selectivity
Benefits of HRAM technology
Table of contents
Introduction
Food safety testing
Environmental contaminants analysis
Clinical research
Forensic toxicology
Pharmaceutical discovery

Moschet et al. developed a Q Exactive mass spectrometer-based LC-MS method that relies on exact mass rather than reference standards to assess rarely-investigated pesticides and their transformation products (TPs) in 76 surface water samples.21 One hundred eighty five water-soluble insecticides, fungicides and their major TPs were analyzed. A SPE LC-MS method was developed using 45 known, persistent, and high- sales-volume pesticides. Seventy percent of these targets had LOQs < 5 ng/L. This compound set was then used to develop and optimize a screening method using only exact mass as a priori information. This method resulted in a 70% success rate. False negatives were mainly due to low intensity peaks. The authors then applied the method to the remaining 140 compounds. Nineteen additional substances were detected including two TPs that had never been found in the environment before. The authors concluded that the screening approach was fast, successful, and easily expanded to other micropollutant classes for which reference standards are not accessible.
Due to the large number of potential contaminants, comprehensive assessment of pesticides in surface waters is challenging. Most scientific studies and routine monitoring programs include only 15 to 40 pesticides. Routine, comprehensive screening has not been feasible due to labor-intensive analysis with QQQ mass spectrometers. For this reason, Moschet et al. developed a comprehensive LC-MS screening method relying on the HRAM capability of the Q Exactive mass spectrometer.22 The method covered 86% of all polar organic pesticides sold in Switzerland that are applied to agricultural or urban land (249 compounds) and 134 TPs. Between March and July 2012, the authors regularly drew samples from five medium-sized rivers containing large areas of diverse crops and urban settlements within their catchments. The authors detected over 100 parent compounds and 40 TPs and the sum of the pesticide concentrations was above 1000 ng/L in 78% of samples. The chronic environmental quality standard was exceeded for 19 single substances and the “exceedances” occurred over the entire measurement period in all rivers.
Moschet et al. also applied the Q Exactive mass spectrometer to a large field study designed to evaluate the in-situ calibration of a passive sampler (styrene divinylbenzene (SDB) covered by a polyether sulfone (PES) membrane for 322 polar organic micropollutants.23 As before, five rivers with different agricultural and urban influences were sampled between March and July 2012 using two methods: i) two-week time-proportional composite water samples, and ii) two-week passive sampler deployment. All compounds of different compound classes (logKow -3 to 5, and neutral, anionic, cationic, and zwitterionic species) were analyzed using the Q Exactive mass spectrometer. Because the number of detected substances was similar, LOQs were comparable (median: 1.3 ng/L vs. 1.6 ng/L), and handling was fast and easy. The authors concluded the SDB passive samplers are well-suited for qualitative screening of polar micropollutants.
Environmental contaminants analysis
Contaminants in surface water: HRAM technology in peer-reviewed publications
21. Moschet, C.; Piazzoli, A.; Singer, H.; Hollender, J. Alleviating the reference standard dilemma using a systematic exact mass suspect screening approach with liquid chromatography-high resolution mass spectrometry. Anal. Chem. 2013, Nov 5;85(21):10312-20.
22. Moschet, C.; Wittmer, I.; Simovic, J.; Junghans, M.; Piazzoli, A.; Singer, H.; Stamm, C.; Leu, C.; Hollender, J. How a complete pesticide screening changes the assessment of surface water quality. Environ. Sci. Technol. 2014, May 20;48(10):5423-32.
23. Moschet, C.; Vermeirssen, E. L.; Singer, H.; Stamm, C.; Hollender, J. Evaluation of in-situ calibration of Chemcatcher passive samplers for 322 micropollutants in agricultural and urban affected rivers. Water Res. 2015, Mar 15;71:306-17.
• Screen for surface water contaminants routinely and comprehensively• Quicker method set up times
Benefits of HRAM technology
Table of contents
Introduction
Food safety testing
Environmental contaminants analysis
Clinical research
Forensic toxicology
Pharmaceutical discovery

Of concern because it is poorly biodegradable, iodinated contrast media (ICM) is used to aid in visualization of human tissue, organs, and the cardiovascular system during radiographic medical procedures. Zonja et al. studied the applicability of Orbitrap mass spectrometer-based LC-MS analysis for screening and quantitation of six ICMs and their photo TPs in surface waters.24 The authors began by performing a photodegradation study of ICMs using a sunlight lab-scale simulator. Differential analysis was used to determine the exact masses of molecular ions and retention times of the TPs. Hits were manually filtered to produce a list of 108 suspected TPs.
Next, solid-phase extraction of real surface water samples followed by LC-MS analysis was used to screen for the compounds detected in the photodegradation study. The eleven TPs detected in more than 50% of the samples were selected for structural elucidation using LC-MS and NMR. The median concentrations of parent ICMs ranged from 110 ng/L to 6 μg/L. TPs were detected at concentrations of 8 ng/L to 0.4 μg/L. The authors concluded that the LC-MS method facilitates characterization of ICM degradation products and detection of TPs without standards.
Contaminants in surface water: HRAM technology in peer-reviewed publications
Environmental contaminants analysis
Detect, characterize, and quantitate without standards
Benefits of HRAM technology
24. Zonja, B.; Delgado, A.; Pérez, S.; Barceló, D. LC-HRMS suspect screening for detection-based prioritization of iodinated contrast media photodegradates in surface waters. Environ. Sci Technol.
2015, Mar 17;49(6):3464-72.
Table of contents
Introduction
Food safety testing
Environmental contaminants analysis
Clinical research
Forensic toxicology
Pharmaceutical discovery

25. Roy-Lachapelle, A.; Solliec, M.; Sinotte, M.; Deblois, C.; Sauvé, S. High resolution/accurate mass (HRMS) detection of anatoxin-a in lake water using LDTD-APCI coupled to a Q-Exactive mass
spectrometer. Talanta. 2015, Jan;132:836-44
Anatoxin-a (ANA-a) is highly neurotoxic cyanotoxin produced by cyanobacteria that is a threat to humans and livestock when ingested. Roy-Lachapelle et al. developed a rapid method that relies on HRAM Orbitrap mass spectrometer-based detection to distinguish ANA-a from the natural amino acid phenylalanine (PHE).25 The Q Exactive mass spectrometer was equipped with laser diode thermal desorption-atmospheric pressure chemical ionization (LDTD-APCI). Full-scan and targeted ion fragmentation modes were compared to determine which achieve highest selectivity and sensitivity. The method was then applied to eight lake water samples that showed signs of cyanobacterial blooms.
Even though the resolving power of the Q Exactive mass spectrometer was sufficient to distinguish the ANA-a and PHE, the targeted ion fragmentation mode greatly increased selectivity. Internal calibration with standard addition was validated using isotopically labeled phenylalanine (PHE-D5) as the internal standard. The method was validated and determined to be linear with correlation coefficients (r2) above 0.999. The method yielded better signal-to-noise and thus the lower detection and quantification limits of 0.2 and 0.6 μg/L, respectively, for real samples than in a previous study of a QQQ-based method. Accuracy, inter-day, and intra-day relative standard deviations were below 15%, and signal recovery in the targeted ion fragmentation mode showed no significant matrix effects with values ranging from 96 to 108%. Using the lock mass feature, mass accuracy was below 1 ppm with low variation. In sum, the LDTD-APCI Q Exactive mass spectrometer system enabled ultra fast screening—in less than 15 seconds per sample–of anatoxin-a at concentrations below established guidelines (3.7 μg/L) in water matrices, with simplified sample preparation and high selectivity.
Contaminants in surface water: HRAM technology in peer-reviewed publications
Environmental contaminants analysis
• Screen at concentrations below established guidelines, rapidly, with simplified sample preparation and high selectivity• Achieve lower detection and quantification limits than previous study of a QQQ based method
Benefits of HRAM technology
Table of contents
Introduction
Food safety testing
Environmental contaminants analysis
Clinical research
Forensic toxicology
Pharmaceutical discovery

Contaminants in surface water: Triple quadrupole MS technology application note
Environmental contaminants analysis
Direct analysis of selected per- and polyfluorinated alkyl substances (PFAS) in ground, surface, and waste water by LC-MS/MS
Direct analysis of selected per- and polyfluorinated alkyl substances (PFAS) in ground, surface, and wastewater
PFASs are ubiquitous being present in food packaging material, food processing equipment, cookware, stain repellants, polishes, waxes, paints, cleaning products, and fire-fighting foams. Plants can accumulate PFASs when grown in PFAS-containing soil and/or water. PFASs are very persistent in the environment and accumulate in the human body over time, leading to adverse health effects. US EPA Method 537 uses SPE followed by LC-MS/MS detection. An updated version of the method, EPA 537.1, includes additional PFASs such as GenX. ASTM D7979, an alternative method developed for additional water matrices such as surface, ground, and wastewaters, is based on simple sample extraction and filtration followed by LC-MS/MS analysis.
Thermo Scientific Application Note 65397 described a direct analysis method for the determination of 24 PFASs in a variety of non-drinking water matrices using the Thermo Scientific™ Vanquish™ Flex Binary UHPLC system coupled with the Thermo Scientific™ TSQ Altis™ triple quadrupole mass spectrometer. The data obtained was used for the validation of a new method—EPA 8327—as part of an inter laboratory study sponsored by the EPA Office of Water. Excellent linearity and quantitative accuracy were achieved over the range of 5 to 200 ng/L, with correlation coefficients > 0.99. All 24 PFASs were detected and quantifiable at both low and high spike concentrations. Quantification of the majority of PFASs was five times lower than the LLOQ reporting requirements in ASTM D7979-17 and EPA 8327. Recovery of the 24 PFASs spiked into the water matrices ranged from 70% to 130% as required, except for PFBA spiked at the low level in wastewater. All spiked water matrix samples showed RSDs below 20% for most of the PFASs, demonstrating the method’s robustness and reproducibility.
The LLOQs for all 24 PFAS analyzed in this method, based on accuracy and RSD ≤20%, demonstrated the high sensitivity achieved with the TSQ Altis mass spectrometer for the quantitation of PFAS at very low levels (ppt range).
Table of contents
Introduction
Food safety testing
Environmental contaminants analysis
Clinical research
Forensic toxicology
Pharmaceutical discovery

Targeted and nontargeted MS analysis of contaminants in storm water retention ponds
Comprehensive assessment of the aquatic fate and effects of organic micropollutants is greatly hindered by the need to develop compound-specific methodologies prior to sampling and analysis. To address this need, Thermo Scientific Application Note 599 described a data-driven workflow to analyze water samples for organic micropollutants. Samples collected from a coastal golf course community were screened for the presence of trace organic contaminants by non-targeted HPLC–HRAM MS. After broad-spectrum data acquisition, the HRAM data was screened for approximately 1000 known contaminants using the environmental and food safety (EFS) compound database and HRAM MS/MS spectral library. Identified contaminants were then quantitatively assessed using a high-throughput online SPE LC-triple quadrupole MS/MS method. The authors determined their multifaceted approach to identifying and quantifying non-targeted emerging compounds in surface and ground water samples irrigated with reclaimed water highly effective. The online SPE LC-triple quadrupole MS/MS method provided quantitation of micropollutants down to sub-ppt (ng/L) levels.
Contaminants in surface waters: HRAM and triple quadrupole MS technology application note
Environmental contaminants analysis
Targeted and Nontargeted MS Analysis of Contaminants in Storm Water Retention Ponds
Compounds monitored by online SPE LC/MS, method parameters, and instrument limits of detection. Samples were quantitated down to the sub-ppt (ng/L) level.
CompoundRetention
Time (min)
Precursor Mass (m/z)
Product Mass 1 (m/z)
CE Mass 1 (V)
Product Mass 2 (m/z)
CE Mass 2 (V)
LOD (ng/L)
Acephate 4.4 184.0 143 10 95 25 0.24
Allethrin 12.4 303.2 135 15 220 20 7.8
Ametryn 9.6 228.1 186 19 96 26 0.12
Atraton 8.2 212.2 170 19 100 29 0.12
Atrazine 9.7 216.1 174 16 104 29 0.12
Atrazine Desethyl 7.6 188.1 146 16 104 30 0.12
Atrazine-desisopropyl 6.5 174.1 132 17 104 28 0.24
Azoxystrobin 10.4 404.1 372 15 329 33 0.12
Benzotriazole 6.6 120.1 65 25 92 18 7.8
Bioresmethrin 13.2 339.2 171 14 293 15 62.5
Bloc (Fenarimol) 10.3 331.2 268 23 311 33 0.24
Carbaryl 9.3 202.0 145 12 127 30 0.12
Carbendazim 6.0 192.1 160 20 132 33 0.12
DEET 9.8 192.1 119 19 91 34 0.98
Etofenprox 13.6 394.0 177 14 135 26 3.9
Fenamiphos 11.2 304.1 217 25 234 17 0.12
Fluoxastrobin 11.0 459.1 427 18 188 38 0.5
Fluridone 10.3 330.1 309 37 310 29 0.12
Flutolanil 10.8 324.0 262 18 242 26 0.06
Formasulfuron 9.4 453.1 183 25 272 15 0.12
Halosulfuron-methyl 11.2 435.1 182 20 139 50 0.12
Imidacloprid 6.9 256.0 209 18 175 20 0.06
Iprodione_a 11.3 330.0 245 16 - - 15.63
Iprodione_b 11.3 332.0 247 16 - - 31.25
Metalaxyl 9.8 280.2 220 17 160 30 0.06
Metoprolol 7.3 268.2 116 17 191 20 0.24
Oxadiazon 12.4 345.1 303 15 220 20 3.9
Pramoxine 9.6 294.2 128 22 100 32 0.12
Prometron 9.1 226.1 142 24 170 19 0.12
Propanmide 10.8 256.0 173 25 209 20 0.12
Quinclorac 8.3 242.0 161 34 224 18 7.8
Thiencarbazone-methyl 8.7 391.0 359 10 230 20 3.9
Thiophanate-methyl 8.9 343.0 151 24 311 13 0.24
Tramadol 7.2 264.2 58 18 246 12 0.06
Table of contents
Introduction
Food safety testing
Environmental contaminants analysis
Clinical research
Forensic toxicology
Pharmaceutical discovery

Qualitative and quantitative analysis of contaminants of emerging concern in biosolids using a dilute and shoot MS method
Contaminants of emerging concern (CECs), such as pharmaceuticals and pharmaceutical personal care products (PPCPs) and endocrine disruptors (EDCs), have earned increasing international attention due to their potential environmental and health impacts. Quantitative information on CECs in biosolids and biological tissues is readily available from LC-triple quadrupole MS studies. However, in addition to quantitative data for target compounds, full-scan HRAM MS studies can also provide useful information about non-targeted compounds present, such as transformation by-products.
Thermo Scientific Application Note 645 described a rapid dilute and shoot HRAM-based LC-MS/MS workflow to quantify target CECs in biosolids that adds screening for non-targeted CECs. TraceFinder software was used to perform quantitative analysis of 56 PPCPs as well as screening using a database of 381 compounds including PPCPs and their metabolites, steroids, hormones, perfluorohydrocarbons, surfactants, and organophosphorus flame retardants. Semi-quantitative results found the presence of surfactants, musks, and treatment by-products in the biosolid samples analyzed. Five compounds [bisphenol A, caffeine, carbamazepine (CBZ), triclocarbon (TCC), and triclosan (TCS)] were found in the high ppb range. Concentrations of TCC and TCS were out of the range of the highest calibration level (1000 ng/mL). Targeted screening detected numerous additional compounds, including treatment by-products of CBZ, TCC, and TCS. Artificial sweeteners, surfactants, and musks were abundant along with organphosphorus flame retardant and quaternary ammonium surfactants.
Contaminants in biosolids: HRAM technology application note
Environmental contaminants analysis
Qualitative and Quantitative Analysis of Contaminants of Emerging Concern in Biosolids Using a Dilute and Shoot UHPLC-OrbitrapMS Method
Results of quantitative analysis of target PPCPs in biosolids.
Compound#1 #2 #3 #4 #5 #6
ng/g
Bisphenol A 30,200 9,220 3,680 84,280 85,700 47,750
Caffeine 356 2,500 807 1,230 1,260 1,170
Carbamazepine 3,490 3,520 3,600 3,300 3,600 3,500
Clofibric acid 91 73 36 84 34 106
DEET 174 218 190 273 214 210
Esterone 1,984 2,400 938 <MDL 631 <MDL
Estriol <MDL 955 <MDL <MDL <MDL <MDL
Lidocaine 190 105 80 123 94 <MDL
Oxybenzone 326 81 31 <MDL 418 484
Triclocarban* 2,947 2,770 2,040 1,510 2,080 1,130
Triclosan* 3,290 3,070 2,290 1,680 2,580 1,390
* Semi-quantitative results
Table of contents
Introduction
Food safety testing
Environmental contaminants analysis
Clinical research
Forensic toxicology
Pharmaceutical discovery

Analysis of perfluoroalkyl acids in wastewater, sludge, and liver extracts
Perfluoroalkyl acids (PFAAs) are global pollutants that bioaccumulate in the food chain. Thermo Scientific Application Note 543 evaluated the performance of the Thermo Scientific™ Exactive™ mass spectrometer for the analysis of ten PFAAs in pooled extracts of environmental samples. Performance was evaluated for quantitative linearity, specificity, and sensitivity. Samples were chosen to represent both high and low levels of PFAAs in complex matrices, and included liver extracts from Antarctic and Arctic seals,
influent water, and sludge from a wastewater treatment plant. The authors determined the linearity of the Exactive mass spectrometer suitable for quantification of PFAAs at concentrations ranging from 0.1 μg/kg to 50 μg/kg in complex extracts. The high mass resolution (50,000 FWHM) and mass accuracy (1 ppm) of the Exactive mass spectrometer provided efficient peak confirmation and decreased matrix effects. The use of lock masses could have enhanced the mass accuracy; however, the Orbitrap instrument was stable for the duration of the sample analysis.
Contaminants in biosolids: HRAM technology application note
Environmental contaminants analysis
Analysis of Perfluoroalkyl Acids in Wastewater, Sludge, and Liver Extracts Using HighResolution, Accurate Mass LC-MS
The extracted liver from Antarctic seals showed significantly lower concentrations of PFAAs than the extracted liver from Arctic seals.
Antarctic Seal Arctic Seal Arctic Seal Arctic Seal µg/kg µg/kg µg/kg µg/kg
PFHpA – – 0.08 1.05
PFHxS – 0.21 – 0.21
PFOA 0.25 0.35 2.28 4.37
PFNA 0.07 4.78 1.72 1.76
PFOS – 22.95 17.79 2.28
PFDA – 2.82 12.59 1.09
PFOSA – 0.14 – –
PFUnA – 5.45 0.44 –
PFDoA 0.22 0.87 – –
PFTrA – 1.97 – –
Table of contents
Introduction
Food safety testing
Environmental contaminants analysis
Clinical research
Forensic toxicology
Pharmaceutical discovery

Analysis of nine N-nitrosamines using LC-HRAM MS
N-nitrosamines have a high mutagenic and carcinogenic potential. Thermo Scientific Application Brief 64644 described a method for the analysis of N-nitrosamines in wastewater and drinking water using the Dionex UltiMate 3000 RSLC system equipped with the Thermo Scientific™ Hypersil GOLD™ C18 column and the Q Exactive mass spectrometer.
A faster alternative to traditional GC-MS methods for the analysis of nitrosamines, the method provided sensitive and robust separation, identification, and quantification of nine target N-nitrosamines. Detection limits ranged from 0.4 to 12 ng/L. Precision in HPLC-grade water and wastewater matrices ranged from 0.98% to 19%. Extraction recoveries ranged from 68% to 83% for eight of the nine target N-nitrosamines, exceeding the overall extraction efficiency of 52% specified in United States (US) Environmental Protection Agency (EPA) Method 521.
Contaminants in multiple matrices: HRAM technology application brief
Environmental contaminants analysis
Analysis of Nine N-Nitrosamines Using Liquid Chromatography—High-Resolution, Accurate-Mass Mass Spectrometry
LC-HRAM MS method validation results for linearity, LOD, and LOQ of N-nitrosamines in drinking water and wastewater.
CompoundDrinking water Wastewater
R2
MLOD (ng/L) MLOQ (ng/L) Linearity Range (ng/L) R
2MLOD (ng/L) MLOQ (ng/L) Linearity Range
(ng/L)
NDMA 0.9969 4.2 13 20–200 0.9984 7.6 23 20–200
NMEA 0.9920 9.1 28 20–200 0.9980 12 35 50–200
NPyr 0.9968 1.5 4.6 5–200 0.9975 11 35 50–200
NDEA 0.9955 2.5 7.4 10–200 0.9973 5.9 18 20–200
NPip 0.9973 2.3 7.0 10–200 0.9982 6.4 20 20–200
NMOR 0.9968 6.5 20 20–200 0.9954 4.8 15 20–200
NDPA 0.9961 2.4 7.2 10–200 0.9985 4.7 14 20–200
NDBA 0.9960 1.8 5.3 5–200 0.9972 2.7 8.1 10–200
NDPhA 0.9983 0.4 1.3 1–200 0.9991 2.8 8.4 10–200
Table of contents
Introduction
Food safety testing
Environmental contaminants analysis
Clinical research
Forensic toxicology
Pharmaceutical discovery

1,2 N-nitrosamines (NAs) are receiving increased attention due to their high carcinogenic and mutagenic potential at low concentrations. Though a countrywide maximum level in drinking water is not yet established in North America, California and Ontario have set limits of 10 ng/L and 9 ng/L, respectively. N-Nitrosamine compounds are produced by industrial activity and resist removal during wastewater treatment. In addition, N-Nitrosamines such as NDMA are by-products of disinfection by chlorination and chloramination. Because of their hydrophobicity and polarity, extraction and detection of NAs at low levels is a challenge. Ngongang et al. developed a selective and robust Q Exactive mass spectrometer-based SPE-UHPLC-MS method for the analysis of nine N-nitrosamines in drinking and wastewater matrices.18 SPE was employed as a cost-effective method that helps in achieving low detection limits and high sample throughput.
The authors validated the method in HPLC grade water, drinking water and wastewater matrices and determined that the method sensitivity is comparable with that of GC-MS and LC-MS/MS methods. HRAM data produced by the Q Exactive mass spectrometer helped the authors identify and quantify the target NAs unambiguously, and the selectivity of the HRAM method eliminated matrix interferences. The authors concluded that although GC-MS can provide better sensitivity for N-nitrosamines, LC-MS provides significant time savings because of the longer retention times of GC-MS. Furthermore, LC-MS enabled detection of both GC-detectable and GC-undetectable NAs such as NDPhA.
Environmental contaminants analysis
Contaminants in multiple matrices: HRAM technology in peer-reviewed publications
• Experience superior selectivity
Benefits of HRAM technology
18. Ngongang, A.D.; Vo Duy, S.; SauveÅL, S. Analysis of nine N-nitrosamines using liquid chromatography-accurate mass high resolution mass spectrometry on a Q-Exactive instrument.Anal. Methods. 2015.
Table of contents
Introduction
Food safety testing
Environmental contaminants analysis
Clinical research
Forensic toxicology
Pharmaceutical discovery

Clinical research
Clinical research overview
Metabolism and drug monitoring research
Table of contents
Introduction
Food safety testing
Environmental contaminants analysis
Clinical research
Forensic toxicology
Pharmaceutical discovery

Quantitative analysis of drugs in various body fluids, such as plasma, serum, and cerebrospinal fluid (CSF), is conducted in many research laboratories. SRM analysis using a triple quadrupole LC-MS/MS system has been routinely employed for quantitative analysis. Although in most cases SRM offers the required sensitivity and specificity, it suffers from interferences and a lack of robustness and needs expert MS users. HRAM Orbitrap mass spectrometer technology offers an attractive alternative with unique benefits of specificity, sensitivity and, more importantly, ease of use.
Clinical research overview
Clinical research
For Research Use Only. Not for use in diagnostic procedures.
Table of contents
Introduction
Food safety testing
Environmental contaminants analysis
Clinical research
Forensic toxicology
Pharmaceutical discovery

Mass Spectrometry immunoassay coupled with peptide enrichment to detect Thyroglobulin by capillary flow LC-MS/MS
The measurement of serum thyroglobulin (Tg) is important for diagnostics and follow-up treatment of thyroid cancers. While immunoassays have been the standard quantitation technique, a high amount of false negative results occur because Anti-Tg autoantibodies endogenously block the binding epitope.
Thermo Scientific Poster 65238 evaluated a user-friendly, automated technique to measure Tg for clinical research with low dead volume and improved performance for washes over beads. Sample preparation used mass spectrometric immunoassay (MSIA) with stable isotope standards and capture by anti-peptide antibodies (SISCAPA) in conjugation. Method development was performed on the UltiMate 3000 LC and Q Exactive mass spectrometer. Quantitative experiments were verified with the Ultimate 3000 RSLC nano LC system equipped with a capillary flow selector. The authors determined that capillary flow LC-MS provided below ng/mL sensitivity and the robustness needed for running large batches of samples. In addition, affinity based sample preparation prevented interference from anti-TG autoantibodies.
Metabolism and drug monitoring research: HRAM technology poster
Clinical research
Mass Spectrometry Immunoassay Coupled with Peptide Enrichment to Detect Thyroglobulin by Capillary Flow LC/MS/MS in Clinical Research
Experimental workflow: MSIA immuno-capture of Tg peptide with detection using capillary LC-MS.
Immobilized Affinity ligand
Target Selection
Elution
Method Development – Transition selection
Semi quantitation – large SRM panel
Table of contents
Introduction
Food safety testing
Environmental contaminants analysis
Clinical research
Forensic toxicology
Pharmaceutical discovery

Metabolism and drug monitoring research: HRAM technology application note
Clinical research
Quantitation of 25-Hydroxyvitamin D3 and 25-Hydroxyvitamin D2 in Plasma for Clinical Research Using an Affordable High-Resolution Mass Spectrometer
Quantitation of 25-Hydroxyvitamin D3 and 25-Hydroxyvitamin D2 in plasma using an affordable high-resolution mass spectrometer
Analysis of vitamin D2 and vitamin D3 25-hydroxy metabolites (25OHD2 and 25OHD3) in human plasma is one of the highest volume clinical research applications that use LC-MS methods. For this reason, clinical research laboratories seek fast and cost-efficient methods to improve analytical efficiency. Thermo Scientific Application Note 634 demonstrated a simple method that uses the Q Exactive Focus hybrid quadrupole-Orbitrap mass spectrometer. Samples were processed by protein precipitation, and the total run time with UltiMate 3000RS LC system was two minutes.
Limits of quantitation (LOQ) for 25OHD3 and 25OHD2 were 4 ng/mL. Calibration ranges were 4–100 ng/mL, where 100 ng/mL was the highest evaluated concentration. Intra-assay precision was better than 7.64% RSD and 13.0% RSD for 25OHD3 and 25OHD2, respectively. Inter-assay precision was better than 6.1% RSD and 10.5 %RSD for 25OHD3 and 25OHD2. Method accuracy determined by analysis of NIST calibrators for 25OHD3 ranged from 88.3% to 100%. For 25OHD2, the accuracy of the single calibration concentration was 85.8%. Limited matrix effects were observed. Recovery in six donor samples ranged from 104% to 112% and from 79.9% to 91.2% for 25OHD3 and 25OHD2, respectively.
Clinical research
Combined stick mode chromatogram for the internal standard and analytes at their respective LOQs illustrating over 20 scans collected across the peak.
06
25OHD2
25OHD3
Internal Standard(D6–25OHD3)
Table of contents
Introduction
Food safety testing
Environmental contaminants analysis
Clinical research
Forensic toxicology
Pharmaceutical discovery

Clinical research
Analysis of Immunosupressant Drugs in Whole Blood Using a High-Efficiency Method on an Affordable High-Resolution Mass Spectrometer
Analysis of immunosuppressant drugs in whole blood using a high-efficiency method on an affordable high-resolution mass spectrometer
Clinical research laboratories commonly use LC-triple quadrupole MS methods for the analysis of immunosuppressant drugs. Thermo Scientific Application Note 632 evaluated a Q Exactive Focus hybrid quadrupole-Orbitrap mass spectrometer as a quantitative platform for high-efficiency analysis of the immunosuppressant drugs tacrolimus, everolimus, sirolimus and cyclosporin A in whole blood. Samples were processed by protein precipitation. A two-minute gradient elution was performed using UltiMate 3000RS LC system.
The authors determined the results met clinical research laboratory requirements and correlated well with data collected using a triple quadrupole mass spectrometer. LOQs were defined as the lowest concentrations that had back-calculated values within 20% and %RSD for five replicates within 20%. Using these criteria, LOQs ranged from 2.27 ng/mL to 26.1 ng/mL. Calibration ranges were linear for all analytes, calibration standard precision (n=5) was better than 10%, and accuracy was within ±7%. Accuracy was within ±17% for the lowest QC sample and within ±10% for remaining QC samples. Limited matrix effects were observed. %Recovery in five donor samples ranged from 82% to 112%. Cross-correlation for the triple quadrupole and Q Exactive Focus mass spectrometer methods for tacrolimus and cyclosporin A were linear with slopes of 1 and coefficient of correlations better than 0.97.
Clinical research
Intra-assay and inter-assay precision were better than 7% for all analytes.
Metabolism and drug monitoring research: HRAM technology application note
Analyte QC1 QC2 QC3 QC4
%RSD
Tacrolimus 4.1 – 5.0 3.7 – 5.6 2.6 – 4.2 3.9 – 5.1
Sirolimus 2.3 – 5.5 3.4 – 4.5 3.2 – 6.1 4.3 – 5.0
Everolimus 3.5 – 4.6 2.0 – 4.3 3.2 – 5.7 2.1 – 5.2
Cyclosporin A 2.2 – 4.2 2.8 – 4.9 3.9 – 6.8 4.6 – 5.1
Analyte QC1 QC2 QC3 QC4
%RSD
Tacrolimus 4.6 4.5 3.8 4.2
Sirolimus 4.2 3.7 4.2 4.2
Everolimus 5.9 4.5 4.5 3.9
Cyclosporin A 3.5 3.5 5.1 4.6
Table of contents
Introduction
Food safety testing
Environmental contaminants analysis
Clinical research
Forensic toxicology
Pharmaceutical discovery

28. Dahmane, E.; Boccard, J.; Csajka, C.; Rudaz, S.; Décosterd, L.; Genin, E.; Duretz, B.; Bromirski, M.; Zaman, K.; Testa, B.; Rochat, B. Quantitative monitoring of tamoxifen in human plasma extended to 40 metabolites using liquid-chromatography high-resolution mass spectrometry: new investigation capabilities for clinical pharmacology. Anal. Bioanal. Chem. 2014, Apr;406(11):2627-40
29. Mueller, D. M; von Eckardstein, A.; Saleh, L. Quantification of teicoplanin in plasma by LC-MS with online sample clean-up and comparison with QMS® assay. Clin. Chem. Lab. Med. 2014, Jun;52(6):879-87.
Though drug metabolism is thought to impact drug toxicity, determination of drug metabolites is not fully explored due to the challenges faced in metabolite profiling. Streamlining analysis of in vivo drug metabolism and pharmacovigilance studies could offer a more comprehensive understanding of drug biotransformation. To understand if the analytical challenges can be addressed, Dahmane et al. compared the quantification of the pharmaceutical drug tamoxifen, and three of its metabolites in plasma using high-resolution Orbitrap and QQQ mass spectrometer technologies.28 Of particular interest was the ability of the Orbitrap mass spectrometer to collect full-scan mass spectral data with comparable analytical selectivity and sensitivity to the SRM data collected using a QQQ mass spectrometer.
Using simultaneous Quan/Qual capability, the Orbitrap mass spectrometer-based research method enabled identification and relative quantitation of 37 more tamoxifen metabolites than the QQQ method. Using multivariate analysis, the researchers associated metabolite patterns and ratios with the administration of tamoxifen and the CYP2D6 genotype, an enzyme important in drug metabolism. Two hydroxylated metabolites were identified as putative CYP2D6 substrates. Relative quantitation was demonstrated to be reasonably precise at < 20% and suggested that the metabolites found were in consequential amounts.
Mueller et al. presented a method to quantify the five main components of the therapeutic drug teicoplanin.29 The method coupled turbulent-flow-based online extraction with LC-MS analysis performed using a Q Exactive mass spectrometer.4 The results of the LC-MS method were compared to the commercially available immunoassay QMS® teicoplanin. Results obtained using the Q Exactive mass spectrometer-based LC-MS method correlated well with the results obtained using immunoassay, demonstrating within- and between-day precision and accuracy suitable for quantitative analysis of therapeutic drugs for clinical research.
Metabolism and drug monitoring research: HRAM technology in peer-reviewed publications
Clinical research
Detect, characterize and quantitate without standards
For Research Use Only. Not for use in diagnostic procedures.
Benefits of HRAM technology
Table of contents
Introduction
Food safety testing
Environmental contaminants analysis
Clinical research
Forensic toxicology
Pharmaceutical discovery

30. Henry, H.; Sobhi, H. R.; Scheibner, O.; Bromirski, M.; Nimkar, S. B.; Rochat, B. Comparison between a high-resolution single-stage Orbitrap and a triple quadrupole mass spectrometer for quantitative analyses of drugs. Rapid Commun. Mass Spectrom. 2012, Mar 15;26(5):499-509.
31. Li, T. M.; Chen, J.; Li, X.; Ding, X.J.; Wu, Y.; Zhao, L.F.; Chen, S.; Lei, X.; Dong, M.Q. Absolute quantification of a steroid hormone that regulates development in Caenorhabditis elegans. Anal. Chem. 2013, Oct 1;85(19):9281-7.
Henry et al. compared the full-scan HRAM performance of the Q Exactive mass spectrometer with that of the Thermo Scientific™ TSQ Quantum Discovery™ and Thermo Scientific™ Quantum Ultra™ triple quadrupole mass spectrometers operating in the SRM mode for LC-MS quantitation of drugs in plasma for clinical research.30 The Q Exactive mass spectrometer was set to mass resolution of 50,000 (FWHM) at m/z 200 and a mass extracted window of 5 ppm around the theoretical m/z of each analyte was used to construct chromatograms for quantitation. Seventeen drugs, including eight antifungal agents (anidulafungin, caspofungin, fluconazole, itraconazole, hydroxyitraconazole posaconazole, voriconazole, and voriconazole-N-oxide), four immunosuppressants (ciclosporine, everolimus, sirolimus, and tacrolimus) and five protein kinase inhibitors (dasatinib, imatinib, nilotinib, sorafenib, and sunitinib), were analyzed.
The quantitative results obtained from the Q Exactive mass spectrometer demonstrated detection selectivity, assay precision, accuracy, linearity, and sensitivity comparable and with good correlation to that obtained using the QQQ MS instruments in the SRM mode. The Q Exactive mass spectrometer method was compatible with sample preparation approaches used for QQQ-based SRM analyses. The authors commented that the Q Exactive mass spectrometer method offered several benefits: ease of research method development with no optimization of SRM parameters, ability to rapidly transfer the analysis from one mass spectrometer to another, more complete full-scan qualitative information, and easier troubleshooting. Considering the advantages, the authors suggested that there should be a shift in how routine quantitative analyses of small molecules are performed for clinical research.
Dafachronic acid (DA) is a steroid hormone required for the reproductive development of Caenorhabditis elegans into fertile adults. Li et al. developed a simple, sensitive research method for the absolute quantification of DA that employs derivatization with 2-picolylamine and the high-resolution SIM capability of the Q Exactive mass spectrometer.31 Due to the research method sensitivity, only relatively small amounts of worms were needed for the analysis. Orbitrap mass spectrometer-based high-resolution SIM analyses outperformed targeted MS/MS analysis (on the same instrument) and QQQ-based SRM. The LOQ was determined to be as low as 1 pg of DA, enabling absolute quantification of endogenous DA during the worms’ reproductive development. The DA levels at different developmental stages and in different Daf-c mutants showed that during the L2 larval stage, DA is highly elevated to ensure complete reproductive development of C. elegans.
Metabolism and drug monitoring research: HRAM technology in peer-reviewed publications
Clinical research
• Obtain high-resolution SIM results surpassing QQQ-based SRM• Reduce the amount of sample needed for high-sensitivity analysis
For Research Use Only. Not for use in diagnostic procedures.
Benefits of HRAM technology
Table of contents
Introduction
Food safety testing
Environmental contaminants analysis
Clinical research
Forensic toxicology
Pharmaceutical discovery

Quantitative analysis of estradiol and testosterone in plasma
Analysis of estradiol and testosterone in plasma for clinical research requires a sensitive analytical method. LC-triple quadruple MS/MS is widely adopted as a sensitive and selective technique for this application. Thermo Scientific Technical Note 64973 described a sensitive LC-MS/MS method for quantitative analysis of estradiol and testosterone in plasma for clinical research using the Vanquish Flex Binary HPLC system coupled the TSQ Altis triple quadrupole mass spectrometer. The method provided the superior sensitivity required for clinical research. LOQs in plasma obtained were 2 pg/mL for testosterone and 20 pg/mL for estradiol. Precisions were < 8% and 7% for testosterone and estradiol, respectively, for all replicates at all concentrations.
Metabolism and drug monitoring research: Triple quadrupole MS technology technical note
Clinical research
Quantitative analysis of estradiol and testosterone in plasma for clinical research using the TSQ Altis triple quadrupole mass spectrometer
(Left) Testosterone (A) calibration curve, (B) LLOQ chromatogram for quantifying ion, and (C) LLOQ chromatogram for confirming ion. (Right) Estradiol (A) calibration curve, (B) LLOQ chromatogram for quantifying ion, and (C) LLOQ chromatogram for confirming ion.
D
C
B
A
D
C
B
A
RSD ≤ 7% (n=3)Accuracy ± 19%
RSD ≤ 8% (n=3)Accuracy ± 19%
Table of contents
Introduction
Food safety testing
Environmental contaminants analysis
Clinical research
Forensic toxicology
Pharmaceutical discovery

Detection of controlled substances in blood using the VeriSpray ion source with MS
The abuse of controlled substances is a serious worldwide problem, causing significant societal disruption and economic damage. Mitigating the effects of drug abuse requires simple methods that provide higher throughput for screening and quantifying these substances in biological matrices. Thermo Scientific Technical Note 65420 investigated the Thermo Scientific™ VeriSpray™ PaperSpray system coupled to a TSQ Altis triple quadrupole mass spectrometer as a drug-screening tool for clinical research and forensic toxicology. Cocaine, diazepam, fentanyl, hydrocodone, methamphetamine, and zolpidem were analyzed.
The solution allowed robust, rapid (2 min), and automated analysis, where sample storage, extraction, and ionization all took place on VeriSpray sampling plates with no sample pretreatment or separation. All seven substances were quantitated simultaneously. The correlation coefficient (R2) for each calibration curve was greater than 0.98, indicating good linearity. Detection limits were below the concentrations normally encountered in forensic toxicology, except for buprenorphine.
Metabolism and drug monitoring research: PaperSpray system coupled to triple quadrupole MS technology technical note
Clinical research
Detection of controlled substances in blood samples using the VeriSpray ion source with TSQ Altis MS for clinical research and forensic toxicology
Limit of detection (LOD) and calibration curve correlation coefficient (R2) in human blood obtained using the VeriSpray system.
Compound LOD (ng/mL) R2
Buprenorphine 13 0.9909
Cocaine 5 0.9916
Diazepam 11 0.9902
Fentanyl 3 0.9881
Hydrocodone 23 0.9923
Methamphetamine 68 0.9928
Zolpidem 5 0.9928
Table of contents
Introduction
Food safety testing
Environmental contaminants analysis
Clinical research
Forensic toxicology
Pharmaceutical discovery

Metabolism and drug monitoring research: Triple quadrupole MS technology technical note
Clinical research
Quantification of benzodiazepines in human plasma or serum by LC-MS/MS
Thermo Scientific Technical Note 65135 described a method to quantify benzodiazepines (35) in human plasma or serum for clinical research applications. Twenty deuterated internal standards were used for the quantification and sample preparation was performed by simple offline internal standard addition and protein precipitation. Extracts were injected onto the Vanquish Flex Binary system coupled to the TSQ Quantis triple quadrupole mass for SRM detection. The authors proved the method linear in the calibration ranges covered. Method accuracy was outstanding with the percentage bias ranging between -9.3% and 10.3%. The %CV for intra-assay precision was always below 14.8% for all the analytes, and the maximum %CV for inter-assay precision including all the analytes was 11.3%. In sum, the method offered quick and simple offline protein precipitation with concomitant internal standard addition and met clinical research laboratory requirements for sensitivity, linearity of response, accuracy, and precision.
Clinical research
Quantification of benzodiazepines in human plasma or serum by liquid chromatographytandem mass spectrometry for clinical research
The data demonstrated outstanding accuracy of the method with the percentage bias between nominal and average back-calculated concentration for the used control samples ranging
between -9.3% and 10.3%.
Table of contents
Introduction
Food safety testing
Environmental contaminants analysis
Clinical research
Forensic toxicology
Pharmaceutical discovery
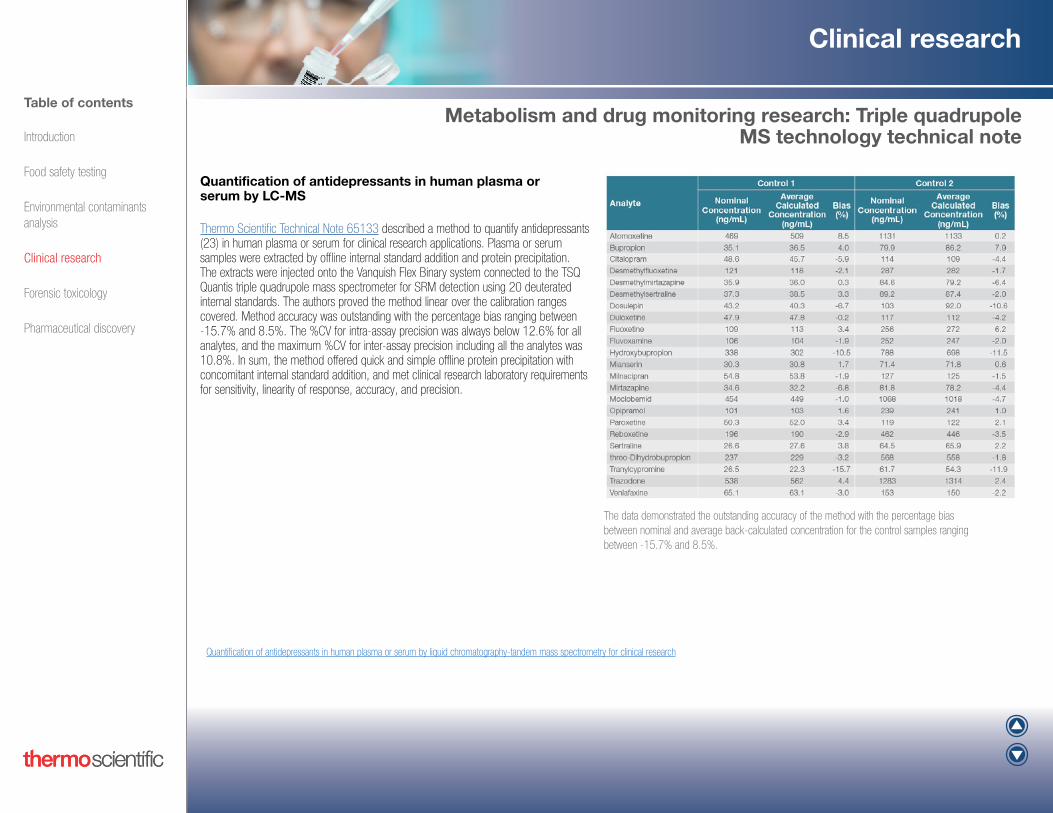
Metabolism and drug monitoring research: Triple quadrupole MS technology technical note
Clinical research
Quantification of antidepressants in human plasma or serum by liquid chromatography-tandem mass spectrometry for clinical research
Quantification of antidepressants in human plasma or serum by LC-MS
Thermo Scientific Technical Note 65133 described a method to quantify antidepressants (23) in human plasma or serum for clinical research applications. Plasma or serum samples were extracted by offline internal standard addition and protein precipitation. The extracts were injected onto the Vanquish Flex Binary system connected to the TSQ Quantis triple quadrupole mass spectrometer for SRM detection using 20 deuterated internal standards. The authors proved the method linear over the calibration ranges covered. Method accuracy was outstanding with the percentage bias ranging between -15.7% and 8.5%. The %CV for intra-assay precision was always below 12.6% for all analytes, and the maximum %CV for inter-assay precision including all the analytes was 10.8%. In sum, the method offered quick and simple offline protein precipitation with concomitant internal standard addition, and met clinical research laboratory requirements for sensitivity, linearity of response, accuracy, and precision.
Clinical research
The data demonstrated the outstanding accuracy of the method with the percentage bias between nominal and average back-calculated concentration for the control samples ranging between -15.7% and 8.5%.
Table of contents
Introduction
Food safety testing
Environmental contaminants analysis
Clinical research
Forensic toxicology
Pharmaceutical discovery

Metabolism and drug monitoring research: Triple quadrupole MS technology technical note
Clinical research
Testing robustness: Immunosuppressant drugs in blood with a TSQ Quantis MS for clinical research
Testing robustness: analyzing immunosuppressant drugs in blood using the TSQ Quantis mass spectrometer
For clinical research work, a sensitive and robust instrument is required for reliable quantitation of immunosuppressant drugs in whole blood. Thermo Scientific Technical Note 64969 evaluated the robustness of the TSQ Quantis triple quadrupole mass spectrometer for this application. Whole blood calibrators, controls, and 10 different lots of blank whole blood were processed by precipitation with a ZnSO4/methanol solution containing internal standards. The processing method removes the majority of blood proteins, but not phospholipids. A daily sequence of samples, consisting of an initial set of eight calibrators followed by repeated sets of five controls and 20 blank blood samples, was analyzed. A set of calibrators was inserted approximately halfway through the sequence and again at the end. The total number of samples per sequence was approximately 300, and the sequence was repeated for five consecutive days.
The TSQ Quantis mass spectrometer provided robust, reliable, and consistent performance for the more than 1500 samples analyzed over five days with no need for maintenance. Compounds were linear over their calibration ranges of approximately 2–60 ng/mL for tacrolimus, sirolimus, and everolimus, and 25–1800 ng/mL for cyclosporin A. Calibrators and controls maintained precision and accuracy demonstrating reliability. All calibrators back-calculated to within 20% of theoretical values over the five days of testing. Peak areas for the two internal standards showed precisions of 4% and 8%, respectively, over the five days and over 1500 injections. Phospholipids showed no buildup over the course of the study.
Clinical research
Peak areas for cyclosporin D and ascomycin, the two internal standards used in this study, showed precisions of 4% and 8%, respectively, over the five days and over 1500 injections.
10,000
30,000
50,000
70,000
90,000
1 1452
Peak
Are
a
Injection #
Ascomycin Peak Area %CV = 8.29%
Day 1 Day 2 Day 3 Day 4 Day 5
0
250,000
500,000 Cyclosporin D in Whole Blood
4.0% RSD
Ascomycin Peak Area ± 20%
A
B
Peak
Are
a
13051015725435145 1160870580290
Table of contents
Introduction
Food safety testing
Environmental contaminants analysis
Clinical research
Forensic toxicology
Pharmaceutical discovery

Quantitation of drugs and metabolites in urine: workflow
Drugs of abuse in urine
Sports doping
Cannabis detection
Forensic toxicology and sports doping
Table of contents
Introduction
Food safety testing
Environmental contaminants analysis
Clinical research
Forensic toxicology
Pharmaceutical discovery

Forensic toxicology and sports doping
Quantitation of drugs and metabolites in urine: workflow
In the fields of forensic toxicology, quantitation of drugs in body fluids is challenging due to varying concentrations and substantially different chemical and physical properties of drugs, interfering matrices, occasionally small volumes of sample to test, and the presence of many similar compounds. Further, the constant evolution of drugs and their analogs makes it harder to identify and quantitate them. Many drugs and their
metabolites are present in conjugated form in urine and include isomers that need to be identified after separation using chromatography. The analytical workflow must handle a wide range of polarities, many similar molecules, matrix interferences, wide dynamic ranges and sample-to-sample differences caused by the varying nature of the matrix.
For Forensic Use Only.
Urine Sample
Dilution Dilute sample and add internal standards
Vortex Vortex sample
Evaporator Dry sample
Autosampler Automated Data AnalysisQuantitate and create reports using TraceFinder software
Analysis by LC-MS/MS Perform targeted screening and/or quantitation using HRAM MS or QQQ MS, depending upon the experimental requirements
Table of contents
Introduction
Food safety testing
Environmental contaminants analysis
Clinical research
Forensic toxicology
Pharmaceutical discovery

Forensic toxicology and sports doping
Forensic quantitation of opiates to low ng/mL levels in urine using an affordable, HRAM mass spectrometer
Forensic toxicologists need an economical instrument capable of both screening a large number of compounds and quantifying smaller panels to established limits. Thermo Scientific Application Note 615 presented a method for quantitation of six opiates—morphine, codeine, hydromorphone, hydrocodone, oxymorphone, and oxycodone—in human urine down to low ng/mL levels using the Q Exactive Focus mass spectrometer. The instrument accurately quantified the opiates to the low ng/mL level in human urine, offering forensic laboratories maximum value with a versatile platform capable of both screening and quantitative confirmation. LOQs for codeine, oxycodone, and oxymorphone were 2.5 ng/mL, and for morphine, hydrocodone, and hydromorphone the limit was 5 ng/mL. Calibration curves were linear with R2 of 0.99. Inter-assay precision and bias, as well as intra-assay precision, were within accepted limits. The average recovery across the donor urine samples ranged from 69% to 81% for the six internal standards evaluated.
Drugs of abuse in urine: HRAM technology application note
Quantitation of Opiates to Low ng/mL Levels in Urine for Forensic Use Using an Affordable, High-Resolution, Accurate-Mass Mass Spectrometer
Chromatograms extracted from MS2 spectra obtained from a confirmation PRM experiment for six opiates at their respective LOQs (2.5 ng/mL for codeine, oxycodone, and oxymorphone, and 5 ng/mL for hydrocodone, hydromorphone, and morphine) in hydrolyzed and diluted urine.
Table of contents
Introduction
Food safety testing
Environmental contaminants analysis
Clinical research
Forensic toxicology
Pharmaceutical discovery

Forensic toxicology and sports doping
High-performance quantitative analysis of benzodiazepines using multiplexed SIM with HRAM detection
In forensic toxicology laboratories, there are demands for a mass spectrometer able to address identification of unknown compounds as well as trace-level quantification of target analytes. To meet these needs, Thermo Scientific Application Note 551 presented a LC-MS method for quantification of benzodiazepines in urine by combining multiplexed selected ion monitoring (SIM) with HRAM detection on the Q Exactive mass spectrometer. SIM is well established for targeted quantitation using single quadrupole mass spectrometers, but its utility is limited owing to the low specificity of unit mass resolution. The Q Exactive mass spectrometer overcomes this limitation with HRAM detection. Additionally, the duty cycle of the Q Exactive mass spectrometer is increased due to its ability to measure multiple SIM ions simultaneously.
Using multiplexed SIM, eight benzodiazepines were quantified in urine with LLOQs at the pg/mL level, with linear dynamic ranges of three to four orders of magnitude. The sensitivity obtained rivaled, and the quantitative accuracy and precision was comparable, to that typically observed using triple quadrupole mass spectrometers operated in SRM mode.
Drugs of abuse in urine: HRAM technology application note
Demonstrating High-Performance Quantitative Analysis of Benzodiazepines using Multiplexed SIM with High-Resolution, Accurate Mass Detection on the Q Exactive LC/MS
The table shows that (1) mass errors on the Q Exactive system are significantly less than 5 ppm without the need of an internal calibration mass, and (2) the LLOQs of the eight benzodiazepines analyzed in urine are in the pg/mL range.
Compound SIM Time Window (min) Exact m/z Measured m/z Error
(ppm)LLOQ
(ng /mL)
Oxazepam 0.00-3.45 287.05818 287.05829 +0.4 0.0625
Lorazepam 0.00-3.65 321.01921 321.01926 +0.2 0.1250
Nitrazepam 0.00-3.65 282.08732 282.08746 +0.5 0.0625
Clonazepam 0.00-3.85 316.04835 316.04828 -0.2 0.0625
Temazepam 3.45-6.00 301.07383 301.07410 +0.9 0.0250
Flunitrazepam 3.65-6.00 314.09355 314.09296 -1.9 0.0625
Alprazolam 3.65-6.00 309.09015 309.09024 +0.3 0.0125
Diazepam 3.85-6.00 285.07892 285.07901 +0.3 0.0125
For Forensic Use Only.
Table of contents
Introduction
Food safety testing
Environmental contaminants analysis
Clinical research
Forensic toxicology
Pharmaceutical discovery

Forensic toxicology and sports doping
Analysis of five barbiturates in urine using an affordable high-resolution mass spectrometer
High-resolution mass spectrometers are widely accepted in forensic toxicology laboratories for screening applications, while triple quadrupole instruments have been used for quantitation. A highly versatile platform, Orbitrap mass spectrometers can be used for screening and quantitative confirmatory methods, as well as structural elucidation.
Thermo Scientific Application Note 633 demonstrated a simple dilute-and-shoot method for the analysis of five barbiturates (amobarbital, butalbital, pentobarbital, phenobarbital and secobarbital) in urine using the Q Exactive Focus mass spectrometer. The methods provided high selectivity with chromatographic separation of isobaric analytes and limited matrix effects. Peak integration was accurate due to very low background. LOQs for butalbital, pentobarbital, amobarbital, and secobarbital were 5 ng/mL, and for phenobarbital, 25 ng/mL. Intra-assay precision was better than 8%, and inter-assay precision was better than 10% for all analytes. Recovery in donor samples, calculated as the ratio between analyte peak area in urine matrix and analyte peak area in solvent matrix, ranged from 85.8% to 115%, and internal standards recovery in donor urine samples ranged from 76% to 108%.
Drugs of abuse in urine: HRAM technology application note
Analysis of Five Barbiturates in Urine Using an Affordable High-Resolution Mass Spectrometer
Intra-assay precision was better than 8%, and inter-assay precision was better than 10% for all analytes.
Analyte LQC MQC HQC
%RSD
Phenobarbital 3.5–7.2 2.6–4.6 3.0–3.5
Butalbital 3.0–5.2 2.0–2.8 1.9–3.8
Pentobarbital 2.5–8.0 0.74–2.6 2.0–4.0
Amobarbital 3.6–6.8 2.6–4.3 1.6–2.8
Secobarbital 2.9–4.8 2.2–2.8 1.7–3.3
Analyte LQC MQC HQC
%RSD
Phenobarbital 5.5 5.6 4.1
Butalbital 5.7 6.1 5.4
Pentobarbital 6.5 6.2 6.1
Amobarbital 9.0 9.7 7.0
Secobarbital 5.1 5.7 5.1
Table of contents
Introduction
Food safety testing
Environmental contaminants analysis
Clinical research
Forensic toxicology
Pharmaceutical discovery

Forensic toxicology and sports doping
New designer drugs and the various drug analogues developed to circumvent legislation have varying effects and potencies, which can complicate interpretation of forensic toxicology cases. Synthetic cathinones are a group of designer stimulants with amphetamine or cocaine-like effects. Comprehensive multi-analyte confirmation methods are needed due to the wide spectrum of synthetic cathinones available. Concheiro et al. developed an Orbitrap mass spectrometer-based method for simultaneous quantitation of 28 synthetic cathinones and four metabolites in urine.35 The target cathinones included cathinone, methcathinone, and synthetic cathinones position-3’-substituted, N-alkyl-substituted, ring-substituted, methylenedioxy-substituted, and pyrrolidinyl-substituted. Extraction was via solid phase cation exchange extraction (SOLA SCX) followed by reverse-phase LC. Target compounds were identified and quantified using targeted MS/MS experiments. The method was then applied to the urine specimens containing synthetic cathinones.
The authors determined that the method was linear from 0.5-1 to 100 μg/L, with LODs of 0.25-1 μg/L. Imprecision (n = 20) was < 15.9% and accuracy was (n = 20) 85.2 to 118.1%. Extraction efficiency was 78.9 to 116.7% (CV 1.4 to 16.7%, n = 5), process efficiency was 57.7 to 104.9%, and matrix effects were from -29.5% to 1.5% (CV 1.9 to 13.1%, n = 10). The confirmation method proved comprehensive for the 28 synthetic cathinones, with good analytical specificity. The authors concluded that the research would help in the interpretation of test results in forensic toxicology cases, and in the evaluation of the toxicity of designer cathinone drugs.
35. Concheiro, M.; Anizan, S.; Ellefsen, K.; Huestis, M. A. Simultaneous quantification of 28 synthetic cathinones and metabolites in urine by liquid chromatography-high resolution mass spectrometry. Anal. Bioanal. Chem. 2013, Nov;405(29):9437-48.
Drugs of abuse in urine: HRAM technology in peer-reviewed publications
Confirm and quantitate of a wide range of compounds, simultaneously and with high specificity
For Forensic Use Only.
Benefits of HRAM technology
Table of contents
Introduction
Food safety testing
Environmental contaminants analysis
Clinical research
Forensic toxicology
Pharmaceutical discovery

Forensic toxicology and sports doping
Tomorrow’s quantitation using LC-MS/MS: fast screening and quantitation of drugs of abuse in urine for forensic toxicology
Analysis and quantitation of drugs of abuse in biological matrices poses several challenges, especially with increasing demands for throughput and higher sensitivity. Thermo Scientific Technical Note 65182 investigated the feasibility of high-throughput measurements of drugs of abuse and their metabolites in urine by reducing sample preparation steps and applying two-minute UHPLC-MS/MS analyses per sample using the Vanquish Horizon UHPLC system coupled to the TSQ Quantis triple quadrupole mass spectrometer.
The method enabled quantification of more than 75 drugs of abuse and their metabolites in urine, in a single LC-MS/MS method with an acquisition time of less than 1.4 min. Most target compounds had LLOQs at or below the designated cutoff levels in diluted urine. Though overlapping signals of analytes and isomers are typically observed for methods with such short run times, the outstanding chromatographic resolution of the Vanquish Horizon UHPLC system combined with the scan speed and sensitivity of TSQ Quantis mass spectrometer provided efficient separation and quantitation for target isomers.
Drugs of abuse in urine: Triple quadrupole MS technology technical note
Tomorrow’s Quantitation with LC-MS/MS: Fast Screening and Quantitation of lDrugs of Abuse in Urine for Forensic Toxicology
Sensitivity demands of all the analytes were addressed with remarkable ease. As an example, multiple injection profiles of buprenorphine and 6-MAM are shown. The robustness data over five injections were achieved with 1:2 dilution of the urine sample with 2 µL injections.
RT: 0.80 - 1.15
0.80 0.85 0.90 0.95 1.00 1.05 1.10Minutes
0
100
0
100
0
100
0
100
0
100
RT: 0.98AA: 6094
RT: 0.98AA: 7795
RT: 0.98AA: 5040
RT: 0.98AA: 7604
RT: 0.98AA: 7409
NL: 1.13E4m/z= 396.16-396.26 F: + c ESI SRM ms2 468.310 [396.209-396.211, 414.259-414.261] MS ICIS doa_urine_method_2x_dilution_2016
NL: 1.80E4m/z= 396.16-396.26 F: + c ESI SRM ms2 468.310 [396.209-396.211, 414.259-414.261] MS ICIS doa_urine_method_2x_dilution_2017
NL: 6.86E3m/z= 396.16-396.26 F: + c ESI SRM ms2 468.310 [396.209-396.211, 414.259-414.261] MS ICIS doa_urine_method_2x_dilution_2018
NL: 1.28E4m/z= 396.16-396.26 F: + c ESI SRM ms2 468.310 [396.209-396.211, 414.259-414.261] MS ICIS doa_urine_method_2x_dilution_2019
NL: 1.23E4m/z= 396.16-396.26 F: + c ESI SRM ms2 468.310 [396.209-396.211, 414.259-414.261] MS ICIS DoA_Urine_method_2x_Dilution_2020
Inj. #1
Inj. #5
Inj. #2
Inj. #3
Inj. #4
RT:0.53 - 0.80
0.55 0.60 0.65 0.70 0.75 0.80Minutes
0
100
0
100
0
100
0
100
0
100
RT: 0.65AA: 33200
RT: 0.65AA: 37038
RT: 0.65AA: 38141
RT: 0.65AA: 33872
RT: 0.65AA: 32501
NL: 7.17E4m/z= 165.02-165.12 F: + c ESI SRM ms2 328.150 [165.069-165.071, 211.079-211.081, 212.069-212.071, 253.109-253.111] MS ICIS doa_urine_method_2x_dilution_2021
NL: 8.76E4m/z= 165.02-165.12 F: + c ESI SRM ms2 328.150 [165.069-165.071, 211.079-211.081, 212.069-212.071, 253.109-253.111] MS ICIS doa_urine_method_2x_dilution_2022
NL: 7.08E4m/z= 165.02-165.12 F: + c ESI SRM ms2 328.150 [165.069-165.071, 211.079-211.081, 212.069-212.071, 253.109-253.111] MS ICIS doa_urine_method_2x_dilution_2023
NL: 7.26E4m/z= 165.02-165.12 F: + c ESI SRM ms2 328.150 [165.069-165.071, 211.079-211.081, 212.069-212.071, 253.109-253.111] MS ICIS doa_urine_method_2x_dilution_2024
NL: 6.26E4m/z= 165.02-165.12 F: + c ESI SRM ms2 328.150 [165.069-165.071, 211.079-211.081, 212.069-212.071, 253.109-253.111] MS ICIS doa_urine_,method_2x_dilution_2025
Inj. #1
Inj. #5
Inj. #2
Inj. #3
Inj. #4
Table of contents
Introduction
Food safety testing
Environmental contaminants analysis
Clinical research
Forensic toxicology
Pharmaceutical discovery

Forensic toxicology and sports doping
Detection of stanozolol glucuronides for human sports drug testing using HRAM MS
Analysis of the anabolic steroid stanozolol and its metabolites has proved challenging for GC-MS due to stanozolol’s peculiar physicochemical properties, which demand sophisticated derivatization and separation. LC-MS/MS methods can provide lower LODs and detection windows with expanded metabolite identification. Thermo Scientific Application Note 613 demonstrated a dilute and shoot method for HRAM LC-MS detection of glucuronic acid conjugates of stanozolol in urine for unambiguous identification of stanozolol in doping-control samples. Analyses were performed on donor urine samples collected prior to (blank) and up to 28 days post administration of a single oral dose of 5 mg of stanozolol.
The method was validated with commercially available 3’-OH-stanozolol glucuronide. New long-term metabolites for the detection of stanozolol were observed, allowing determination of abuse up to 28 days post-administration of 5 mg of stanozolol. The new target analytes--stanozolol-N-glucuronide and 17-epistanozolol-Nglucuronide--were characterized using MS and hydrolysis experiments.
Sports doping: HRAM technology application note
Detection of Stanozolol Glucuronides in Human Sports Drug Testing by Means of High-Resolution, Accurate-Mass Mass Spectrometry
Chromatograms of an authentic doping control routine sample representing an adverse analytical finding for stanozolol in both screening and confirmation assays.
Table of contents
Introduction
Food safety testing
Environmental contaminants analysis
Clinical research
Forensic toxicology
Pharmaceutical discovery

Forensic toxicology and sports doping
Low pg/mL detection of rHuEPOs in horse plasma employing high-resolution MS
Recombinant human erythropoietin (rHuEPO) is a banned equestrian doping agent. To differentiate between endogenous EPO and rHuEPOs, SRM and isoelectric focusing (IEF) methods have been used. Detection of rHuEPOs is traditionally performed using triple quadrupole SRM methods and requires the detection of at least three fragment ions from each peptide. Though triple quadrupole methods are known to provide sensitivity, robustness, and efficiency for high-throughput analyses, in complex matrices like plasma, LODs and quantitation are often negatively impacted by interferences.
Thermo Scientific Application Note 585 demonstrates an alternative approach consisting of sample preparation using anti-EPO monolith membranes in disposable columns (anti-EPO monolith columns) and nano LC-MS/MS analysis using the Q Exactive mass spectrometer. Two SIM scans and two targeted MS2 scans were alternately used to detect and confirm the presence of EPO in a total cycle time of less than 2 s when measuring 200 amol of neat peptide standard. Rich higher-energy collisional dissociation (HCD) fragmentation spectra were used for verification. The approach enabled confirmation and quantitation of rHuEPO target peptides in a single analytical run, with high specificity, sensitivity, and resolution. Linearity over four orders of magnitude and 10 amol level sensitivity in an extracted plasma matrix were achieved. rHuEPO could be readily detected at 25 pg/mL, a four-fold improvement over previously published triple quadrupole methods. The LOD obtained enables rHuEPO detection in horse plasma beyond 48 h after administration.
Sports doping: HRAM technology application note
Low pg/mL Detection of rHuEPOs in Horse Plasma Employing High-Resolution MS
Linearity of the extracted rHuEPO peptides T6 (VNFYAWK) and T17 (VYSNFLR) and extracted ion chromatograms (XICs) of both peptide fragments at the LOD (25 pg/mL) obtained with the Q Exactive mass spectrometer.
Table of contents
Introduction
Food safety testing
Environmental contaminants analysis
Clinical research
Forensic toxicology
Pharmaceutical discovery

Forensic toxicology and sports doping
The cobra venom toxin α-cobratoxin (α-Cbtx) has analgesic potency greater than morphine. After being found in the facilities of a thoroughbred trainer, the lack of a detection method for the protein became a serious problem in horseracing. To address the problem, Bailly-Chouriberry et al. developed the first method, a method that relies on the Q Exactive mass spectrometer, to detect and quantitate α-Cbtx in equine plasma.32 Prior to LC-MS/MS analysis, 3 mL of equine plasma sample was treated with ammonium sulphate precipitation, methanol precipitation, SPE extraction, concentration via filtration, and then digestion with trypsin. LC-MS/MS analysis of the product ions of the doubly-charged precursor of the target peptide was performed at 70,000 resolution.
The method was validated and proved to be sufficiently specific, robust and sensitive to enable confirmation of the presence of α-Cbtx in 18 different equine plasma samples spiked at 5 g/L (640 pmol/L), thus meeting the Association of Official Racing Chemists (AORC) requirements. The LOD was determined to be 1 μg/L (130 pmol/L). The method makes it possible to confirm the presence of α-Cbtx in horse plasma from 30 minutes up to 24 hours after administration with an upper limit of 48 hours.
32. Bailly-Chouriberry, L.; Cormant, F.; Garcia, P.; Kind, A.; Popot, M. A.; Bonnaire, Y. Identification of α-cobratoxin in equine plasma by LC-MS/MS for doping control. Anal. Chem. 2013, May
21;85(10):5219-25.
Sports doping: HRAM technology in peer-reviewed publications
Confirm compounds at regulated levels with sensitivity, specificity, and robust operation
For Forensic Use Only.
Benefits of HRAM technology
Table of contents
Introduction
Food safety testing
Environmental contaminants analysis
Clinical research
Forensic toxicology
Pharmaceutical discovery

Forensic toxicology and sports doping
Due to advancements in analytical technology and because it is possible to obtain a specimen quickly and easily, oral fluid is gaining acceptance as an alternative matrix for forensic toxicology applications. Though Δ9-tetrahydrocannabinol (THC) is the primary target for detecting cannabis use in oral fluid, THC carboxylic acid (THCA) has been demonstrated more reliable because its presence in oral fluid does not occur from passive exposure. However, THCA quantitation is more difficult because it is found in very low concentrations in oral fluid. LC−MS/MS methods provide the requisite sensitivity, but can involve complicated sample preparation procedures. For this reason He et al. developed a sensitive LC−MS/MS forensic method for the simultaneous quantitation of THC and THCA in oral fluid using online sample extraction low-flow LC coupled to a Q Exactive mass spectrometer.33
The method proved simple, robust, and efficient with a total runtime of 12.5 minutes. The HRAM capability of the Q Exactive mass spectrometer enabled the method to achieve high specificity and low-pg/mL sensitivity. Quantitative results were linear from 7.5 to 300 pg/mL for THCA, with a lower limit of 7.5 pg/mL. Intra- and inter-batch precision of ranged from 3.3% to 9.3% for both THC and THCA.
Though Δ(9)-Tetrahydrocannabinol (THC) is the primary target in oral fluid for detecting cannabis use, additional biomarkers such as 11-nor-9-carboxy-THC (THCCOOH), cannabidiol (CBD), and cannabinol (CBN) are needed to address the possibility of passive inhalation. Concheiro et al. developed and validated a Q Exactive mass spectrometer-based microflow LC-MS method for the simultaneous quantitation of THC, THCCOOH, CBD, and CBN in oral fluid.34 Authentic oral fluid specimens were collected using the Oral-Eze(®) and Quantisal™ collection systems. Proteins were precipitated and the supernatant extracted using CEREX™ Polycrom™ THC SPE. Target compounds were identified and quantified in targeted MS/MS experiments.
The forensic method was linear from 0.5 to 50 ng/mL for THC, CBD and CBN, and from 15 to 500 pg/mL for THCCOOH. Intra- and inter-day and imprecision were < 10.8% CV, and bias was from 86.5 to 104.9%. Extraction efficiency ranged from 52.4 to 109.2%, process efficiency from 12.2 to 88.9%, and matrix effect from -86 to -6.9%. The authors concluded that the method provides rapid simultaneous quantitation of THCCOOH, THC, CBD, and CBN with good selectivity and sensitivity, and thus presents an opportunity to improve interpretation of the results obtained from cannabinoid analyses of oral fluids.
33. He, X.; Marta Kozak M.; Nimkar, S. Ultra-Sensitive Measurements of 11-Nor-Δ9-Tetrahydrocannabinol-9-Carboxylic Acid in Oral Fluid by Microflow Liquid Chromatography–Tandem Mass Spectrometry Using a Benchtop Quadrupole/Orbitrap Mass Spectrometer. Anal. Chem. 2012, 84 (18), pp 7643–7647.
34. Concheiro, M.; Lee D.; Lendoiro, E.; Huestis, M. A. Simultaneous quantification of Δ(9)-tetrahydrocannabinol, 11-nor-9-carboxy-tetrahydrocannabinol, cannabidiol and cannabinol in oral fluid by microflow-liquid chromatography-high resolution mass spectrometry. J. Chromatogr. A. 2013, Jul 5;1297:123-30.
Cannabis detection: HRAM technology in peer-reviewed publications
Quantify challenging low-level compounds, with high selectivity and sensitivity
For Forensic Use Only.
Benefits of HRAM technology
Table of contents
Introduction
Food safety testing
Environmental contaminants analysis
Clinical research
Forensic toxicology
Pharmaceutical discovery

Drug discovery process: workflow
Bioanalysis
Discovery-stage screening
ADME screening and DMPK research
Pharmaceutical discovery assays
Table of contents
Introduction
Food safety testing
Environmental contaminants analysis
Clinical research
Forensic toxicology
Pharmaceutical discovery

Pharmaceutical discovery assays
Drug discovery process: workflow
Sample Biological samples from in vitro or in vivo studies
Preparation Cleaning up the often complex matrixes of typical samples is an important step. SPE, protein precipitation, filtration and centrifugation are common.
Data AnalysisEver-evolving regulatory guidelines and demand for data integrity amplifies the importance of traceability and accuracy. Chromeleon CDS can address these requirements with an end-to-end solution. Additionally, manage bioanalytical studies, from initiation through
regulatory standards using the Thermo Scientific™ Watson LIMS™ software
Analysis by UHPLC-MS/MS
As potential leads for successful drug candidates move through the drug discovery process, there is a need for quantitative in vitro and in vivo analysis at each step. Though the requirement for quantitative LC-MS assays that provide sensitivity, ruggedness, and linear response has remained relatively constant over time, other considerations are emerging as MS technology improves. Ease of use, simplified method development, and troubleshooting tools are growing in importance when choosing the most appropriate MS technology for a particular assay and its corresponding method development.
Table of contents
Introduction
Food safety testing
Environmental contaminants analysis
Clinical research
Forensic toxicology
Pharmaceutical discovery

36. Wang, H.; Bennett, P. Performance assessment of microflow LC combined with high-resolution MS in bioanalysis. Bioanalysis. 2013, May;5(10):1249-67.
Bioanalytical scientists strive to achieve lower limits of quantitation. The reasons range from smaller sample volumes available for analysis, to more potent analytes and the growth of biologics in drug development. As a result, scientists are exploring new LC-MS techniques, involving both high- and low-flow rate LC devices and HRAM. Because most biological samples are matrices comprised of plasma, serum, whole blood, urine, and various tissues, desirable new analytical technology should provide greater sensitivity and robustness. Wang et al. assessed application of a Q Exactive mass spectrometer combined with microspray ionization and microflow separation.36 A standard flow rate sprayer needle was compared to a microspray needle and Q Exactive mass spectrometer performance was compared to QQQ MS. Specifically, the sensitivity and noise level of four ionization modes were evaluated: QQQ MS SRM, HRAM full scan, HRAM SIM, and HRAM MS/MS.
The authors determined that microflow LC-MS showed less matrix effects than UHPLC-MS, but the extent of suppression for both was compound-dependent and the amount of reduction was not proportional for each analyte. Because the precision was improved by using microflow LC-MS, relative quantitation might be more reliable. Microflow LC-MS did provide a substantial increase in sensitivity for some compounds without additional sample preparation or chromatographic method development. Carryover of high-concentration samples was a disadvantage of microflow LC-MS. When using SIM, the Q Exactive mass spectrometer was found to be as or more sensitive than the Thermo Scientific TSQ Vantage Triple Stage Quadrupole Mass Spectrometer, but was also compound-dependent. The authors also concluded that the HRAM full-scan capability of the Q Exactive mass spectrometer allowed observation of co-eluting compounds during method development, which in turn enabled reduction or elimination of undesirable matrix effects.
Pharmaceutical discovery assays
Bioanalysis: HRAM technology in peer-reviewed publications
• Obtain sensitivity equal to QQQ instruments• Observe co-eluting compounds, reduce matrix effects, using full-scan HRAM data
Benefits of HRAM technology
Table of contents
Introduction
Food safety testing
Environmental contaminants analysis
Clinical research
Forensic toxicology
Pharmaceutical discovery

37. Ciccimaro, E;. Ranasinghe, A.; D’Arienzo, C.; Xu, C.; Onorato, J.; Drexler, D. M.; Josephs, J. L.; Poss, M.; Olah, T. Strategy to improve the quantitative LC-MS analysis of molecular ions resistant to
gas-phase collision induced dissociation: application to disulfide-rich cyclic peptides. Anal. Chem. 2014, Dec 2;86(23):11523-7.
MS/MS with CID enables QQQ and ion trap mass spectrometers to quantify biological analytes in complex matrices with high sensitivity and selectivity. However, the molecular ions produced from cyclic and large disulfide-containing peptides, sterols, and fatty acids are not amenable to CID, making their analysis using these technologies difficult. In particular, cyclic peptides are of growing interest in drug discovery because of their stability in blood and potential for oral dosing. As a solution, Ciccimaro et al. demonstrated a Q Exactive mass spectrometer method where the target ion is selectively isolated for quantitation while interfering matrix components undergo MS/MS fragmentation by CID (HCD)—an approach the authors termed HRAM survivor-SIM.37
Fundamentally different than the traditional MS/MS with CID where a target analyte’s unique fragments are monitored following CID (HCD) fragmentation, the new approach significantly enhanced selectivity by removing isobaric interferences. Comparative QQQ MS experiments were performed using a Triple Quad 6500 LC/MS/MS System (AB Sciex). Because molecular ion detection is more sensitive than fragment ion detection, the authors observed a five- to ten-fold improvement in LLOQs compared to traditional approaches for CID-resistant peptides in plasma extracts. The results demonstrated that the Q Exactive mass spectrometer is an ideal orthogonal platform for quantitation in situations where compounds are not amenable to MS/MS with HCD/CID fragmentation.
Pharmaceutical discovery assays
Bioanalysis: HRAM technology in peer-reviewed publications
• Quantitate using HRAM survivor-SIM when compounds are not amenable to HCD/CID fragmentation• Eliminate isobaric interferences and enhance selectivity
Benefits of HRAM technology
Table of contents
Introduction
Food safety testing
Environmental contaminants analysis
Clinical research
Forensic toxicology
Pharmaceutical discovery

Sensitive, robust quantitative analysis of a mixture of drug candidates in plasma
Targeted quantitation analyses done in biological matrices are a critical part of the workflow required to successfully develop a small molecule drug. Application Note 64977 describes a sensitive, robust, reliable, and reproducible LC-MS/MS method that uses the Vanquish Horizon HPLC system and the TSQ Altis triple quadrupole mass spectrometer for the determination and quantitation of a mixture of compounds of pharmaceutical interest in rat plasma.
The method showed excellent linearity and reproducibility over the dynamic range of the assay as required in the analysis of pharmaceutical compounds. LLOQs for each of the drug candidates in plasma range from 1–5 pg/mL, and were significantly lower than those obtained from previous generation MS systems. In addition, significantly lower %CV values (3.4–5.1) for the internal standards implied robustness and reproducibility.
Pharmaceutical discovery assays
Bioanalysis: Triple quadrupole MS technology application note
Sensitive, robust quantitative analysis of a mixture of drug candidates in plasma using a TSQ Altis triple quadrupole mass spectrometer
Limits of quantitation for the drug candidates in plasma and %CV (n=3) for the internal standards.
Compound LOQ (pg/mL) IS %CV
Desomorphine 5 3.5
Desmethyldoxepin 2.5 3.5
Flecainide 1 3.5
Midazolam 2.5 4.4
Imipramine 2.5 4.4
Amitriptyline 2.5 4.4
Fluoxetine 5 5.1
Diazepam 2.5 3.4
Table of contents
Introduction
Food safety testing
Environmental contaminants analysis
Clinical research
Forensic toxicology
Pharmaceutical discovery

Though high-throughput screening using LC-MS is routinely implemented throughout the drug-discovery process, using it earlier in the lead discovery stage can provide significant benefits. For example, avoiding labeling agents can reduce costly sample preparation, and LC separation of analytes of interest from interferences and can increase selectivity and sensitivity. For this reason Murphy et al. applied high-resolution MS-LC multiplexing to a screening assay of phosphorylated peptides.38 Phosphorylated peptide standards were prepared using common enzyme buffers and these were plated into a 96-well plate format prior to LC-MS analysis using a Q Exactive mass spectrometer.
Laboratories supporting the lead discovery stage must analyze several thousand samples per day, generally with complex matrixes that vary from project to project. Therefore, assay methods must be fast and robust. The authors concluded that Q Exactive mass spectrometer coupled with LC multiplexing provides robust, high-quality results at rapid sampling rates (up to 18 seconds per sample). Samples analyzed in both simple and complex sample matrices demonstrated an LOQ of 5 nM with linear response across the working range of the assay.
38. Murphy, K.; Bennett, P. K.; Duczak, N. Jr. High-throughput quantitation of large molecules using multiplexed chromatography and high-resolution/accurate mass LC-MS. Bioanalysis. 2012, May;4(9):1013-24.
Pharmaceutical discovery assays
Discovery-stage screening: HRAM technology in peer-reviewed publications
Achieve robust, high-throughput screening of complex sample matrices
Benefits of HRAM technology
Table of contents
Introduction
Food safety testing
Environmental contaminants analysis
Clinical research
Forensic toxicology
Pharmaceutical discovery

39. Zhang, J.; Maloney, J.; Drexler, D. M.; Cai, X.; Stewart, J.; Mayer, C.; Herbst, J.; Weller, H.; Shou, W. Z. Cassette incubation followed by bioanalysis using high-resolution MS for in vitro ADME screening assays. Bioanalysis. 2012, Mar;4(5):581-93.
Application of high-resolution MS to absorption, distribution, metabolism and excretion (ADME), and drug metabolism, and pharmacokinetics (DMPK) studies has generated considerable interest within pharmacokinetics and pharmacology laboratories. Zhang et al. explored the benefits of high-resolution MS for quantitative bioanalysis using full-scan data acquisition.39 Of particular interest is the lack of compound-specific MS method development, simultaneous data collection for both targeted and non-targeted components, and suitability for simultaneous quantitation of an unlimited number of compounds, which is not possible using QQQ SRM methods. In addition, the information obtained from HRAM at the ADME phase can be transferred to reduce method development time during downstream routine quantitation analysis using QQQ MS.
The authors developed an in vitro ADME workflow involving cassette incubation of as many as 32 compounds, followed by quantitative analysis using an Orbitrap mass spectrometer in full-scan mode. The workflow was evaluated for serum protein-binding and parallel artificial membrane permeability (PAMPA) assays. The workflow was found to have acceptable sensitivity, selectivity, and linearity for all compounds, and the biological results obtained were similar to those obtained from discrete incubation and analysis, demonstrating the feasibility of the workflow.
Pharmaceutical discovery assays
ADME screening and DMPK research: HRAM technology in peer-reviewed publications
• Reduce compound-specific method development • Simultaneously quantify unlimited compounds
Benefits of HRAM technology
Table of contents
Introduction
Food safety testing
Environmental contaminants analysis
Clinical research
Forensic toxicology
Pharmaceutical discovery

The ability to acquire quantitative data, along with qualitative data for parallel or retrospective data analysis—the quan/qual approach—is powerful in conserving time, laboratory space, and budgets. For this reason, King et al. described their evaluation and implementation of Q Exactive mass spectrometer-based Quan/Qual analyses at UCB’s research DMPK department.40 The authors compared the quantitative performance of Q-TOF and Q Exactive instruments. Both types of instruments performed equally in terms of mass accuracy, sensitivity, robustness, and scan speed. The key difference between the Q-TOF and Orbitrap instruments was the linear quantitative dynamic range achieved, four and greater than four orders of magnitude, respectively, for the compounds tested, a feature considered important in measuring all time points at all doses.
The authors concluded by summarizing the benefits of adopting the Q Exactive mass spectrometer-based Quan/Qual workflow: the additional information obtained produced a more integrated understanding of bioanalytical processes and the DMPK properties of compounds; a large amount of time is saved by not having to develop targeted MS/MS methods for individual compounds; and the ability to obtain both Quan/Qual data from a single analysis has reduced the need for in vivo and ex vivo studies involving animals, sample preparation and processing, consumables, and laboratory space. The authors expect that over time the development of less expensive high-resolution MS systems will lead to the demise of the use of QQQ mass spectrometers in routine bioanalytical applications.
Pharmaceutical discovery assays
ADME screening and DMPK research: HRAM technology in peer-reviewed publications
Benefits of HRAM technology
• Achieve a dynamic range exceeding Q-TOF instruments• Attain scan speed equal to that of Q-TOF systems• Conserve time, space, and budget with Quan/Qual capability
40. King, L.; Kotian, A.; Jairaj, M. Introduction of a routine quan/qual approach into research DMPK: experiences and evolving strategies. Bioanalysis. 2014, 6(24):3337-48
Table of contents
Introduction
Food safety testing
Environmental contaminants analysis
Clinical research
Forensic toxicology
Pharmaceutical discovery

© 2019 Thermo Fisher Scientific Inc. All rights reserved. All trademarks are the property of Thermo Fisher Scientific and its subsidiaries unless otherwise specified. AD65600-EN 1019S
Access technology you only dreamed possible
The work you do matters and taking risks with your hard-earned data and analysis isn’t worth it. We can help you find an affordable mass spectrometer price through one of our purchasing programs, each designed to help you take your research to the next level even if your laboratory budget is facing challenges. Stop worrying about compromising on the quality of data and the insights you need and instead let us help you make the cost of mass spectrometry affordable with Factory re-certified instruments, Trade-in, trade-up and Leasing.
Find out more at thermofisher.com/affordability
Table of contents
Introduction
Food safety testing
Environmental contaminants analysis
Clinical research
Forensic toxicology
Pharmaceutical discovery

Find out more at www.thermofisher.com/quantitation
For Research Use Only. Not for use in diagnostic procedures. ©2019 Thermo Fisher Scientific Inc. All rights reserved. All trademarks are the property of Thermo Fisher Scientific and its subsidiaries unless otherwise specified. This information is presented as an example of the capabilities of Thermo Fisher Scientific Inc. products. It is not intended to encourage use of these products in any manners that might infringe the intellectual property rights of others. Specifications, terms and pricing are subject to change. Not all products are available in all countries. Please consult your local sales representative for details. AI64645-EN 1219S
Table of contents
Introduction
Food safety testing
Environmental contaminants analysis
Clinical research
Forensic toxicology
Pharmaceutical discovery