ms lecture-3
TRANSCRIPT

Mass spectrometry
(about the theory and applications)
Lecture-3
By
Dr. Ahmed M. Metwaly

Objectives
Soft ionization techniques
• Chemical Ionization
• Fast Atomic Bombardment (FAB)
• Electrospray Ionization (ESI)
• Matrix Assisted Laser Desorption Ionisation (MALDI)
HR-MS
Chemical Ionization (CI)
• A “soft” ionization technique, which involves indirect ionization of
sample by ion-molecule reaction instead of by electron-impact.
• Chemical reagent gas added to modified EI ion source.
• Electron impact ionization of reagent gases such as ammonia or
methane. Sample molecules are bombarded with a reagent gas
ions which results in ionization of the sample.
• Ionization occurs through chemical reaction (gas-phase proton
transfer).
• Reagent gases can react with the sample molecules
to give
• [M+H]+,
• [M+NH3]+ or
• [M+CH4]+.
• These ions are more stable and called
pseudomolecular ions.
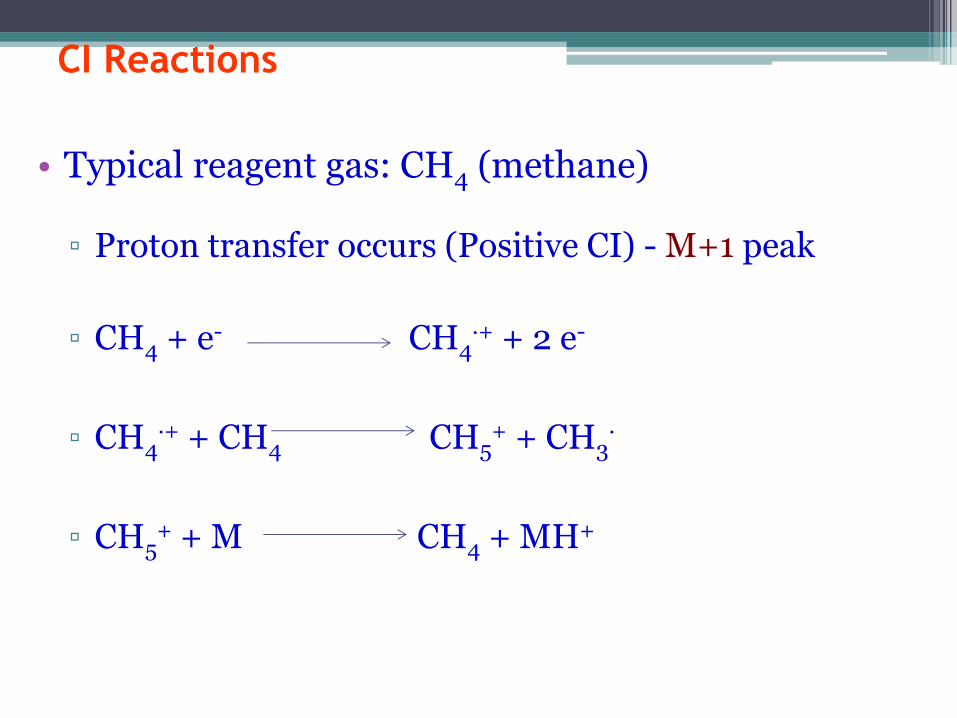
CI Reactions
• Typical reagent gas: CH4 (methane)
▫ Proton transfer occurs (Positive CI) - M+1 peak
▫ CH4 + e- CH4·+ + 2 e-
▫ CH4·+ + CH4 CH5
+ + CH3·
▫ CH5+ + M CH4 + MH+

▫ (Negative CI) (hydride extraction ) - M-1 peak
▫ CH4 + e- CH4·+ + 2 e-
▫ CH4·+ CH3
+ + H·
▫ CH3+ + CH4 C2H5
+ + H2
▫ C2H5+ + M M-H- + C2H6

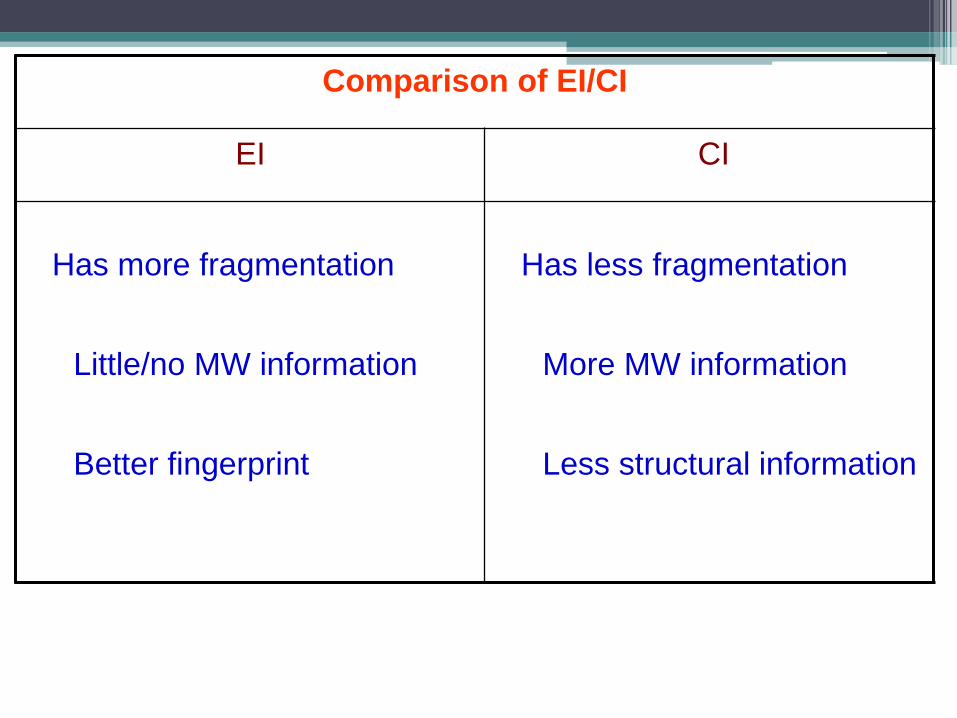
Comparison of EI/CI
Comparison of EI/CI
CI EI
Has less fragmentation
More MW information
Less structural information
Has more fragmentation
Little/no MW information
Better fingerprint

Fast Atomic Bombardment (FAB)
• Works best for organic compounds with polarity and either acidic
and or basic functional groups.
• FAB-MS is suitable for thermo labile and non volatile liquids.
• Classes that use FAB are: peptides, proteins, fatty acids,
carbohydrates.

Method • Argon gas (neutral inert gas) is subjected to ionization to release Ar+
rapid.
• Fast moving beam containing Ar+ rapid is directed toward the sample.
• Sample is dissolved in a liquid matrix, which coats the target of the
beam.
• Beam collides with the sample and matrix molecules, producing
positive and negative sample-related ions (pseudomolecular ions)
that can be accelerated into the mass spectrometer.
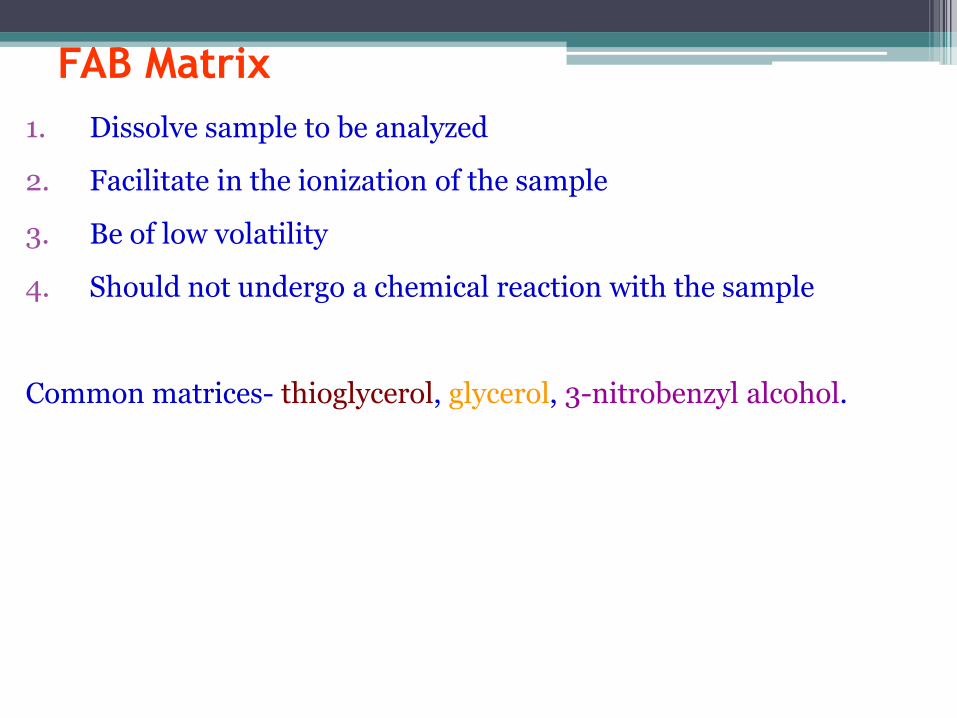
FAB Matrix
1. Dissolve sample to be analyzed
2. Facilitate in the ionization of the sample
3. Be of low volatility
4. Should not undergo a chemical reaction with the sample
Common matrices- thioglycerol, glycerol, 3-nitrobenzyl alcohol.

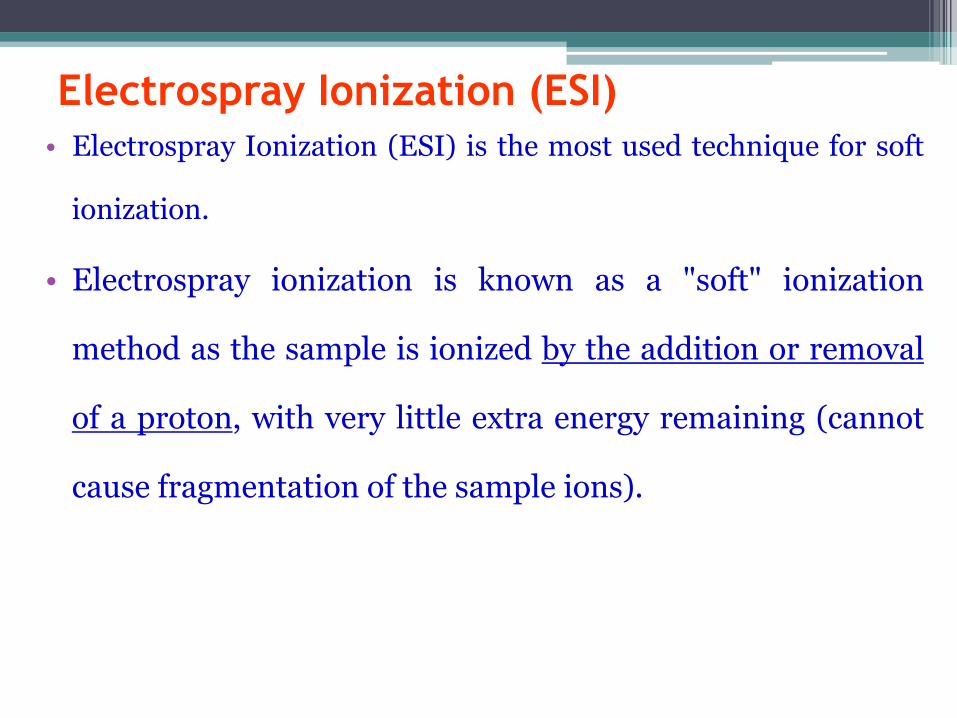
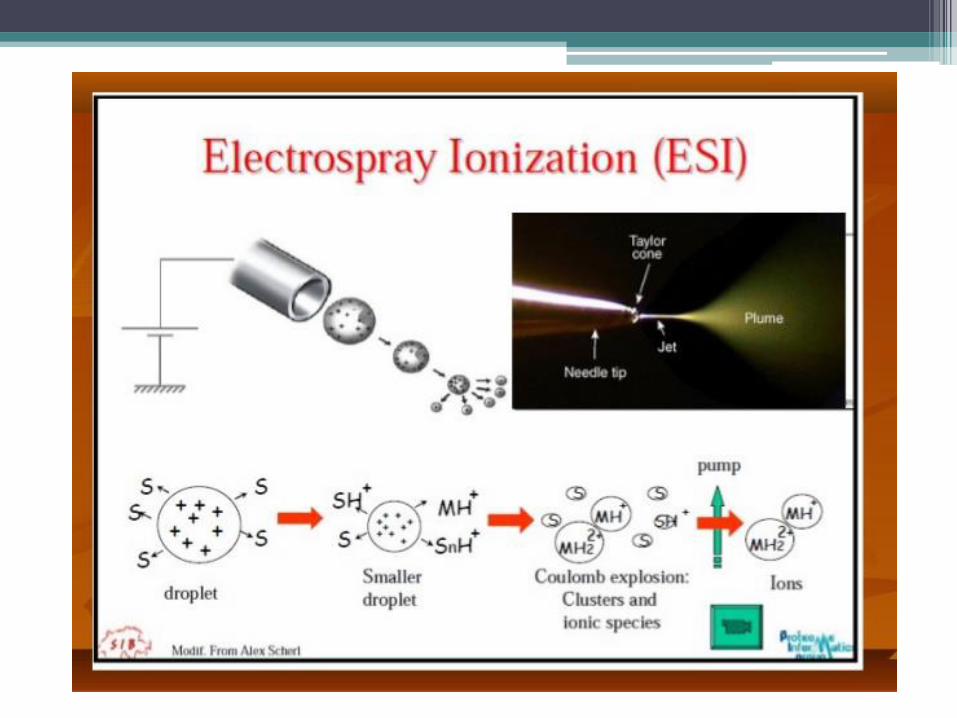
Electrospray Ionization (ESI)
• Electrospray Ionization (ESI) is the most used technique for soft
ionization.
• Electrospray ionization is known as a "soft" ionization
method as the sample is ionized by the addition or removal
of a proton, with very little extra energy remaining (cannot
cause fragmentation of the sample ions).

• In ESI, samples (M) with molecular masses up to ca. 1200 Da give
rise to singly charged molecular-related ions, usually protonated
molecular ions of the formula (M+H)+ in positive ionization
mode, and deprotonated molecular ions of the formula (M-H)- in
negative ionization mode.
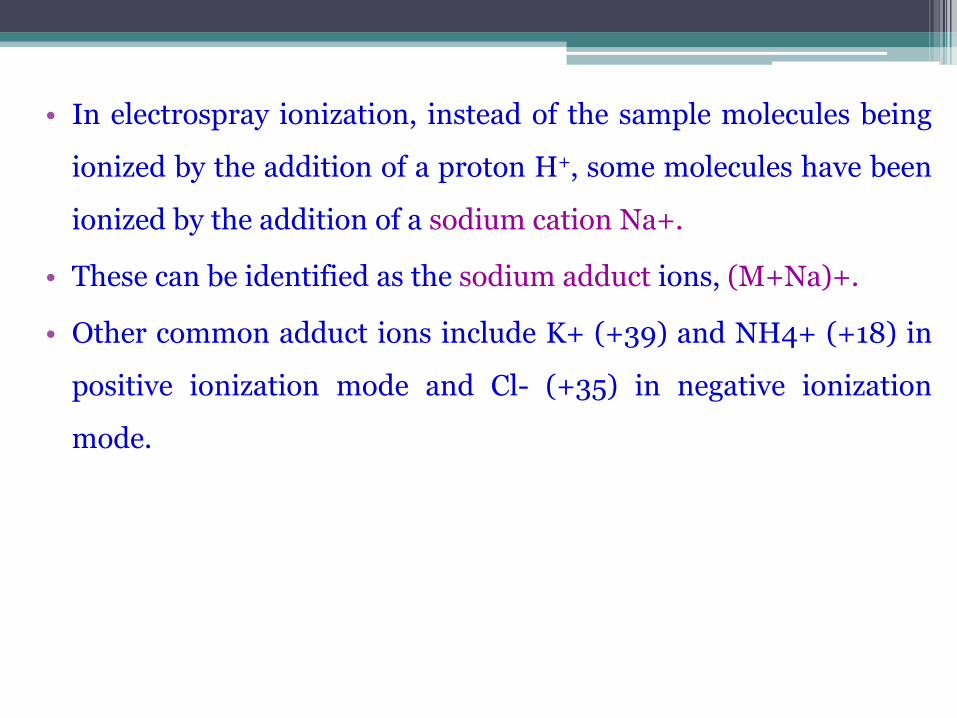
• In electrospray ionization, instead of the sample molecules being
ionized by the addition of a proton H+, some molecules have been
ionized by the addition of a sodium cation Na+.
• These can be identified as the sodium adduct ions, (M+Na)+.
• Other common adduct ions include K+ (+39) and NH4+ (+18) in
positive ionization mode and Cl- (+35) in negative ionization
mode.

• In positive ionization mode, a trace of formic acid is often added
to aid protonation of the sample molecules.
• In negative ionization mode a trace of ammonia solution or a
volatile amine is added to aid deprotonation of the sample
molecules.
• Proteins and peptides are usually analyzed under positive
ionization conditions.
• Saccharides and oligonucleotides under negative ionization
conditions.

• The sample is dissolved in a polar, volatile solvent
and pumped through a narrow, stainless steel
capillary tube. A high voltage is applied to the tip
(end) of the capillary (strong electric field), the
sample emerging from the tip as aerosol of highly
charged droplets, a process that is aided by a co-
axially introduced nebulizing gas flowing around the
outside of the capillary.
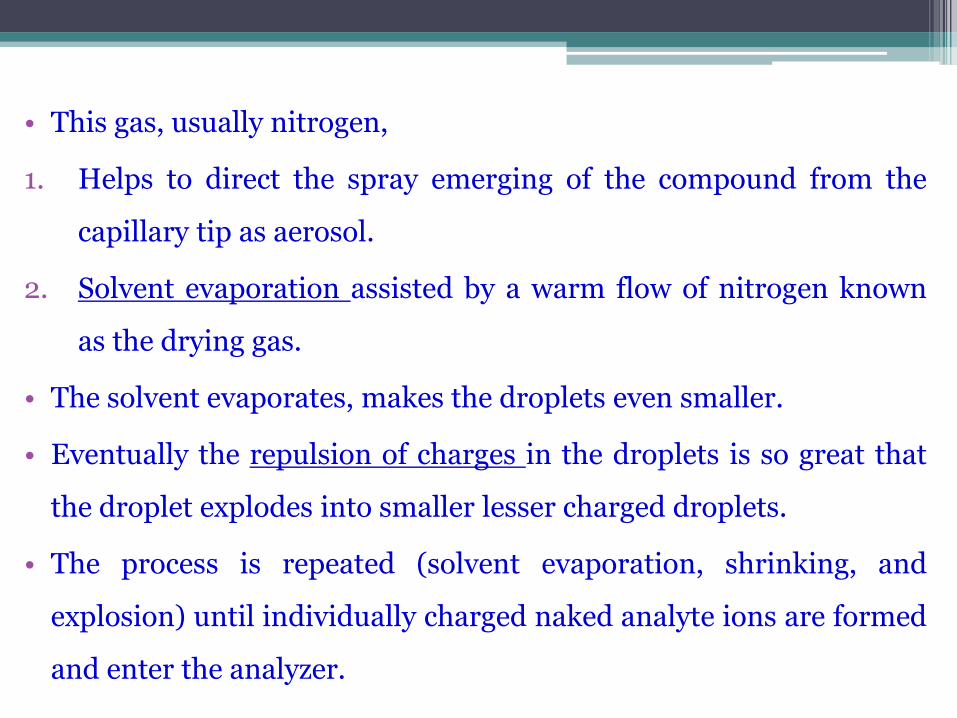
• This gas, usually nitrogen,
1. Helps to direct the spray emerging of the compound from the
capillary tip as aerosol.
2. Solvent evaporation assisted by a warm flow of nitrogen known
as the drying gas.
• The solvent evaporates, makes the droplets even smaller.
• Eventually the repulsion of charges in the droplets is so great that
the droplet explodes into smaller lesser charged droplets.
• The process is repeated (solvent evaporation, shrinking, and
explosion) until individually charged naked analyte ions are formed
and enter the analyzer.
Matrix Assisted Laser Desorption Ionisation
(MALDI) • It deals well with thermolabile, non-volatile organic compounds
especially those of high molecular mass and is used successfully in
biochemical areas for the analysis of proteins, peptides,
glycoproteins, oligosaccharides, and oligonucleotides.
• MALDI is also a "soft" ionization method.
• Fragmentation of the sample ions does not usually occur.

• In positive ionization mode the protonated molecular ions
(M+H+) are usually the dominant species, although they can be
accompanied by salt adducts (M+Na) or (M+K).
• In negative ionisation mode the deprotonated molecular ions (M-
H-) are usually the most abundant species, accompanied by some
salt adducts and possibly traces of dimeric or doubly charged
materials.

• MALDI is based on the bombardment of sample molecules
with a laser light to bring about sample ionization.
• Aqueous or alcoholic solution of sample is pre-mixed with a
highly radiation absorbing matrix.
• Sinapinic acid is a common one for protein analysis while
alpha-cyano-4-hydroxycinnamic acid is often used for
peptide analysis.
• Solution evaporated on metallic probe.
• The matrix exposed to pulsed laser beam.
• The matrix transforms the laser energy for the sample, which leads to
sputtering of analyte and matrix ions from the surface of the mixture.
• In this way energy transfer is efficient and also the analyte molecules
are spared excessive direct energy that may otherwise cause
decomposition.
• Matrix absorbs laser wavelength, sample must not (or else
fragmentation occurs)

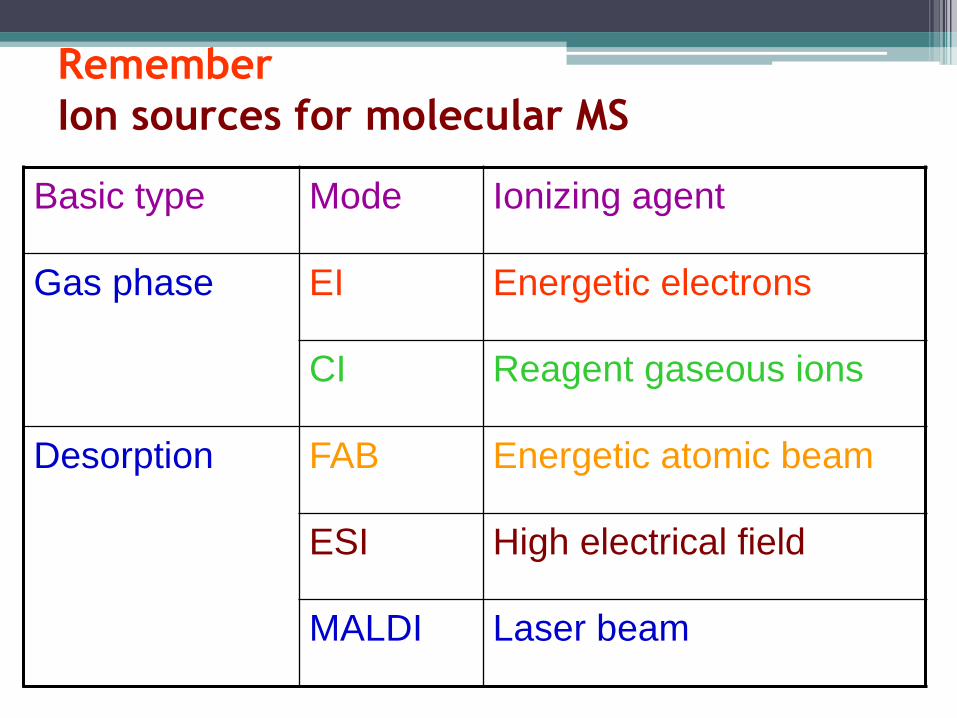
Remember
Ion sources for molecular MS
Ionizing agent Mode Basic type
Energetic electrons EI Gas phase
Reagent gaseous ions CI
Energetic atomic beam FAB Desorption
High electrical field ESI
Laser beam MALDI
High Resolution Mass Spectrometry
(HRMS)
• HRMS is used for determination of exact mass and
a molecular formula of the compound and
differentiation between isotopes.
• In low resolution MS, a molecular weight of the
compound based on atomic weights that are the
average of weights of all natural isotopes of an
element.

• i.e. For normal calculation purposes, you tend to use
rounded-off relative isotopic masses. For example,
you are familiar with the numbers:
• H = 1
• C = 12
• N = 14
• O = 16
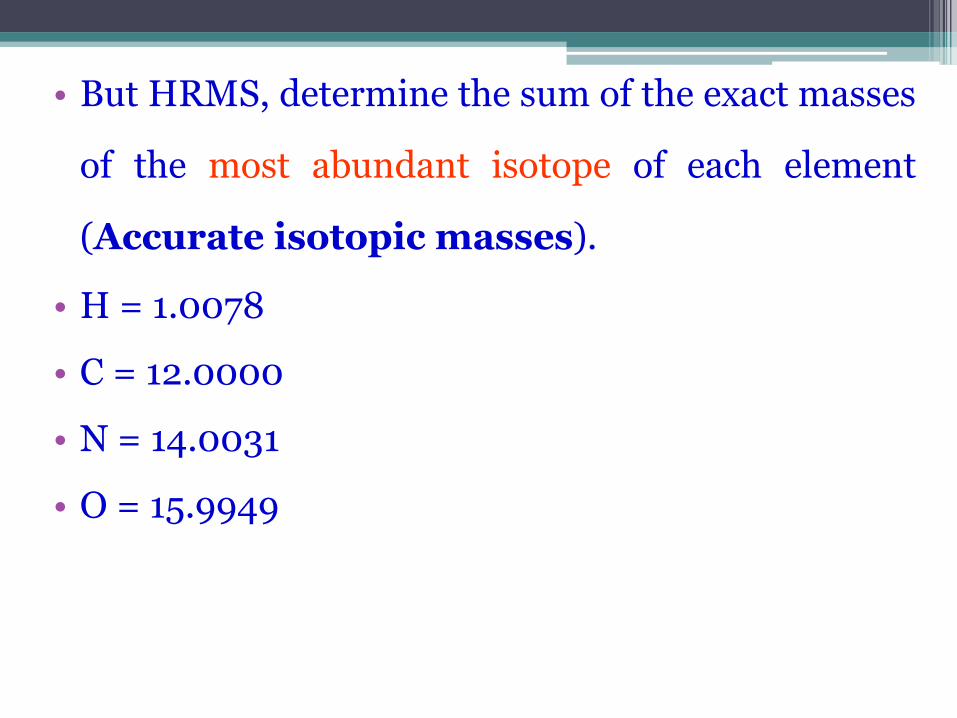
• But HRMS, determine the sum of the exact masses
of the most abundant isotope of each element
(Accurate isotopic masses).
• H = 1.0078
• C = 12.0000
• N = 14.0031
• O = 15.9949
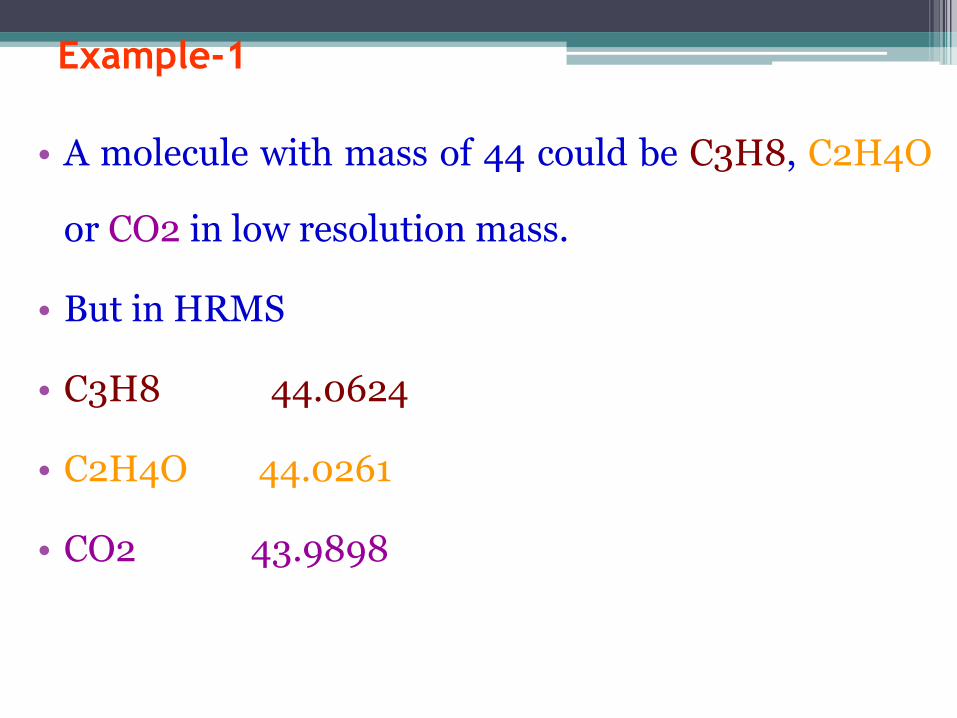
Example-1
• A molecule with mass of 44 could be C3H8, C2H4O
or CO2 in low resolution mass.
• But in HRMS
• C3H8 44.0624
• C2H4O 44.0261
• CO2 43.9898

Example-2
• CO, N2 and C2H4, having a mass at m/z 28, in a low
resolution mass spectrometer.
• But in HRMS,
• 12C16O = 12.0000 + 15.9949 = 27.9949.
• 14N2 = 14.0031 + 14.0031 = 28. 0062.
• 12C2 1H2 = 24.000 + 4.0312 = 28.0312.
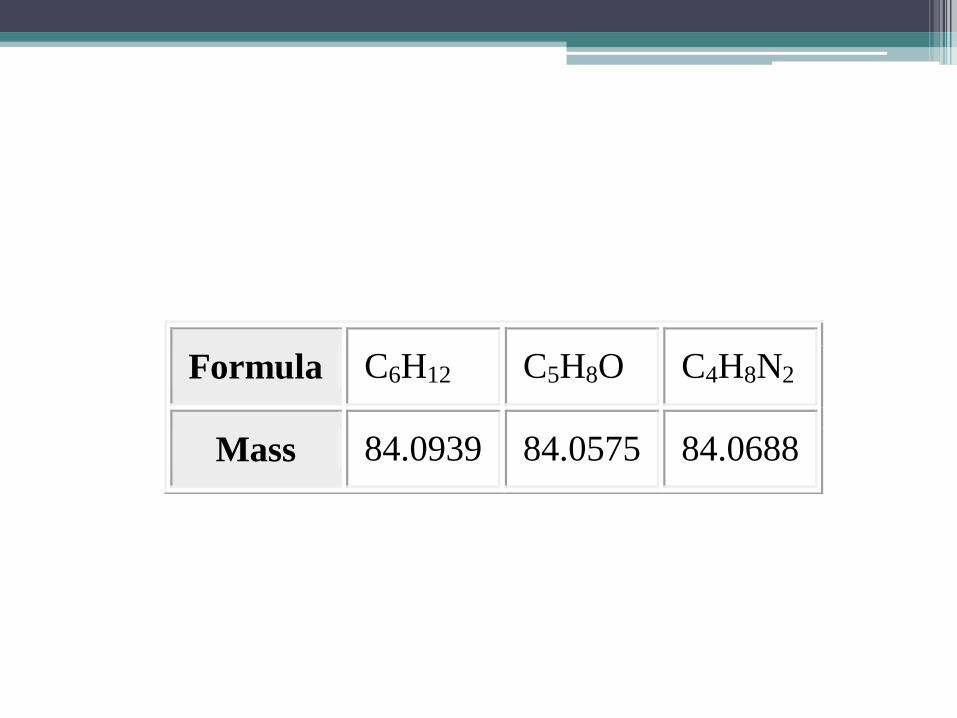
Formula C6H12 C5H8O C4H8N2
Mass 84.0939 84.0575 84.0688
Isotope patterns
• Mass spectrometers are capable of separating and
detecting individual ions even those that only differ
by a single atomic mass unit.
• We can use low resolution results and intensities of
isotope peaks to arrive to a possible molecular
formula.
• As a result molecules containing different isotopes
can be distinguished.

• Isotopes: present in their usual abundance.
• Hydrocarbons contain 1.1% C-13, so there will be a
small M+1 peak.
• If Br is present, M+2 is equal to M+.
• If Cl is present, M+2 is one-third of M+.

What is an M+1 peak?
• If you had a complete (rather than a simplified)
mass spectrum, you will find a small line 1 m/z unit
to the right of the main molecular ion peak. This
small peak is called the M+1 peak.
What causes the M+1 peak?
• The M+1 peak is caused by the presence of the 13C
isotope in the molecule.
• Carbon-13 makes up 1.11% of all carbon atoms.
This is most apparent when atoms such as bromine or
chlorine are present.
Peaks at "M" and "M+2" are obtained.
Bromine isotopes [79Br : 81Br] have the same
abundance intensity (having M and M+2 in ratio
1:1).
Chlorine [35Cl : 37Cl] have difference in the
abundance, so the intensity of M and M+2 is in ratio
3:1.
M+2 peak
• The intensity ratios in the isotope patterns are due
to the natural abundance of the isotopes.
• Therefore, differentiation between the mass spectra
of chlorine- and bromine-containing compounds is
possible.
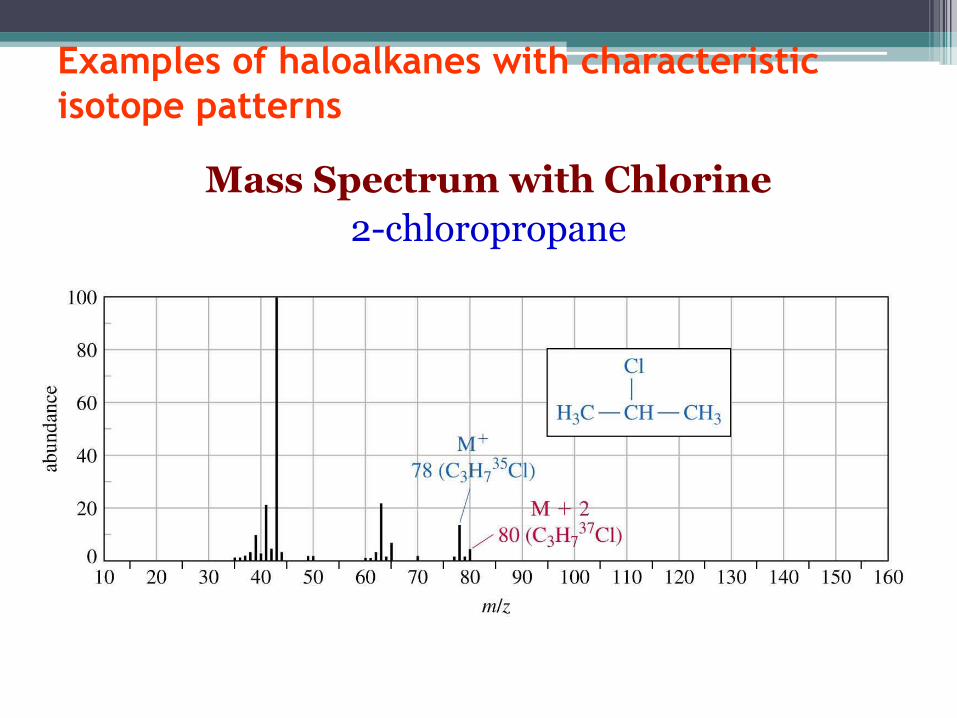
Examples of haloalkanes with characteristic
isotope patterns
Mass Spectrum with Chlorine
2-chloropropane

• Note the isotope pattern at 78 and 80 that represent
the M and M+2 in a 3:1 ratio.
• Loss of 35Cl from 78 or 37Cl from 80 gives the base
peak a m/z = 43, corresponding to the secondary
propyl cation.
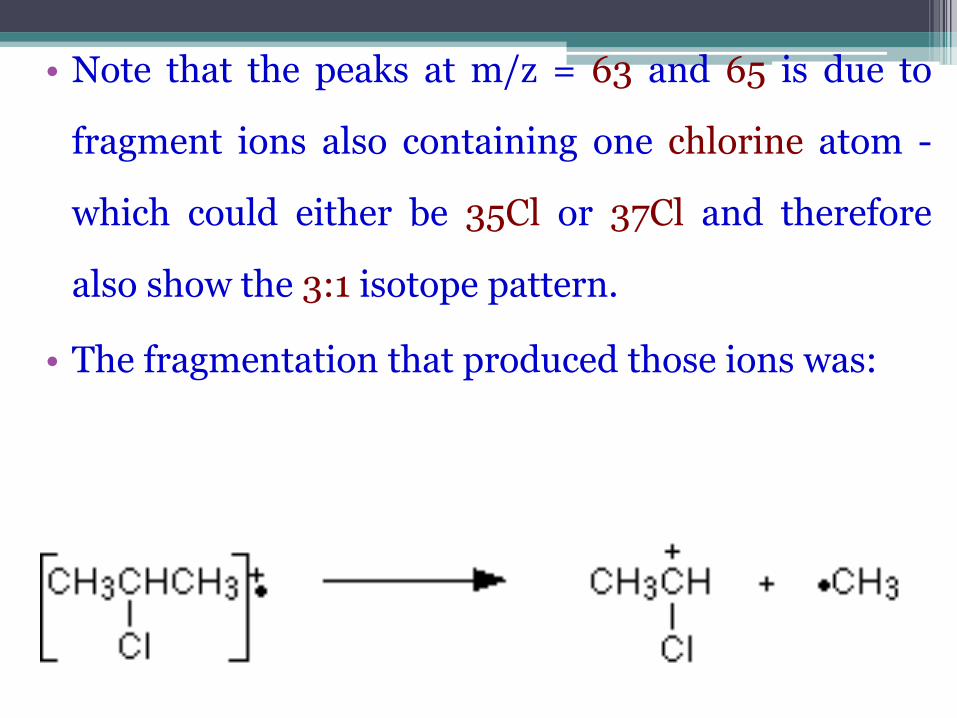
• Note that the peaks at m/z = 63 and 65 is due to
fragment ions also containing one chlorine atom -
which could either be 35Cl or 37Cl and therefore
also show the 3:1 isotope pattern.
• The fragmentation that produced those ions was:
So
• if you look at the molecular ion region, and find
two peaks separated by 2 m/z units and with a
ratio of 3 : 1 in the peak heights, that tells you that
the molecule contains 1 chlorine atom.
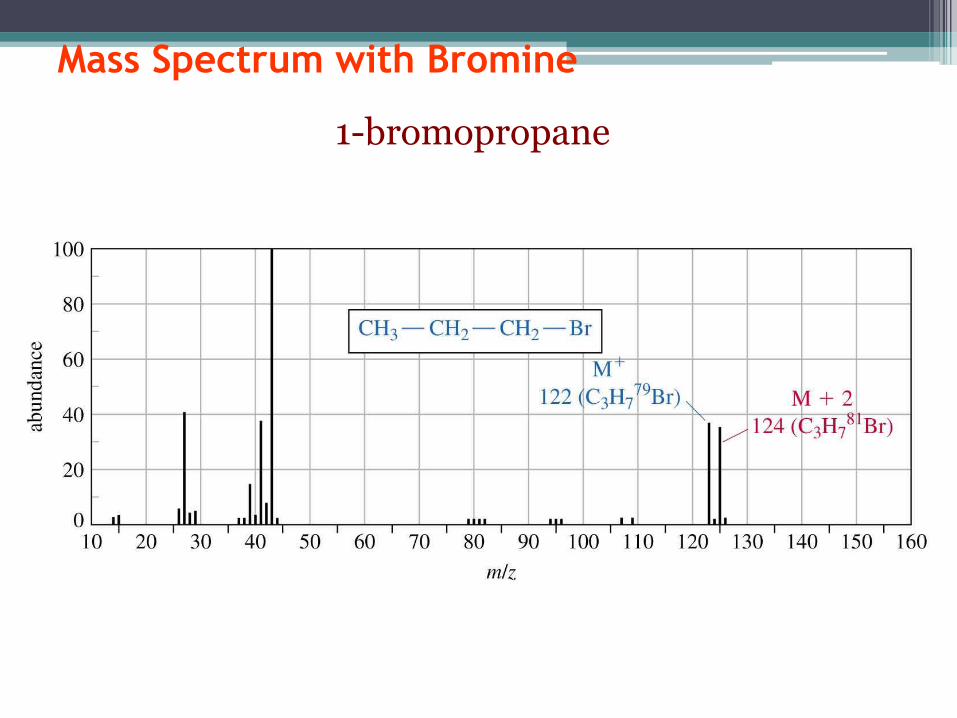
Mass Spectrum with Bromine
1-bromopropane

• Note the isotope pattern at 122 and 124 that
represent the M and M+2 in a 1:1 ratio.
• Loss of 79Br from 122 or 81Br from 124 gives the
base peak a m/z = 43, corresponding to the propyl
cation.

• Note that other peaks, such as those at m/z = 107
and 109 still contain Br and therefore also show the
1:1 isotope pattern.
So • If you have two lines in the molecular ion region
with a gap of 2 m/z units between them and with
almost equal heights, this shows the presence of a
bromine atom in the molecule.
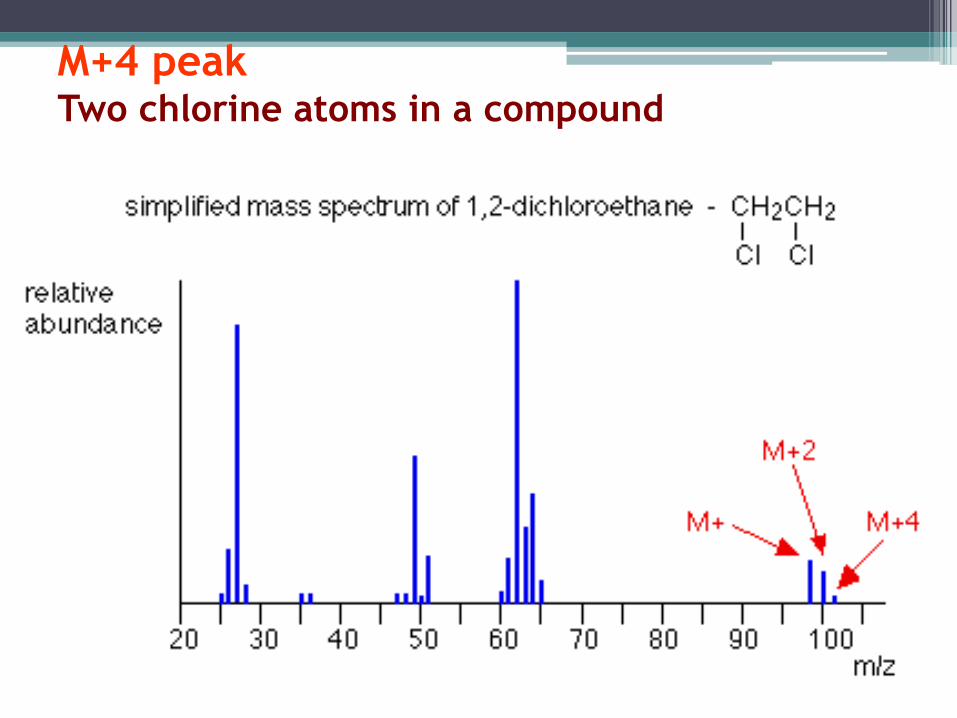
M+4 peak Two chlorine atoms in a compound
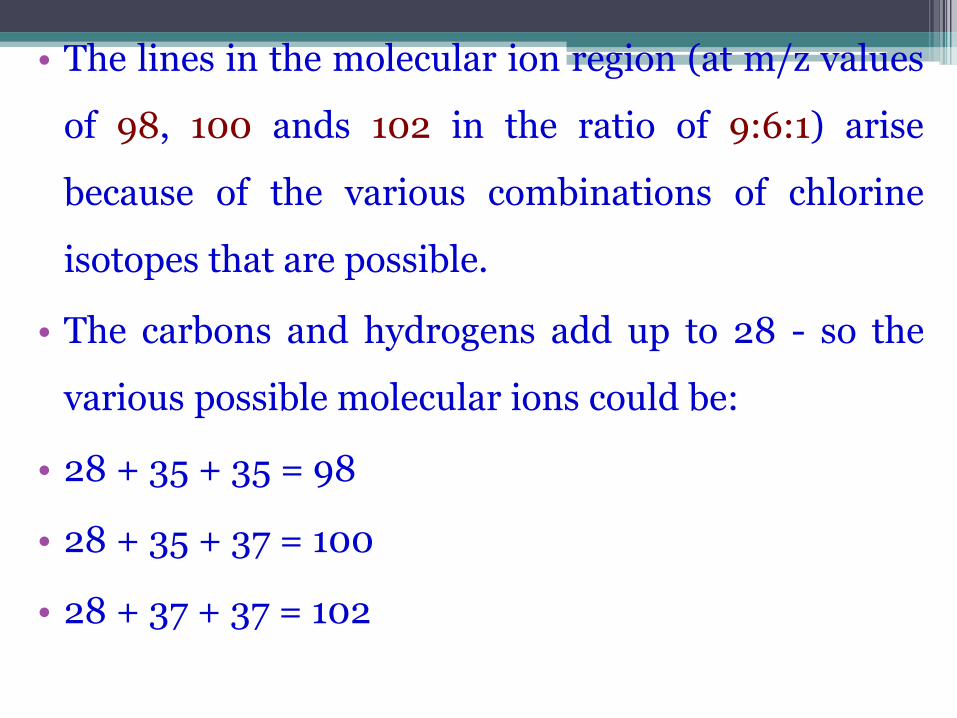
• The lines in the molecular ion region (at m/z values
of 98, 100 ands 102 in the ratio of 9:6:1) arise
because of the various combinations of chlorine
isotopes that are possible.
• The carbons and hydrogens add up to 28 - so the
various possible molecular ions could be:
• 28 + 35 + 35 = 98
• 28 + 35 + 37 = 100
• 28 + 37 + 37 = 102
So
• If you have 3 lines in the molecular ion region
(M+, M+2 and M+4) with gaps of 2 m/z units
between them, and with peak heights in the ratio
of 9:6:1, the compound contains 2 chlorine atoms.

Common MS fragments of organic compounds
m/z lost Moiety Compounds exhibiting loss
1 H aldehydes
15 CH3 branched sites
16 O sulfoxides, nitro compounds
16 NH2 amides, aromatic amines
17 OH acids
18 H2O alcohols, aldehydes, ketones, ethers

m/z lost Moiety Compounds exhibiting loss
26 CN alkylcyanides
29 C2H5 or CHO alcohols
31 OCH3 or CH2OH methyl esters, alcohols
35 Cl halide-containing
45 OC2H5 or COOH ethyl esters or carboxylic
acids