ms c)m plfcr sapirmi - usitc
TRANSCRIPT

ANNUAL REPORT ON THE IMPACT OF THE CARIBBEAN BASIN
ECONOMIC RECOVERY ACT ON U.S. INDUSTRIES AND CONSUMERS
Report to Congress and the President on Investigation No. 332-227 Under Section
- - - 332(b) of the Tarriff - - - Act of 1930
\ AM MS sapirmi r
UNITED STATES INTERNATIONAL
TRADE COMMISSION
Fifth Report 1989
e c)M Plfcr PUBLICATION 2321'"'.4h
.MBER 1990 LIPLA4
Georgetown North Pacific Ocean
North Atlantic Ocean
Caribbean Basin Countries
Gulf of Mexico
BELIZE Belmopan
HONDURAS * egucigaipa Caribbean Sea
San Salvo or EL SALVADOR NICARAGUA
* Mannqua
COSTA RICA Panama
San Jose
ST. CHRISTOPHER-NEVIS MONTSERRAT
NETH. ANTILLES . VINCENT
Oranjesta ,
(Neth.) Kingstown.: b BARBADOS d 14' Bridgetown
Willemstad St. Georgesio
. GRENADA
TRINIDAD AND TOBAGO Port-or-S pain
GUATEMALA Guatemala* ARUBA
U.S. VIRGIN ISLAN9S BRITISH VIRGIN ISLANDS ANGUILLA
ANTIGUA AND BARBUDA cr* St. Johns
DOMINICA .%.*. Roseau
V ST. LUCIA 0* Castries
04 t THE
t` BAHAMAS (1:0
Nassau
CAYMAN ISLANDS 0
JAMAICA HAITI
DOMINICAN REPUBLIC
PUERTO RICO San Juan
Kingston Port-au-prince San o e:/ •
Domingo

7471 - AWI ROWW
10 11Mge, "1 .
UNITED STATES INTERNATIONAL TRADE COMMISSION
COMMISSIONERS
Anne E. Brunsdale, Acting Chairman Seeley G. Lodwick
David B. Rohr Don E. Newquist
Office of Economics John W. Suomela, Director
Martin F. Smith Chief, Trade Reports Division
This report was principally prepared by: Paul R. Gibson Project Director
Hugh M. Arce Susan 0. Bloom
Janice Fair Michael Hagey
Jacques Herman
With the assistance of Dean M. Moore Sujit Chakravorti
Supporting assistance was provided by: Paula R. Wells, Secretarial services Linda D. Cooper, Clerical services
________________.
Address all communications to Kenneth R. Mason, Secretary to the Commission !
United States International Trade Commission Washington, DC 20436

Annual eport on the Impact of the Caribbean Basin Economic ecovery Act
on U.S. Industries and Consumers
Fifth Report 1989 -
Investigation No. 332-227
OONAZ
USITC Publication 2321
September 1990
Prepared in Conformity With Section 215(a) of the
Caribbean Basin Economic Recovery Act

PREFACE
The submission of this study to the Congress and the President continues a series of annual reports by the U.S. Ioterpational Trade Commission on the impact of the Caribbean Basin Economic Recovery Act (CBERA) on U.S. industries and consumers. The reports are mandated by section 215(a) of the act, which requires that the Commission report annually on the operation of the program. The present study fulfills the requirement for calendar year 1989.
The CBERA, enacted on August 5, 1983 (Public Law 98-67, 97 Stat. 384), - authorized- the- -President - to -proclaim- duty-free- treatment to eligible articles--from
designated beneficiary Caribbean Basin countries. The President proclaimed duty-free treatment on certain eligible articles effective January 1, 1984, and such *duty-free treatment is scheduled to remain in effect until September 30, 1995. Section 215 of the act requires the Commission to provide an assessment of the actual and probable future effects of the CBERA on the U.S. economy generally, on U.S. industries producing like or directly competitive products with those imported from beneficiary countries, and on U.S. consumers, and to submit its report to the President and the Congress by September 30 of each year. The provisions of the CBERA are listed and explained in the first CBERA report.
The following countries were designated beneficiary countries upon the implementation of the CBERA: Antigua and Barbuda, Barbados, Belize, Costa Rica, Dominica, the Dominican Republic, El Salvador, Grenada, Guatemala, Haiti, Honduras, Jamaica, Montserrat, Netherlands Antilles, Panama, Saint Christopher-Nevis (St. Kitts), Saint Lucia, Saint Vincent and the Grenadines, Trinidad and Tobago, and the Virgin Islands (British), The Bahamas became a beneficiary nation in March 1985. Upon becoming independent of the Netherlands Antilles in April 1986, Aruba was designated as a beneficiary country, effective retroactively to January 1, 1986. In April 1988 Panama's beneficiary status was suspended and in November 1988 Guyana was designated as a beneficiary country. Panama's beneficiary status was restored in March 1990.
The report contains three chapters and three appendices. Chapter I, focuses on the probable future effects of the CBERA. It examines significant investment projects in the region and provides an indication of products most likely to be exported to the United States in the future. Chapter 2 analyzes overall U.S. trade with the Caribbean Basin during 1989 and compares trade under special programs—CBERA, the Generalized System of Preferences (GSP), and Harmonized Tariff Schedule (HTS) subheadings 9802.00.60.00 and 9802.00.80, including statistical reporting numbers 9802,00.8010 and 9802.00.8050 (formerly Tariff Schedules of the United States (TSUS) items 806.30, 807-A, and 807.00). Chapter 3 addresses the actual effects of the CBERA in 1989, the 6th year of the program's operation, covering CBERA's effects on the U.S. economy, U.S. industries, and U.S. consumers. Appendix A contains a copy of the Federal Register notice by which the Commission solicited public comment for this investigation and a list of submissions received. Appendix B contains a table of the leading imports under CBERA provisions, by source, in 1989, U.S.-Caribbean trade data, arid data on twin plants and projects financed, With section 936 funds in 1989. Appendix C explains the economic model used to derive the results contained in chapter 3.
.11

CONTENTS Page
Preface
Executive Summary
Chapter 1. Probable future effects of the CBERA 1-1
Methodology 1-1 Overview of investment and export potential 1-1
Infrastructure 1-2 Agriculture and agroprocessing 1-2
- Labor_ supply _ 1-3 Section 936 funds - 1-4-
United States-Mexico free trade agreement 1-5 , Summary of investment activities and trends 1-5
New investment reported in CBERA countries in 1989 1-7 Industrial sectors 1-8 Central America 1-8 Central Caribbean 1-8 Eastern Caribbean 1-8
• Section 936 of the Internal Revenue Code 1-9 Section 936 financing 1-9 Financing obstacles 1-10 Twin-plant program 1-13
CBI II legislation 1-14
Chapter 2. U.S. Trade with the Caribbean Basin 2-1
Two-way trade 2-1 U.S. imports 2-2
Total imports from nondesignated countries 2-2 Total imports from designated CBERA countries 2-3 Product composition of total imports 2-6
Dutiability and special duty-free programs 2-8 Dutiable value of imports 2-10 Duty-free value of imports 2-10
MFN duty-free imports 2-10 CBERA duty-free imports 2-10 GSP duty-free imports 2-10 HTS subheadings 9802.00.60, 9802.00.80.10, and
9802.00.80.50 2-10 Product composition of imports under the CBERA 2-11 Product eligibility under the CBERA 2-11 Leading CBERA beneficiaries 2-15
Chapter 3. Impact of the CBERA in 1989 3-1 Products most affected by CBERA 3-1
Description of items benefiting from CBERA 3-1 Products that benefited the most from CBERA in 1989 3-3
Beef 3-3 Pineapples 3-3 Ethyl alcohol 3-3 Electrical variable resistors 3-4 Ceramic dielectric, multilayered fixed capacitors 3-4
Measuring the net welfare cost of CBERA in 1989 3-4 Analytical approach 3-4 Measurement of net welfare effects of CBERA 3-4 Quantitative results 3-4
Description of items analyzed 3-5 Effects on the U.S. economy in 1989: Net welfare costs
and the displacement of domestic output 3-5
111

CONTENTS—Continued
Page
Appendices
A. Federal Register notice and list of submissions A-1 B. Statistical tables B-1 C. Technical notes to chapter 3 C-1
Figures
2-1. U.S. trade with the Caribbean Basin countries, 1984-89 2-2 2-2. U.S. trade with the countries designated under the
CBERA, 1984-89 2-3 2-3. U.S. imports for consumption from CBERA countries
of goods not eligible for duty-free treatment under CBERA, 1985-89 2-14 C-1. Partial equilibrium analysis of the effects of removing
CBERA duty-free privileges on U.S. imports from CBERA beneficiaries, U.S. imports from competing non-CBERA countries, and competing domestic industries C-3
Tables
1-1. Reported investment projects in CBERA beneficiaries, by sector, 1989 1-7
2-1. U.S. imports for consumption from designated and nondesignated countries under the CBERA, 1985-89 2-4
2-2. U.S. imports for consumption from countries designated under the CBERA, by major groups, 1985-89 2-5
2-3. Leading U.S. imports for consumption from countries designated under the CBERA, 1985-89 2-7
2-4. U.S. imports for consumption from countries designated under CBERA, by duty treatment, 1985-89 2-9
2-5. Leading U.S. imports for consumption entered under CBERA provisions, by descending customs value of duty-free imports,1986-89 2-12
2-6. U.S. imports for consumption from the designated CBERA countries: eligibility and utilization of the GSP and CBERA programs, 1985-89 2-15
2-7. U.S. imports for consumption under CBERA provisions, by designated country, 1987-89 2-16
3-1. Customs value of products benefited from CBERA duty elimination, 1987-89 3-1
3-2. C.i.f. value of leading U.S. imports for consumption entered under CBERA provisions, 1989 3-2
3-3. C.i.f. value of leading imports that benefited from CBERA duty-free treatment in 1989 3-3
3-4. C.i.f value of imports that benefit from CBERA, and U.S. pruducers' domestic shipments that competed with CBERA duty-free imports, 1989 3-6
3-5. The estimated range of U.S. net welfare effects of CBERA duty-free entry by leading imports, 1989
3-6. The estimated range of the effects of CBERA duty-free entry • on the U.S. domestic shipments displaced by the CBERA
imports, by HTS items, 1989 Leading U.S. imports_for.consumption entering_duty-free___ _
under CBERA,in 1989, with corrresponding comodity shares, by source
B-2. Twin Plants and 936-financed projects, 1989 B-3. U.S. trade with the Caribbean Basin countries, 1984-89 B-4. U.S. trade with the countries designated under the CBERA, 1984-89 B-5. U.S. imports for consumption from CBERA countries
of goods not eligible for duty-free treatment under CBERA, 1985-89 ..................... .
3-7
3-8
B-2 B-5 B-7 B-7
11
_
EXECUTIVE SUMMARY
Probable Future Effects of CBERA
As in previous years, a majority of the new investment reported in the region is focused in production of goods or provision of services that are ineligible for preferences of the Caribbean Basin Economic Recovery Act (CBERA). These areas include investment in apparel assembly, tourism, and data processing. _ _ . _
Lower wage rates, proximity to the U.S. market, and reduced iriffs oi-duty--free- --- — access may all help explain such investment patterns. Firms specializing in the assembly of apparel or electronics benefit from the special access provided under the various subheadings of HTS heading 9802. Promotional efforts associated with the Caribbean Basin Initiative (CBI) may also play a part in attracting investment in tourism or other areas not eligible for CBERA preferences.
• The Commission identified 316 new or expansion investment projects in CBERA beneficiaries in 1989. A total investment value of $406 million was reported for the 263 projects that provided such data. Reported investment may substantially understate actual investment in the region but does indicate current trends.
The highest level of new investment was reported in the sectors of manufacturing and services (including tourism). Investment in apparel, electronics, and medical supplies dominated investment in manufacturing. In the mining and energy sector, one large project—a methanol plant in Trinidad and Tobago—accounted for all of the new reported investment in that sector.
• In 1989, two private-sector projects with investments totaling $68.0 million received approval for section 936 financing.
Both projects approved for section 936 funding in 1989 are centered in Jamaica. One involves $51 million for Air Jamaica to lease aircraft, the other $17 million for part of an AT&T fiber-optic cable system. In addition, six other projects that were
• under consideration in 1989—using a total of $191.0 million in section 936 funds—have subsequently received approval.
• A new version of "CBI II" legislation, designed to amend CBERA, was introduced in March 1989, and enacted in August 1990.
The version of CBI II enacted included repeal of the termination date of CBERA. It did not, however, include modifications contained in earlier proposals, such as a 50 percent reduction in duties for certain products previously excluded from the program (footwear, handbags, luggage, flat goods, work gloves, and leather wearing apparel).
U.S. Trade with the Caribbean Basin
• The year 1989 marked the sixth year of operation of the CBERA. Total imports from CBERA beneficiaries rose at a healthy pace in 1989, compared with those of previous years.
Total U.S. imports from CBERA beneficiaries climbed by 10 percent in 1989, to reach $6.6 billion. Strong growth in imports of such dutiable non-CBERA items as textiles and apparel, footwear, and leather apparel led the rise. The value of U.S. imports of petroleum and petroleum products declined slightly from 1988 levels.
• Total U.S. imports entering free of duty under CBERA provisions showed strong growth in 1989, rising by 15 percent, and accounting for 14 percent of trade from the beneficiaries.
CBERA duty-free imports topped 8905 million in 1989, a 15 percent increase over the 1988 level of $791 million. This level accounted for nearly 14 percent of total imports of $6.6 billion from beneficiary countries. By comparison, during the
W

first year of operation of the CBERA program, CBERA duty-free imports accounted for about 7 percent of total imports from beneficiary countries.
• For the third year in a row, in 1989 the United States enjoyed a trade surplus with • CBERA beneficiary countries.
In 1989, the U.S. trade surplus with CBERA countries reached nearly $1.5 billion. Total U.S. imports rose by 10 percent but were 23 percent below the level of $8.6 billion registered in 1984. Total U.S. exports to CBERA countries, however, have been registering repeated gains in recent years. In 1989, U.S. exports rose by 9 percent over the 1988 level, to $8.1 billion. The 1989 level was 36 percent over 1984 U.S. exports of just under $6.0 billion.
• Certain product areas such as beef, cane sugar, and pineapples remained major beneficiaries of duty-free status in 1989. However, some nontraditional goods such as medical instruments, electrical apparatus, and variable resistors solidified strong CBERA export-oriented growth of recent years.
Of the $906 million in total CBERA duty-free imports in 1989, beef remained the leading import item in 1989, valued at $118.5 million. Costa Rica was the leading source of this meat. Raw cane sugar was another leading import item, totalling $106.4 million in 1989. The Dominican Republic provided more than two-thirds of this sugar by value. Rounding out the top 10 CBERA duty-free items in 1989 were pineapples, baseballs and softballs, medical instruments, cigars, electrical apparatus, undenatured ethyl alcohol, and electrical variable resistors.
Impact of the CBERA in 1989
• Although the total customs value of duty-free imports to the United States under CBERA in 1989 was $906 million, the value that actually benefited from CBERA duty-free entry was $331 million.
The $331 million in imports was 37 percent of imports given CBERA duty-free entry, 5 percent of the customs value of total imports from CBERA beneficiaries, and approximately 0.1 percent of total U.S. imports. With the CBERA-country share of U.S. imports at such low levels, the impact on U.S. industries and consumers in 1989 was minimal. However, between 1988 and 1989, the level of imports that actually benefited from CBERA provisions increased by 11 percent, from $297 million to $331 million.
• In each of the past 6 years, seven products have consistently entered among the leading items that actually benefited from CBERA tariff preferences.
These items were beef, pineapples, orange juice, cigarette leaf, electrical capacitors, resistors, and rum. In addition, in each of the past 5 years, ethyl alcohol has been among the leading items that actually benefited from CBERA.
• The estimated net welfare cost to the United States of granting duty-free treatment to the 30 leading items that actually benefited from CBERA ranged from $2.4 million to $8.2 million in 1989.
Compared with the total value of 1989 imports from CBERA beneficiaries, the range of net welfare cost represented about 0.04 to 0.12 percent. Among the 30 items observed, five products with high net welfare costs were frozen orange juice, fresh and frozen beef, certain tobacco products, frozen vegetables, and pineapples. In terms of c.i.f. value, these five imports accounted for 61 percent of the total imports that benefited from CBERA in 1989. In addition, the item with the largest net welfare cost resulting from CBERA duty-free treatment, ethyl alcohol, was also the only item to show a_ po_teritial,net welfare_ gain. _The_net welfare_effect _ alcohol ranged from a loss of $1.8 million to a gain of $0.9 million.
• In value terms, the seven CBERA imports with the largest displacement effects on output of competing U.S. industries were ethyl alcohol, certain tobacco products, fresh and frozen beef, frozen orange juice, frozen vegetables, grapefruit juice, and pineapples.
The largest effect occurred for ethyl alcohol for which the displacement of domestic shipments ranged from $10.5 million to $14.4 million, or between 0.73 and 1.00 percent of the value of total domestic shipments.
vi

Chapter 1 Probable Future Effects
of the CBERA As noted in previous reports, most of the in-
itial effects of the one-time elimination of duties on imports from the Caribbean Basin region granted by the CBERA took place during the first 2 years after passage of the act.1 Any future ef-fects on U.S. industries and consumers can be
-- expected to occur-through-export-oriented invest-ment as investors attempt to take advantage of the lowered tariff levels and increasingly seek business opportunities in the region. This chapter presents an overview of the investments that oc-curred in 1988 and the degree to which such investments can be expected to affect U.S. im-ports in the near term. The general investment environment of the region is described, including the effects of political, economic, or social factors within beneficiary countries that enhance or di-minish _ the likelihood of investment-induced exports to the United States under the CBERA.
- Also included is a summary of submissions re-ceived by the Commission in the course of this investigation. This chapter also examines Puerto Rico's program to promote complementary in-vestment projects with CBERA beneficiary countries. Finally, legislation enacted in August 1990 that was designed to make permanent, and modify the CBERA in several other ways, is pre-sented.
Methodology This chapter is based on information obtained
from a variety of sources including field visits to four CBERA-beneficiary countries. These coun-tries—St. Kitts and Nevis, Dominica, St. Vincent and the Grenadines, and Trinidad and Tobago—were selected for fieldwork to provide a representative sample of the range of economic and other constraints facing Eastern Caribbean countries in particular that are trying to promote private investment and advance infrastructure de-
velopment. Meetings were held with host government officials, individuals in private sector organizations involved in investment and export promotion, other representatives of the local busi-ness community, and U.S. Embassy staff. Additional data and information on investment were obtained through reports from U.S. embas-sies in the region and from U.S. Government agencies, the U.S. Department of Commerce in particular.2
I See ch. 2 of USITC, First CBERA Report. 2 During the course of this investigation, in addition to
investment information requested from U.S. Embassies in the region, the only other comprehensive and reliable source of investment data for the region available was provided by the U.S. Department of Commerce, Carib-bean Basin Information Center. See also, "Data Problems and the USITC CBERA Report" in app. B of the Secoild CBERA Repot-L-1). B-2.
Overview of Investment and Export Potential
Staff visited three Eastern Caribbean coun-tries (St. Kitts and Nevis, Dominica, and St. Vincent and the Grenadines) and Trinidad and Tobago, and elicited views from private and gov-ernment officials that are consistent with findings in previous reports. There is a widespread feeling among interview respondents that CBERA, while not_ an _ineffective program, has generally not yielded substantial positive investment gains. CBERA has stimulated investment in only a very limited number of instances. Furthermore, the program is viewed as being largely redundant given the ability of many export manufacturers to ship their products to the United States under other duty-free provisions. Additionally, as is characteristic of less developed countries, in-frastructural limitations pose significant, if not insurmountable, barriers to CBERA-led invest-ment. Interviews also generated a number of findings not discussed in previous reports.
The interview respondents of the Eastern Car-ibbean countries and Trinidad and Tobago generally expressed a view that CBERA has not been effective in raising the level of exports to the United States, and has not lived up to expecta-tions of many domestic business and government Officials. In addition, while relatively few manu-facturers export under CBERA, even fewer firms were formed as a result of CBERA. Most respon-dents laid the blame for the limited impact of CBERA on the design of the program. The most common specific criticism was the failure to in-clude key industries in the program (or limiting their access with quotas and restrictions on cer-tain commodities), and failure to take into account the Caribbean's great diversity and levels of development. Also mentioned as reasons for limited impact of CBERA was the existence of duty-free entry under GSP, various provisions of HTS heading 9802, and generally low duties on most commodities prior to CBERA.
Not all respondents blamed the ineffective-ness of CBERA on the way the program was designed. A number of respondents in Trinidad and Tobago argued that CBERA is not being util-ized because of a lack of aggressive, entrepreneurial businessmen in the country. Do-mestic producers in the country have long been protected, they added, in an effort to develop im-port substitution industries. One drawback to this policy, it was stated, has been that domestic pro-ducers have not been concerned with export markets, or more generally, becoming interna-tionally competitive. Although the Government of Trinidad and Tobago plans to open the econ-omy to foreign competition in the
1-1

- - - - - - - - - - - inic1-1990s,3 it is unlikely, they said, that business-men will soon develop the business acumen necessary to utilize fully the CBERA benefits.4
Several aspects of CBERA were recorn7 mended -for improvement. Agricultural quotas and the exclusion of certain commodities from CBERA treatment are viewed critically by many respondents. As a result, much of the existing industrial base does not experience significant benefits from CBERA. A development official from St. Kitts and Nevis suggested that, given the nation's current effort to develop tourism, that perhaps CBERA could include incentives for in-vestment in the industry in the Eastern Caribbean. Although not mentioned in the same context, data processing, another targeted service sector, would be favored for some type of CBERA treatment.
Whatever concerns they may have regarding shortcomings in the CBERA program, a number of government and business representatives felt that the program had brought more attention to the Caribbean, and they viewed this outcome as CBERA's greatest benefit. This increased atten-tion is thought to have caused foreign investors to at least consider the region in investment deci-sions, whereas•before they may not have done so. It is unclear, however, to what extent this atten-tion has benefited the region, although most respondents felt that Costa Rica, Jamaica, and the Dominican Republic had received most of the investment into Caribbean countries. What in-vestment has been .placed into the Eastern Caribbean countries has been - mainly in agroprocessing and light manufacturing assembly operations. There has been a very limited amount of investment into nontraditional indus-tries such as winter vegetables and cut flowers.5
While the investment impact of CBERA on Caribbean countries is thought to be limited, it nevertheless is a significant benefit to select manufacturing operations. Staff visited several manufacturing operations that were actually de-veloped as a result of CBERA. These and several other operations exporting under. CBERA are growing rapidly, employing local engineering in-puts for the production process, and demonstrating a basic level of, innovative ‘capabi-
A high-level government official in Trinidad and Tobago believes that opening the economy of Trinidad and Tobago will threaten the survival of many local firms, and that successful adjustment will require "mas-sive" resources.
For. example, -Trinidad and Tobago currently meet — only 3 percent of their quota (guaranteed access level) negotiated under CBERA-related provisions of HTS statistical reporting number 9802.00.8010.
8 For example, staff visited an orchid farm in Trinidad that is developing export markets in the United States. CBERA. benefits to the operation are negligible, however, since the United States also provides duty-free entry for cut flower imports from Thailand, which is the firm's main competitor in the U.S. market.
lity. Although representatives of these operations did not feel that they would go bankrupt in the absence of CBERA, they said that they would be adversely impacted in a significant way. Such op-erations _ are - limited -in - both - numbers -and macroeconomic impact, but stand out as impor-tant local employers and internationally competitive manufacturers.
Infrastructure In order to export to the United States, the
Eastern Caribbean nations and, to a lesser extent, Trinidad and Tobago, must overcome a fairly daunting array of obstacles. An inadequate infra-structure is viewed by many local government and industry representatives as a barrier to fully realiz-
ing the potential benefits of CBERA. For example, product shipment to the United States is often difficult or costly,6 given the geographical fragmentation of the region and the small size of the economies. The departure of cargo ships and planes to the United States is relatively infrequent by modern standards, and cargo often requires a number of transshipments within the Caribbean and the United States. The resulting delays are commonly aggravated by bureaucratic problems at the various transshipment points, which some-times require that the exporter travel to the location to get the product moving again. As is true with infrastructural problems in general, the effect of transportation inadequacies varies among producers, but clearly represents a gener-ally negative factor in investment decisions.
The consequences of an underdeveloped transportation system are substantial, especially for agricultural products. Many are highly perish-able and rot before they reach the consumer! For manufacturers, it is often essential to meet
,demands for timely delivery of the product, and an unpredictable shipment process 'makes this task difficult.6 The limited size of Eastern Carib-
bean ,economies further complicates transportation problems since producers are often unab1e to fill a shipping container, thereby caus-ing shipment to be postponed.
Agriculture and Agroprocessing In Eastern Caribbean countries, an inade-
quate transportation-system is only one of several impediments to developing export agriculture and agroprocessing. Agricultural and agroprocessing business representatives in St. Kitts and Nevis, Dominica, and St. Vincent and the Grenadines voiced strong frustration in getting their products
A manager oran electronics firm In -81.-Ititis -and -
Nevis stated that the transportation cost to the United
States was ten times higher than from Asia. 7 In St. Vincent, a recent attempt to ship winter
vegetables to the United States ended with the realization
that the product-could not get to market before rotting,
given the current transportation system. 0 One manager of an electronics firm stated that St.
Kitts and Nevis recently lost an electronics firm to Haiti,
partly because of the lengthy shipment process.
1-2

through U.S. Customs, and in obtaining approvals from the U.S. Department of Agriculture (USDA) and the U.S. Food and Drug Admini-stration (USFDA). The General Manager of Dominica's Export-Import Agency stated that it is almost necessary to have someone at the customs point to get primary agricultural products through.
According interview respondents, processed agricultural products do not escape bureaucratic delays. These products must meet USFDA regu-
1a-tions- befofe they ate sold in the United States. Many producers lack the financial resources to make their products conform to these regulations. Those who have the resources must be extremely persistent to get the product to market. A rela-tively sophisticated producer of jellies, tropical
• fruit syrups, and sauces elaborated at length on the problems it experiences in gaining USFDA approval. The difficulty arises not from actually meeting the regulations, but rather from getting a clear explanation on what is required not only of the product, but of the labeling on the container. Producers describe the process as a bureaucratic nightmare that is characterized by inconsistent, legalistic explanations from U.S. agencies as well as inconsistent advice and poor communication among various U.S. agencies. Some producers state that part of the problem is a result of attract-ing greater scrutiny by U.S. Government agencies than is given to U.S. producers.9 The decision to export to the United States may require many months if not years of delays, they said. Such delays require extreme patience on the part of their U.S. buyer, they added, who often aban-dons the business venture when delays become prolonged. If an agroprocessor or agricultural ex-porter gets the product to the U.S. market, exporters noted that state regulations vary, and often preclude easy national market coverage.
While agricultural and agroprocessing export-ers said that they accept U.S. regulations as necessary, they complained of a lack of clear, un-ambiguous, and consistent information on regulations which severely limits their ability to penetrate the U.S. market. Industry representa-tives in St. Vincent and the Grenadines said that they receive no information dissemination from the appropriate U.S. agencies. Dominican ex-porters said that they receive occasional visits from U.S. agency representatives, but note that these U.S. representatives attempt to cover such a wide variety of issues relevant to exporters in such a limited amount of time that the crucial details of regulations are not discussed, or the officials lack detailed knowledge of specific regulations.
Thus, many respondents noted that an Indus-try that appears to offer a comparative advantage
9 For example, one industry representative who travels to the United States argued that he frequently sees U.S. products in stores that• appear not to meet FDA labeling requirements as explained to him by FDA officials.
for certain CBERA countries, and one that could have strong backward (input) linkages to the local economies, has not approached its export poten-tial. CBERA industry representatives, many of whom have traveled to the United States, stated that they are aware of potential market niches and trends in the United States, and express frus-tration that they have not been able to exploit those markets.19 The Eastern Caribbean inter-view respondents generally export agricultural products both to the United States and to the European Community (EC)".- When asked to compare gaining access to the EC market versus accessing the U.S. market, respondents consis-tently noted that it is much easier to gain access to the EC market. Even though countries such as West Germany have very strict regulations, Carib-bean exporters said that they are told quite explicitly and unambiguously what they must do to meet those regulations.
Many interview respondents stated that the ef-fects of a widespread inability of many Caribbean countries to penetrate the U.S. market with agri-cultural products is likely to be compounded in the mid-1990s. All three Eastern Caribbean countries that were visited receive preferential treatment by the United Kingdom for exports of certain agricultural products (mainly sugar from St. Kitts and Nevis, and bananas from St. Vincent and the Grenadines and Dominica). After 1992, in order to conform with the European Commu-nity's Single European Act, this U.K. preference will be removed or phased out. It is expected that the U.K. market for these commodities will be greatly reduced, creating a serious financial problem for Caribbean farmers of these crops. A transition to other crops and markets appears to be proceeding very slowly if at al1.11
Labor Supply Interview respondents made it clear that lim-
ited exports of non-agricultural products stem from more problematic structural characteristics of local economies. For both St. Kitts and Nevis and Dominica, a limited labor supply represents a serious barrier to expansion of the manufacturing sector.12 According to interview respondents in both countries, a variety of factors account for
19 When asked how they would explain the ability of certain tropical countries to successfully penetrate U.S. markets with agricultural crops, interview respondents noted that many such successes hinge on a U.S. business controlling the export of the crops.
it Some Caribbean countries can export to the EC under provisions of the Lome IV agreement. When asked to compare the success of CBERA versus Lome IV with respect to exporting agricultural commodities, an official of the Government of Trinidad and Tobago stated that Lome IV was so complicated that it was of limited use. The official felt that CBERA was a more favorable agreement.
12 The labor shortage represents such a significant barrier to manufacturing expansion in St. Kitts and Nevis that the Government is targeting higher-value manufac-turing (within the electronics and garment industry) as areas for promoting investment, rather than in manufac-turing areas that require high levels of employment.
- - - - _ the labor shortage. First, the local populations are rather small and unemployment is reportedly less than 15 percent in both countries. Secondly, factory jobs carry a distinctly negative image in both countries. People consider factory jobs to be repetitious, boring, low-wage work that re-quires long hours.13 Work in light manufacturing and assembly factories (the majority of factories in the Eastern Caribbean) is largely shunned by men. Consequently, the workforce in factories is dominated by women, many of whom are single parents, a factor which, many factory managers said, complicates the firms' ability to retain em-ployees. Attitudes about factory work are further tainted by the highly mobile nature of light manu-facturing assembly operations. Foreign-owned firms have sometimes moved from Caribbean countries with only a few days notice. Besides obvious economic repercussions, sudden losses of manufacturing operations create an attitude among the local populations that foreign-owned firms are not investing for the long term, and that they are "here today, gone tomorrow" .14
Thirdly, interview respondents described wage rates in both St. Kitts and Nevis and Dominica as relatively high compared with other countries in the region. One high-level government official in St. Vincent and the Grenadines noted that East-ern Caribbean countries have high wage rates compared with other Caribbean countries (Ja-maica and the Dominican Republic for example), and other disadvantages to manufacturers, such as transportation difficulties. He went on to ask rhetorically what countries such as his had to of-fer in return for the higher wage rates and transportation bottlenecks. Plants that are oper-ating in these countries on the basis of minimizing labor costs are doing so in an environment where, certain businesspeople said, many workers do not feel compelled to accept particularly low wages. Many citizens of these countries can earn better wages in the tourist industry (primarily hotels), and frequently move .to more well-known tourist islands in the region in search of such employ-ment. Additionally, the tourist industry carries an image of glamour that entices many people away from factory work.15 The loss of workers to higher wage nations also applies to those workers with more skills. The manager of a soap plant in
13 Numerous plant visits indicate that there is much validity to these perceptions in many factories.
14 For example, investment promotion officials in St. Vincent and the Grenadines reported that the country lost three important manufacturing operations within one year. They said that there appeared to be no common
.r_eason_for_the loss of_the - - - 15 Interviews strongly suggest that the work environ-
ment and treatment of workers can greatly offset the difficulty in attracting labor. The best example of this came from a manager of an electronics firm in St. Kitts and Nevis. The manager said he had no labor problems in the plant. He also said that he interacted closely with his workers, attended management seminars, involved his workers more closely, in the success of the plant, and provided managerial training to certain employees.
1-4
Dominica noted that he frequently lost trained technicians to better-paying countries. Interview respondents in St. Vincent and the Grenadines and Trinidad and Tobago described the labor supply in more favorable terms;. however, unem-ployment is substantially higher in those countries.
Thus, not all Caribbean countries are consis-tently good sources for abundant, very low-wage labor. Certain Caribbean countries are not likely to attract much investment requiring such a labor supply, and local investment promoters are aware of this fact. Accordingly, Eastern Caribbean countries are targeting tourism as a growth sector even though there is a concern over becoming over-dependent on that industry.15 Tourism and data processing represent two industries targeted for growth in the Eastern Caribbean that receive no benefit from CBERA.
The lack of support industries makes expan-sion of the industrial base difficult and costly. For example, there is a lack of packaging plants (boxes, bags, cartons, etc.) making it necessary for many countries of the Eastern Caribbean to import packaging materials. Several manufactur-ers stated that, as a result, the packaging for a product is sometimes more expensive than its contents.
Section 936 Funds One of the most significant potential benefits
of CBI, many said, at least in terms of investment magnitude, is Section 936 funding that may be available from Puerto Rico.17 CBERA beneficiary countries have extensive funds available to them if they sign a Tax Information Exchange Agree-ment (TIEA) with the United States. Countries that sign a TIEA, however, are required to abol-ish their bank secrecy laws, and risk a loss of bank investment. Of the Eastern Caribbean countries visited, neither St. Kitts and Nevis nor St. Vincent and the Grenadines have chosen to sign a TIEA. As officials in both countries pointed out, signing the TIEA does not guarantee large amounts of 936 funds will be invested in such countries. There is widespread agreement among business and government officials in the Eastern Caribbean interviewed that, practically speaking, the funds can only be used for large, multimillion dollar projects that small economies cannot easily absorb. The projects must be con -
10 There is a certain amount of incompatibility between expanding the tourism sector and expanding manufacturing. For example, Dominica has a reputation as being an island of ria-ttnal be-id-Hy:The- Country - - recently turned away investment in a plastics recycling plant over fear that pollution from the plant could harm the island's environment. Also, some investment promo-
tion officials cautioned that tourism can be "fickle, providing uneven levels of employment and earnings from
one year to the next. 17 For a detailed discussion of Section 936 funds and
lending of such monies in 1989, see the section "Section
936 of the Internal Revenue Code" later in this chapter.

sidered relatively safe and be capable of earning foreign currency. Furthermore, while 936 funds are available at several percentage points below commercial lending rates, the multiple "back-stops" of funding that must be acquired in case the investment project fails, along with insurance for political risks and the various financing fees in putting the loan together, add up to costs that make section 936 funds roughly as costly as com-mercial loans would be without insurance for political risks. The real advantage to section 936 funds, said a representative of a firm that recently borrowed such funds, is that they are avilable capital for investment, whereas commercial loans are difficult to acquire without costly insurance for political risk.
Trinidad and Tobago is the recipient of the largest amount of 936 funds. The country re-ceived over $145 million for two petrochemical projects, and is being considered for $25 million for another project. Dominica built a box plant for bananas with 936 funds, which permits the country to produce packaging materials locally rather than having to import them.
United States-Mexico Free Trade Agreement
Most interview respondents stated that there is widespread concern among Caribbean coun-tries over a possible free trade agreement (FTA) between the United States and Mexico. Such an agreement, they said, raises the possibility that Mexico would become a more favorable destina-tion for foreign investment than it is at present. They stated that a free trade agreement would add to other favorable factors enjoyed by Mex-ico, such as dose proximity to the U.S. market, relatively extensive transportation linkages, and large pool of labor, that are unavailable in many Caribbean nations. Thus, while they expressed a general dissatisfaction with CBERA, they also voiced concern that more investment in general could be directed away from the region if such an FTA were enacted. Many interview respondents expressed the view that the Caribbean should be included in a free trade agreement with Mexico. Several respondents said that there is no threat to the Caribbean of a free trade agreement between the United States and Mexico. For example, one respondent said that the Caribbean is more stable politically than Mexico. Two different factory managers in Trinidad and Tobago stated that their chief competitor in Mexico produces poorer quality products than do their respective firms.
Several respondents said that a general hemi-sphere-wide free trade agreement would be the most beneficial type of agreement. The manager of a fairly large export-oriented appliance firm in Trinidad and Tobago said that such an agreement could benefit the Caribbean since it would open up South American markets that are currently highly protected from Caribbean exports.
Summary of Investment Activities and Trends
Overall, although some of the new investment taking place in the region during the past year has focused on products eligible for duty-free entry under the CBERA, the act has not fueled growth of the economies of CBERA beneficiaries or of their exports in a way that is likely to affect U.S. industries or consumers significantly in the imme-
diate future. First, despite significant achievements by several beneficiary countries with aggressive investment promotion agencies, the overall level of private sector investrnent in the region has remained relatively low. Countries in the region continue to have difficulties attract-ing CBERA-eligible projects. In some cases, major investments that have been attracted have stalled or are producing below capacity.
Second, the scope of products produced in the region that are eligible for duty-free entry un-der the CBERA and not otherwise eligible under GSP is limited.19 Much of the investment at-tracted to the region involves the production of goods such as apparel assembly operations that are ineligible for duty-free treatment under either program. Tourism projects, such as hotels, also receive a considerable amount of the new invest-
ment.19 Moreover, some of the region's best-selling exports are not eligible for duty-free treatment.29 As noted in chapter 3, excluded products include textiles and apparel, certain flat goods, footwear, petroleum and petroleum prod-ucts, canned tuna, certain leather apparel, and work gloves.21 Finally, most imports of CBERA-eligible products to the United States represent only a small fraction of total U.S. imports and consumption of such products.
However, in connection with this investiga-tion, the Commission received submissions from two concerned industries. The Motion Picture Export Association of American (MPEAA)22 commented on protection of intellectual property rights in certain Caribbean countries. The MPEAA noted that, in granting CBERA duty-free status to Caribbean countries, the President is re-quired to consider the extent of adequate and effective enforcement of exclusive intellectual property rights for foreign nationals and the ex-tent such countries engage in unauthorized broadcast of copyrighted material belonging to U.S. copyright owners. The MPEAA stated that
19 For a list of these products, see table 3-3 in ch. 3. 19 Tourism is important to the Caribbean because it
brings in considerable foreign exchange earnings and also stimulates the local economy to provide a number of goods and services such as fresh fruit and vegetables, furniture, guide services, etc.
20 For a list of these products, see figure 2-3 in ch. 2 and appendix table B-5.
21 Although an early form of CBI II legislation proposed duty reductions for many such goods, the final version was much less comprehensive. For a discussion of CBI H legislation, see the CBI II discussion part of this chapter.
22 Submission dated Aug. 10, 1989, Motion Picture Export Association of America.
1-5

_ _
"member companies continue to experience seri-ous difficulties with illegal and unauthorized use of their product in a number of CBI countries."23 Member companies lose an estimated $4 million annually due to such infringements:, :the. MPEAA argued. In Its submission, the MPEAA identified the Dominican Republic as violating' copyrights through unauthorized broadcast and cable trans-mission of films owned by member companies. The MPEAA added that Various degrees of signal theft and video .piracy' exist in Aruba, Belize, Bar-bados, El Salvador, Guatemala, Haiti, Honduras, Nicaragua, and Panama. Panama was singled out as "a source of pirate videocassettes for: most of the Caribbean Basin."24 The U.S. Government should "exert its influence" on Caribbean coun-tries, the .MPEAA stated, to enforce the level of copyright protection which . such governments committed themselves when signing the Carib-bean Basin Initiative.25 •
-Submissions to the USITC by the Cordage In-stitute (CI) and the American Cordage and Netting Manufacturers (ACNM) state that the American coi•dage industry ."is being severely, ad-versely, economically impacted by the operation of CBERA provisions in a manner not intended by .Congress when CBERA was,enaCted."28 The ACNM states that baler twine, tying twine and rope of fibrillated polyolefin is "imported at less than • fair . value and improperly using CBERA benefits to avoid Congressionally-mandated quota and duty."27 The CI maintains that cordage im-ports, from, countries such .as Costa Rica, enter the U.S. market, on a unit value basis, at costs up to 19 percent below production costs.28 For the future, the CI expects "massive, below cost of production" imports from CBERA countries to the United States.28 The CI submission con-
. dudes that strong penalties should be levied against importers who "knowingly claim a Wrong classification to fraudulently take .advantage of CBERA benefits."3°
Previous CBERA reports have listed several problems that have hampered the efforts of CBERA beneficiaries to attract new private in-vestment and that have made entry of their products into U.S. markets difficult. These prob-lems include inadequate infrastructure, lack of affordable local financing, and lack of experi-
ence with the U.S. market. To date, most such problems have been ineffectively addressed. Since these problems are frequently structural in nature and are common in developing countries_ around the world, it is unlikely they will be suc-cessfully redressed in the near future. First, although the industrial infrastructure in the region is gradually improving with the assistance of for-eign aid, inadequate inland transportation, port facilities, and energy supplies make operations uncertain and costly for foreign companies inter-ested in investing in many CBERA countries. Inadequate infrastructure is evident everywhere in the region, but it is a particular problem in Be-lize and in the smaller countries of the Eastern Caribbean where infrastructure has been histori-cally neglected. In many Eastern Caribbean countries, for example, the poor air and sea cargo handling facilities are reportedly one of the major constraints to development.31
Second, as reported in previous years, a lack of affordable local financing is another problem that continues to inhibit the growth of new ven-tures in the region. Banking systems throughout the Caribbean are conservative and appear reluc-tant to make loans , for projects involving nontraditional exports. In a number of instances during the field visits, business and government officials said that the lack of local long-term credit means that joint ventures are essential for injecting capital into many projects.
Third, a lack of experience with the U.S. market by CBERA producers continues to make development of distribution networks and forma-tion of joint ventures difficult. A number of beneficiary countries, assisted by USAID funding, have established trade promotion centers and funded local private organizations to facilitate en-try into U.S. markets and to encourage local investment in response to this problem.32 The situation has also been alleviated in some cases by the formation of exporter, cooperatives and lectives.33
Other constraints that affect the ability of beneficiary countries to fully exploit the CBERA
31 In the Eastern ,Caribbean, for example, Dominica and St. Vincent and the Grenadines both lack airports capable of handling jet aircraft, and have limited deep water port capacity.
32 For example, Jamaica Promotions Ltd. is an umbrella agency responsible for the nation's investment and trade promotion program. The Belize Export and Investment Promotion Unit provides investment Promo-tion services, sponsors Belizean participation in trade missions and assists the_governme_nt in_enhancing export developmeliC The Eastern Caribbean Investment Promo
tion, Service, working in tandem with investmen t
-
promotion agencies in each member country, provides
similar services to Antigua and Barbuda, Dominica,
Grenada, Montserrat, St. Kitts and Nevis, St. Loom, St.
Vincent and the Grenadines, and the British Virgin
Islands. 33 For a discussion of exporter cooperatives in Ja-
maica and Guatemala, see USITC, Fourth CBERA
Report, p. 3-4.
23 Submission dated Aug. 10, 1990, MPEAA, p. 2. 24 Ibid, p. 5. 23 'bid, p. 6. 26 Submission dated Aug. 10, 1990, Ann Ottoson
King, Leighton and Regnery t Counsel to. the Cordage-
--Institute and -gtibfrilS-sion dated May 1, 1990, Ann Ottoson King, Leighton and Regnery, Counsel to Ameri-can Cordage and Netting Manufacturers, p. 2. • 21 Submission dated May 1, 1990, Ann Ottoson King, Leighton and Regnery, Counsel to American Cordage and Netting Manufacturers, p. 2.
28 Submission dated Aug. 10, 1990, p. 2. 20 CI submission dated Aug. 10, 1990, p. 3. 3° CI submission dated Aug. 10, 1990, p. 6.
1-6

include political and social instability perceived by investors, local controls on exports and imports, exchange controls that limit the availability of hard currency required for imported inputs, small domestic markets, and inefficient local bureauc-
racies. Some countries in the region are, however, making progress in liberalizing foreign exchange controls and import licensing systems. Moreover, many Caribbean countries are faced with shortages of managerial and skilled labor and inadequate supplies of unskilled and semi-skilled labor_to fill some factory and agricultural jobs.
- - - All of the difficulties cited above indicate that
although investment is occurring in the• region, large increases in exports to the United States, as stated in previous CBERA reports, cannot be ex-pected to occur within the next few years.
New investment reported in CBERA countries in 1989
The 1987 CBERA report relied on data sup-plied by the U.S. Department of Commerce survey on investment projects in the Caribbean region. The Commission obtained data on 1988 investments from various sources in order to re-pore on 1988 investment activities and future trends. For this report, investment data collected from two primary sources. First, from U.S. Em-bassies in the Caribbean, which were asked by the Commission to report significant, CBERA-related new investment in 1989. Second, from the Com-merce Department, Caribbean Basin Information Center, which during the early part of 1990, com-piled investment data for a 1988-90 Caribbean
investment survey. 34 The investment figures in this section are not all-inclusive, since a number of investment projects in the region may be un-reported, but are indicative of current trends in the region.
The Commission identified 316 new or ex-pansion projects for 1989;35 Of these projects, 263 reported investment figures totaling $406 mil-lion. Table 1-1 provides a summary of reported new investment in CBERA countries, by sector.
Of the Caribbean's three subregions—Central America, the_Central Caribbean, and the Eastern Caribbean—the Central Caribbean grouping 1989 with the highest value of reported new or expansion investment, followed by Central American and the Eastern Caribbean. By value of investment, the Central Caribbean reported $179 million in new investment in 1989. New investment in Central America and the Eastern Caribbean was reported at $116 million and $112 million, respectively.
34 The most recent published report based on this data is the Caribbean Basin Investment Survey, U.S. Depart-ment of Commerce (November, 1988). Other sources for investment data included the Latin American Agribusi-ness Development Corporation, the Economic Development Administration of Puerto Rico (Fomento), The Agriculture Venture Trust in Barbados, and the Eastern Caribbean Investment Promotion Service. Published sources such as the Caribbean Update and the U.S. Department of Commerce, Caribbean Basin Information Center's publication CBI Business Bulletin were also used for general project information. Data from the different sources were frequently neither com-prehensive nor comparable. Thus, the Commission does not maintain that the figures based on this information are all-inclusive.
35 Some sources reported either aggregate figures for industry sectors or company listings in which the sector or product type could not be determined.
Table 1-1 Reported Investment projects in CBERA beneficiaries, by sector, 1989
Sector
Number of projects reported
Number of projects reporting investment amounts
Total investment reported
$1,000
dollars
Agriculture 92
81 50,750
Aquaculture 12
9 1,689
Manufacturing:
Apparel 72
58 48,865
Electronics 31
28 27,344
Footwear . 4
2 3,489
Furniture 10
10 5,527
Medical Supplies 6
6 36,582
Pharmaceuticals • 2
2 8,100
Wood products 5
4 2,868
Other' 34
27 21,223
Mining and Energy '4 ' 3 79,000
Service and Tourism:
Construction 2
0 1,638
• ,. Data Entry Services
12 9
. 12 9
7,478 71,277
Tourism 21 • 14 40,599
Grand total 316
263 406,435
_ -'Includes a diverse range of products such as bicycles, catamarans, Jewelry, and plastic bags, - _ _ _
1-7

Industrial sectors
As shown in table 1-1, the largest number of projects were reported in the agriculture and ap-parel sectors. Investment projects in the areas of tourism, data entry, electronics, aquaculture, and furniture, and "other manufacturing," also ac-counted for a large share of new investment activity.
The majority of investment in CBERA-eligible product areas that reported dollar values of in-vestment was reported in agriculture, electronics, medical supplies and "other manufacturing." In agriculture, a total of $51 million in new invest-ment was reported in 81 projects. Twenty-eight investment projects in the electronics sector (in-cluding manufacturing and assembly operations) reported a total of $27 million in new investment in 1989. Six projects in the area of medical sup-plies were valued at a total of $37 million. A wide variety of projects in the category of "other manufacturing" were valued at $21 million for 27 projects. These projects included sporting equip-ment, jewelry, plastic bags, luggage, and cardboard boxes.
Product areas not presently eligible for CBERA duty-free entry also reported significant infusions of new investment funds in 1989. These sectors included apparel, data entry, tour-ism, and other services.
Investment values were reported for 58 pro-jects in the apparel sector with a total value of $49 million. Over $71 million in a variety of serv-ices were reported in 9 projects in 1989 such as consulting, container refurbishing, and cold stor-age. In addition, two projects in the services sector in Jamaica received section 936 financing in 1989. These were a $51 million loan to Air Jamaica to modernize its fleet, and a $17 million to AT&T for part of a large digital fiber-optic ca-ble system. The data entry sector received $7 million in new investment for 12 reported pro-jects. In tourism, a major Caribbean industry, $41 million worth of investment in 14 projects were reported in 1989. Most of these projects were either hotels, restaurants, or bars.
In the mining and energy sector, new invest-ment was dominated by the lending of section 936 funds to Trinidad and Tobago to finance a methanol plant. A $79 million loan of such funds for this project accounted for the reported new investment in this sector.
Central America
New investment in Central America reached a reported 167 investment projects in 1989. Costa
_Rica led the list- of countries with the-higheit lev61 of investment activity, with 68 reported new pro-jects. Guatemala reported the next highest level of new projects with 36, followed by Belize (33), Honduras (25) and El Salvador (5).
The two main areas of Costa Rica's new 1989 investment were agriculture and apparel. Many
agricultural projects were in areas such as orna-mental plants, fruits, and nuts.
New investment in Guatemala was attracted to various types of nuts and seeds, ornamental plants, flowers, and coffee. One investinent in a nonagricultural area—cold storage—was, never-theless, indirectly related to agriculture. Investment in apparel was the major sector re-porting nonagricultural new investment in 1989.
The two main areas of Belize's new 1989 in-vestment were agriculture and aquaculture. Investment in citrus farms, shrimp farming, crab harvesting, and fishing made up the bulk of new investment in Belize in 1989. About one-quarter of the new investment projects in Belize were centered in areas that are not eligible for CBERA preferences, particularly apparel and tourism.
Reported new investment in Honduras in 1989 was distributed in a wide variety of sectors. Furniture, apparel, agricultural areas such as or-namental plants, fruits, and fish accounted for the majority of such projects.
Of the five reported investment projects re-ported for El Salvador in 1989, two were in the area of shrimp harvesting, another two in shoe parts, and one in ornamental plants.
Central Caribbean
As noted above, of the three subregions of the Caribbean, the Central Caribbean countries of Ja-maica and the Dominican Republic led in terms of attracting new investment in 1989. Ten new investment projects were reportedly started in Ja-maica in 1989, and 75 in the Dominican Republic. New investment in the Dominican Re-public, reaching a total of $99 million in 1989, was dispersed among a wide variety of sectors. Much of the new investments was reported in electronics, food processing, apparel, footwear, pharmaceuticals, cigars, medical supplies, and chemicals.
New investment in Jamaica in 1989 was fo-cused on a few projects, although the dollar value of such investments was quite large. Two projects were financed with $68 million in section 936 funds.30 One of these projects provides Air Ja-maica with $51 million for leasing new aircraft, and the other provides AT&T with $17 million for a portion of a fiber-optic cable system. Five other new investments in Jamaica in 1989 were in textiles and apparel projects.
Eastern Caribbean In the Eastern Caribbean region, 62 new in-
vestments were reported_ for _1989, -with_ a. total value of about $112 million. The largest number of projects was reported for Grenada. The new investment in Grenada was focused in apparel as-sembly, data entry, assembly of electronic items, and tourism. In St. Lucia, five new investments
" For a discussion of section 936 funds, see the following section.
1-8
1150
in assembly of personal computer boards, and one data entry project were reported for 1989. Three investments in the electronics sector were reported for Antigua and Barbuda, and one in-vestment in assembly of personal computer boards was reported for St. Kitts and Nevis.
Section 936 of the Internal Revenue Code
- Section -9.36 -of _the U.S._ Internal _Revenue Code, and its predecessor provisions, grants tax preferences to U.S. firms operating in Puerto Rico designed to encourage reinvestment of prof-its to stimulate economic development in U.S. possessions.37 These tax preferences have at-tracted much industry to the island and have been credited with supporting more than one-third of the total employment in Puerto Rico and nearly one-half of Puerto Rico's nongovernment employment.33 In 1986, budgetary pressure prompted the U.S. Congress to consider repealing section 936. The Commonwealth of Puerto Rico suggested amending the section to allow projects
31 Under section 936, qualified domestic corporations may take a credit equal to the portion of their U.S. tax attributable to taxable income earned by subsidiaries in U.S. possessions, such as in Puerto Rico. In order to be eligible for the tax preferences offered under section 936, at least 75 percent of this income must be derived from the active conduct of business; up to 25 percent may be passive income derived from investments in "eligible" activities. The portion of income earned by a section 936 firm that is generated from eligible investments is known as "qualified possession source investment income" or QPSII. Provisions of Puerto Rico's Tax Incentives Act of 1987 form a local counterpart to the federal tax credit granted to U.S. corporations under section 936. Firms qualifying for treatment under section 936 may receive exemptions, of up to 90 percent, on Puerto Rican income taxes for a period of 10 to 25 years. Earnings repatriated by a section 936 firm to its mainland parent, however, are subject to a Puerto Rico "toll gate tax." Starting at a rate of 10 percent, the toll gate tax declines the longer the funds are retained in Puerto Rico, dropping to 5 percent with a 5-year investment and to zero with a 10-year investment. Department of the Treasury, The Operation and Effect of the Possession Corporation System of Taxation, Sixth Report, March 1989, ch. 2.
These funds have created a unique monetary market in Puerto Rico. To ensure that these funds remain at the lowest possible cost and are channeled into high priority areas traditionally neglected by financial markets, Puerto Rico has enacted various mechanisms to monitor the funds. In March 1988, Regulation 3582 replaced Regula-tion 3087. Regulation 3582 has two principal goals: to foster economic development in Puerto Rico (and now the Caribbean) and to keep interest rates down. In addition, to more equally distribute the funds, the regulation established three mandatory reserve require-ments. The island's financial institutions 'must invest 15 percent of their 936 deposits in the Government Develop-ment Bank for Puerto Rico, 1 to 2 percent in the Economic Development Bank of Puerto Rico, and 7 percent in selected eligible activities. Alexander F. Diaz, "Regulation 3582 gives firms incentives to invest profits locally for longer terms," Caribbean Business, March 30, 1989, p. 522. The combination of manufacturing and investment income earned by 936 firms constitutes what is commonly referred to as '936 funds."
" Robert R. Nathan Associates, Inc., Section 936 and Economic Development in Puerto Rico, August 1987.
in qualified CBERA countries access to the low-cost 936-funds.39 Qualified CBERA countries are those that have signed and ratified Tax Informa-tion Exchange Agreements (TIEAs) with the United States.4°
As of December 31, 1989, the total pool of 936 profits not repatriated to the U.S. mainland was estimated to total $14.6 billion. Most of these funds ($9.58 billion) were deposited in Puerto Rico's private financial institutions, bro-ken down as follows: $6.1 billion in commercial banks, $-2.5 bi11ioñ in irivestinenfThanks--, alid. $1 billion in savings banks.41 The remainder was in-vested directly by section 936 companies. Deposits of 936 funds rose by over $100 million in 1989, however, the ratio of 936 funds to total deposits has declined since 19,87. In 1989, the funds represented nearly 35 percent of total de-posits, compared to 37 percent in 1988 and 40 percent in 1987.42
Section 936 Financing
Section 936 funds are lent at concessionary rates by commercial financial institutions and the Government Development Bank for Puerto Rico (GDB), usually at around 80 perc-ent Of the Lon-don Interbank Offered Rate (LIBOR).43 Both complementary and stand-alone projects in CBERA countries are eligible for section 936 fi-nancing. Commercial financial institutions may provide financing for either type of project, bin the GDB is restricted by its bylaws to financing only complementary projects.44 Although eligible
" Prior to the enactment of the Tax Reform Act of 1986; investment income earned by a section 936 firm could only qualify as QPSII, and thus be eligible as part of a Federal income tax credit, if it was generated from an investment in Puerto Rico. Under the 1986 Act, section 936 was amended to allow income from invest-ments in qualified CBERA- beneficiaries to also be considered as QPSII. The act became effective Jan. 1, 1987. Treasury, Sixth Report.
4° As of February 1990, six cotintries—Barbados, Jamaica, Grenada,. Dominica, the Dominican Repubjic, and Trinidad and Tobago—had ratified TIEAs with the United States and were therefore qualified CBERA countries pursuant to section 936.
41 Alexander F. Diaz, "936 deposits rose but their .. share of total deposits fell in '89,' Caribbean Business, Mar. 15,1990, p. S2.
42 Of the three financial institutions, investment banks were the.biggest loser in 1989, with their 936 funds dropping by nearly $300 million, while commercial banks gained over, $100 million. The largest change in deposits occurred in savings banks, increasing from $658 million to just over $1 billion. Ibid.
43 The banks are able to offer below-market rates on 936 loans because the interest rates 010 they pay on section 936 deposits are lower tharirthose offered in the United States as well as on their other deposits. Even though they receive lower interest payments on deposits, it is more profitable for section 936 firms to retain their profits in banks in Puerto Rico than to repatriate, because of the combined Federal and local tax prefer-ences.
44 Puerto Rico's Caribbean Development Program, A Progress Report to the Ways and Means Committee U.S. House of Representatives. Commonwealth of Puerto Rico Economic Development Administration, Caribbean Development Office, Sep. 15, 1988, p. 11.
I!
1--9
- uor.- nava To- ill-Lai-1y Deflora.-
Puerto Rico, access to 936 funds is limited to those projects that will not adversely affect the economy of Puerto Rico (i.e., no loss of jobs in Puerto Rico) .45
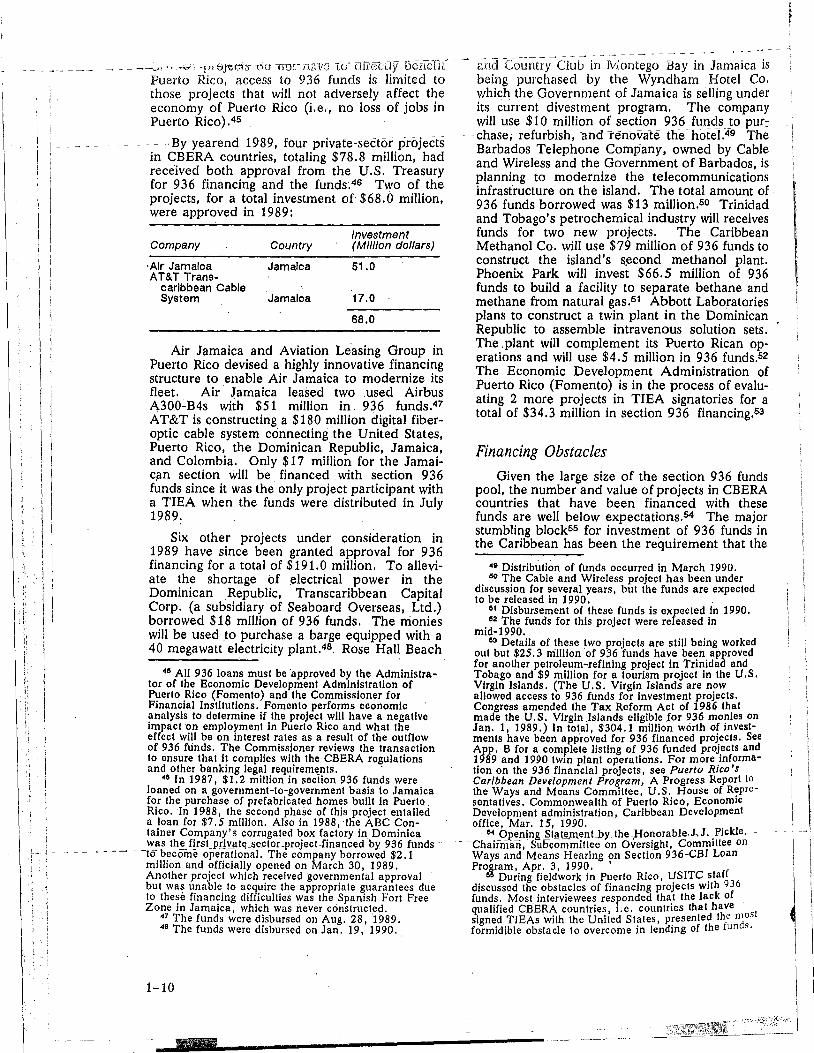
-By yearend 1989, four private--s-edtor ProjeCts in CBERA countries, totaling $78.8 million, had received both approval from the U.S. Treasury for 936 financing and the funds.46 Two of the projects, for a total investment of $68.0 million, were approved in 1989:
Investment Company Country (Million dollars)
,Air Jamaica Jamaica 61.0 AT&T Trans-
carIbbean Cable System Jamaica 17.0
68.0
Air Jamaica and Aviation Leasing Group in Puerto Rico devised a highly ihnovative financing structure to enable Air Jamaica to modernize its fleet. Air Jamaica leased two used Airbus A300-B4s with $51 million in 936 funds.47 AT&T is constructing a $180 million digital fiber-optic cable system connecting the United States, Puerto Rico, the Dominican Republic, Jamaica, and Colombia. Only $17 million for the Jamai-can section will be financed with section 936 funds since it was the only project participant with a TIEA when the funds were distributed in July 1989.
Six other projects under consideration in 1989 have since been granted approval for 936 financing for a total of $191.0 million. To allevi-ate the shortage of electrical power in the Dominican Republic, Transcaribbean Capital Corp. (a subsidiary of Seaboard Overseas, Ltd.) borrowed $18 million of 936 funds. The monies will be used to purchase a barge equipped with a 40 megawatt electricity plant.48 Rose Hall Beach
45 All 936 loans must be approved by the Administra-tor of the Economic Development Administration of Puerto Rico (Fomento) and the Commissioner for Financial Institutions. Fomento performs economic analysis to determine if the project will have a negative impact on employment in Puerto Rico and what the effect will be on interest rates as a result of the outflow of 936 funds. The Commissioner reviews the transaction to ensure that it complies with the CBERA regulations and other banking legal requirements.
46 In 1987, $1.2 million in section 936 funds were loaned on a government-to-government basis to Jamaica for the purchase of prefabricated homes built in Puerto Rico. In 1988, the second phase of this project entailed a loan for $7.5 million. Also in 1988, the ABC Con-tainer Company's corrugated box factory in Dominica was the first private sector_project financed by 936 funds t615ecerme operational. The company borrowed $2.1 million and officially opened on March 30, 1989. Another project which received governmental approval but was unable to acquire the appropriate guarantees due to these financing difficulties was the Spanish Fort Free Zone in Jamaica, which was never constructed.
47 The funds were disbursed on Aug. 28, 1989. 49 The funds were disbursed on Jan. 19, 1990.
1-10
an Country Club in Montego Bay in Jamaica is being purchased by the Wyndham Hotel Co. which the Government of Jamaica is selling under its current divestment program. The company will use $10 million of section 936 funds to pur-chase, refurbish, and -renoVat6 the hote1.46 The Barbados Telephone Company, owned by Cable and Wireless and the Government of Barbados, is planning to modernize the telecommunications infrastructure on the island. The total amount of 936 funds borrowed was $13 million.50 Trinidad and Tobago's petrochemical industry will receives funds for two new projects. The Caribbean Methanol Co. will use $79 million of 936 funds to construct the island's second methanol plant. Phoenix Park will invest $66.5 million of 936 funds to build a facility to separate bethane and methane from natural gas.51 Abbott Laboratories plans to construct a twin plant in the Dominican Republic to assemble intravenous solution sets. The .plant will complement its Puerto Rican op-erations and will use $4.5 million in 936 funds.52 The Economic Development Administration of Puerto Rico (Fomento) is in the process of evalu-ating 2 more projects in TIEA signatories for a total of $34.3 million in section 936 financing.53
Financing Obstacles
Given the large size of the section 936 funds pool, the number and value of projects in CBERA countries that have been financed with these funds are well below expectations.54 The major stumbling block55 for investment of 936 funds in the Caribbean has been the requirement that the
49 Distribution of funds occurred in March 1990. 50 The Cable and Wireless project has been under
discussion for several years, but the funds are expected to be released in 1990.
51 Disbursement of these funds is expected in 1990. 52 The funds for this project were released in
mid-1990. 5° Details of these two projects are still being worked
out but $25.3 million of 936 funds have been approved for another petroleum-refining project in Trinidad and Tobago and $9 million for a tourism project in the U.S. Virgin Islands. (The U.S. Virgin Islands are now allowed access to 936 funds for investment projects. Congress amended the Tax Reform Act of 1986 that made the U.S. Virgin Islands eligible for 936 monies on Jan. 1, 1989.) In total, $304.1 million worth of invest-ments have been approved for 936 financed projects. See App. B for a complete listing of 936 funded projects and 1989 and 1990 twin plant operations. For more informa-tion on the 936 financial projects, see Puerto Rico's Caribbean Development Program, A Progress Report to the Ways and Means Committee, U.S. House of Repre-sentatives. Commonwealth of Puerto Rico, Economic Development administration, Caribbean Development office, Mar. 15, 1990.
54 Opening Statement_by _the Honorable..L.L-Pickle, Chairman, Subcommittee on Oversight, Committee on Ways and Means Hearing on Section 936-CBI Loan Program, Apr. 3, 1990.
55 During fieldwork in Puerto Rico, USITC staff discussed the obstacles of financing projects with 936 funds. Most interviewees responded that the lack of qualified CBERA countries, i.e. countries that have signed TIEAs with the United States, presented the most
formidible obstacle to overcome in lending of the funds.

country sign a TIEA with the United States.56 Up until mid-1989, only four Caribbean countries had TIEAs with the United States: Barbados, Ja-maica, Grenada, and Dominica. In October 1989, the Dominican Republic ratified a TIEA, and Trinidad and Tobago signed a TIEA which was ratified in February 1990. Two other coun-tries have signed TIEAs—Costa Rica and St. Lucia—but as of yearend their respective legisla-tures have not ratified the agreements.57 Interest in TIEAs- seems to nave.increase_d_in these coun-_ tries with ratification expected in the near future.56
Many CBERA countries are reluctant to nego-tiate TIEAs with the U.S. Department of Treasury because of fears that and agreement would force them to change their tax syStem or reveal sensitive income data.59 In some instances the negotiation of a TIEA has become an issue of national sovereignty. The U.S. Treasury con-tends that the reluctance is due to misconceptions on the part of the CBERA beneficiaries and that TIEAs are negotiated agreements that are nar-rowly focused and which take into account each country's individual set of circumstances.69 Be-
Other obstacles to section 936 financing of CBERA projects exist. They include a lack of proposals for economically viable projects in qualified CBERA coun-tries, the high risk associated with investments in CBERA countries, the mismatch of short term 936 deposits with the long term financing needs of CBERA projects, and the uncertainty surrounding the continu-ation of tax preferences under section 936. For information on these obstacles, see USITC, Fourth CBERA Report, 1988, USITC Publication 2225, Septem-ber 1989, pp. 3-11 to 3-13.
57 St. Lucia signed a TIEA on Jan. I, 1987. Costa Rica signed a TIEA on Mar. 15, 1989; a TIEA had been signed by Costa Rica in 1986, but was never ratified. The Dominican Republic signed a TIEA on Aug. 7, 1989.
66 Even some non CBI countries have signed tax agreements with the United States; Mexico in January 1990 and Peru at the Cartagena summit in March 1990. The benefits from the agreements are enhanced tax administration and enforcement. Commonwealth of Puerto Rico, Economic Development Administration (Fomento), Second Progress Report to the Ways and Means Committee, U.S. House of Representatives, Puerto Rico's Caribbean Development Program, Mar. 15, 1990, pp. 2-4.
5° During fieldwork in the Eastern Caribbean, USITC staff discussed the issue of TIEAs with various host government officials. In the two countries visited that have not signed TIEAs (St. Kitts and Nevis, and St. Vincent and the Grenadines), two main reasons were given for hesitancy over entering into a TIEA with the United States. First, concern was expressed that only projects larger than are likely for their countries could benefit from such financing. Hence, little possible economic benefit from section 936 funding was foreseen. Second, it was also stated that approving a TIEA would require repeal of banking secrecy laws that pertain to offshore banking. Various degrees of reluctance to make such a change in order to qualify for section 936 funds were expressed on this subject. Also see, Doreen Hem-lock, "Tax discolsure requirement limits CBI use of 936 funds," Caribbean Business, Sep. 24, 1987.
6° Statement of Kenneth W. Gideon, Assistant Secretary (Tax Policy), Department of the Treasury before the Subcommittee on Oversight, Committee on Ways and Means, U.S. House ofR-epreritatiVeS, Apt. 3, 1990.
sides the requirement for signing a TIEA, another major impediment for lending 936 funds is the lack of guarantees for the loans.61 The banks, which are accountable to shareholders, are reluc-tant to accept the foreign exchange and political risk of loans to the developing countries in the Caribbean region. Therefore, to obtain 936 loans for projects in CBERA countries, commercial and investment banks generally require some form of credit enhancement62 or loan guarantee to ensure the lender that the monies will be repaid. Obtain-
._ _ _ _ ing loan guarantees hit 'present -a -significant- --hurdle for many small and medium-sized inves-tors in the Caribbean.
Another financing obstacle to 936 investments is reported to be the lack of clear-cut guide-lines .33 Without implementing regulations, the Treasury Department had to examine each pro-ject on a case-by-case basis with some reviews taking up to several months. 64 In September 1989, the Treasury Department issued temporary regulations which outlined the requirements for qualified investments in qualified CBERA coun-tries. To ensure that these investment projects generated qualified possession source investment income (QPSII) and thus allow the 936 firms to retain their tax exemption status, the regulations established the requirements needed to satisfy section 936.
For an investment to be a qualified investment under section 936, five requirements must be met.65 First, the investment must be a loan from the 936 funds. Second, the loan must be made by a qualified financial institution. Third, the loan must be made to a qualified recipient for in-vestment in active business assets or a development project in a Caribbean Basin coun-try. Fourth, the investment must be authorized by the Commissioner for Financial Institutions of Puerto Rico. Last, the qualified recipient and the qualified financial institution must comply with certain, certification, agreement, and due dili-
gence requirements. A "qualified financial institution" is an entity that is engaged in a bank-ing, financing, or similar business under the
6' Statement of Terrence Wadsworth on behalf of the Chase Manhattan Bank, N.A., before the Subcommittee on Oversight, Committee on Ways and Means, U.S. House of Representatives, Apr. 3, 1990.
02 Forms of credit enhancement include: (1) letter of credit from a major international commercial bank; (2) a corporate guarantee from an international credit-worthy company; (3) a guarantee from a multilateral organiza-tion; (4) a guarantee from a credit-worthy insurance company; or (5) a guarantee from other private or government owned credit worthy organizations.
63 Testimony of Jose A. Sosa, Commissioner of Financial Constitutions Commonwealth of Puerto Rico, before the Subcommittee on Oversight, Committee on Ways and Means, U.S. House of Representatives, Apr. 3, 1990.
64 Prior to September 1989, the Treasury Department would not approve each project per se, but rather would issue a "no objection" letter.
66 The temporary regulations were published in the Federal Register, vol. 54, No. 183, Sep. 22,1989, pp. 38970-38979.
A t' ',A1,-y- ,:egirimiuns--d-uo-nreers TA re- r,ogroxe- III ST I-tution" criteria under Puerto Rico's Regulation 3582.66 A person, corporation, or partnership that is engaged in a qualified business activity is a "qualified recipient. A loan would qualify as an investment in active business assets if the expen-ditures are for acquisition, construction, rehabilitation, improvement, upgrading, or ex-pansion of assets used in a business activity. Qualified assets include tangible personal prop-erty (such as raw materials, furniture, machinery, or equipment) and rights to intangible property such as patents, inventions, formulas, etc. One stipulation, though, is that the real or personal property was not used in a business activity in the last five years.
During the initial review process, Treasury identified several problems associated with CBI investments. Thus, the temporary regulations ad-dress such issues as refinancing, privatization, and use of financial intermediaries.67
A goal of the CBI program is to promote eco-nomic development in the Caribbean countries by encouraging new investments.68 With the region experiencing debt problems, the 936 funds were regarded by some as a possible source for low-cost loans. For example, when the Air Jamaica project was initially proposed in 1988, the option of refinancing the debt of several aircraft finance leases was explored. Air Jamaica contended that this refinancing would reduce interest costs, thus generating savings that could be used to make a down payment on new aircraft, reduce the air-line's debt, or obtain other equipment.68 The Treasury Department eventually turned down the refinancing project." The temporary regulations reinforce this decision by maintaining that, as a matter of policy, refinancing does not generate any appreciable new assets, and therefore section 936 monies generally may not be used to refi-nance existing facilities.
" An eligible institution under Regulation 3582 is one that has been qualified by the Puerto Rico Commissioner for Financial Institutions.
67 The Subcommittee on Oversight, House Committee on Ways and Means held a hearing on the Section 936 CBI loan program on Apr. 3, 1990. The subcommittee was investigating implementation by the Puerto Rican Government of the so-called 936-CBI loan program. Under discussion was whether the Caribbean countries do have meaningful access to these funds, whether there were better ways for the Government of Puerto Rico to run the program, and whether the section should be changed. At issue was the large amount of deposits (nearly $15 billion) and the small number of projects and monies disbursed. (Up until the end of 1989, there were only four projects that had received $78.8 million. However, with the issuance in September 1989 of temporary regulations and two new qualified countries, the amount of monies approved for disbursal totaled over $300 million by May 1990.)
—66 Sa HotiSe ReTiort NO. 9.8 266, 98th Cong., 1st Sess., pp. 2-3 (1983), Senate Report, No. 98 58, 98th Cong. 1st Sess. pp. 22-25 (1983).
gtatement Of Carlos A. Burns, Vice President BT Securities Corporation, Puerto Rico Branch, Before the Subcommittee on Oversight, Committee on Ways and Means, U.S. House of Representatives, Apr. 3, 1990.
70 Ibid.
- O.ffle co-LtioiPs firtiff iegion-areüñdeöih -
divesture programs to reduce their debt. Another possible use suggested for 936 funds was for privatization projects. Many argued that several international development organizations such as World Bank and USAID_promote privatization as a means for revitalizing the economies of debt-ridden countries.71 Treasury noted that some privatization efforts do require refinancing of ex-isting facilities, but sufficient development benefits are derived from privatization. There-fore, the temporary regulations reserve on the issue pending consultations with Overseas Private Investment Corporation, USAID, and the State Department to determine a more useful definition of appropriate privatization cases .72
To encourage investment, the CBI program attempts to make the lowest cost financing avail-able to the ultimate user of 936 funds. However, some projects have recommended using several financial intermediaries, arguing that a Puerto Ri-can financial institution would not necessarily have knowledge of the local market. Since the Office of the Commissioner for Financial Institu-tions of Puerto Rico only supervises the Puerto Rican financial institutions, no mechanism exists for monitoring interest rate changes by non-Puerto Rican financial institutions. Thus, the Treasury Department saw the inclusion of several intermediaries as raising the cost of the loan." Despite this concern, and recognizing the unique-ness of the Caribbean domestic market, the temporary regulations allow one financial inter-mediary per project.74
Uncertainty over continuation of section 936 has been further heightened by proposed legisla-
71 Testimony of the Honorable Antonio J. Colorado, Secretary of State Commonwealth of Puerto Rico pre-sented before the Subcommittee on oversight, Committee on Ways and Means, U.S. House of Representatives, Apr. 3, 1990.
72 Testimony of Kenneth W. Gideon, Assistant Secretary (Tax Policy), Department of the Treasury., before the Subcommittee on Oversight, Committee on Ways and Means, U.S. House of Representatives, Apr. 3, 1990.
73 Ibid. 74 After the issuance of the temporary regulations,
interested parties were allowed to comment on the regulations. In March 1990, these comments were aired at a hearing held at the Internal Revenue Service. Many of the persons testifying congratulated the Treasury Department for proposing the regulations; however, several complaints were lodged against the temporary rules. For instance, Antonio J. Colorado, Secretary of State of the Commonwealth of Puerto Rico, emphasized several problems with the regulations. He noted that privatization projects should be allowed (the regulations are reserved on this point), more intermediary institu-tions should be permitted (only one is allowed now), and urged more flexibility 4n the definition of qualified - - -- - investments (qualified investments are limited to loans and not equity participation, joint ventures, or stock positions.) Statement of the Honorable Antonio J. Colorado, Secretary of State, Commonwealth of Puerto Rico, Presented at the Internal Revenue Service, Hearing on the proposed and temporary regulations interpreting Section 936 (d) of the Internal Revenue Code, Mar. 19, 1990.
1-12
1-•

tion that would have Puerto Rico hold a referen-dum in 1991 to decide its political status. In April 1989, three senate bills were introduced which would authorize a plebiscite on Puerto Rico's political status.78 Of the three, Senate bill S. 712 was approved by the Senate Energy and Natural Resources Committee and was reported out of committee in August 1989. Three political status options are offered under the bill: state-
hood, enhanced commonwealth, or independence. Puerto Ricans would vote in June 1991 whether to become a state of the United
- States; continue-the -status quo with some-minor modifications, or become an independent na-tion.78 Section 936 would be affected if Puerto Rico were to become a state.77 Under S. 712, if Puerto Rico does join the union, section 936 would only remain in effect until January 1994 then would be phased out over the next five years by reducing the credit by 20 percent annually.
In November 1989, the Senate Finance Com-mittee held hearings on the bill. Some members of the committee were apparently concerned about the many complex economic, cost, and constitutional issues that were not fully addressed in the Energy and Natural Resources Committee's version of S. 712.78 Consequently, another ap-proach was suggested for statehood whereby federal transfer benefits would be gradually phased in (Puerto Ricans only receiye partial benefits now) and Federal tax exemptions would be phased out (including Section 936) over a 5 to 10 year time span." During the hearings, several senators urged the House of Representatives to begin parallel consideration of the political status of Puerto Rico.88
75 The series of bills (S. 710, S. 711, S. 712) were introduced the week of Apr. 3, 1989.
76 Puerto Rico public opinion polls reflect little support for independence. If Puerto Rico became independent, Section 936 would be terminated.
77 The Senate Finance Committee recently asked the Congressional Budget Office to estimate the effects of changing Puerto Rico's political status. According to the CB0 report, if Puerto Rico were to choose statehood, a possible outcome could be a "significant reduction in the growth of the Puerto Rican economy." This predicted downturn in the economy would be triggered by a de-crease in investment, output, and employment in the manufacturing sector since the tax benefits under section 936 would be eliminated with statehood. The CB0 report assumes the island's rapid development as a manufactur-ing economy in the past 40 years is due to the tax advantages U.S. companies have been able to realize there under Section 936. See Congressional Budget Office, Potential Economic Impacts of Changes in Puerto Rico's Status Under S. 7/2, April 1990.
79 Congressional Quarterly Almanac, 1989, pp. 360-361
79 Under the Energy and Natural Resource version of the bill, Federal transfer payment programs would be fully paid at the time of Statehood (fall 1991) while Section 936 would not be completely eliminated until 1998. Maintaining Section 936 while fully paying Federal benefits if Puerto Rico becomes a state has raised some concerns that this duality is unconstitutional.
89 In May 1990, House bill 4765 was introduced. This legislation differs from the Senate bill in one major
Despite these problems, efforts are being made to provide 936 financing to more CBERA projects. One such effort is a newly created pub-lic corporation developed by Fomento called the Caribbean Basin Financing Authority (CARIFA). This independent corporate and political body will provide financing for economic development projects for qualified countries in the Caribbean. As a subsidiary of Fomento, CARIFA will serve as an intermediary and will provide tax exemption to bond issues using 936 funds in the region. Pre-viously, only Puerto Rico's financial institutions, and not 936- cOMpanies, -were—allowed to- make direct investments of 936 funds outside of the is-land. If a 936 company wanted to invest directly, special purpose financial institutions needed to be established. CARIFA eliminates the middlemen financing costs thus facilitating the process of lending 936 funds by reducing the costs associ-ated with the financing of projects in the Caribbean. The authority will also provide guar-antees to eligible CBERA countties.81
Other programs are being considered to pro-vide 936 financing to more CBERA projects. Member companies of the Puerto Rico USA Foundation82 are working toward establishing a Caribbean Basin investment fund. This invest-ment fund is intended to make financing available to small and medium-sized private sector projects that create employment. The USAID is also in the initial stages of creating a mechanism for granting guarantees to private banks in local countries to lend monies to small and medium-sized firms.
Twin Plant Program
Section 936 has also indirectly contributed, by the existence of 936 firms, to an increase in in-vestment in CBERA countries resulting from Puerto Rico's promotion of twin plants, or pro-jects complementary with operations in Puerto Rico. Fomento encourages firms with operations
e°—Continued aspect. Senate bill 712 is "self-executing," which means
• that once Puerto Rico decides on its political status, no further action would be required by Congress. Under H.R. 4765, Puerto Ricans would have four options to choose from: enhanced commonwealth, statehood, independence, and "none of the above." The language of the bill defines these alternatives in nonspecific terms. After the referendum determined the preferred status, Puerto Rico and the United States would enter negotia-tions to determine the specific terms, conditions, and transitional provisions for that status. Implementation of legislation would then be introduced in Congress under the "fast track" mechanism whereby legislative commit-tees would have 180 days to act. Puerto Rico would have to vote to ratify this legislation. After ratification, Puerto Rico would enter its preferred choice in October 1992.
8' Governor Rafael Hernandez Colon signed the bill in January 1990 which created the Caribbean Basin Projects Authority.
82 This organization is a group of mainland manufac-turing companies, financial institutions, and other firms which have operations or interests in Puerto Rico.
- - - - - - - - - - -
1-13
on the island to seek opportunities for splitting production between Puerto Rico and a Caribbean site in a twin plant arrangement. In most in-
-stances, the labor-intensive portion of the operation is moved offshore since Puerto Rico's labor pay scale is considerably higher than those in most of the CBERA countries. Section 936 firms are able to retain their 936 status due to the continuation of their Puerto Rican operations, whereas setting up twin plants enables them to reap the benefit of lower overall costs.
Further, although close to 20 twin plant op-erations were in existence prior to the enactment of the CBERA, the act contains additional incen-tives to encourage U.S. firms to establish complementary projects between Puerto Rico and CBERA countries. Under the CBERA, the value of materials and processing operations added in Puerto Rico may contribute any percentage of the 35-percent value-added requirement for duty-free entry into the U.S. market. CBERA differs from GSP , in that the value-added requirement can be filled in more than one location, including Puerto Rico, and that U.S. content can be counted up to a stated limit of 15 percent.
Since 1985, Fomento has promoted 86 com-plementary projects corresponding to a total investment of approximately $414.2 million.83 Fomento estimates that around 16,200 jobs will have been created in CBERA countries as a result of these investments. Forty-five of these projects have been undertaken by Section 936 firms. A total of fifteen projects, amounting to $75.5 mil-lion in investment funds, were scheduled for startup in 1989. As of June 13, 1990, 24 more projects valued at $224.5 million were scheduled to begin operation in 1990.84 Unlike section 936 financing, twin plants are encouraged in all CBERA countries. The Dominican Republic, which did not have a TIEA until October 1989, is the largest recipient, with 44 projects overall, 13 in 1989. Other recipients include Barbados, Costa Rica, Grenada, Guatemala, Haiti, Jamaica, Panama, St. Kitts and Nevis, and Trinidad and Tobago.
CBI II Legislation Legislation to extend and expand the CBERA,
was introduced by House Ways and Means Trade Subcommittee Chairman Sam Gibbons and co-sponsors in August 1987 (H.R. 3101). This and subsequent legislation to amend the CBERA has become known as "CBI II." 88 Hearings were
As of June 13, 1990. This figure includes projects financed by 936 funds and is included in the investment figures given in the section "Summary of Investment Activities and Trends" earlier in this chapter.
84 See appendix table 'B-2 for a breakdown of 936-fi-nanced projects and twin plant operations.
" The thrust to amend the existing CBERA grew largely out of the recommendations of the Ways and Means Subcommittee on Oversight following its fact finding investigation in 1987 on the impact and effective-ness of the CBERA. As proposed in 1987, CBI II
held in December 1987 and in September and August of 1988, but no further action was taken.88 Chairman Gibbons re-introduced similar legislation to inodify the original bill (H.R. 1233) in March 1989.87 The Trade Subcommittee held markup sessions on H.R. 1233 in April and May 1989, after which the Subcommittee favorably re-ported the bill to the full Ways and Means Committee. In June, the full Committee ap-proved H.R. 1233, which would modify the original legislation as follows:88
• Repeal the statutory termination date of September 30, 1995;
• Reduce existing MFN import duties by 50 percent for footwear (except leather foot-wear), handbags, luggage, flat goods, work gloves, and leather wearing apparel, with no subsequent quotas or limitations;
• Allow articles produced exclusively from U.S.-made parts, components, or prod-ucts to enter the United States free of duty;
• Grant duty-free entry to imports of textile products subject to a statutory access limit89 and granted SO percent duty re-ductions on imports of textiles and apparel articles from the Caribbean sub-ject to certain import quotas;
• Establish a guaranteed minimum access level for sugar imports at levels no less than 1989 aggregate levels;98 and
85—Continued legislation sought to remedy the shortcomings in the original CBERA legislation identified by the oversight committee. Proponents wanted to address their concern that CBERA did not liberalize trade sufficiently, because it excluded important beneficiary country exports from duty-free treatment. Further concern was expressed that some of the intended effects of the program were circum-vented by later measures (e.g., restrictions on citrus and ethanol, decreased sugar quotas, and an antidumping order issued covering certain cut flowers from Costa Rica.) U.S. Congress, House, Subcommittee on Over-sight, Committee on Ways and Means, Report on the Committee Delegation Mission to the Caribbean Basin and Recommendations,to Improve the Effectiveness of the Caribbean Basin Initiative, 100th Cong., 1st sess., May 6, 1987.
For further background on debate regarding reform of CBERA, and for details of the provisions of H.R. 3101, see ch. 3 of the USITC, Third CBERA Report, 1987, p. 3-7.
07 Identical legislation was introduced in the Senate by Senator Bob Graham of Florida in August 1987 (S. 1594) in the 100th Congress and as S. 504 in the 101st Congress in 1989.
88 CBI Business Bulletin, U.S. Department of Cora-
-merce,-volV1;- 5,- Jilife 1989, pp. 2-3.-
89 Guaranteed Access Levels (GALs) were established under the Special Access Program announced by the Reagan Administration in 1986, known as "807-A," or
"Super 807." This program, not formally part of CBERA, would become a statutory program under CBI II
legislation. Further details on the program and trade data
showing that super 807 has spurred significantly in-creased imports from CBERA beneficiary countries are
contained in ch. 2 of this report. 9° To address administration concerns regarding the
consistency of this provision under the General Agree-
1-14

0 Relax import rules for ethanol products made with foreign feedstocks.91
In July 1989, House Ways and Means Chair-man Rostenkowski attached the CBI II legislation to the Budget Reconciliation bill (H.R. 3299). In October, the House approved a less comprehen-sive version of the CBI II bill whereby several provisions were deleted. In particular, all lan-guage pertaining to textile and apparel products was eliminated. Thus, the language that reduced duties by 50 percent on textiles and apparel, lan-guage that allowed preferential treatment for rubber footwear, and the provision to remove the tariff § -cIdthing iskinbred from U . S . -made cloth in the Caribbean were all stricken from the bill.
In December, when H. R. 3299 went to con-ference, the Senate version of the budget bill did not contain any CBI provisions; and the House agreed therefore to delete all references to CBI. The House apparently acquiesced to this compro-mise if the Senate Finance Committee would report a new Caribbean trade bill "as a matter of legislative priority" in the new year and make "every best effort" to pass it by March 31, 1990.92
Administration efforts to rejuvenate the ex-pansion of CBI commenced in late 1989 with President Bush calling upon Congress to pass CBI II legislation. hi a November 17, 1989, memo-randum, the President urged the "Congress to act
°°—Continued ment on Tariffs and Trade (GATT), the bill authorized the President to enter into agreements to grant appropri-ate compensation if actions under the provision are found to be inconsistent with U.S. international obligations. International Trade Reporter, June 21, 1989, p. 803, vol. 6. In a related matter, in 1988, Australia requested a GATT dispute panel to examine U.S. restrictions on sugar imports. In June 1989, the panel report ruled that the U.S. sugar quota program was inconsistent with GATT art. XI's prohibition of quantitative restrictions and with art. II's schedule of concessions. The panel recommended that the contracting parties request the United States to either eliminate these restrictions or bring them into conformity with the General Agreement. The GATT Council adopted the report in June 1989.
8' In the past, Caribbean producers of ethanol used wine alcohol purchased from the European Community at below-cost prices, fermented the alcohol, and shipped it to the United States duty-free under CBERA. The amended bill allows Caribbean producer's of ethanol to annually ship up to 60 million gallons of ethanol made with EC feedstocks to the United States CBERA duty-free. The issue of how much Caribbean raw material was needed in the final product to qualify for duty-free treatment reportedly slowed the progress of the bill in Congress. In November 1989, an amendment to the steel quota law; the Steel Liberalization Act (H.R. 3275), allowed Caribbean plants and their wine based ethanol 7 percent of the U.S. ethanol market (or 60 million gallons annually) if as much as 35 percent of the product's value had been added in the Caribbean. The threshold for the next 35 million gallons was 30 percent, for more it was 50 percent. This arrangement ends Dec. 31, 1991. The amendment set the standards for duly-free ethanol from the Caribbean. Congressional Quarterly Almanac, Vol. 45, 1st Session, 1989, p. 32.
92 Congressional Quarterly Almanac, Vol. 45, 1st Session, 1989, p. 32,
quickly to pass balanced legislation to extend and expand the CBI program in a way that is consis-tent with U.S. obligations under the General Agreement on Tariffs and Trade (GATT)."93
Senate bill S. 504, the companion legislation to H.R. 1233, was approved by the Senate Fi-nance Committee in March 1990.94 Several amendments, which had been considered to be controversial, were not attached to the bill, in-cluding guaranteed sugar quotas and increased market access for textiles, leather goods, and pe-troleum. Finance Committee Chairman Lloyd Bentsen argued that it was_better to pass_ a narrow _ bill than to see a more ambitious version de-feated.95 Below is Chairman Bentsen's proposal on CBI II:95
• Repeal of termination date.—Repeals the September 30, 1995 termination date of duty-free treatment under the CBI, thus making the program permanent.
• Treatment of articles assembled from U.S. components.—Grants duty-free treatment to articles assembled or proc-essed in a beneficiary country wholly of U.S.-produced contents or ingredients, except water. This provision does not ap-ply to any product excluded from duty-free treatment under CBI.
• Conforming GSP amendment.—Conforms the rule of origin for the Generalized Sys-tem of Preference (GSP) to the rule of origin under CBI by requiring that GSP-
• eligible articles either be wholly the product of a beneficiary country or be substantially transformed in a beneficiary country.
• Country eligibility and worker rights.—Prohibits the President from designating any country as a CBI beneficiary if that country has not or is not taking steps to
• afford internationally recognized worker rights to workers in the country, as de-fined in the GSP statute. The President may waive this requirement for U.S. eco-nomic or national security reasons.
• Pilot preclearance program.—Requires the Commissioner of Customs, in fiscal years 1991 and 1992, to establish a pilot program in an appropriate Caribbean country for testing the extent to which having customs preclearance operations can enhance the development of tourism in the region.
93 Memorandum, President Bush, Nov. 17, 1989. 94 The Senate approved S. 504 in April 1990. The
House and Senate conferees began work on S. 504 and H.R. 1233 in May 1990.
95 Congressional Quarterly Weekly Report, vol. 48, No. 16, Apr. 21, 1990, p. 1182.
95 Caribbean Business Bulletin, U.S. Department of Commerce, vol. VII, No. 3, April 1990, p. 8.
1-15

• Scholarship assistance.—Requires the Agency for International Development to establish and administer a program of scholarship_ assistance for students from beneficiary countries to study in the United States.
• Promotion of tourism.—Declares that in-creased tourism should be a central part 'of the CBI program and directs the Sec-retary of Commerce to complete a study of Caribbean tourism development strate-gies that was begun in 1986, including information on mutual benefits to the United States and the Caribbean and proposals for developing increased link-ages between the tourism industry and other local industries.
• Increase of duty-free allowance for tour-ists returning from the Caribbean.—Increases the duty-free allowance for tourists returning from the Caribbean from $400 to $600 (the allowance for tourists to U.S. insular possessions would be increased from $800 to $1,200) and increases the duty-free alcoholic beverage allowances by one liter for CBI-produced alcoholic beverages.
• Belize and Eastern Caribbean region.—States the sense of the Congress that spe-cial efforts should be undertaken to improve the ability of Belize and Organi-zation of Eastern Caribbean States countries to benefit from the CBERA,
• Presidential reports. —Requires the Presi-dent to issue a complete report on the operation of the CBI program by October 1, 1993, and every three years thereafter.
• Agriculture infrastructure support.—
• States the sense of the Congress that, in order to facilitate trade with, and the eco-nomic development of, the CBI countries, the Secretary of Agriculture should coordinate with AID the develop-ment of programs to encourage improve-ments in the transportation and cargo and handling infrastructure in CBI coun-tries to improve agricultural trade.
The Senate approved S. 504 in April 1990. Thereafter, the House and Senate conferees be-gan work on the Customs and Trade Act of 1990 (H.R. 1594), a compendium of pending trade matters which included CBI II legislation. The two major differences between the Senate and House versions concerned treatment of leather glove, _and sugar imports. The House -bill pro- - vided for preferential treatment of leather gloves, which were exempted from duty-free treatment under the original CBI bill, while the Senate bill did not change the status of leather gloves. Meanwhile, the Senate bill had no sugar provision while the House version set a minimum quota for Caribbean sugar—a guaranteed market share even if future U.S. global sugar quotas were covered.
1-16
In June 1990, the House and Senate Confer-ence continued debate on the Customs and Trade Act of 1990 (H.R. 1594). Two issues apparently blocked agreement on H.R.-1594: ethanol -in-IL ports, and a tax break for companies investing in Puerto Rico (an item previously not covered in either House or Senate bill).97 On ethanol, the House had lowered the 1986 requirement that offshore refineries use at least 75 percent Carib-bean feedstocks to escape a 60-cents-per-gallon duty in the 1989 Steel Liberalization Act." Many Senate conferees were not satisfied with the ethanol deal and offered several other proposals. No agreement was reached prior to the adjourn-ment of the conference.
The lack of investment of section 936 funds" prompted Rep. J.J. "Jake" Pickle, Chairman of the Subcommittee on Oversight, House Ways and Means Committee, to introduce an amendment that would make investment of $100 million for local Caribbean development mandatory by stat-ute.loo The Senate conferees objected to the amendment since no Senate hearings had been held in the matter and that it might interfere with Puerto Rico's impending referendum on its politi-cal status.101
In late July, the Senate and House conferees were able to break the deadlock on ethanol and the Pickle amendment.102 Under existing provi-sions, the domestic ethanol industry benefits from two tax breaks—a tax credit for blenders of gaso-hol (gasoline and ethanol) and a partial exemption from the motor fuel excise tax for sell-ers of gasohol, who collect 3 cents instead of 9 cents in taxes per gallon. The blenders credit ex-pires December 31, 1992 and the excise exemption expires September 30, 1993. The compromise reached in conference entailed ex-tending the 1989 House arrangement to December 31, 1992, the same expiration date of the blenders credit in effect; by matching the ex-piration date of the two provisions the conferees linked their fates.103
In Congressional Quarterly Weekly Report, June 23, 1990, p. 1946.
" In addition, the House version wanted to make this arrangement permanent.
" For a discussion of section 936 of the Internal Revenue Code, see p. 1-9.
1°° In 1986, the Section 936 was amended to allow projects in qualified CBERA countries with access to the low cost 936 funds. A memorandum of understanding from Fomento promised $100 million of investment in the qualified CBERA countries. The so called Pickle
_ _qmendment made-this promise mandatory.-Congressional Quarterly Weekly Report, June 23, 1990, p. 1946.
Both the Senate and House are considering legisla-tion that would allow Puerto Rico to vote on its preferred political status—independence, statehood, or enhanced commonwealth. Ibid. See the section "Section 936 of the
Internal Revenue Code," earlier in this chapter for more
information. 102 Rep. Pickle agreed to pursue the matter at a later
time. Congressional Quarterly Weekly Report, July 28,
1990, p. 2388. 1°3 Ibid.
Before Congress recessed in August, the Cus-toms and Trade Act of 1990 was passed and sent to President Bush for his signature.104 The CBI II section of the act contained the Bentsen propos-als (except for the conforming GSP amendirient) plus several new sections. These additional Sec-tions are summarized below:
6 Rules of origin study—Instructs the USITC to undertake an investigation to assess whether revised rules of origin for CBERA country products are- appropri-ate. If the Commission finds that revised rules are necessary, it is to develop rec-ommended revised rules. The report is due to Congress 9 months after the enact-ment of the bill.
• Cumulation of beneficiary products for countervailing and antidumping determi-nations—Exempts CBERA beneficiary countries from worldwide cumulation in application of injury tests in antidumping and countervailing duty cases.105 A sepa-rate cumulation of imports from CBERA countries as a group would be established
1" The act was signed into law by President stub on Aug. 20, 1990.
°5 In general, the USITC cumulatively assesses the volume and effect of imports from two or more cnuntries of like products subject to investigation if such imports compete with each other and with like products or the U.S. domestic industry.
in making injury determinations where a CBERA beneficiary is the subject of a pe-tition.
• Requirement for investment of section 936 funds in Caribbean Basin Coun-tries—Requires the Government of Puerto Rico to take the necessary steps to ensure that at least $100 million of qualified Car-ibbean Basin country investments are made of section 936 funds during each calendar year after 1989.
• Trade benefits for Nkaragua—Designates Nicaragua as a beneficiary country under CBERA for 1990.
• Extension of trade benefits to the Andean Region—Expressed the sense of the Con-gress to extend the benefits provided under CBERA to the Andean Region to help revitalize the national economies of the Andes and further the U.S. anti-nar-cotics policy in the region.
• Treatment of articles grown, produced, or manufactured in Puerto Rico—Pro-vides duty-free treatment to an article which is the growth, product, or manu-facture of the commonwealth of Puerto Rico if the product is imported directly from the beneficiary country.
• Ethyl Alcohol—Amends the 1989 Steel Liberalization Act effective date to De-cember 31, 1992.
1-17
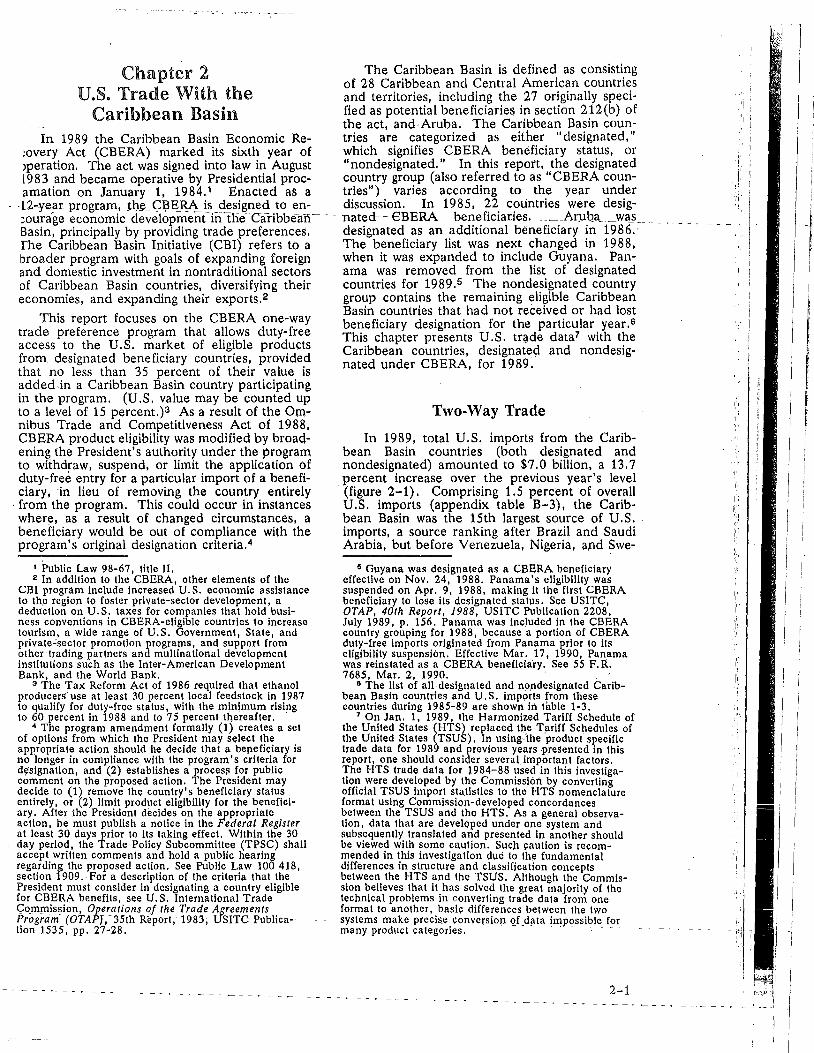
Chapter 2 U.S. Trade With the
Caribbean Basin In 1989 the Caribbean Basin Economic Re-
:overy Act (CBERA) marked its sixth year of )peration. The act was signed into law in August 1983 and became operative by Presidential proc-amation on January 1, 1984.1 Enacted as a 12-year program, Ihe CBERA is designed to en-:ourage economic development in the Caribbeari— - Basin, principally by providing trade preferences. The Caribbean Basin Initiative (CBI) refers to a broader program with goals of expanding foreign and domestic investment in nontraditional sectors of Caribbean Basin countries, diversifying their economies, and expanding their exports.2
This report focuses on the CBERA one-way trade preference program that allows duty-free access to the U.S. market of eligible products from designated beneficiary countries, provided that no less than 35 percent of their value is added in a Caribbean Basin country participating in the program. (U.S. value may be counted up to a level of 15 percent.)3 As a result of the Om-nibus Trade and Competitiveness Act of 1988, CBERA product eligibility was modified by broad-ening the President's authority under the program to withdraw, suspend, or limit the application of duty-free entry for a particular import of a benefi-ciary, in lieu of removing the country entirely from the program. This could occur in instances where, as a result of changed circumstances, a beneficiary would be out of compliance with the program's original designation criteria.4
Public Law 98-67, title II. 2 In addition to the CBERA, other elements of the
CBI program include increased U.S. economic assistance to the region to foster private-sector development, a deduction on U.S. taxes for companies that hold busi-ness conventions in CBERA-eligible countries to increase tourism, a wide range of U.S. Government, State, and private-sector promotion programs, and support from other trading partners and multinational development institutions such as the Inter-American Development Bank, and the World Bank.
3 The Tax Reform Act of 1986 required that ethanol producers use at least 30 percent local feedstock in 1987 to qualify for duty-free status, with the minimum rising to 60 percent in 1988 and to 75 percent thereafter.
4 The program amendment formally (1) creates a set of options from which the President may select the appropriate action should he decide that a beneficiary is no longer in compliance with the program's criteria for designation, and (2) establishes a process for public comment on the proposed action. The President may decide to (I) remove the country's beneficiary status entirely, or (2) limit product eligibility for the benefici-ary. After the President decides on the appropriate action, he must publish a notice in the Federal Register at least 30 days prior to its taking effect. Within the 30 day period, the Trade Policy Subcommittee (TPSC) shall accept written comments and hold a public hearing regarding the proposed action. See Public Law 100 418, section 1909. For a description of the criteria that the President must consider in designating a country eligible for CBERA benefits, see U.S. International Trade commission, Operations of the Trade Agreements Program (OTAP),- 35th Report, 1983; USITC- Publica-tion 1535, pp. 27-28.
The Caribbean Basin is defined as consisting of 28 Caribbean and Central American countries and territories, including the 27 originally speci-fied as potential beneficiaries in section 212(b) of the act, and Aruba. The Caribbean Basin coun-tries are categorized as either "designated," which signifies CBERA beneficiary status, or "nondesignated." In this report, the designated country group (also referred to as "CBERA coun-tries") varies according to the year under discussion. In 1985, 22 countries were desig-
nated- - CBERA - -beneficiaries. Aruba _was designated as an additional beneficiary in 1986. The beneficiary list was next changed in 1988, when it was expanded to include Guyana. Pan-ama was removed from the list of designated countries for 1989.5 The nondesignated country group contains the remaining eligible Caribbean Basin countries that had not received or had lost beneficiary designation for the particular year.6 This chapter presents U.S. trade date with the Caribbean countries, designated and nondesig-nated under CBERA, for 1989.
Two-Way Trade
In 1989, total U.S. imports from the Carib-bean Basin countries (both designated and nondesignated) amounted to $7.0 billion, a 13.7 percent increase over the previous year's level (figure 2-1). Comprising 1.5 percent of overall U.S. imports (appendix table B-3), the Carib-bean Basin was the 15th largest source of U.S. imports, a source ranking after Brazil and Saudi Arabia, but before Venezuela, Nigeria, and Swe-
Guyana was designated as a CBERA beneficiary effective on Nov. 24, 1988. Panama's eligibility was suspended on Apr. 9, 1988, making it the first CBERA beneficiary to lose its designated status. See USITC, OTAP, 40th Report, 1988, USITC Publication 2208, July 1989, p. 156. Panama was included in the CBERA country grouping for 1988, because a portion of CBERA duty-free imports originated from Panama prior to its eligibility suspension. Effective Mar. 17, 1990, Panama was reinstated as a CBERA beneficiary. See 55 F.R. 7685, Mar. 2, 1990.
The list of all designated and nondesignated Carib-bean Basin countries and U.S. imports from these countries during 1985-89 are shown in fable 1-3.
7 On Jan. 1, 1989, the Harmonized Tariff Schedule of the United States (HTS) replaced the Tariff Schedules of the United States (TSUS), In using 'the product specific trade data for 1989 and previous years presented in this report, one should consider several important factors. The HTS trade data for 1984-88 used in this investiga-tion were developed by the Commission by converting official TSUS import statistics to the HTS nomenclature format using Commission-developed concordances between the TSUS and the HTS. As a general observa-tion, data that are developed under one system and subsequently translated and presented in another should be viewed with some caution. Such caution is recom-mended in this investigation due to the fundamental differences in structure and classification concepts between the HTS and the TSUS. Although the Commis-sion believes that it has solved the great majority of the technical problems in converting trade data from one format to another, basic differences between the two systems make precise conversion of data impossible for many product categories.
2-1
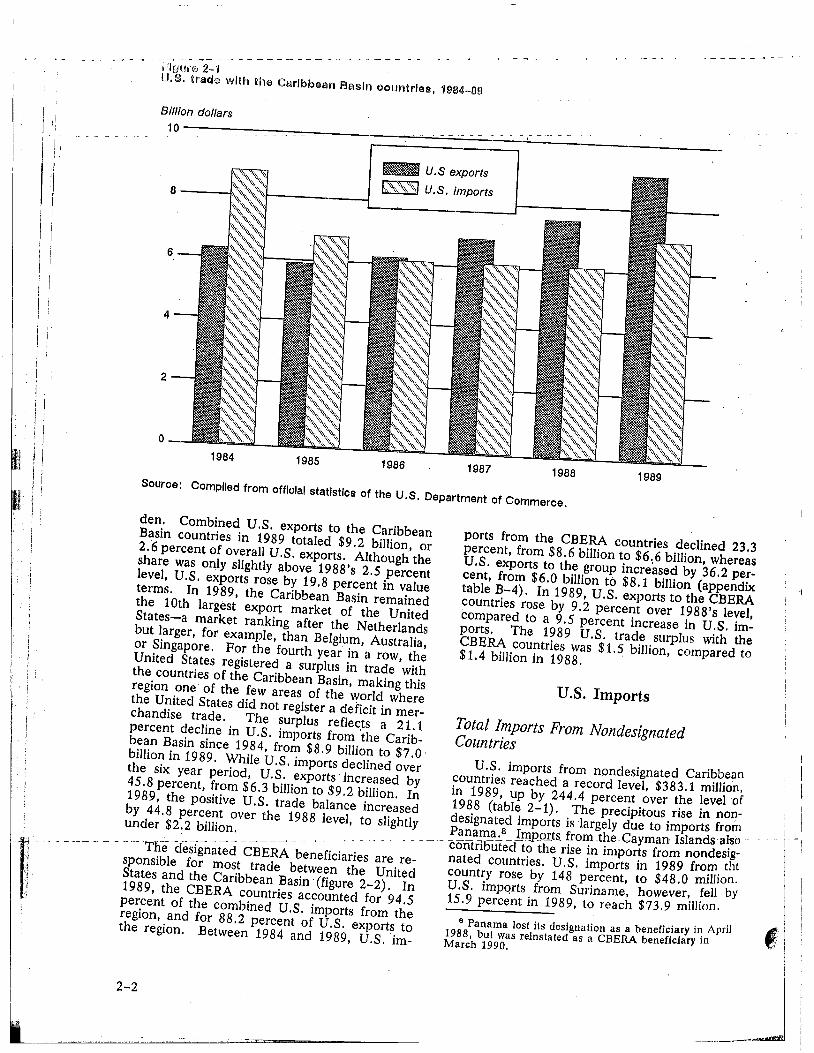
Homo 2-4 U.S. trade with the Caribbean Basin countries, 1984-89
Billion dollars
- - - -
U.S exports U.S. Imports
1984 1987
Source: Compiled from official statistics of the U.S. Department of Commerce.
den. Combined U.S. exports to the Caribbean Basin countries in 1989 totaled $9.2 billion, or 2.6 percent of overall U.S. exports. Although the share was only slightly above 1988's 2.5 percent level, U.S. exports rose by 19.8 percent in value terms. In 1989, the Caribbean Basin remained the 10th largest export market of the United States-_a market ranking after the Netherlands but larger, for example, than Belgium, Australia, or Singapore. For the fourth year in a row, the United States registered a surplus in trade with the countries of the Caribbean Basin, making this region one of the few areas of the world where the United States did not register a deficit in mer-
chandise trade. The surplus reflects a 21.1 percent decline in U.S. imports from the Carib-bean Basin since 1984, from $8.9 billion to $7.0 billion in 1989. While U.S. imports declined over the six year period, U.S. exports increased by 45.8 percent, from $6.3 billion to $9.2 billion. In 1989, the positive U.S. trade balance increased by 44.8 percent over the 1988 level, to slightly under $2.2 billion.
Th-e designated CBERA beneficiaries are re-sponsible for most trade between the United States and the Caribbean Basin (figure 2-2). In 1989, the CBERA countries accounted for 94.5 percent of the combined U.S. imports from the region, and for 88.2 percent of U.S. exports to the region. Between 1984 and 1989, U.S. im-
2-2
IL
1985 1986 1988 1989
ports from the CBERA countries declined 23.3 percent, from $8.6 billion to $6,6 billion, whereas U.S. exports to the group increased by 36.2 per-cent, from $6.0 billion to $8.1 billion (appendix table B-4). In 1989, U.S. exports to the CBERA countries rose by 9.2 percent over 1988's level, compared to a 9.5 percent increase in U.S. im-ports. The 1989 U.S. trade surplus with the CBERA countries was $1.5 billion, compared to $1.4 billion in 1988.
U.S. Imports
Total Imports From Nondesignated Countries
U.S. imports from nondesignated Caribbean countries reached a record level, $383.1 million, in 1989, up by 244.4 percent over the level of 1988 (table 2-1). The precipitous rise in non-designated imports is largely due to imports from Panama.8 Im_ports, from_the-Cayman- Islands also cdritributed to the rise in imports from nondesig-nated countries. U.S. imports in 1989 from tht country rose by 148 percent, to $48.0 million. U.S. imports from Suriname, however, fell by 15.9 percent in 1989, to reach $73.9 million. $ Panama lost its designation as a beneficiary in April 1988, but was reinstated as a CBERA beneficiary in March 1990.

1987 1986 1985 1984 1988 1989
Figure 2-2 U.S. trade with the countries designated under CBERA, 1984-89
Billion dollars
Source: Compiled from official statistics of the U.S. Department of Commerce.
Total Imports From Designated CBERA Countries
As shown in table 2-1, after declining in each
of the previous 3 years, U.S. imports from the Caribbean Basin grew by 13.7 percent in 1989 to total $7.0 billion, up from $6.2 billion in 1988. Imports from countries designated as beneficiar-ies under the CBERA increased by $576.4 million, accounting for most of the $848.3 million total increase in the value of im-
ports from the region. Almost all U.S. imports from the Caribbean Basin originate from desig-nated CBERA beneficiaries. However, the share of imports from designated CBERA countries dropped from 98.2 percent in 1988 to 94.5 per-cent in 1989. The decline in the 1989 CBERA share was a result of Panama's removal from the group of beneficiary countries. Nonetheless, im-ports from the CBERA beneficiaries grew by 9.5 percent in 1989 to total $6.6 billion, up from $6.1 billion a year earlier.
'The composition of U.S. imports from the CBERA beneficiaries also continued to change last. year with strong growth exhibited in textiles, apparel, and chemical imports. In 1989, textile and apparel imports increased by 17.3 percent on a customs value basis, to account for 26.1 percent of all U.S. imports from the CBERA countries, up from 24.4 percent in
1988.9 The value of textile and apparel imports from these countries has more than doubled since 1985. (Notably, textiles and apparel are not eligi-ble for duty-free entry under the CBERA.) Chemical imports from CBERA beneficiaries in-creased sharply (by 88.4 percent) in 1989 to account for 8.3 percent of total imports, up from
4.9 percent the previous year.19
Imports of animal and vegetable products
from the CBERA beneficiaries, consisting primar-ily of fruit, coffee, shellfish, and meat, continued to decline (by $29.3 million) in 1989, largely re-flecting Panama's loss of beneficiary status. These imports accounted for 21.3 percent of
U.S. imports from the CBERA beneficiaries in
1989 compared with 23.8 percent a year earlier
and 27.3 percent in 1987.11 Although imports of
mineral products, consisting largely of petroleum
and petroleum products, from the CBERA coun-
tries rose slightly in 1989, as a share of total imports from the group, they declined from
20.1 percent in 1988 to 18.4 percent in 1989.12
° Based on trade figures for ch. 50-63 of the FITS.
'° Based on trade figures for ch. 28-38 of the HTS.
" Based on trade figures for chapters 1-14 of the
HTS. 12 Based on trade figures for chapters 25-27 of the
HTS. Between 1983 and 1986, a 72 percent drop in the
value of crude oil and petroleum product imports pushed
total U.S. imports from the region sharply downward before leveling off in 1987. After dropping by 23.1
•
2-3

Table 2-1 U.S. Imports for consumption, from designated and nondesignated countries under the CBERA, 1985-89
($1,000, customs-value basis)
Country_ 1985 - - 1986 --- -- ---- 1987 - - 1988 - - 1989
Designated:
Antigua 24,695 11,849 8,621 6,893 12,274 .Aruba' (3) 1,797 2,452 647 1,156 Bahamas 626,084 440,985 377,881 268,328 460,723 Barbados 202,194 108,991 59,110 • 51,413 38,725 Belize 46,951 50,181 42,906 52,049 43,056 British Virgin Islands 11,902 5,904 11,162 684 1,112 Costa Rica 489,294 646,508 670,953 777,797 967,901 Dominica 14,161 15,185 10,307 8,530 7,664 Dominican Republic 965,847 1,058 ,927 1,144,211 1,425,371 1,636,931 El Salvador 395,658 371,761 272,881 282,584 243,922 Grenada 1,309 2,987 3,632 7,349 7,862 Guatemala 399,617 614,708 487,308 436,979 608,280 Guyana2 • (3) (3) (3) 50,432 55,858 Haiti 386,697 368,369 393,660 382,466 371,875 Honduras 370,219 430,906 483,096 439,504 456,790 Jamaica 267,016 .297,891 393,912 440,934 526,726 Montserrat 3,620 3,472 2,413 2,393 2,285 Netherlands Antilles° 793,162 453,333 478,836 408,100 374,358 Panama a 393,605 352,206 342,700 256,046 (3) St. Kitts and Nevls 16,258 22,278 23,793 20,822 21,447 St. Lucia 13,796 12,269 17,866 26,044 23,985 St. Vincent and the
Grenadines 9,643 7,836 8,493 13,950 9,244 Trinidad and Tobago 1,255,498 786,405 802,838 701,738 '765,265
Total 6,687,226 6,064,745 6,039,030 6,061,054 6,637,440
Nondesignated:
Anguilla (3) 89 168 497 348 Cayman Islands 10,950 14,611 27,670 18,195 48,041 Guyana2 46,010 62,928 58,-828 (3) . (3) Nicaragua 41,003 1,071 1,231 1,121 31 Panama5 (3) (3) ( 3) (3) 258,319 Suriname 60,091 38,591 46,445 87,894 73,892 Turks and Caicos Islands 4,649 4,792 4,680 3,517 2,507
Total 162,703 - 122,081 139,022 111,224 383,137
Grand total 6,849,928 6,186,826 6,178,052 6,172,278 7,020,577
'Upon becoming independent of the Netherlands Antilles In April 1986, Aruba was designated separately as 'a beneficiary effective retroactively to Jan. 1, 1986. Trade data for Aruba, however, were not reported separately until June 1986. The 1986 figure for Aruba represents trade for June-December only.
2 Guyana was designated as a CBERA beneficiary effective Nov. 24, 1988. 3 Not applicable. 4 See footnote 1. 6 Panama lost its designation as a beneficiary effective Apr. 9, 1988. Data for Anguilla, which has not been designated as a beneficiary country, were Included with the data for
St. Kitts and Nevis through 1985. For 1986-89, data for Anguilla are shown separately among the nondesIgnated countries. Note.-Because of rounding, figures may not add to totals shown.
Source: Complied from official statistics of the U.S. Department of Commerce.
2-4

Imports of petroleum and petroleum products are not eligible for duty-free entry under the CBERA.
After declining 9.4 percent between 1985 and 1988, U.S. imports from CBERA beneficiaries in
I2-Continued percent in 1988, the value of crude oil and refinery product imports from the CBERA beneficiaries stabilized, dropping by only 1.3 percent in 1989.
creased 9.5 percent in 1989, to $6.6 billion. The overall increase in 1989 can be traced to several geographic regions (table 2-2), and is partly the result of a 16.2 percent increase in imports from oil-producing countries. In 1985, oil-producing countries accounted for a 40.0 percent share of total imports from CBERA countries, and in 1989 accounted for a 24.1 percent share. The decline was primarily the result of falling oil prices which
Table 2-2
U.S. Imports for consumption from countries designated under the CBERA, by major groups, 1985-89
- ($1;000-, -customs value)- - - _
Area or Country 1985 1986 1987 1988 1989
Non-oil-producing countries; Central America:
Belize 46,951 50,181 42,906 52,049 43,056 Costa Rica 489,294 646,508 670,953 777,797 967,901 El Salvador 395,658 371,761 272,881 282,584 243,922 Guatemala 399,617 614,708 487,308 436,979 608,280 Honduras 370,219 • 430,906 483,096 439,504 456,790 Panama, 393,605 352,206 342,700 256,046 (5)
Subtotal 2,095,344 2,466,270 2,299,843 2,244,959 2,319,949
Eastern Caribbean:
Antigua 24,695 11,849 8,621 6,893 12,274 Barbados 202,194 108,991 59,110 51,413 38,725 British Virgin Islands 11,902 5,904 11,162 684 1,112 Dominica 14,161 15,185 10,307 8,530 7,664 Grenada 1,309 2,987 3,632 7,349 7,862 Guyana2 (6) (6) (8) 50,432 55,858 Montserrat 3,620 3,472 2,413 2,393 2,285 St. Kitts and Nevis3 16,258 22,278 23,793 20,822 21,447 St. Lucia 13,796 12,269 17,866 26,044 23,985 St. Vincent and the
Grenadines 9,643 7,836 8,493 13,950 9,244
Subtotal 297,578 190,771 145,397 188,510 180,457
Central Caribbean:
Dominican Republic 965,847 1,058,927 1,144,211 1,425,371 1,636,931 Haiti 386,697 , 368,369 393,660 382,466 371,875 Jamaica 267,016 297,891 , 393,912 440,934 526,726
Subtotal 1,619,560 1,725,186 1,931,783 2,248,771 2,535,532
Total non-oil-
producing countries 4,012,482 4,382,227 4,377,024 4,682,240 5,035,938
Oil-producing countries:
Aruba4 (6) 1,797 2,452 647 1,156 The Bahamas 626,084 440,985 377,881 268,328 460,723 Netherlands Antilles* 793,162 453,333 478,836 408,100 374,358 Trinidad and Tobago 1,255,498 786,405 802,838 701,738 765,265
Total oil-
producing countries 2,674,744 1,682,519 1,662,006 1,378,813 1,601,501
Grand total 6,687,226 6,064,745 6,039,030 6,061,054 6,637,440
1 Panama lost its designated beneficiary status effective Apr. 9, 1988. 2 Guyana was designated as .a beneficiary effective Nov. 24, 1988, 3 Data for St. Kitts and Nevis include Anguilla for 1985. For 1986-89, data for Anguilla have been excluded. 4 Upon becoming Independent of the Netherlands Antilles in April 1986, Aruba was designated separately as a
beneficiary effective retroactively to Jan. 1, 1986. Trade data for Aruba, however, were not reported separately until June 1986. The 1986 figure for Aruba represents trade for June-December only.
5 Not applicable. Note.-Because of rounding, figures may not add to totals shown.
Source: Compiled from official statistics of the U.S. Department of Commerce,
2-5
-- 4
• lj

caused a dramatic decrease in the value of im-ports from oil-producing CBERA countries during 1985-88.13 Rebounding from a 4-year low in 1988,- itn-ports- frorri these countries in 1989 were 40.0 percent below 1985's dollar figure. Total imports from non-oil-producing countries, on the other hand, increased by 25.5 percent between 1985 and 1989. In 1989, U.S. imports from these CBERA beneficiaries amounted to $5.0 bil-lion, up from $4.7 billion in 1987.
In 1989, U.S. imports from the Central American country group grew modestly, by 3.3 percent from 1988 to 1989, and by 10.7 percent overall since 1985. The more modest 1989 growth largely reflects Panama's temporary loss of beneficiary status from April 1988 to March 1990. The Central American share of CBERA imports increased from 31.3 percent in 1985 to 35.0 percent in 1989. Although the country group figures were fairly steady over the 5 year period, several 'Central American countries have experienced sharp fluctuations in U.S. imports. Costa Rica is the only Central American country that sustained a five year increase in exports to the United States. In 1989, Costa Rica's exports to the United States rose by 24.4 percent over 1988 levels, to $967.9 million, marking a 97.8 percent increase over 1985's level. U.S. imports from Guatemala increased in 1989 by 39.2 per-cent over 1988, to mark a 52.2 percent rise over the 1985 level. The 1989 level was still slightly lower than the 1986 level. There were, however, substantial declines in 1989 U.S. imports from Belize (down 17.3 percent) and El Salvador (down 13.7 percent). U.S. imports from El Sal-vador have decreased by 38.3 percent since 1985, the year in which the country recorded it highest annual level of sales to the United States. Although U.S. imports from Honduras increased slightly (3.9 percent) in 1989, there has been a 23.4 percent increase since 1985. Finally, Panama's loss of beneficiary status in 1988 capped a 35.0 percent decrease over 4 years in 1988 in U.S. imports from Panama.
U.S. imports from the Central Caribbean have increased by 12.8 percent since 1988 and by 56.6 percent over the 1985 level. In 1989, there were substantial increases in U.S. imports from the Do-minican Republic (14.8 percent) and Jamaica (19.4 percent). U.S. imports from Jamaica alone have increased by 97.3 percent since 1985. U.S. imports from Haiti have consistently approached the $400 million mark. The Central Caribbean country group has experienced the largest jump in market share of total U.S, imp.orts_from_CBERA,_ _ from 24.2 percent in 1985 to 38.2 percent in 1989.
13 In 1984, four oil-producing countries-Trinidad and Tobago, the Netherlands Antilles, the Bahamas, and Aruba-were responsible for 52 percent of all U.S. imports from the CBERA countries, but his figure fell to 28 percent in 1986 and 1987. The value of U.S. imports from oil-producing countries fell a further $283 millilon in 1988 to result in a 23 percent total CBERA market share.
Product Composition of Total Imports
The 9.4 percent contraction of U.S. imports from CBERA beneficiaries between 1985 and 1988 reversed in 1989, and reenforced a major change in product composition. CBERA exports have traditionally consisted of a few items, such as petroleum and petroleum products, sugar for consumption, coffee, bananas, aluminum ores and concentrates,14 and cocoa. Although the tra-ditional goods continue to weigh heavily in the CBERA countries' exports, efforts to diversify ex-ports have diminished the relative importance of these customary items. As a share of total im-ports from CBERA countries, the combined share of the traditional imports in total U.S. imports noted above has steadily declined from 56.5 per-cent in 1985 to 33.1 percent in 1989.15 The decrease in the value of petroleum imports alone accounted for 84.1 percent of this decline.
Table 2-3 shows U.S. imports during 1985-89 of the 30 leading items on an 8-digit HTS basis
_ that together in 1989 accounted for 61.5 percent _
2-6
The Eastern Caribbean's share of U.S imports from the CBERA countries dropped slightly, from 3.1 percent in .19.88.to 2.7 percent in 1989. Peaking in 1985 at 4.4 percent, the reduced East Caribbean market share is the result of U.S. im-ports decreasing by 39.4 percent since 1985 to a 1989 level of $180.5 million. The fall continued, even with the addition of Guyana to the country group in 1988 (Guyana added $55.9 million in exports to the United States to the group's total in 1989). Although U.S. imports rose from five countries in the group (Antigua, British Virgin Is-lands, Grenada, Guyana, and St. Kitts and Nevis) from 1988 to 1989, the increments for the most part were small in comparison with previous de-creases. For example, the rise in imports from the British Virgin Islands from $0.7 million in 1988 to $1.1 million in 1989 pales in comparison to the 1987 level of $11.2 million. Antigua expe-rienced the largest gain in 1989 of any Eastern Caribbean country. However, Antigua's increase of 78.1 percent over the 1988 level, to $12.3 mil-lion, still left U.S. imports about half of the 1985 high of $24.7 million. In 1989, U.S. imports from Barbados continued a dramatic decline. The 24.7 percent drop from 1988 brought the country's sales to a 5 year low and capped a total drop in U.S. imports from Barbados of 80.8 per-cent since 1985, to a level of $38.7 million.
14 The HTS, used for the first time in 1989, accounts for the traditional U.S. import of bauxite under the category of aluminum ores and concentrates.
16 Figures for sugar, coffee, banana, aluminum ores and concentrates, and cocoa imports from CBERA countries are presented in table 2-3, while figures for petroleum and petroleum products imports and textiles and apparel are presented in figure 2-3 and appendix table B-5. The 1985 index of traditional imports Was recalculated using a slightly higher HTS value for petroleum and petroleum products.

r r
Table 2-3 Leading U.S. Imports for consumption from countries designated under the CB ERA, 1985-89
($1,000, customs value)
HT Item Description - 1985 1986
1 1987 1 1988 - 1989
2709.00.20 Petroleum oils and oils from bituminous minerals, crude 1,006,296 576,476 521,755 413,181 474,046 , , [ 0803.00.20 Bananas, fresh or dried 423,488 398,820 467,736 468,021 - 443,548 ' 0901.11.00 Coffee, not roasted, not decaffeinated 631,499 986,975 592,09 372,559 360,225
II 2710.00.05 2918.90.30
Distillate and residual fuel oils (incl. blends) test <25 deg. A.P.I. Aromatic drugs derived from carboxylic acids with additional oxygen
807,099 59,324
466,485 105,387
516,056 74,470
412,005 50,212
309,632 277,732
6203.42.40 Men's or boys'_ trousers, breeches and shorts, not knitted 63,285 101,319 147,196 201,960 272,130
1701.11.00 Cane sugar, raw, not containing added flavoring or coloring' 234,717 184,074 101,431 133,721 172,401
6204.62.40 Women's or girls' trousers, breeches & shorts, cotton, not folklore 29,459 37,003 63,432 100,689 146,413
2710.00.15 Motor fuel derived from bituminous minerals 215,279 185,528 175,614 134,671 145,453
2606.00.00 Aluminum ores and concentrates 51,176 77,900 106,692 114,791 131,678
9801.00.10 U.S. goods returned-without having .been advanced in value 106,330 95,844 85,217 108,960 110,473
6212.10.20 Brassieres, other than containing lace, net or embroidery 29,530 23,992 24,326 28,668 105,398
281,18.20.00 Aluminum oxide, except artificial.corundum 66,171 25,826 16,989 49,174 92,144
6205.20.20 Men's or boys' shirts, not knitted or crocheted, of cotton 29,552 55,226 69,168 86,659 89,218
0306.13.00 Shrimps and prawns, cooked in shell or uncooked, frozen 128,645 143,835 140,225 147,681 89,046
281'4.10.00 Anhydrous ammonia 71,435 38,724 38,446 56,693 77,429
0202.30.60 'Non retail cuts of meat of bovine animals, frozen, boneless, other 93,522 112,444 111,263 118,837 73,134
6400.10.65 Footwear uppers, other than formed, of leather 41,187. 36,662 56,588 63,865 71,488
6203.43.40 Men's or boys' trousers, breeches and shorts, synthetic fibers, other - 32,990 49,679 57,971 61,718 - 67,668
7108.12.10 Unwrought gold bullion and dore, nonmonetary ' 67,125 72,841 60,553 48,314 64,108
9018.90.80 Instruments and appliances used in medical, surgical, dental, other 4,422 2,628 1,494 17,101 63,353
6105.10.00 Men's or boys' shirts, knitted or crocheted, of cotton 18,920 20,861 43,188 53,672 59,780
271,0.00.10 Distillate and residual fuel oils (incl. blends) test >= 25 deg. A.P.I.. 217,951 122,712 131,612 59,329 , 56,953
7202.60.00 Ferronickel 40,292 21,433 32,390 59,938 56,634
0201.30.60 Non retail cuts of meat of bovine animals, freshichIld,boneless,other 10,389 12,494 12,303 13,201 49,576
1801.00.00 Cocoa beans, whole or broken, raw or roasted 65,239 65,858 68,734 70,108 47,285
6109.10.00 T-shirts, singlets, tank tops and similar garments - 5,370 3,818 21,490 41,298 46,648
711,3.19.50 Articles of Jewelry and parts thereof of precious metals 3,458 4,697 , 11,449 12,954 42,245
6212.10.10 Brassieres, Containing lace, net or embroidery . 80,352 68,040 79,364 104,550 41,979
6206.40.30 Women's or girls' blouses and shirts, man-made fibers, other 21,412 26,395 32,154 39,712 41,730
Total of items shown . - 4,655,914 4,123,978 3,861,404 3,644,245 4,079,546
Total all commodities 0,687,226 6,064,745 6,039,030 6,061,054 6,637,440
Note.-1985-88 data are estimated under the HIS classification system. Note.-Because of rounding, figures may not add to totals given. Source: Compiled from official statistics of the U.S. Department of Commerce.
C.>
- •
of total imports from the CBERA beneficiaries. In addition to textiles and apparel and the tradi-tional U.S. imports, major U.S. imports from the CBERA countries -in -1989 included beef, U.S. goods returned,18 gold, aromatic drugs, aluminum oxide, shrimp, anhydrous ammonia, and foot-wear.
Important changes in the composition of U.S. imports from the CBERA beneficiaries during the 5 year period included the increase in sugar im-
ports in 1988 by 31.8 percent, to $133.7 million (table 2-3). Even though U.S. imports of CBERA sugar increased 28.9 percent in 1989, overall sugar values were still clOwn 26.5 percent from the 1985 level. Caribbean exporters suf-fered along with other foreign sugar suppliers from U.S. quota cutbacks until 1988. Because of concerns over the impact of a drought on the do-mestic crop, the United States increased its global sugar quota, with corresponding increases in the quotas for CBERA countries. The value of Carib-bean coffee exports to the United States, which surged in 1986 to slightly Under $1 billion, fell by 40.0 percent in 1987, and 37.1 percent in 1988. However in 1989, the value of U.S. imports of Caribbean coffee only fell by 3.3 percent, to $360.2 million, while the price of coffee plum-meted worldwide by more than 50 percent. The 1989 dollar value of Caribbean coffee exports to the United States was 63.5 percent below the 1986 level. Although U.S. imports of CBERA cocoa remained constant in quantity, world cocoa prices dropped by 35 percent in 1989, and U.S. imports of CBERA cocoa fell 32.6 percent in value to a 5 year low of $47.3 million.
The biggest percentage increase in U.S: im-ports of a CBERA commodity in 1989 came from aromatic drugs derived from carboxylic acids with additional oxygen. The 453 percent 1 year in-crease brought U.S. imports of the commodity to $277.7 million, 163 percent greater than the 1986 previous high value for aromatic drugs.17 U.S. imports of CBERA beef (HTS subheadings 0202.30.60 and 0201.30.60) declined by 7 per-cent between 1988 and 1989, dropping to $122.7 million.
' 8 U.S. goods returned refers to products of the United States that are returned after being exported without having been advanced in. value, such as articles exported for temporary use abroad or those returned to the United States for repair.
17 In 1988, certain analgesic products entering the United States from the Bahamas.were classified in TSUS item 412.22, a residunl or "basket" category containing benzenoid analgesics other than aspirin,- ibuprofen, and acetaminophen. In 1989, however, because of the conversion to the HTS, the productsin this TSUS
Wife el -as-sifted:under various HTS subhead-ings, primarily depending on their structure. The analgesic product(s) under consideration for this report are now grouped in FITS subheading 2918.90.30. This is, however, a much larger "basket" category consisting of all aromatic drugs, 'analgesics or not, derived from carboxylic acids with additional oxygen function. As such, trade data for 1985-88 may not be directly compa-rable to HTS trade data for 1989. For a further discussion of comparability of TSUS and HTS data for the years 1984-88, see footnote 7 of this chapter.
In 1985 and 1986, the value of the region's petroleum exports to the United States fell sharply and was the primary reason for the. overall decline- in imports from the CBERA countries (figure 2-3). Petroleum and petrOleum products accounted for 35.4 percent of total U.S. imports from the CBERA countries in 1985 in terms of value, and fell to a 22.7 percent share in 1986.18 After stabilizing in 1987, the value of U.S. im-ports of petroleum and petroleum products from the CBERA countries declined by $318 million in 1988 and by an additional $14 million in 1989. The commodity's share of the total market de-creased from a high of 49 percent in 1984 to 16 percent in 1989.
For the fourth year in a row U.S. imports of Caribbean textiles and apparel -continued to grow in 1989 (figure 2-3). Consisting mostly of gar-ments, textiles are a nontraditional export category for the CBERA countries. In 1985, tex-tiles and apparel accounted for 9.7 percent of the total value of U.S. imports from the CBERA countries. In 1989, that figure rose to 26.4 per-cent.18 Since 1985, the value of these imports has almost tripled; in 1989, textile And apparel imports from the CBERA countries grew by 17.7 percent, or $264 million. For the second year in a row, the value of U.S. imports of textiles and apparel surpassed U.S. imports of petroleum and petroleum products. Textiles and apparel now represent the principal U.S. import from CBERA-designated countries.
Dutiability and Special Duty-Free Programs
Table 2-4 breaks down U.S. imports from the CBERA beneficiaries, between 1985 and 1989, into their dutiable portion and the portion enter-ing.the U.S. customs territory free Of duty. The duty-free entry is either under the most-favored-nation (MFN) rate of the HTS or under special rates' of duty, such as are given by the CBERA."
CBERA preferences constitute one of three major duty-remission or duty-reduction programs available to Caribbean Basin countries from the United States. The other two, which-have been in effect for years, are the Generalized System of Preferences (GSP)21 and 'proviSions under HTS subheadings 9802.00.60 and 9802.00.80 (for-merly TSUS items 806.30 and 807.00). Table 2-4 separately_ list' _imports_froni _the, c_BBR. beneficiaries which entered the United States Un-der special programs during 1985-89.
le See figure 2-3-and app. ta,ble B-5 for petroleum and petroleum import figures.
19 Ibid. See also the section on "Product Eligibility Under the CBERA" later in this chapter.
20 All CBERA-designated countries are eligible for MFN tariff treatment.
21 For a discussion of the GSP, see the following section of this chapter.
2-8

Item • 1985 1986 1987 1988 1989
AbSolute change, /989 over 1985
Percentage change, 1989 over 1985
Value ($1,000, customs value)
Total imports 6,687,226 6,064,745 6,039,030 6,061,054 6,637,440 (49,786) (0.7)
Dutiable value2 2,962,025 1`,916,553 2,110,950 1,975,850 2,101,839 (860,186) (29.0)
HTS 9802.00.60 and 9802.00.80 238,630 261,632 336,380 427,144 504,882 266,252 111.6 HTS 9802.00.80.10 0 693 20,143 57,636 106,055 106,055 (7) HTS 9802.00.80.50 (8) 260,878 316,234 369,483 398,241 (7) (7)
Other 2,723,395 1,654,921 1,774,571 1,548,706 1,596,957 (1,126,438) (41.4)
Duty-free value3 3,725,201 4,148,192 3,928,080 4,085,204 4,535,601 810,400 21.8
MFN4 2,070,491 2,340,473 2,056,248 1,927,912 1,854,400 (216,091) (10.4) CBERA5 493,024 670,711 768,467 790,941 905,762 412,737 83.7 GSP5 533,507 476,151 300,531 353,079 415,859 (117,648) (22.1) HTS 9802.00.60 and 9802.00.80 ... 547,368 612,118 756,115 906,518 1,089,694 542,326 99.1
HTS 9802.00.80.10 0 562 58,422 161,708 286,437 286,437 (7) HTS 9802.00.80.50 546,306 611,513 697,681 744,723 785,766 239,460 43.8
Other duty freee 80,8114 8,738 46,719 106,754 269,886 189,075 234.0
Percent of total
Total imports 100.0 100.0 100.0 100.0 100.0 17) (7)
Dutiable value2 44.3 31.6 35.0 32:6 31.7 (7) (7)
HTS 9802.00.60 and 9802.00.80 3.6 4.3 5.6 7.0 , 7.6 (7) (7) HIS 9802.00.80.10 0.0 (e) 0.3 1.0 1.6 (7) (7) FITS 9802.00..80.50 (9) 4.3 5.2 6.1 6.0 (7) (7)
Other 40.7 27.3 29.4 25.6 24.1 (7) (7)
Duty-free value3 55.7 68.4 65.0 67.4 68.3 (7) (7)
MFN4 31.0 38.6 34.0 31.8 27.9 (7) (7) CBERA5 7.4 11.1 12.7 13.0 13.6 (7) (7) GSP5 8.0 7.9 5.0 5.8 6.3 (7) (7) HTS 9802.00.60 and 9802.00.80 8.2 10.1 12.5 15.0 16.4 (7) (7)
HTS 9802.00.60.10 0.0 (6) 1.0 2.7 4.3 (7) (7) HTS 9802.00.80.50 8.2 10.1 11.6 12.3 11.8 (7) (7)
Other duty freee 1.2 0.8 0.8 1.8 4.1 (7) (7)
' Panama is included as a beneficiary country in figures for 1985 through 1988. Data for Guyana are included in 1988 and 1989 only. 2 Reported dutiable value has been reduced by the duty-free value of Imports entering under HTS subheadings 9802.00.60.00 and 98021.00.80 and increased by the
value of ineligible items that were reported as entering under the CBERA and GSP programs. 3 The total duty-free value is calculated as total imports less dutiable value. 4 Figures for MFN duty-free represent the value of imports•which have a col. 1 duty rate of zero. 5 Values for CBERA and GSP duty-free imports have been, reduced by the value of MFN duty-freeimports and Ineligible items that were misreported as entering
under the programs. • Other duty-free imports were calculated as a remainder and represent imports entering free of duty under special rate provisions. For example, the other duty-
free figure for 1989 Includes $264.6 million dollars' worth of U.S. imports of aromatic drugs (HTS 2918.90.30) from the Bahamas that entered the United States duty-
free, probably under a special duty-rate suspension for one product in the group. 7 Not applicable.
Less than 0.05 percent. 9 Not available.
Note.-Because of rounding, figures may not add to totals given. Source: Compiled from official statistics of the U.S. Department of Commerce.

Dutiable Value Of Imports Between 1985 and 1988 the decline in the du-
tiable value of overall U.S. imports from the CBERA beneficiaries was roughly correlated with the decline in the value of CBERA-excluded pe-troleum and petroleum product imports from the group. The dutiable value of imports from CBERA beneficiaries declined 35.3 percent be-tween 1985 and 1986 before rising modestly in 1987 and falling back in 1988. In 1989, imports from oil-producing countries rose 16.2 percent, and the dutiable value of imports increased by 6.4 percent. The 1989 level of dutiable value of im-ports is still 29.0 percent below the 1985 5-year high of $3.0 billion. In 1985, the year after CBERA became operational, the dutiable value of imports from the CBERA countries amounted to $3.0 billion, or 44.3 percent of the total.
As shown in the tabulation at the bottom of the page, in 1989, the dutiable value of U.S. im-ports from the CBERA countries amounted to $2.1 billion. Table 2-4 shows this level to be 31.7 percent of total U.S. imports for consump-tion from CBERA countries. The tabulation also shows that the average rate of duty and adjusted calculated duties have risen markedly since the start of CBERA. Calculated duties have risen by 150 percent from 1985-89, with a 14 percent rise in 1989 to $180.1 million. The tabulation also shows that the average duty rate has risen from 2.44 percent in 1985 to 8.57 percent in 1989.
Duty-Free Value of Imports Although the dutiable value of imports from
the designated countries has fluctuated, the total value of duty-free imports has increased over the past few years. The value of duty-free imports grew from $3.7 billion in 1985 to the 5 year high value of $4.5 billion in 1989. In addition, 1989 duty-free imports accounted for a 68.3 percent share of total imports from CBERA countries compared to a 55.7 percent share in 1,985 (table 2-4).
MFN duty-free imports
Imports that enter unconditionally free of duty under MFN rates have consistently com-prised a significant share of the overall value of U.S. imports from the designated countries (table 2-4). In 1989, 68.3 percent of all imports from
the CBERA countries entered the United States free of duty, 40.9 percent of which received duty-free entry under the MFN column 1 general rate). In 1985, $2.1 billion, or 31.0 percent, of U.S. imports fell within this category.22 The MFN duty-free content of imports from the CBERA countries jumped to 38,6 percent in 1986, reflecting a surge in MFN duty-free imports (principally coffee) coupled with a move away from dutiable goods (such as petroleum prod-ucts). In 1989, MFN duty-free imports declined for the third year in a row to a 5 year low of $1.8 billion, or a 27.9 percent share of total imports.
CBERA duty-free imports
Out of a total of $4.5 billion in duty-free im-ports originating from the program's beneficiaries last year, $905.8 million worth, or 20.0 percent, entered the U.S. customs territory under the CBERA program (table 2-4). This is a 14.5 per-cent increase from the $790.9 million in CBERA duty-free imports in 1988, and represents 13.6 percent of total imports from the CBERA countries.
GSP duty-free imports
For the second year in a row, the duty-free imports under the GSP program rose in value in 1989 (table 2-4). Nevertheless, the 1989 value of GSP imports remained 22.1 percent below the 1985 value. Between 1985 and 1987, GSP im-ports fell from $533.5 million to a record low of $300.5 million. However, the value of these im-ports rebounded by 17.5 percent in 1988 and by an additional 17.8 percent in 1989 to $415.9 mil-
lion. As a share of total imports from the CBERA countries, duty-free GSP imports peaked at 8.0 percent in 1985, and declined to 5.0 per-cent in 1987. In 1989, GSP imports from the CBERA countries accounted for 6.3 percent of the total.
HTS subheadings 9802.00.60, 9802.00.80.10, and 9802.00.80.50
HTS subheading 9802.00.60 provides an ex-clusion from the calculation of dutiable value, in
imposing U.S. customs duties, for certain U.S. metal products returned to the United States for additional processing. HTS subheading
22 The figure for MFN duty-free imports includes all items with a col. 1 duty rate of zero, regardless of how its entry into the United States was reported.
- - --Item-- - 1-985 1986 1987 1988 1989
Dutiable valUel 2,962,025 1,916,553 2,110,950 1,975,850 2,101,839
Calculated duties, 72,152 83,056 127,977 157,605 180,130 Average duty2 2.44 4.33 6.06 7.98 8.57
1 In thousands of dollars. Reported dutiable value and calculated duty were adjusted to account for the duty-free value of Imports entering under HIS Subheadings 9802.00.60 and 9802.00.80 and for the value of Ineligible Imports that were reported in the official trade statistics as entering the United States under the GSP and CBERA programs. Figures are based on 1089 product eligibility. 2 Percentages determined as follows: average duty = (calculated duty/dutiable value) x 100.
2-10

9802.00.80 provides similar treatment in the cal-culation of dutiable value for U.S. components in imported products that have been assembled in a foreign country. Considering the significance of textiles and apparel for the region's economy, in February 1986, the President announced a "spe-cial access program" under HTS subheading 9802.00.80 to liberalize the quotas of the CBERA. beneficiaries. The program was designed to pro-vide greater access to the U.S. market for textile and apparel products, as to which CBERA ex-
pftiér ordinarily claim eligibility- for HTS-subheading 9802.00.80, that were assembled solely from fabric produced and cut in the, United States.23 Items imported under the special access program (formerly referred to as 807-A or Su-per-807) are separately treated under HTS statistical reporting number 9802.00.8010.
The growth of U.S. imports from CBERA beneficiaries receiving reduced duties under HTS subheading 9802.00.80 largely reflects the up-ward trend in textile and apparel imports from these countries in recent years (table 2-4). In 1989, the customs value of HTS subheading 9802.00.80 imports from CBERA beneficiaries grew by 18.2 percent, reaching $1.6 billion and accounting for 23.8 percent of total U.S. imports from these countries. Out of such imports in 1989, imports under HTS subheading 9802.00.8010 accounted for $392.5 million, an increase of 78.9 percent over the value in 1988. Imports from CBERA beneficiaries for which duty entry under HTS subheading 9802.00.8050 totaled $1.2 billion in 1989, an increase of 6.3 percent over the prior year. The corresponding duty-free values of imports afforded duty reduc-tions by means of HTS statistical reporting numbers 9802.00.8010 and 9802.00.8050 in 1989 were' $286.4 million and $785.8 million, respectively.
Product Composition of Imports Under the CBERA
As in past years, imports of beef (HTS sub-headings 0201.30,60 and 0202.30.60 combined) accounted for the largest product category of im-ports entering the United States under the CBERA ($118.5 million in CBERA imports) in 1989. The top 20 CBERA duty-free imports are listed in table 2-5 along with the corresponding figures for total U.S. imports from the region.
23 CBERA countries were invited to enter into bilateral agreements with the United States that would guarantee levels of access for their textile and apparel exports that qualify. These guaranteed access levels (GALs) are separate from quotas applicable to those products that were riot assembled solely from U.S. made and U.S.-cut fabric. Costa Rica, the Dominican Republic, Haiti, Jamaica, and Trinidad and Tobago have had GAL agreements for several years. Guatemala signed a GAL agreement with the United States on Nov. 9, 1989. The agreement with Guatemala provided for a transition period; the GAL limits did not become effective until Mar. I, 1990.
The second-largest CBERA import category in 1989 was cane sugar, with imports valued at $106.4 million, up from $93.1 million in the prior year.24 Pineapples totaled $32.0 million worth of CBERA duty-free imports followed by baseballs and softballs, and medical instruments, with $28.8 million and $27.1 million in CBERA imports, respectively. Leading CBERA imports in 1989 also include cigars, electrical apparatus for switching, ethyl alcohol (ethanol), electrical vari-able resistors, and jewelry.
Product Eligibility Under the CBERA Figure 2-3 shows U.S. imports of certain cate-
gories of goods that are not eligible for duty-free entry under the CBERA. In 1989, for the second year in a row, the textiles and apparel import value exceeded the petroleum and petroleum products import value, thus the former grouping remained the largest import category excluded from CBERA eligibility.25
More limiting than the petroleum duties is the exclusion of wearing apparel, imports of which carry high duties. Yet, as previously mentioned, textile and apparel imports from designated coun-tries have expanded rapidly, reflecting their competitive edge based on geographic proximity, lower production costs relative to some Asian producers, and utilization of the HTS statistical reporting Dumber 9802.00.8010 program. In 1989, the total value of U.S. imports from CBERA countries classified under HTS 9802.00.80 grew by 18.2 percent to $1.6 bil-lion.26
Although certain excluded product categories, especially apparel and petroleum, weigh heavily in the commodity composition of U.S. imports from the Caribbean Basin, the trade-weighted product coverage of CBERA eligibility remains extensive. The imports of goods that were not excluded (conditionally or unconditionally) from CBERA benefits by statute amounted to $3.8 bil-lion in 1989, or 56.7 percent of all U.S. imports from designated countries. This leaves $2.9 bil-lion, or 43.3 percent, of 1989 imports excluded from the CBERA. However, as mentioned in previous CBERA reports, the broad CBERA product coverage is somewhat deceptive if viewed as an indication of new preferential access to the U.S. market. Of the nonexcluded goods im-ported in 1989, $1.9 billion were already unconditionally free of duty under MFN tariff rates (table 2-4) and thus did not gain any new
24 The combined 1989 sugar import quotas for the CBERA beneficiaries, raw value, was 760,961 metric tons, more than double the 1988 quota level of 324,514 metric tons. The total world sugar import quota for 1989 was 2,258,050 metric tons.
28 As pointed out in the previous CBERA reports, petroleum is subject to relatively low rates of duty. Therefore, the absence of duty-free privileges for this category has not severely restricted the benefits conferred by the CBERA.
" Table 2-4 and the accompanying discussion analyze 1989 trade in these categories.
2-11

Table 2-6 1 Leading U.S. Imports for consumption entered under CBERA, provisions, by descending customs value of duty-free Imports, 1986-89
1986 1987 1988 1989 t•--)
HTS item Description
Percent ' Percent Percent Percent Duty- of CBERA Duty- of CBERA Duty- of CBERA Duty of CBERA free duty-free free duty-free free duty-free free duty-free under to total under to total under to total under to total Leading CBERA from CBERA CBERA from CBERA CBERA fromCBERA CBERA from CBERA source2
1,000 1,000 1,000 1,000 , dollars dollars dollars dollars
1701.11.00 Cane sugar, raw, not containing added
flavoring or coloring 112,098 60.9 73,785 72.7 93,137 69.7 106,446 61.7 Dominican Republic
0202.30.60 Nonretailicuts of meat of bovine animals, frozen,Iboneless, nesi ......106,214 96.2 102,861 92.4 109,989 92.6 70,804 96.8
' Costa Rica
0201.30.60 Nonretail touts of meat of bovine animals,
, fresh, chilled, boneless, nesi , 12,024 96.2 11,429 92.4 12,218 92.6 47,685 96.2 Costa Rica
L
0804,30.40 Pineapples, fresh or dried, not redUced in size, in crate 13,526 77.9 15,692 68.3 29,438 98.3 32,000 87.5 Costa Rica
9506.69.20 Baseballs and softballs 16,978 46.0 21,189 56.6 26,293 69.2 28,833 77.8 Haiti ,
9018.90.80 Instruments and appliances-
medical, surgical, dental, other .1 0 0.0 288 19.3 8,660 50.6 27,054 42.7 Dominican Republic 1
, 2402.10.80 Cigars, cheroots and
cigarillos containing tobacco; valued
,
over $.23 18,820 58.0 23,049 65.9 22,121 62.5 25,613 78.8 Dominican 'Republic
8536.90.00 Electrical apparatus nesi, for switching/
making -Connections 1,932 21.1 2,745 47.9 3,406 52.4 21,326 55.1 Haiti
2207.10.60 Undenatured ethyl alcohol of 80 percent volume alcohol, for nonbeverage
,
, i I
use , 25,092 90.7 27,468 95.5 10,641 62.2 21,093 100.0 Jamaica , I 8533.40.00 Electrical Variable resistors,
nesi, including rheostat&
,
potentiometers 1,282 13.0 7,109 66.0 10,341 89.2 18,240 91.9 Costa Rica , 7116.20.10 Articles of jewelry of
precious or
1
semiprecious stones 5,568 92.6 16,850 98.5 11,955 87.4 17,254 96.7 Dominican Republic i 7113.19.50 Articles of jewelry and'parts
of precious metal, nest 973 20.7 1,933 16.9 1,226 9.5 16,106 38.1 Dominican Republic I
1
,

Table 2-5-Continued 1
Leading U.S. Imports for consumption entered under CBERA' provisions, by descending customs value of duty-free imports, 1986-89
1986 1987 1988 1989
HTS item Description
Percent Percent Percent Percent Duty- of CBERA Duty- of CBERA Duty- of CBERA Duty of CBERA free duty-free free duty-free free duty-free free duty-free under to total under to total under to total under to totali Leading CBERA from CBERA CBERA from CBERA CBERA fromCBERA CBERA from CBERA source2
1,000 1,000 1,000 1,000 dollars dollars dollars dollars
-
P.)
4303.10.00 Articles of apparel and clothing accessories, of furskin 1,597 20.9
2905.11.20 Methanol (methyl alcohol), other than to produce synthetic natural gas or use as fuel 3,454 33.8
0807.10.20 Cantaloupes, fresh, If entered at any other time 4,707 68.3
8532.24.00 Ceramic dielectric fixed capacitors, multilayer 5,311 28.1
6406.10.65 Footwear uppers, other than formed, of leather 4,507 12.3
8538.90.00 Parts nesi, suitable for use solely or principally with apparatus of heading 8535, 8536, 8537 2,892 80.5
0302.69.40 Fish, nes!, excl. fillets, livers and roes, fresh, chilled 7,239 48.3
2009.11.00 Orange Juice, frozen, unfermented and not containing added spirit 5,624 89.3
1,453 37.1 3,625 38.3 12,751 93.0 ! Dominican Republic li
! 6,983 43.9 23,492 57.0 12,542 43.9 1 Trinidad and Tobago
6,232 75.6 8,517 76.1 12,167 64.3 t Honduras
12,803 49.8 12,255 53.2 12,149 54.0: El Salvador
I
8,695 15.4 12.320 19.3 11,877 16.6 1 Dominican Republic
1 4,076 65.2 4,737 60.9 11,850 62.1 Dominican Republic
7,285 41.1 7,785 34.0 11,054 45.7 1, Costa Rica
! 1 7,112 96.8 6,202 99.5 9,627 98.3 Belize
Total of above items ... 351,-839 62.7 353,037 66.4 418,359 66.0 526,468 64.81
Total, all items entering under CBERA 670,711 44.5 768,467 56.2 790,941 52.4 905,762 52.71
' CBERA countries refers to designated beneficiaries. 2 indicates leading CBERA source based on total U.S. imports for consumption.
Note.-Figures for 1966-88 are estimate under,ffie FITS classification system. Note.-Because of rounding, figures may not add to totals 9iven.
Source: Compiled from official statistics of the U.S. Department of Commerce.

Figure 2-3 U.S. Imports for consumption from CBERA countries of goods not eligible for duty-free treatment under CBERA, 1986-89
1987 1988 1989 1985 1986
Billion dollars 2400
2100
1800
1500
1200
900
600
300
Source: Complied from official statistics of the U.S. Department of Commerce.
2-14
.! Petroleum and petroleum products FTM:7 77473 Textiles and apparel
Certain handbags, luggage, and flatgoods Footwear Work gloves Certain leather apparel

CBERA advantages. The remaining $1.9 billion in imports represented CBERA-eligible products that would have been dutiable without the CBERA (table 2-6).
Moreover, the CBERA has not broadly con-tributed to preferential access for the many Caribbean exports that are also eligible for duty-free entry under the GSP. Although the CBERA does permit duty-free entry for those products that lost GSP eligibility because their competitive-need- limits- were- exceeded,- the-only- -item- of- - significance in this category has been sugar im-ports from the Dominican Republic, which were redesignated as GSP-eligible in 1988.
Table 2-6 also shows that the CBERA utiliza-tion ratio was 46.56 percent, down several percentage points from its high of 53.84 percent in 1987. The GSP utilization ratio has been de-clining nearly every year since 1985, from 55.74 percent that year, to 26.88 percent in 1989. Utilization rates of the CBERA and GSP pro-grams were calculated in this section by relating entries under each of the programs' provisions to the total value of imports that were nominally eli-gible for duty-free treatment, i.e., the portion not excluded by statue (conditionally and uncondi-tionally) and not MFN duty-free.
Leading CBERA Beneficiaries Table 2-7 ranks the CBERA-eligible countries
by the 1989 value of their shipments to the United States that entered under the CBERA. The table also shows the shifts in these countries' relative standings as CBERA beneficiaries over time. Appendix table B-1 lists the leading items imported under CBERA from each of the benefi-ciary countries in 1989 with commodity shares.
In 1989, the Dominican Republic and Costa - Rica-remained the countries-taking -ad--
vantage of CBERA. Between 1985 and 1987, their relative weight steadily declined from a 49.4 percent combined share of all U.S. imports enter-ing under CBERA to a 40.1 percent share in 1987. In 1988, however, the combined share of CBERA duty-free imports from the Dominican Republic and Costa Rica rebounded to 48.5 per-cent, and increased to a 5 year high of 54.1 percent in 1989.
The value of CBERA imports from the Do-minican Republic in 1989 grew by 23.3 percent over the previous year's level to reach $299.2 million. The Dominican Republic was the leading source of many products entering the United States under the CBERA (table 2-5), such as sugar, medical instruments, cigars, jewelry, and furskin apparel. .
Table 2-6 U.S. Imports for consumption from the designated CBERA countries: Eligibility and utilization of the GSP and CBERA programs, 1985-89
($1,000 or percent)
Classification 1985 1986 1987 1988 1989
Eligible duty-free under CBERA, 1,571,529 1,491,289 1,427,192 1,559,577 1,945,165 Duty-free under CBERA2 493,024 670,711 768,467 790,491 905,762 CBERA utilization ratio3 31.37 44.97 53.84 50.68 46.56 Eligible duty-free under GSP 4 957,202 998,604 962,905 1,061,115 1,547,285 Duty-free under GSP2 533,507 476,151 300,531 353,079 415,859 GSP utilization ratio° 55.74 47.68 31.22 33.27 26,88
1 Excludes all HIS items that are already duty-free under MFN and that at a 10 digit level are either condition-ally or unconditionally exempt from the program.
2 Imports reported as entering duty-free- under the CBERA and GSP programs were reduced by the value of misreported Items that were already -duty-free under MFN or that were ineligible for duty-free treatment under the programs.
3 CBERA utilization ratio = (Actual entries/eligible entries under the CBERA) *100. 4 Figures for 1985-88 are based on 1989 product eligibility. 0 GSP utilization ratio = (Actual entries/eligible entries under the GSP) * 100.
Source: Calculated from official statistics of the U.S. Department of Commerce.
2-15

Table 2-7
U.S. Imports for consumption under CBERA provisions, by designated country, 1985-89
($1,000 dollars)
- Rank Country 1985 - -1986 ----- 1987 - - 1988 - 1989 -
1 Dominican Republic 171,566 189,708 178,938 242,549 299,173 2 Costa Rica 72,184 112,710 129,577 141,076 190,756 3 Guatemala 42,440 64,143 67,621 77,256 112,627 4 Haiti 46,460 60,463 77,906 83,309 67,548 5 Honduras 44,620 53,765 53,150 56,181 52,647 6 Jamaica 40,365 51,017 58,293 42,022 51,542 7 Trinidad and Tobago 15,791 26,485 26,044 41,938 32,368 8 El Salvador 19,217 12,712 22,135 22,177 27,606 9 Barbados 11,372 10,223 20,223 19,125 14,850 10 St. Kitts and Nevis' 5,503 6,192 9,592 9,417 14,033 11 Belize * 8,412 19,200 11,579 18,845 14,028 12 Bahamas 3,089 53,087 95,488 10,692 9,085 13 St. Vincent and the
Grenadines 200 - 2,089 4,583 9,990 5,642 14 St. Lucia 1,556 2,183 2,568 3,007 2,971 16 Guyana2 (5) (9 (5) 131 2,769 16 Netherlands Antilles3 2,828 1,874 1,199 2,603 2,529 17 Antigua 349 ' 533 333 255 2,309 18 Grenada 13 39 31 118 2,200 19 Dominica 320 494 626 358 844 20 British Virgin Islands 21 18 28 56 138 21 Montserrat 98 3 0 118 96 22 Aruba3 (9 0 14 0 0
Panama4 6,619 13,775 18,539 9,717 (5)
Total 493,024 670,711 768,467 790,941 905,762
Data for Anguilla, which has not been designated as a beneficiary country, were reported with the data for St. Kitts and Nevis through 1985. For 1986-89, figures for St. Kitts and Nevis do not Include data for Anguilla.•
2 Guyana was designated as a beneficiary effective Nov. 24, 1988. 3 Upon becoming Independent of the Netherlands Antilles in April 1986, Aruba was designated separately as a
beneficiary effective retroactively to Jan. 1, 1986, Trade data for Aruba, however, were not reported separately until June 1986. The 1986 figure for Aruba represents trade for June-December only.
4 Panama lost its beneficiary status effective Apr. 8, 1988. 8 Not applicable.
Note.-Because of rounding, figures may not add to totals shown,
Source: Compiled from official statistics of the U.S. Department of Commerce.
U.S. imports from Costa Rica rose by 35 per-cent from 1988-89, to reach $190.8 million. Leading items imported under CBERA from Costa Rica in 1988 were pineapples, meat, vari-ables resistors, and fish. Costa Rica was the principal supplier of many of these products en-tering under CBERA in 1989.
Guatemala replaced Haiti as the third largest beneficiary in terms of trade under the CBERA in 1989. CBERA imports from Guatemala in-creased by 45.8 percent in 1989 to reach $112.6 million. These imports were led by meat, sugar, tobacco, and pesticides. In addition to Guatemala's increase in exports to the United States, Haiti's drop in exports to the United
States was a factor in Guatemala surpassing Haiti's ranking.
Leading imports from Haiti in 1989 under CBERA were electrical apparatus, baseballs, soft-balls, inductors, and transformers. Total U.S. imports from Haiti under CBERA fell by 19 per-cent in 1989 to $67.5 million.
Honduras was the fifth leading source of U.S. imports under CBERA in 1989. Total U.S. im-ports entering under CBERA from Honduras were $52.6 million, down 6 percent from 1988, but 18 percent over the level of 1985. Leading items imported included meat, cigars, canta-loupes, and softballs.
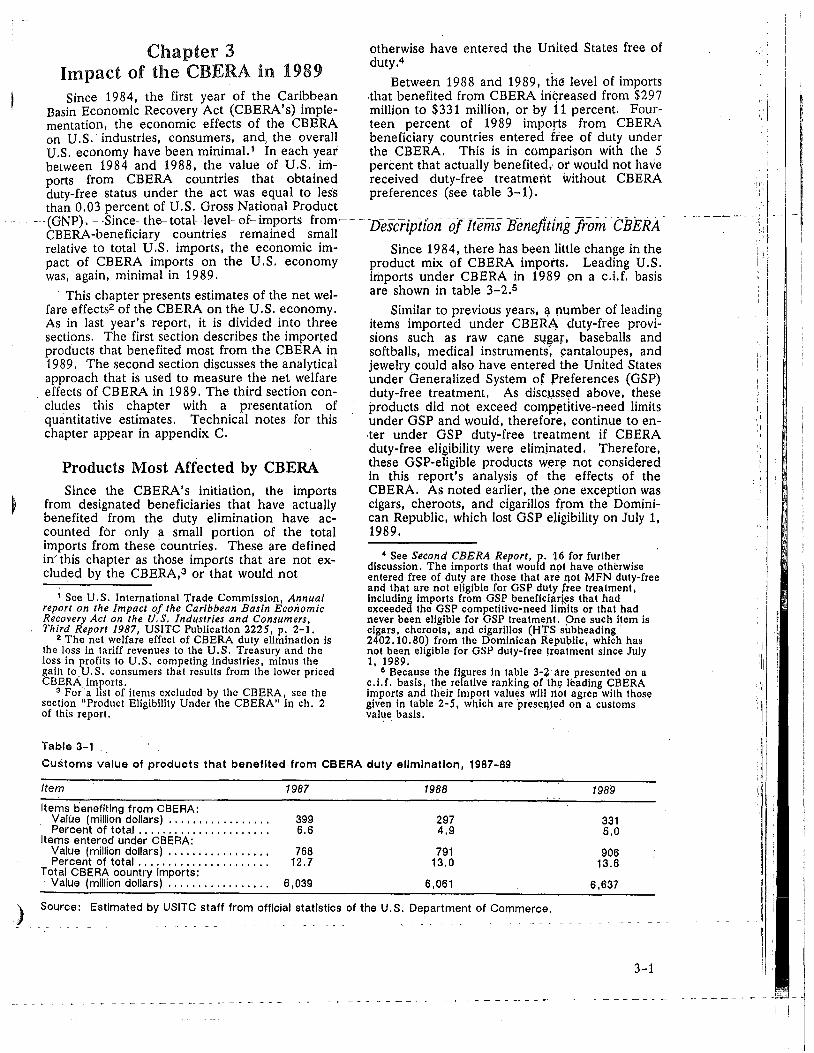
Chapter 3 Impact of the CBERA in 1989 Since 1984, the first year of the Caribbean
Basin Economic Recovery Act (CBERA's) imple-mentation, the economic effects of the CBERA on U.S. industries, consumers, and, the overall U.S. economy have been minima1.1 In each year between 1984 and 1988, the value of U.S. im-ports from CBERA countries that obtained duty-free status under the act was equal to less than 0.03 percent of U.S. Gross National Product
- -Since- the-total- level- of- imports from—CBERA-beneficiary countries remained small relative to total U.S. imports, the economic im-pact of CBERA imports on the U.S. economy was, again, minimal in 1989.
This chapter presents estimates of the net wel-fare effects2 of the CBERA on the U.S. economy. As in last year's report, it is divided into three sections. The first section describes the imported products that benefited most from the CBERA in 1989. The second section discusses the analytical approach that is used to measure the net welfare effects of CBERA in 1989. The third section con-cludes this chapter with a presentation of quantitative estimates. Technical notes for this chapter appear in appendix C.
Products Most Affected by CBERA Since the CBERA's initiation, the imports
from designated beneficiaries that have actually benefited from the duty elimination have ac-counted for only a small portion of the total imports from these countries. These are defined in this chapter as those imports that are not ex-cluded by the CBERA,3 or that would not
' See U.S. International Trade Commission, Annual report on the Impact of the Caribbean Basin Economic Recovery Act on the U. S. Industries and Consumers, Third Report 1987, USITC Publication 2225, p. 2-1.
2 The net welfare effect of CBERA duty elimination is the loss in tariff revenues to the U.S. Treasury and the loss in profits to U.S. competing industries, minus the gain to U.S. consumers that results from the lower priced CBERA imports.
3 For a list of items excluded by the CBERA, see the section "Product Eligibility Under the CBERA" in ch. 2 of this report.
otherwise have entered the United States free of duty.4
Between 1988 and 1989, the level of imports •that benefited from CBERA increased from $297 million to $331 million, or by 11 percent. Four-teen percent of 1989 imports from CBERA beneficiary countries entered free of duty under the CBERA. This is in comparison with the 5 percent that actually benefited, or would not have received duty-free treatment without CBERA preferences (see table 3-1).
See Second CBERA Report, p. 16 for further discussion. The imports that would not have otherwise entered free of duty are those that are not MFN duty-free and that are not eligible for GSP duty free treatment, including imports from GSP beneficiaries that had exceeded the OSP competitive-need limits or that had never been eligible for GSP treatment. Dne such item is cigars, cheroots, and cigarillos (HTS subheading 2402.10.80) from the Dominican Republic, which has not been eligible for GSP duty-free treatment since July 1, 1989.
* Because the figures in table 3-2 are presented on a c.i.f. basis, the relative ranking of thg leading CBERA imports and their import values will not agree with those given in table 2-5, which are presented on a customs value basis.
_ _ _ _ _ -1YeScriptiO n of 'terns Benefiting from CBERA
Since 1984, there has been little change in the product mix of CBERA imports. Leading U.S. imports under CBERA in 1989 on a c.i.f. basis are shown in table 3-2.5
Similar to previous years, 4 number of leading items imported under CBERA duty-free provi-sions such as raw cane sugar, baseballs and softballs, medical instruments, cantaloupes, and jewelry could also have entered the United States under Generalized System of Preferences (GSP) duty-free treatment, As discussed above, these products did not exceed competitive-need limits under GSP and would, therefore, continue to en-ter under GSP duty-free treatment if CBERA duty-free eligibility were eliminated. Therefore, these GSP-eligible products were not considered in this report's analysis of the effects of the CBERA. As noted earlier, the one exception was cigars, cheroots, and cigarillos from the Domini-can Republic, which lost GSP eligibility on July 1, 1989.
Table 3-1
Customs value of products that benefited from CBERA duty elimination, 1987-89
Item 1987 1988 1989
Items benefiting from CBERA:
Value (million dollars) 399 297 331 Percent of total 6.6 4.9 5.0
Items entered under CBERA:
Value (million dollars) 768 791 906 Percent of total 12.7 13,0 13.6
Total CBERA country Imports:
Value (million dollars) 6,039 6,061 6,637
) Source: Estimated by USITC staff from official statistics of the U.S. Department of Commerce.
3-1
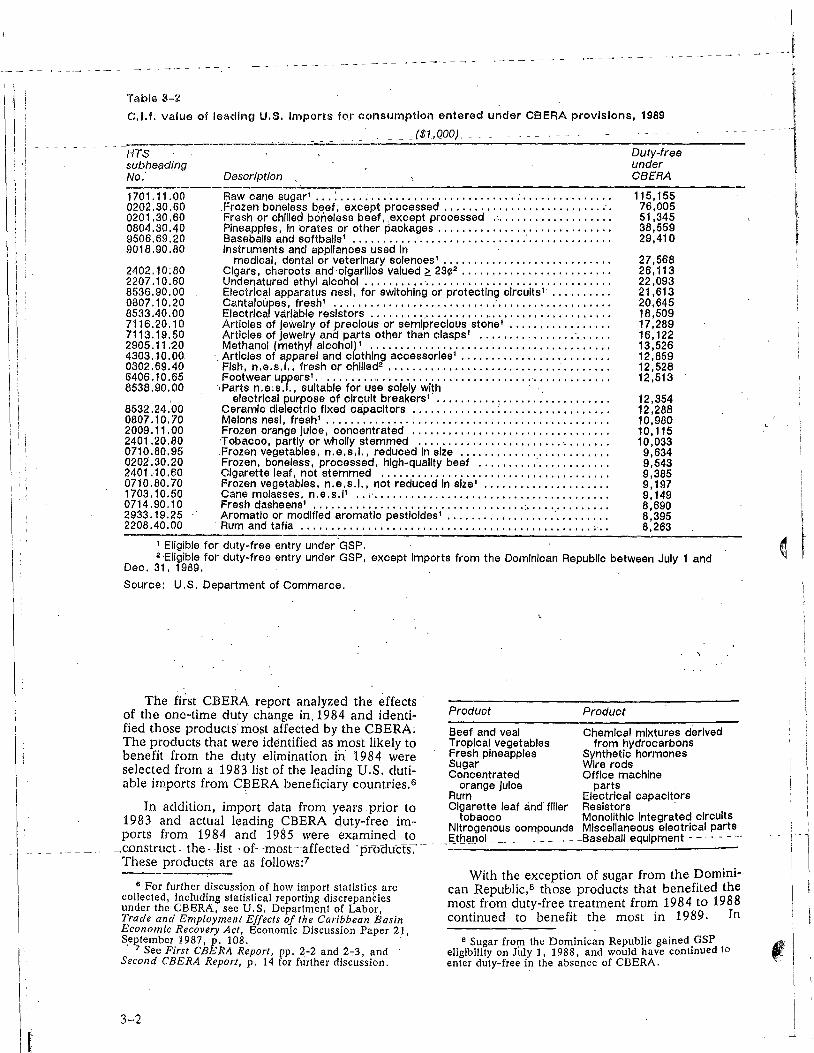
With the exception of sugar from the Domini-can Republic,8 those products that benefited the most from duty-free treatment from 1984 to 1988 continued to benefit the most in 1989. In
Sugar from the Dominican Republic gained GSP eligibility on July 1, 1988, and would have continued to enter duty-free in the absence of CBERA.
Table 3-2
C.i.f. value of leading U.S. Imports for consumption entered under CBERA provisions, 1989
HTS subheading No..
Description
Duty-free under CBERA
1701.11.00
Raw cane sugar' 115,155 0202.30.60
Frozen boneless beef, except processed 76,005 0201.30.60
Fresh or chilled boneless beef, except processed 51,345 0804.30.40
Pineapples, in crates or other packages 38,559 9506.69.20
Baseballs and softballs' 29,410 9018.90.80
Instruments and appliances used In
medical, dental or veterinary sciences' 27,568 2402.10.80
Cigars, cheroots and cigarillos valued > 2302 26,113 2207.10.60
Undenatured ethyl alcohol 22,093 8536.90.00
Electrical apparatus nesi, for switching or protecting circuits' 21,613 0807.10.20
Cantaloupes, fresh' 20,645 8533.40.00
Electrical variable resistors 18,509 7116.20.10
Articles of jewelry of precious or semiprecious stone' 17,289 7113.19.50
Articles of Jewelry and parts other than clasps' 16,122 2905.11.20
Methanol (methyl alcohol)' 13,526 4303.10.00
Articles of apparel and clothing accessories' . 12,859 0302.69.40
Fish, n.e.s.I., fresh or ch1lled2 12,528 6406.10.65
Footwear uppers' 12,513 8538.90.00
,Parts n.e.s.I., suitable for use solely with
electrical purpose of circuit breakers' 12,354 8532.24.00
Ceramic dielectric fixed capacitors 12,288 0807.10.70
Melons nesi, fresh' 10,980 2009.11.00
Frozen orange Juice, concentrated 10,115 2401.20.80
Tobacco, partly or wholly stemmed 10,033 0710.80.95
Frozen vegetables, n.e.s.I., reduced in size 9,634 0202.30.20
Frozen, boneless, processed, high-quality beef 9,543 2401.10.60
Cigarette leaf, not stemmed 9,385 0710.80.70
Frozen vegetables, n.e.s.I., not reduced In size' 9,197 1703.10.50
Cane molasses, n.e.s.11 9,149 0714.90.10
Fresh dasheens' 8,690 2933.19.25 -' Aromatic or modified aromatic pesticides" 8,395 2208.40.00
Rum and tafia 8,263
Eligible for duty-free entry under GSP. 2 Eligible for duty-free entry under GSP, except imports from the Dominican Republic between July 1 and
Dec. 31, 1989.
Source: U.S. Department of Commerce.
The first CBERA report analyzed the effects of the one-time duty change in 1984 and identi-fied those products most affected by the CBERA. The products that were identified as most likely to benefit from the duty elimination in 1984 were selected from a 1983 list of the leading U.S. duti-able imports from CBERA beneficiary countries.6
In addition, import data from years prior to 1983 and actual leading CBERA duty-free im-ports from 1984 and 1985 were examined to
_construct - the - list— of -most- affected -pr-oth.fcts: These products are as follows:7
6 For further discussion of how import statistics are collected, including statistical reporting discrepancies under the CBERA, see U.S. Department of Labor, Trade and Employment Effects of the Caribbean Basin Economic Recovery Act, Economic Discussion Paper 21, September 1987, p. 108.
See First CBERA Report, pp. 2-2 and 2-3, and Second CBERA Report, p. 14 for further discussion.
3-2
Product Product
Beef and veal Tropical vegetables Fresh pineapples Sugar Concentrated
orange Juice Rum Cigarette leaf and filler
tobacco Nitrogenous compounds Ethanol _
Chemical mixtures derived from hydrocarbons
Synthetic hormones Wire rods Office machine
parts Electrical capacitors Resistors Monolithic integrated circuits Miscellaneous electrical parts Baseball equipment - - - —

each of the past 6 years, seven products have consistently entered among the leading iterhs that actually benefited from CBERA duty-free treat-ment. These items are beef, pineapples, orange juice, cigarette leaf, electrical capacitors, resis-tors, and rum. In addition, in each of the past 5 years, ethyl alcohol has been among the leading items that actually benefited from CBERA. Table 3-3 presents the leading 30 eligible items, on an eight-digit HTS basis, imported under. CBERA provisions that were not GSP eligible, or MN Iree of_duty_.
Products that Benefited the Most from CBERA in 1989
What follow, are recent industry highlights of the five leading eligible items that benefited from CBERA in 1989 and that were not MFN duty free or that were not GSP-eligible goods.9
9 The comparisons between 1988 and 1989 in this section should be considered as general indicators of trends as imports in 1988 entered under the TSVS, whereas the 1989 imports entere4 under the HTS. The 1988 HTS data presented here are estimates of imports for that year on an HTS basis. For a further discussion of the comparability of product specific data between 1988 and 1989, see footnote 7 of ch. 2.
Table 3-3
Beefio
Between 1988 and 1989, CBERA imports of beef increased by 6.8 percent, from $131.1 mil-lion to $140.0 million (table 3-3). Costa Rica was the leading CBERA source of beef in 1989.
Pineapplesll
Between 1988 and 1989, imports of pineap-ples increased by 16.3 percent, from $35.7 million to $41.5 million. Costa Rica was the prin-
.cipal CBERA source in .19&9. . _ _
Ethyl alcohol12
Between 1988 and 1989, imports of ethyl al-cohol increased by 120.0 percent, from $10.9 million to $24,0 million. The principal CBERA supplier of ethyl alcohol was Jamaica in 1989.
10 Includes imports of HTS subheadings 0201.30.60, 0202. 30.20, 0202. 30. 40, and 0202. 30. 60.
II Includes imports of HTS subheadings 0804.30.40 and 0804.30.20.
12 Includes imports of HTS subheadings 2207.10.60 and 2207.20.00.
C.i.f, value of leading imports that benefited from CBERA duty-free treatment in 1989
($1,000 dollars)
FITS Subheading No Description
CBERA-beneficiary Imports
0202.30.60 Frozen boneless beef, except processed 76,005 0201,30.60 Fresh or chilled boneless beef, except processed 51,345 0804.30.40 Pineapples, In crates or other packages 38,559 2207.10.60 Undenatured ethyl alcohol 22,093 8533,40.00 Electrical variable resistors 18,509 8532,24.00 Ceramic dielectric fixed capacitors 12,288 2402,10.80 Cigars, cheroots and cigarillos valued > 230' 11,680 2009.11.00 Frozen orange Juice, concentrated 10,115 2401.20.80 Tobacco, partly or wholly stemmed 10,033 0710.80,95 Frozen vegetables, me,s.1 9,634 0202.30.20 Frozen, boneless, processed, high-quality beef, 9,543 2401,10.60 Cigarette leaf, not stemmed 9,385 2208.40.00 Rum and tafia 8,263 8533,21.00 Electrical fixed resistors 6,912 7213.31,30 Irregularly wound coils of hot-rolled rod 5,791 7214.40.00 Hot-rolled bars and rods containing < .25% carbon 3,961 2009.20.40 Grapefruit Juice, concentrated 3,708 0802.90.90 Nuts, me s I 3,580 0202,30.40 Frozen, boneless, processed beef, except high-quality 3,113 0714.10.00 Cassava (manioc), fresh or dried 3,036 0804.30,20 Pineapples, bulk 2,908 0810.10.40 Fresh strawberries, if entered from 9/16 - 6/14 2,887 2402.10.60 Cigars, cheroots and cigarillos valued > 15 and <23 2,768 0603,10.60 Roses, fresh cut 2,375 9507.90.70 Artificial baits and flies , 2,296 2004,90.90 Other prepared vegetables, frozen 2,181 0805.10.00 Oranges, fresh or dried 2,103 2207.20.00 Ethyl alcohol and other spirits, denatured 1,945 7214,20.00 Concrete reinforcing bars 1,670 0714.90.40 Fresh arrowroot, saiep, and Jerusalem artichokes 1,655
1 Cigars that benefited from CBERA duty-free treatment are from the Dominican Republic, which lost its GSP eligibility for cigars in July 1989, Figure given represents Imports from July 1, 1989, Through December 31, 1989. Source: U.S. Department of Commerce.
3-3

- iectrc1 VW-101W FT-SIM-617s- —_ _ _ _ _ _
- Measurement of Net welfare Effects of Between 1988 and 1989, imports of electrical
CBERA supplier in 1989 of electrical variable re-sistors was Costa -Rica.
Ceramic dielectric, multilayer fixed capacitors
Between 1988 and 1989, imports of ceramic dielectric, multilayer fixed capacitors decreased by 0.8 percent, from $12.4 million to $12.3 mil-lion. The principal CBERA supplier of ceramic dielectric, multilayer fixed capacitors was El Sal-vador in 1989.
Measuring the Net Welfare Cost of CBERA in 1989
Analytical Approach
What follows is a brief description of the ap-proach that was used to analyze the net welfare effects of CBERA duty-free treatment in 1989 on the U.S. economy, consumers, and industries that compete with CBERA imports. The net wel-
fare costs of the CBERA duty elimination are the costs (i.e., the forgone benefits) to U.S, produc-
ers and the U.S. Treasury minus the gain to U.S. consumers.13
The effects of CBERA were analyzed by esti-
mating the change in net welfare that would have occurred had the pre-CBERA tariffs been in place for beneficiary countries in 1989. In the presence of the duties, tariff revenues to the U.S. Treasury and profits for U.S. competing indus-
tries would have been larger, yet consumers would have paid higher prices for CBERA desig-nated imports. The model estimates the effects of eliminating the CBERA duty-free status on the U.S. Treasury, U.S. producers, and U.S. con-sumers. The sum of these three effects provides a Measure of the net welfare costs of CBERA in 1989.
In this analysis, imports from CBERA benefi-ciary countries, imports from non-CBERA countries, and competing domestic output are considered imperfect substitutes for each other.14 Therefore, each ,of the three products is charac-terized by a separate market where differing equilibrium prices can exist for each.
13 See Donald J. Rousslang and John W. Suomela, Calculating the Consumer and Net Welfare Costs of Import Relief, USITC, Office of Economics, Staff Research Study No. 15, July 1985, p. 2. Rousslang and Suomela provide a detailed exposition of this topic.
14 Imperfect substitutability between imports-and - compatinidomestic output is a standard assumption from one of the two basic models that have traditionally been used to analyze the effects of tariff reductions. See R. E, Baldwin, "Trade and Employment Effects in the United States of Multilateral Tariff Reductions," American Economic Review, vol. 66 (1976), pp. 142-148.
3-4
CBERA The increased cost to consumers of eliminat-
ing duty-free treatment under CBERA would be reflected in the- higher price WS consumers would pay for CBERA imports and is measured by the loss in consumer surplus.15 Similarly, the increased benefits to the domestic competing in-dustry and its factors of production would be reflected in the increased demand that would re-suit for the U.S. domestic product. The benefit to the domestic industry and its factors is meas-ured by the increase in producer surplus.16 However, for this analysis, the domestic suppl}, curve was assumed to be horizontal. Hence, there is no corresponding increase in net welfare benefits to producers. (Nor is there any welfare loss to consumers in the market for domestic out-put.) Instead, this analysis measures the dollar amount of domestic output displaced by CBERA imports. •
In addition, a benefit would be realized in the absence of CBERA duty-free treatment through the increase in tariff revenue to the U.S. Treas-
ury.17 Increased tariff revenues would be received from both CBERA and non-CBERA im-ports. The increase in non-CBERA import tariff revenue would result from an increase in the de-mand for non-CBERA imports, i.e., with an increase in the price of CBERA imports, the sales of competing non-CBERA imports would also in-crease.18
Quantitative Results In 1989, the value of U.S. imports from
CBERA beneficiary countries was $6.6 billion, representing only 1.4 percent of total U.S. im-ports. The imports that actually benefited from the CBERA, i.e„ those that were not specifically excluded under the act or that could not have entered free of duty under. GSP or MFN, amounted to $331 million. This figure represents 5.0 percent of total imports from CBERA benefi-ciary countries or approximately 0.1 percent of total U.S. imports. Therefore, the effects of the CBERA on the U.S. economy were minimal.
This section presents dollar estimates of the net welfare costs of duty-free treatment for the leading 30 products that actually benefited from the CBERA in 4989. In addition, estimates of the tariff revenue forgone, the consumer surplus generated, and the domestic shipments displaced in 1989 are also presented.
16. See Donald -N;-McCloskey;Th-e Applied Thiory of. - Price, New York, Macmillan Publishing Co., 1985, for further discussion on consumer surplus.
le See McCloskey, The Applied Theory of Price, for further discussion on producer surplus.
17 See Rousslang and Suomela, Consumer and Net Welfare Costs, for further discussion.
10 See the technical notes in app. C for :a more complete discussion of the methodology.
$10.6 million to $1 .5 million, ng variable resistors increased by 74.6 percent, from
8The lea di
Description of items analyzed
The effects of the CBERA were calculated for the 30 items listed in table 3-3. These items ac-counted for 94 percent of the c.i.f. value of imports that actually benefited from CBERA duty-free treatment in 1989. The value of these imports as a ratio of competing U.S. produce& domestic shipments was varied in magnitude (see table 3-4). For instance, in 1989, the value of U.S. imports of fresh or frozen beef from CBERA countries, the largest import category in value
- benefiting- froth CBERA, was 1.28 percenr of the-value of domestic shipments. Conversely, the value of CBERA imports of cassava were approxi-mately twice as large as the value of U.Si producers' domestic shipments.
The economic effects of duty-free treatment for these leading 30 'items are summarized in ta-bles 3-5 and 3-6. Table 3-5 presents dollar estimates of the consumer surplus that was gener-ated and tariff revenue from CBERA and non-CBERA imports that was foregone. Table 3-6 presents dollar estimates of U.S. shipments that were displaced by CBERA imports.19
Effects on the U.S. economy in 1989: Net we!-fare costs and the displacement of domestic output
In 1989, the estimated net welfare cost to U.S. residents of granting CBERA duty-free treat-ment to the items listed in table 3-5 ranged from $2.4 million to $8.2 million. When compared with the total value of CBERA-country imports in 1989, net welfare cost amounted to approxi-mately 0.04 to 0.12 percent.20 As noted above, this range reflects the welfare cost for 94 percent of the total value of the items that actually bene-fited from CBERA duty-free treatment.
'° See technical notes in app. C for a more complete discussion of the data that were used in the estimation of the effects shown in tables 3-5 and 3-6.
20 As noted in the technical notes, app. C, the range of the welfare costs reflects the range of the elasticity of the CBERA import supply curve, 2 to 5, that was used to make these calculations.
21 Includes imports of HTS subheadings 2207.10.60 and 2207.20,00. See also table 3-5.
Except for ethyl alcohol, the loss in tariff reve-nues was not offset by the corresponding increase in consumer surplus for the items analyzed. In 1989, the item with the largeSt net welfare cost resulting from CBERA duty-free treatment, ethyl alcoho1,21 was also the only iterri to show a poten-tial net welfare gain. The net welfare effect* for ethyl alcohol ranged from a kiss of $1.8 million to a gain of $0.9 million.
Five items with high net welfare costs, in value terms, were frozen.orange juice, fresh and frozen beef,22 certain tobacco productS,23 frozen vegeta-bles,24 and pineapples.26 In terrris of c.i.f. value, these five imports accounted fdt,61 percent of the total imports that benefited from CBERA in 1989. The substantial share of net welfare cost associated with these five iterhs is mainly due to the high levels at which they are imported. In this analysis, the higher the value of imports and the less elastic the import-supply curve, the higher was the net welfare loss associated with removing the tariff.
In 1989, the percentage of domestic ship-ments from competing domestic industries that were displaced by the 30 leading imports benefit-ing from CBERA varied in magnitude. The largest effect, in value terms, occurred for ethyl alcohol, where the displacement of domestic ship-ments ranged from $10.5 million to $14.4 million or between 0.73 and 1.00 percent of the value of total domestic shipments. The seven products with the largest displacement effects, in value terms, were ethyl alcohol, certain tobacco prod-ucts, fresh and frozen beef, frozen orange juice, frozen vegetables, grapefruit juice, and pineap-ples.
22 Includes imports of HTS subheadings 0201.30.60, 0202.30.20, 0202.30.40, and 0202.30.60. See also table 3-5.
23 The category, certain tobacco products, includes imports of FITS subheadings 2401,10.60 and 2401.20.80. See also table 3-5.
24 Includes imports of HTS subheadings 0710.80.95 and 2004.90.90. Se also table 3-5.
211 Includes imports of HTS subheadings 0804.30.40 and 0804.30.20. See also table 3-5'.
3-5
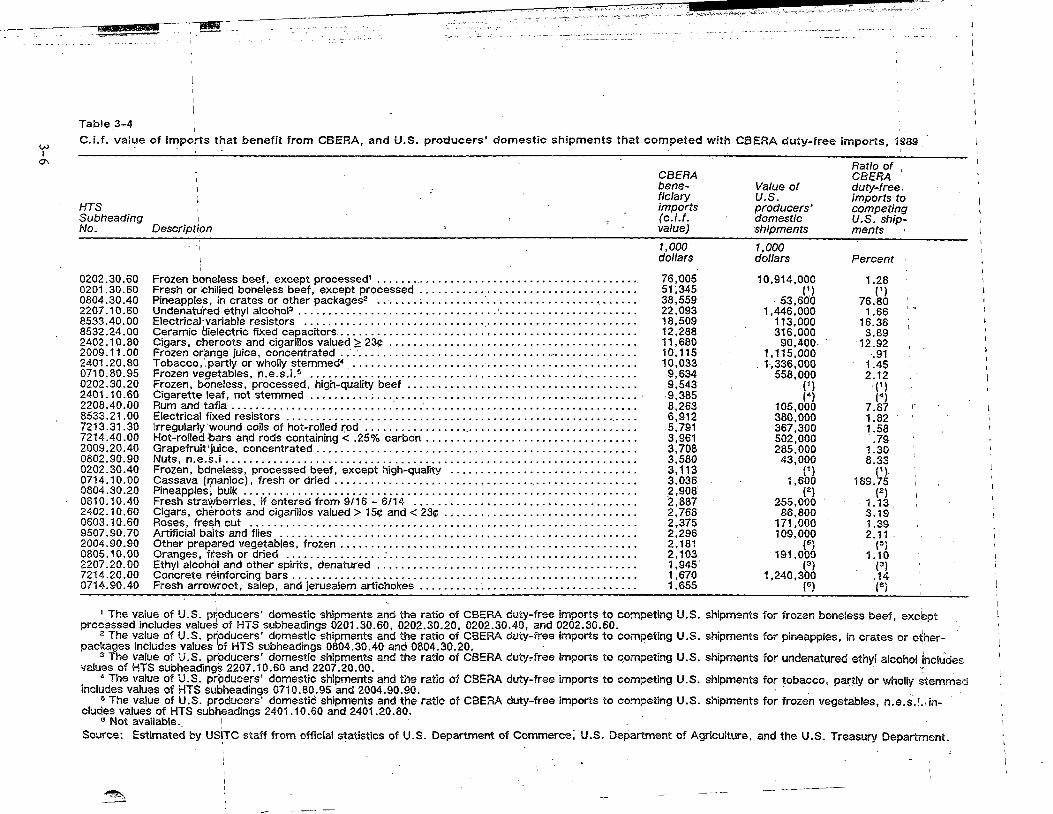
•
Table 3-4
C.i.f. value of imports that benefit from CBERA, and U.S. producers' domestic shipments that competed with CBERA duty-free imports, 1989
HTS Subheading No. Description
CBERA bene-
ficiary imports (c.i.f. value)
Value of U.S. producers' domestic shipments
Ratio of CBERA , duty-free imports to competing U.S. ship-
ments
1,000 1,000
dollars dollars Percent
0202.30.60 Frozen boneless beef, except processed' 76,005 10,914,000 1.28 0201.30.60 Fresh or chilled boneless beef, except processed 51,345
(1) 0804.30.40 Pineapples, in crates or other packages - 38,559 - 53,600 76.80 2207.10.60 Undenatured ethyl alcohol3 22,093 1,446,000 1.66 8533.40.00 Electrical'variable resistors 18,509 113,000 16.38 8532.24.00 Ceramic dielectric fixed capacitors 12,288 316,000 3.89 2402.10.80 Cigars, cheroots and cigarillos valued > 230 11,680 90,400 12.92 2009.11.00 Frozen orange juice, concentrated 10,115 1,115,000 .91 2401.20.80 Tobacco,, partly or wholly stemmed4 10,033 . 1-,336,000 1.45 0710.80.95 Frozen vegetables, n.e.s.i.5 9,634 558,000 2.12 0202.30.20 2401.10.60 2208.40.00
Frozen, boneless, processed, high-quality beef Cigarette leaf, not stemmed Rum and tafia
9,543 9,385 8,263
(1) (4) 105,000
• (1) (4)
7.87 8533.21.00 Electrical fixed resistors 6,912 380,000 1.82 7213.31.30 Irregularly Iwound coils of hot-rolled rod 5,791 367,300 1.58 7214.40.00 Hot-rolled bars and rods containing < .25% carbon 3,961 502,000 .79 2009.20.40 Grapefruit juice, concentrated 3,708 285,000 1.30 0802.90.90 Nuts, n.e s i 3,580 43,000 8.33 0202.30.40 0714.10.00
Frozen, ixineless, processed beef, except high-quality Cassava (Manioc), fresh or dried
3,113 3,036
(1) 1,600
(1) 189.75
0804.30.20 0810.10.40
Pineapples, bulk Fresh strawberries, if entered from 9/16 - 6/14
2,908 2,887
(2) 255,000
(2) • 1.13
2402.10.60 Cigars, cheroots and cigarilios valued > 150 and < 230 2,768 86,800 3.19 0603.10.60 Roses, fresh cut 2,375 171,000 1.39 9507.90.70 Artificial baits and flies 2,296 109,000 2.11 2004.90.90 Other prepared vegetables, frozen 2,181 (5) (5) 0805.10.00 Oranges, fresh or dried 2,103 191,000 1.10 2207.20.00 Ethyl alcohol and other spirits, denatured 1,945. (3) (3) 7214.20.00 Concrete reinforcing bars 1,670 1,240,300 .14 0714.90.40 Fresh arrowroot, salep, and Jerusalem artichokes 1,655 (6) (6)
' The value of U.S. producers' domestic shipments and the ratio of CBERA duty-free imports processed includes valued of HTS subheadings 0201.30.60, 0202.30.20, 0202.30.40, and 0202.30.
2 The value of U.S. producers' domestic shipments and the ratio of CBERA duty-free imports packages Includes values Of HIS subheadings 0804.30.40 and 0804.30.20.
3 The value of U.S. prOducers' domestic shipments and the ratio of CBERA duty-free Imports values of HTS subheadings 2207.10.60 and 2207.20.00.
4 The value of U.S. prOducers' domestic shipments and the ratio of CBERA duty-free imports includes values of HTS subheadings 0710.80.95 and 2004.90.90.
5 The value of U.S. producers' domestio shipments and the ratio of CBERA duty-free imports eludes values of HIS subheadings 2401.10.60 and 2401.20.80.
"Not available. Source: Estimated by USITC staff from official statistics of U.S. Department of Commerce, U.S
to competing U.S. shipments for frozen boneless beef, except 60. to competing U.S. shipments for pineapples, in crates or other-
to competing U.S. shipments for undenatured ethyl alcohol Includes
to competing U.S. shipments for tobacco, partly or wholly stemmed
to competing U.S. shipments for frozen vegetables, n.e.s.i. in-
Department of Agriculture, and the U.S. Treasury Department.

Table 3-5 The estimated. range' of U.S. net welfare effects of CBERA duty-free treatment, by leading Imports, 1989
($1,000 dollars)
Loss in tariff Loss in tariff revenue from revenue from
Gain in consumer CBERA non-CBERA Net-welfare surplus countries countries effect
HTS Subheading 'No., Description
Lower range
Upper range
Lower range
Upper range •
Lower range
!Upper range
Lower range
Upper range
0202.30.60 Frozen boneless beef, except processed2 1 419 z., 1,897 2,423 2,419 7 10 -1,011 -532 0201.30.60 Fresh or chilled boneless beef, except processed (2) (2) (2) (2) (2) 1 (2) (2) (2) 0804.30.40 Pineapples, in crates or other packages3 550 798 1,126 1,118 3 4 -579 -324 2207.10.60 Undenatured ethyl alcohol' 5,974 8,125 7,736 7,258 c) () -1,762 867 8533.40.00 Electrical variable resistors 537 756 1,006 995 40 56 -509 -295 8532.24.00 Ceramic dielectric fixed capacitors 784 974 1,108 1,109 31 39 -356 -174 2402.10.80 Cigars, cheroots and cigarillos valued > 230 387 496 594 594 • (7) 1 -208 -98 2009.11.00 Frozen orange juice, concentrated 1,286 1,798 2,079 1,967 260 370 -1,052 -539 2401.20.80 Tobacco, partly or wholly stemmede 1,481 1,987 2,380 2,347 67 90 -965 -450 0710.80.95 Frozen vegetables, n.e s i6 807 1,104 1,359 1,334 60 82 -611 -313 0202.30.20 Frozen, boneless, processed, high-quality beef (2) (2) (2) (2) (2) (2) (2) (2) 2401.10.60 Cigarette leaf, not stemmed (8) (5) (5) (5) 49 ( 5) (5) (5) 2208.40.00 Rum and tafia 394 513 617 614 1 2 -224 -103 8533.21.00 Electrical fixed resistors 299 352 392 393 2 3 -96 -43 7213.31.30 Irregularly wound coils of hot-rolled rod 32 54 98 96 1 2 -66 -44 7214.40.00 Hot-rolled bars and rods. containing < .25% carbon 72 1-07 154 152 1 2 -83' -47 2009.20.40 Grapefruit juice,- concentrated 749 963 988 979 2 3 -241 -19 0802.90.90 Nuts, n.e.s.i. 18 27 38 38 (7) (7) -20 -11 0202.30.40 Frozen, boneless, processed beef, except
high-quality (2) (2) (2) (2) (2) (2) (2) ( 2 )
0714.10.00 Cassava (manioc), fresh or dried 312 403 456 453 3 4 -147 -54 0804.30.20 Pineapples, bulk (3) (3) (3) (3) (3) (3) (3) (3) 0810.10.40 Fresh strawberries, if entered from 9/16 - 6/14 24 27 29 29 (7) (7) -5 -2 2402.10.60 Cigars, cheroots and cigarillos valued > 150
and <230 109 140 168 168 ( 7) 17) -59 -27 0603.10.60 Roses, fresh cut 71 101 135 134 5 7 -69 -39 9507.90.70 Artificial baits and flies 48 82 164 152 7 ' 12 -123 -81 2004.90.90 Other prepared vegetables, frozen (8) (8) (9 (5) (5) ( 5) (5) (6) 0805.10.00 Oranges, fresh or dried 38 42 45 45 0 , 0 -8 -3 2207.20.00 Ethyl alcohol and other spirits, denatured (4) (4) (4)
(4) (4) (4) (4) (4) 7214.20.00 Concrete reinforcing bars 35 51 72 71 0 0 -37 -20 0714.90.40 Fresh arrowroot, salep, and Jerusalem artichokes (8) (8) (9 (8) (8) I (8) (8) (8)
Total 15,434 20,807 23,176 22,474 491 686 -8,233 -2,354
, Flanges correspond to the lower range and upper range of the CBERA Import supply elasticities, 2 and 5, that were used to make these calculations. 2, Values of HTS subheadings 0202.30.60, 0201.30.60, 0202.30.20, and 0202.30.40 were aggregated into one category to estimate the net welfare effects and are
reported on the line for HTS subheading 0202.30.60. 31Values of HTS subheadings 0804.30.40 and 0804.30.20 were aggregated Into one category to estimate the net welfare effects and -are reported on the line for
HIS subheading 0804.30.40. ' , Values of HIS subheadings 2207.10.60 and 2207.20.00 were aggregated into one category to estimate the net welfare effects and are reported on the line for
HTS,subheading 2207.10.60. 5I values of HIS subheadings 2401.10.60 and 2401.20.80 were aggregated into one category to estimate the net welfare effects and are reported on the line for
HIS subheading 2401.20.80. e'Values of HTS subheadings 0710.80.95 and 2004.90.90 were aggregated Into one category to estimate the net welfare effects and are reported on the line for
HTS 'subheading 0710.80.95. 7 'Less than $500. 8 'Not available.
Note-Because of rounding, figures may not add to the totals shown. Source: Estimated by USITC staff from official statistics of U.S. Department of Commerce, U.S. Department of Agriculture, and the U.S. Treasury,
1

1
The estimated range, of the effects of CBERA duty-free entry on the U.S. domestic shipments displaced by the CBERA imports, by HTS Subhead-ings, 1989
HTS Subheading No. Description
I ower ranae
Uoper range
Value Share of value Value .
Share of value
1
1,000 dollars percent
1,000 dollars percent
0202.30.60 Frezenboneless beef, except processeci2 1,621 .01 2,169 .02 0201.30.60 Fresh or chilled boneless beef, except processed (2) (2) (2) (2) 0804.30.40 Pineapples, in crates or- other packages3 636 -1.19 928 1.73 2207.10.60 Undenatured ethyl alcohol' 10,498 .73 14,425 1.00 8533.40.00 Electrical variable resistors • 272 :24 386 .34 8532.24.00 Cerarnic dielectric fixed capacitors 391 .12 486 .15 2402.10.80 Cigars, cheroots and cigarillos valued > 230 454 .49 580 .64 2009.11.00 Frozen orange juice, concentrated] 1,551 .14 2,208 '.20 2401.20.80 Tobacco, partly or wholly stemmed5 1,721 .12 2,321 .17 0710.80.95 Frozen Vegetables; n:e s ia 941 .17 1,297 .23 0202.30.20 Frozen, boneless, processed; high-quality beef (2) (2) (2) (2) 2401.10.60 • Cigarette leaf, not stemmed (5) (9 (5) (5) 2208.40.00 Rum and tafia 453 .43 591 .56 8533.21.00 Electrical fixed resistort 148 .04 175 .05 7213.31.30 Irregularly wound coils of hot-rolled rod 65 .02 110 • .03 7214.40.00 Hot-rolled bars and rods containing < .25% carbon 146 .03 218 .04 2009.20.40 Grapefruit Juice, concentrated 862 .30 1,107 .39 0802.90.90 Nuts, n.e.s.i. 21 .05 30 ,07 0202.30.40 Frozen, boneless, processed beef, except high-quality (2) (2) (2) ( 2) 0714.10.00 Cassaval(manioc), fresh or dried 131 8.18 171 10.71 0804.30.20 Pineapples, bulk (3) (3) (3) (3) 0810.10.40 Fresh strawberries, if entered from 9/16 - 6/14 10 (7) 11 (7) 2402.10.60 Cigars, cheroots and cigarillos valued > 15c and <23c 125 .14 161 :19 0603.10.60 " Roses, fresh cut 69 .04 98 :06 9507.90.70 Artificial baits and' flies 189 .17 337 .31 2004.90.90 Other prepared vegetables. frozen (6) (6) (6) (6) 0805.10.00 Oranges,, fresh or dried ' 15 .01 17 .01 2207.20.00 Ethyl alcdhol and other spirits, denatured (4) (4) (4) (4) 7214.20.00 Concrete; reinforcing bars 71 .01 104 .01 0714.90.40 Fresh arrowroot, salep, and Jerusalem artichokes (9 (8) (8) (8)
00
Table 3-6
TotaI - 20,388 27,930
1 Ranges correspond to the lower range and upper range of the CBERA import supply elasticities, 2 and 5, that were used to make these calculations. 2 Values of HTS subheadings 0202.30.60, 0201.30.60, 0202.30.20, and 0202.30.40 were aggregated into one category to estimate the the value of U.S'. ship-
ments that were displaced by CBERA imports and are reported on-the line for HIS subheading 0202.30.60. 3 Values of HTS subheadings 0804.30.40 and 0804.30.20 were aggregated Into one category to estimate the the value of U.S. shipments that were displaced by
CBERA imports and are-reported on the line for HTS. subheading 0804.30.40. 4 Values of HTS subheadings 2207.10.60 and 2207.20.00 were aggregated Into one category to estimate the the value of U.S. shipments that were displaced by
CBERA imports and are reported on the line for HIS subheading 2207.10.60. 5 Values of HTS subheadings 2401.10.60 and 2401.20.80 were aggregated into one category to estimate the the value of U.S. shipments that were displaced by
CBERA imports and are reported on the line for FITS subheading 2401.20.80. • 8 Values of HTS subheadings 0710.80.95 and 2004.90.90 were aggregated Into one category to estimate the the value of U.S. shipments that were displaced by
CBERA imports and are reported on the line for HTS subheading 0710.80.95. 7 Less than 0.005 percent. e Not available.
Source: Estimated by USITC staff from official statistics of U.S. Department of Commerce, U.S. Department of Agriculture, and the U.S. Treasury.

-
APPENDIX A FEDERAL REGISTER NOTICE AND LIST OF SUBMISSIONS

7_ I 70. 55. No, 14B I Monday, July 30, 1
/ Notices •
section 215(b) of the CDERA, the Commission in such reprots is required
- to assess the actual effect of the act on the United States economy generally as well as on appropriate domestic industries and to assess the probable future effect which the act will have on the United Slates economy generally and on such domestic industries.
INTERNATIONAL TRADE COMMISSION
[Investigation No. 332-2271
Annual Report On the Impact of the Caribbean Basin Economic Recovery Act on U.S. Industries and Consumers
AGENCY: United States International . Trade Commission. ACTION: Notice of deadline to submit comments in connection with 1909 annual report.
EFFECTIVE DATE: July 25, 1990. FOR FURTHER INFORMATION CONTACT: Paul R. Gibson (202-252-1270), Trade Reports Division, Office of Economics, U.S. International Trade Commission, Washington, DC. 20430, BACKGROUND: Section 215(a) of the Caribbean Basin Economic Recovery Act (CBERA) (19 U.S.C. 2704(a)) requires that the Commission submit annual reports to the Congress and the President on the impact of the act. The Commission instituted the present Investigation under section 332(b) of the Tariff Act of 1930 (19 U.S.C. 1332(b)) on March 21, 1988, for the purpose of gathering and presenting such information through 1995. Notice of Institution of the investigation and the schedule for such reports was published In the Federal Register of May 14, 1988 (51 FR 17878). The fifth report. covering calendar year 1989, is to be submitted by September 28, 19{3.
In the original notice of investigation, It was announced that, as provided in
WRITTEN SuBMISSIONS: The Commission does not plan to hold a public hearing in connection with the fifth annual report. However, interested persons are invited to submit written statements concerning the matters to be addressed in the report. Commercial or financial information that a party desires the Commission to treat as confidential must be submitted on separate sheets of paper, each clearly marked "Confidential Business Information" at the top, All submissions requesting confidential treatment must conform with the requirements of section 201.6 of the Commission's Rules of Practice and Procedure (19 CFR 201.0. All written submissions, except for confidential business information, will be made available for inspection by interested persons in the Office of the Secretary to the Commission. To be assured of consideration by the Commission, written statements relating to the Commission's report should be submitted at the earliest practical date and should be received no later than August 10,1990. All submissions should be addressed to the Secretary to the Commission, U.S. International Trade Commission, 500 E Street SW., Washington, DC 20438.
Hearing-impaired persons are advised that information on this matter can be obtained by contacting the Commission's TDD terminal on (202) 252-1809.
By order of the Commission. Issued: July 25, Me
Kenneth R. Mum Secretary. (FR Doc. 90-17725 Filed 7-27-6V. 8:45 am] BIUJNO COM 702042-44
A-2

SUBMISSIONS FOR THE RECO I INVESTIGATION NO. 332-277
Ann Ottoson ,King Leighton and Regnery on behalf of the American Cordage and Netting Manufacturers
Ann Ottoson King Leighton and Regnery on behalf of the Cordage Institute
Frances Seghers Executive Director, Motion Picture Export Association of America, Inc.
- - - -

APPENDIX B STATISTICAL TABLES
• _ _

Table B--1
•
Leading U.S. Imports for consumption entering duty-free under CBERA, In 1989, with corresponding commodity shares, by source _
(In thousands of dollars)
Country HTS No Description
1989 Duty-Free CBERA Imports
Share of 1989 CBERA Imports
Antigua 8804.00.00 Parachutes (including dirigible parachutes) 1,187 51.4
8903.91.00 Sailboats, with or without auxiliary motor 1,062 46.0
0807,10.70 Melons, n.e.s.I., fresh, If entered between
12/1 and 5/31 13 0.6
0807.10.50 Ogen and galla melons between 12/1 and 5/31 13 0.6
0807.10.60 Ogen and galla melons entered any other time 9 0.4
Total of items shown 2,284 99.0
Bahamas 2934.90.50 Nonaromatic heterocyclic compounds. 3,550 39.1
2937.22.00 Halogenated dervtives of adrnal cortical hormones 2,174 23.9
2937,99.50 Hormones and their derivatives, other steroids 743 8.2
2922.50,17 Aromatic dermatological agents 589 6.5
0509.00.00 Natural sponges of animal origin 499 5.5
Total of items shown 7,55$ 83.2
Barbados 8533.21.00 Electrical fixed resistors 6,429 36.6
8534.00.00 Printed circuits 4,038 27.2
2208,40,00 Rum and tafia 1,480 10.0
8531.90.00 Parts of electric sound or visual signaling appar 1,146 7.7
1703.10.30 Cane molasses for commercial extraction 550 3.7
Total of Items shown 12,643 85.1
Belize 2009.11.00 Orange Juice, concentrated 8,532 60,8
2009,20.40 Grapefruit juice, concentrated 3,281 23.4
1701.11.00 Cane sugar raw no flavoring/coloring 1,476 10.5
1703,90.50 Molasses n.e.s.1 370 2.6
0807.20,00 Papayas (papaws) fresh 67 0.5
Total of items shown 13,726 97.8
British Virgin
Islands 2208.40.00 Rum and tafia 123 89.1
7117.90.50 .... Imitation jewelry valued over $.20 per dozen 9 6.5
8421.99,00 .... Parts for filtering, or purifying gas 4 2.9
6914.90.00 .... Ceramic articles 2 1.5
Total of items shown 138 100.0
Costa Rica 0804.30.40 Pineapples, In crates or other packages 27,600 14.5
0202.30.60 Frozen boneless beef, except processed 25,235 13.2
0201.30,60 Fresh or chilled boneless beef, except processed 22,693 11.9
8534.00.00 Printed circuits 16,846 8.8
0302.69.40 Fish n.e.s.l. except fillet, livers and roes 10,002 5.2
Total of Items shown 102,376 53.7
Dominica 3401.11.50 Soap, n.e.s.I., organic surface-active products 577 68.4
2201.10.00 Water, mineral, aerated natural not sweetened 91 10.8
8438.90.90 Parts of machinery for Industrial preparation 84 9.9
- - -
8517.30.50 3401.19.00 ,
Electrical telegraphic switching apparatus .__ - ... Soap; organic surface-active products usd as soap -.-
- - - -- - -----
Total of Items shown
30 - - -- - 23
..3.6 2.7
805 95.4
Dominican
Republic 1701.11.00 Cane sugar raw no flavoring/coloring 72,768 24.3
9018.90.80 .... Instruments & appliances for medlcal,surgical use 25,851 8,6
7116.20,10 .... Jewelry of precious or semiprecious stones 17,231 5.8
0202.30.60 Frozen boneless beef, except processed 16,491 5.5
2402.10.80 .. „ Cigars, cheroots, cigarillos valued over $.23 15,109 5.1
Total of items shown 147,450 49.3
B-2

Table B-1-Continued
Loading U.S. Imports for consumption entering duty-free under CBERAc in 1989, with corresponding
commodity shares, by source
(In thousands of dollars)
Country HTS No
Description
1989 Share Duty-Free of 1989 CBERA CBERA Imports Imports
El Salvador .... 8532.24.00 1701.11.00
_ ..
.. Ceramic dielectric fixed capacitors
.. Cane sugar raw no flavoring/coloring 12,140 44.0 3,239 11.7
0202.30.60
.. Frozen boneless beef, except processed 2,052 7,4
0807.10.70 .. .. Melons, n.e.s.I., fresh, if entered 12J1 to 501 ,,,,,, _.i4,33_____ 5.2
- 07T0-.80,70 7. . -. - Ft7o-zein vegiatables n.e.s.I 1,338 • 4,9
Total of items shown 20,202 73.2
Grenada 8413.91.90
Parts of pumps, n.e.s.I 2,058 93.6
8533.90.00 .... Parts for electrical resistors, and rheostats 67 3.1
0302.69.40 .... Fish n.e.s.i. except fillet, livers and roes 23 1,0
8504.90.00
Transformer parts 22 1.0
2208.40.00
Rum and tafia 15 0.7
Total of Items shown 2,183 99.4
Guatemala .... 0202.30.60 .... Frozen boneless beef, except processed 15,819 14.1
1701.11.00
Cane sugar raw no flavoring/coloring 11,375 10.1
2401.10.60
Cigarette leaf, not stemmed 8,938 7.9
2933.19.25 • Aromatic or modified aromatic pesticides 8,007 7.1
2401.20.80 , Tobacco, partly or wholly stemmed 7,644 6.8
Total of items shown 51,783 46,0
Guyana 1701.11.00
Cane sugar raw no flavoring/coloring 2,081 75.2
2935.00,45
Other drugs of sulfnamide(excl anti-Infect agnts) 570 20.6
3307.10.20 .... Pre-shave & shaving preparations contain alcohol 109 3.9
4419.00.80
Tableware and kitchenware, of wood, n.e s I 6 0.2
0303.79.40 .... Fish, n.e.s.I., frozen, excluding flilets 2 0.1
Total of items shown 2,767 99,9
Haiti 9506.69.20
Baseballs and softballs 18,906 28.0
8536.90,00
Electrical apparatus n.e.s.l. for switching 16,644 24.6
8504.50.00
Inductors, n.e.s.1 4,360 6.5
8504.31.40 ., Electrical trnsfrmers, oth thn liquid dielectric 3,824 5.7
4818.50.00 .... Paper apparel and clothing accessories 2,390 3.5
Total of Items shown 46,124 68.3
Honduras 0202.30.60
Frozen boneless beef, except processed 11,207 21.3
0201,30.60
Fresh or chilled boneless beef, except processed 6,904 13.1
2402.10.80
Cigars, cheroots, cigarillos, valued over $.23 5,387 10.2
0807.10.20
Cantaloupes, fresh, entered between 9/16-7/31 5,053 9.6
9506,69.20 .... Baseballs and softballs 4,128 7.8
Total of items shown 32,679 62.1
Jamaica 2207.10.60
Undenatured ethyl alcohol 19,081 37,0
2208.40.00
Rum and tafia 4,942 9.6
2402.10.80 .... Cigars, cheroots, clgarillos, valued over $.23 4,890 9,5
2208.90.45
Cordials, liquers, kirschwasser and ratafia 4,177 8.6
0714,90,20 .... Fresh yams, whether or not sliced or pellets 3,821 7.4
Total of Items shown 37,153 72.1
Montserrat , 8538.90.00
Parts n.e.s.I., for use with electrical apparatus 87 90.6
0603.10.60
Roses, fresh out 9 9.4
Total of Items shown 96 100.0
B-3

Country NTS No
Neth. Antilles .. 8544.60.20 .... 7326.20.00 .., . 8504.31.40 .... 8524.21.30 .... 3507.90,00 ....
St. Kitts and Nevis 8503.00.40 ....
1701.11.00 .. , . 8504.31.40 .... 8504.31.20 .... 8525.10.20 ....
St. Lucia 8533.21.00 8532.29.00 .... 8518.50,00 .. , . 6307.90.40 .... 4823.90.85 ....
St. Vincent and the Grenadines .. 9506.51.40 ....
9506.69.20 9506.51,60 .... 0714.90.20 .... 0709.90.05 ....
Trinidad and Tobago 2905.11.20
7213.31.30 , ... 7214.40.00 .... 2306.20.00 , .. , 9021,21.40 ....
— - -
Table B-1—Continued
Leading U.S. Imports for consumption entering duty-free under CBERA, in 1989, with corresponding commodity shares, by source
(In thousands of dollars) -
1989
Description
Share Duty-Free CBERA Imports
of 1989 CBERA Imports
Insulated electric conductors n.e.s.I 877 34.7 Articles of iron or steel wire, n.e.s.I 483 19.1 Electrical trnsfrmers, oth thn liquid dielectric 458 18.1 Pre-recorded magnetic tapes, certain widths 308 12.2 Enzymes and prepared enzymes, n.e.s.I 100 4.0
Total of items shown 2,226 88.0
Parts of motrs under 18.65 w othr thn commutators 3,512 25.0 Cane sugar raw no flavoring/coloring 3,217 23.0 Electrical trnsfrmers, oth thn liquid dielectric 1,358 9.7 Unrated electrical transformers 1,297 9,2 Transmission apparatus for television 1,126 8.0
Total of items shown 10,510 74.9
Electrical fixed resistors 1,246 42.0 Fixed capacitor* n.e.s.I 1,122 37.8 Electric sound emplifier sets 179 6,0 Cords and tassels of textile materials 141 4.7 Articles of paper, paprbord and webs of cellulose 72 2.4
Total of iterni ihOwn 2,760 - 92.9
Lawn-tennis rackets, not strung 5,359 95.0 Baseballs and softballs 241 4.2 Parts and accessories of lawn-tennis rackets 17 0.3 Fresh yams, vvriether or not sliced or pellets 11 0.2 Jicamas, pumpkins and breadfruit 11 0.2
Total of items shown 5,639 99.9
Methanol (Methyl alcohol), other than imported 12,542 38.8 Irregularly wOund coils of hot-rolled rod 5,322 16.4 Hot-rolled berd'end rods containing < .25% carbon 3,657 11.3 Olicake and'othet solid residues 2,607 8.0 Artifical teeth and parts and accessories thereof 2,413 7,5
, Total of Iterns shown
26,541 82.0
Note.—Because of rounding, figures may not add to the totals shown.
Source: Compiled from official statistics of the U.S. Department of Commerce.
B-4

Table B-2 Twin Plants and 936-Financed Projects, 1989-90
Twin Plants, 1989
Company Country Investment Industry
Cape Red Textile Barbados 50,000 Apparel & Textile Products L.M. Industries Costa Rica 300,000 Apparel & Textile products Suttle Inc Costa Rica 400,000 Electric & Electronic American Home Products' Dominican Republic 1,600,000 Chemicals & Allied Products Bacardi Corp' Dominican Republic 1,000,000 Printing & Allied Products F.C. Industries Dominican Republic 250,000 Apparel & Textile Products Johnson & Jonhson Dental Dominican Republic 800,000 Chemicals & Allied Products P.R. Calcite Dominican Republic 538,000 Stone Products , Quest Corp' Dominican Republic 1,000,000 Electric & Electronic Signal Caribe Dominican Republic 500,000 Electric & Electronic Bacardi Corp' Dominica 0 Food Products Quest Jamaica 85,000 Electric & Electronic South Pacific Textiles Jamaica 1,000,000 Apparel & Textile Products
Total
7,523,000
936 companies.
Twin Plants, 1990
Company Country Investment Industry
Searle Pharmaceutical' Costa Rica 2,000,000 Chemicals & Allied:Products Diversey P.R. Inc. Dominican Republic 70,000 Chemicals & Allied I Products Five Star Fashion, Inc Dominican Republic 400,000 Apparel & Textile Products Four Star Industries Dominican- Republic 300,000 Apparel & Textile products G H, Bass (XT)' Dominican Republic 700,000 Leather & Leather 'Products Isabela Shoe (XT), Dominican Republic 500,000 Leather & Leather Products Maiden Form (XT)' Dominican Republic 1,000,000 Apparel & Textile Products Mindy Lee Corp. Dominican Republic 500,000 Apparel & Textile Products National Chains Corp Dominican Republic 150,000 Fabricated Metal Products Outdoor Footwear (XT)' Dominican Republic 1,500,000 Leather & Leather 'Products P.R. Desposable Safetywear Dominican Republic 300,000 Apparel & Textile Products Playtex Apparel Inc' Dominican Republic 800,000 Apparel & Textile Products Themoking Corp' Dominican Republic 2,000,000 Electric & Electronic Allergan, Grenada 600,000 Chemicals & Allied Products Guys Dolls •Haiti 500,000 Plastic & Rubber Products Telecom of Jamaica LTD Jamaica 22,000,000 Telecommunications Warner Lambert' Jamaica 50,000 Food and Kindred Products
,Total
33,370,000
936 companies.
Source: Fomento.
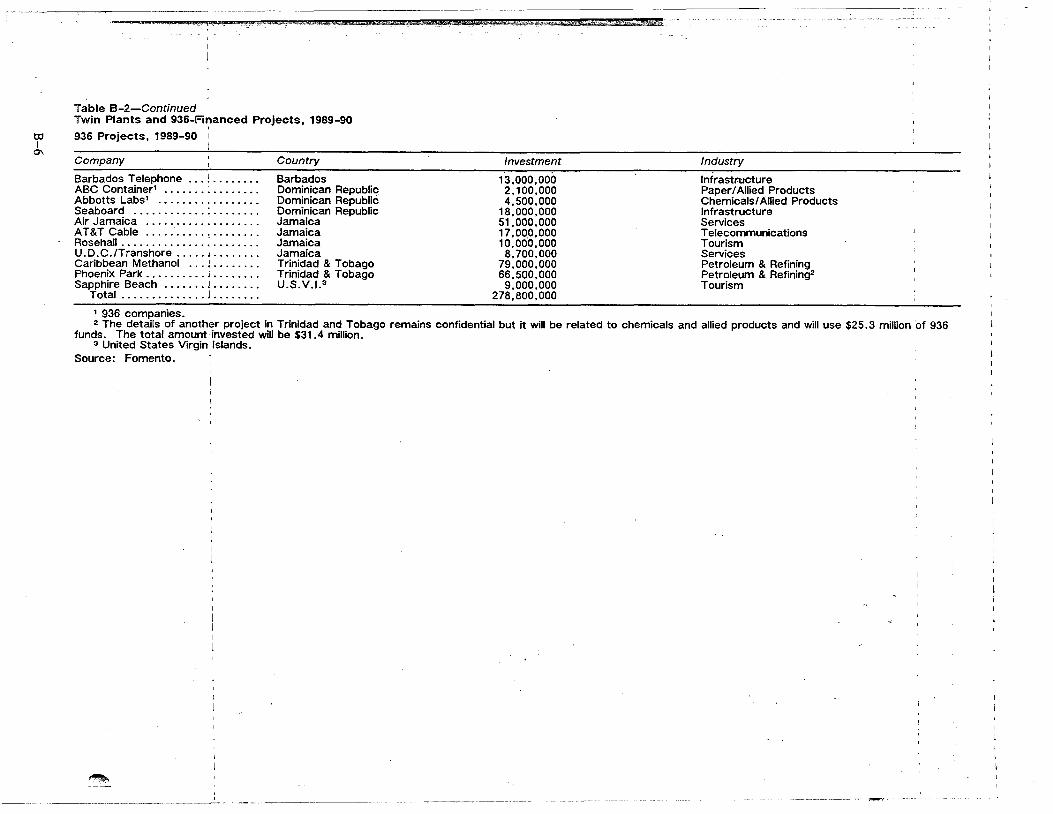
Table 6-2—Continued , Twin Plants and 936-Financed Projects, 1989-90
936 Projects, 1989-90
Company Country Investment Industry
Barbados Telephone Barbados 13,000,000 Infrastructure ABC Container' Dominican Republic 2,100,000 Paper/Allied Products Abbotts Labs' Dominican Republic 4,500,000 Chemicals/Allied Products Seaboard Dominican Republic 18,000,000 Infrastructure Air Jamaica Jamaica 51,000,000 Services AT&T Cable Jamaica 17,000,000 Telecommunications Rosehall Jamaica 10,000,000 Tourism U.D.C./Transhore Jamaica 8,700,000 Services Caribbean Methanol I Trinidad & Tobago 79,000,000 Petroleum & Refining Phoenix Park Trinidad & Tobago 66,500,000 Petroleum & Refining2 Sapphire Beach I U.S.V.1.3 9,000,000 Tourism
Total J 278,800,000
936 companies. 2 The details of another project in Trinidad and Tobago remains confidential but it will be related to chemicals and allied products and will use $25.3 million of 936
funds. The total amount invested will be $31.4 million. 3 United States Virgin Islands.
Source: Foment°.
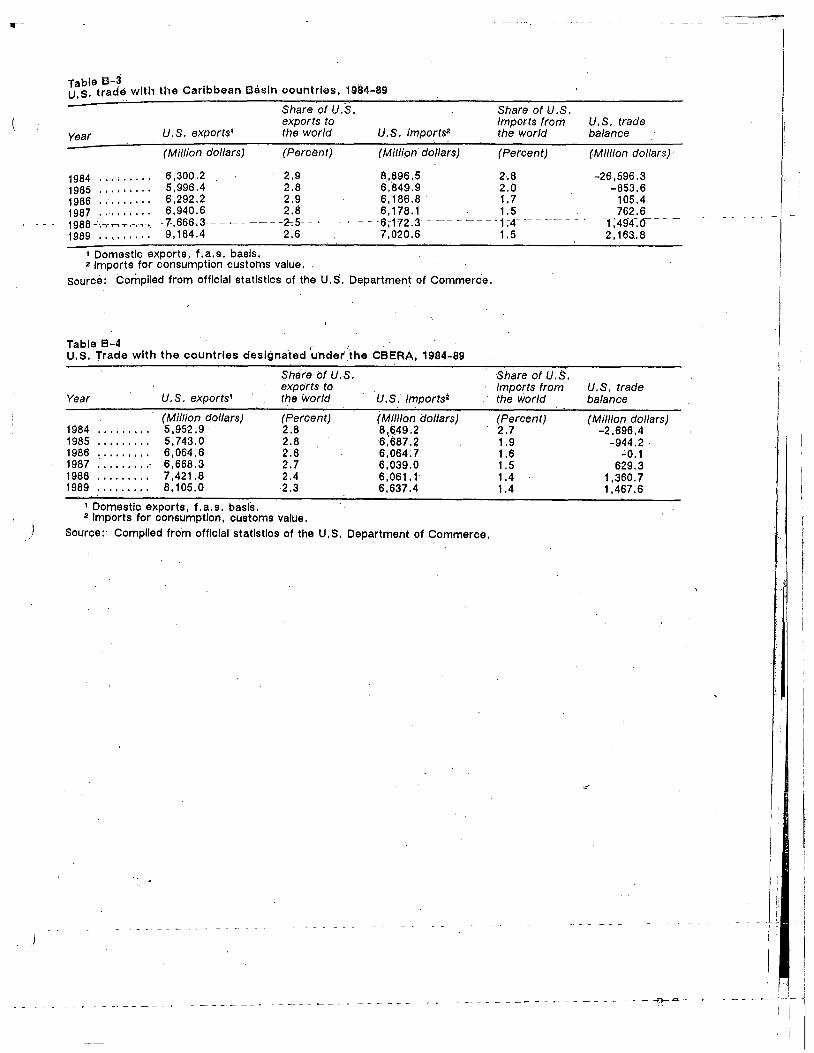
Share of U.S. exports to the world
Share of U.S. imports from U.S. trade the world balance Year U.S. exports' U.S. importsa
Share of U.S. Share of U.S. exports to imports from U.S. trade
Year U.S. exports' the world *U.S. imports the world balance
1984 5,952.9 2.8 8,649.2 1985 5,743.0 2.8 6,687.2 1986 6,064.6 2.8 6,064.7 1987 6,668.3 2.7 6,039.0 1988 7,421.8 2.4 6,061.1 1989 8,105.0 2.3 6,637.4
Domestic exports, f.a.s. basis. 2 Imports for consumption, customs value.
Source: Complied from official statistics of the U.S. Department of Commerce.
(Million dollars) (Percent) (Million dollars) (Percent) (Million dollars) 2.7 -2,696.4 1.9 -944.2 1.6 -0.1 1.5 629.3 1.4 1,360.7 1.4 1,467.6
Table B-3 U.S. trade with the Caribbean Basin countries, 1984-89
(Million dollars) (Percent) (Million dollars) (Percent) (Million dollars)
1984 6,300.2 2.9 8,896.5 2.8 -26,596.3 1985 5,996.4 2.8 6,849.9 2.0 -853.6 1986 6,292.2 2.9 6,186.8 1.7 105.4 1987 6,940.6 2.8
- • - 6,178.1
• 6,172.3 1.5
- '1.4' - 762.6
- - 1 494-.0- .-
1989 9,184.4 2.6 7,020,6 1.5 2,163.8
Domestic exports, f.a.s. basis. 2 Imports for consumption customs value,
Source: Compiled from official statistics of the U.S. Department of Commerce.
Table B-4 U.S. Trade with the countries designated under the CBERA, 1984-89

Table 13-5 U.S. imports for consdmption from CBERA countries of goods not eligible for duty-free treatment under CBERA, 1985-89
($1,000, customs value)
Product category 1985 1986 1987 1988 1989
• Percentage , change, 1989 over 1985 i
Petroleum and petroleum ;products 2,371,060 1,375,565 . 1,376,662 ' 1,058,524 1,044,432- :. (56.0)', . Textiles and apparel 648,969 827,108 1,148,432 1,488,812 1,753,055
170.1, 1 Certain handbags, luggage, and flatgoods 12,345 13,428 20,215 20,410 16,669
35A/1
Footwear 22,497 26,529 30,365 39,255 45,215
101-.0L i Work gloves 5,404 6,177 3,996 3,906 5,452
0.9 1 Certain leather apparel .1. 1,458 ' 1,832 2,348 3,386 11,279
673.4- i Tuna i 0 0 117 • 14 2
(2)'
i-
Total 3,061,733 2,250,640 2,582,135 2,614,307 2,876,103
(6.1)
1 Petroleum and petroleum products are HTS items 2709.00.10-2709.00.20, and 2710-.00.05-2710.00.45. Textiles are defined as HIS items 5005.00.00.90, 5006.00.00.90, 5007.10.60, 5007.90.60, 5101.21.60, 5101.29.60, 5101.30.60, 5102.10.90, 5105.10.00-5105.30.00, 5106.10.00-5109.90.60, 5111.11.10-5112.90.60, 5204.11.00-5208.29.80, 5208.31.40-5208.31.80, 5208.32.30-5208.39.80, 5208.41.40-5208.41.80, 5208.42.30-5208.49.80, 5208.51.40-5208.51.80, 5208.52.30-5209.29.00, 5209.31.60-5209.39.00, 5209.41.60-5209.49.00, 5209.51.60-5212.25.60, 5306:10.00-5306.20.00, 5308.20.00, 5308.90.00, 5309.21.20-5309.29.40, 5311.00.20-5311.00.40, 5401.10.00-5403.49.00, 5404.10.20-5408.34.90, 5501.10.00-5516.94.00, 5601.10.10-5601.22.00, 5601.29.00.20-5606, 5607241.30, 5607.49.15-5609.00.40, 5701.10.16-5701.90.20, 5702.10.90.10-5702.10.90.30,5702.31.10-5702.32.2O, 5702.39.20:10, 5702.41.10-5702.49.10, 5702.51.20-5702.59.10, 5702.91.30-5702.99.10, 5703.10.00-5704.90.00, 5705.00.20, 5801.10.00-5801.90.10, 5801.90.20.90-5802.19, 5802.20.00.20-5802.20.00290, 5802.30.00.20-5803.90.30.00, 5803,90.40.90, 5804.29.00.20-5804.29.00.90, 5804.30.00.20-5804.30.00.90, 5805.00.25-5806.10.20, 5806.10.30.20-5806.39.20.100, 5806.39.30.20-5807.90.20.90, 5808.10.20.10, 5808.10.30.10-5811.00.40.00, 5901.10.10-5903.10.10, 5903.10.18-5903.20.10, 5903.20.18-5903.90.10, 5903.90.18-5903.90.30, 5905.00.90, 5906.91.10-5911.20.10,*5911.20.30-5911.90.00, 6001.10.20-6001.92.00, 6001.99.00.90-6002.93.00:80, 6002.99.00.90, 6301.10.00-6301.90.00, 6301.90.00.30-6302.22.20.30, 6302.29.00.20-6302.39.00.10, 6302.39.00:30-6302.93.20.00, 6304.99.60.10-6304.99.60.20, 6304.99.60.40, 6304.19.30.40-6304.91.00.50, 6304.91.00.70-6304.93.00.00, 6304.99.15-6304.99.20, 6304:99.60;10-6304.99.60.20, 6304.09.60.40, 6305.20.006307.90.75, 6307.90.90-6309.00.00, 6310.10.10, 6310.90.10, 9404.90.10, 9404.90.20, 9404.90.80,9404.90.90. -Apparel are HTS items, 3926.20.50.50, 4015.90.00.+50, 4203.10.40, 6101.90.00.30-6102.90.00.15, 6102.90.00.25-6103.19.40.50, 6103.19.40.70-6103.29.10.60, 6103.29.20,30, 6103.29.20.36, 6103.29.20.42, 6103.29.20.50-6103.49.30.14, 6103.29.20.54-6103.29.20.62, 6103.29.20.66-6103.29.20.74, 6103.29.20.82-6103.39.20.30, 6103.49.30.18-6103.49.30.38, 6103.49.30.40-6104.19.20.60, 6104.19.20.80-6104.29.20.14,6104.29.20.18-6104.29.20.26, 6104.29.20.30-6104.29.20.38, 6104.29,20.42-6104.29.20.50, 6104.29.20.53-6104.29.20.60, 6104.29.20.64-6104.29.20.78, 6104.29.20.82-6104.39.20.30, 6104.39.20.50-6104.49.00.30, 6104.49.00.50-6104.59.20.30, 6104.59.20.50-6104.69.30.14, 6104.69.30.18-6104.69.30.26, 6104.69.30.30-6105.90.30.30, 6105.90.30.50-6106.90.20.30, 6106.90.20.50-6107.12.00.20, 6107.19.00.20-6107.29.20.00, 6107.29.40.20-6107.99.20.00, 6107.94.40.20-61.08.19.00.10, 6108.19.00.30-6106.22.00.30, 6108.29.00.20-6108.39.10.00, 6108.39.20.20-6108.99.20.00, 6108.99.40.20-6109.90.15.40, 6109.90.20.15,. 6109.90.20.30-6110.90.00.14, 6110.90.00.18-6110.90.00.30, 6110.90.00.36-6110.90.00.51, 6110.90.00.60-6110.90.00.78, 6110.90.00.84-6111.90.50.40, 6111.90.60.20-6112.19.10.60, 6112.19.20.20-6112.19.20.30, 6112.19.20.50-6122.19.20.60, 6112.19.20.80-6112.49.00.20, 61.13.00.00.15-6114.30.30.70, 6114.90.00.10, 6114.90.00.20, , 6114.90.00.30, 6114.90.00.40-6114.90.00.55, 6114:90.00.65-6115.19.00.20, 6115.19.00.40-6115.20.00.10, 611.5.20.00.30-6115.99.18.00, 6115.99.20.20, , 6116.10.35.30, 6116.10.45.10-6116.10.45.30, 6116.90.90.10, 6116.90.90.20, 6116.90.90.30, 6116.91.00, 6116.92.20.50-6116.92.30.00, 6116.93.15, 6116.93.20.20, 6116.99.60.20, 6116.99.60.40, 6116.99.60.50-6117.10.20.00, 6117.10.60.10, 6117.10.60.20, 6117.20.00.30, 6117.20.00.50-6117.80.00.35, 6117.80.00.50-6117.90.00.14, 6117.90.00.18-6117.90.00.26, 6117.90.00.30-6117.90.'00.36, 6117.90.00.40-6117.90.00.46, 6117.90,00.50-6117.90.00.56, 6117.90.00.60, 6201.19.00.50-6201.99.00.30, 6201.99.00.50-6202,99.00.30, 6202.19.00.10, 6202.19.00.20, 6202.19.00.30, 6202.99.00.50-6203.29.20.60, 6203.29.30.20, 6203.29.30.28,.6203.29.30.40, 6203.29.30.60, 6203.29.30.80, 6203.31.00-6203.39.20, 6203.39.40.10, 6203.39.40.20,6203.39.40.30, 6203.39.40.50-6203.49.30.30, 6203.49.30.40-6203.49.30.45, 6203.49.30.60-6204.19.30.60, 6204.19.30.60-6204.19.30.60, 6204.19.30.80-6204.29.40.14, 6204.29.40.18-6204.29.40.26, 6204.29.40.30-6204.29.40.38, 6204.29.40.42-6204.29.40.50, 6204.29.40.42-6204.29.40.50, 6204.29.40.54-6204.29.40.62, 6204.29.40.54-6204.29.40.62, 6204.29.40.66-6204.39.40.30, 6204.39.40.50-6204.41.20.20, 6204.42.20-6204.42.30, 6204.43.20-6204.43.40, 6204.44.30-6204.44.40, 6204.49.00.10, 6204.49.00.20, 6204.49.00.30, 6204.49.00.50-6204.51.00.20, 6204.52.20, 6204.53.20-6204.53.30, 6204.59.20-6204.59.30, 6204.59.40.10, 6204.59.40.20, 6204.59.40.30, 6204.59.40.50-6204.62.20.50, 6204.62.40-6204:63.15, 6204.69.30.50, 6204.69.30.70, 6204.69.90, 6205.10.20, 6205.20.20, 6205.30.15-6205.30.20, 6205.90.20.10, 6205.90.20.20, 6205.90.20.30, 6205.90.20.50-6206.10.00.30, 6206.10.00.50, 6206.20.20-6206.20.30, 6206.30.20-6206.30.30, 6206.40.20-6207.11.00, 6207.19.00.10, 6207.19.00.30-6207.29.00.10, 6207,29.00.30-6207.99.40.00, 6207.99.60.20, 6207.99.60.40-6208.19.20.00, 6208.19.40.20-6208.29.00.10, 6208.29.00.30-6208.99.20.20, 6208.99.60.20, 6208.99.60.40-6209.90.30.40, 6209.90.40.20-6211.11.20.20, 6211.11.20.40-6211.12.30.05, 6211.12.30.25-6211.33.00.60, 6211.39.00.20-6211.43.00.90, 6211A9.00.20-6212.10.10.20, 6212.10.10.40-6212.10.20.2, 6212.10.20.40-6212.90.00.40, 6213.10.20-6213.90.20,-6214.10.20.00-6215.10.00.25, 6215.10.00.90-6215.90.00.20, 6216.00.25.30, 6216.00.30.10-6216.00.30.401, 6216.00.38.20, 6216.00.48.20-6216.00.48.45, 6216.00.50.00-6217.10.00.30, 6217.10.00.50-6217.90.00.10, 6217.90.00.20-6217.90.00.35, 6217.90.00.45-6217.90.00.60, 6217.90.00.70-6217.90.00.85, 6217.90.00.95, 6501.00.90, 6502.00.90.30, 6503.00.90, 6504.00.30, 6504.00.60, 6504.00.90.15, 6504.00.90.60, 6506.10.60, 6506.91.00, 6506.99.00, 6507.00.00. Handbags, luggage and flatgoods are HTS items 4202.11.00-4202.22.15, 4202.22.40-4202.22.60, 4202.22.80, 4202.29.00, 4202.31.60, 4202.32.40, 4202.32.95, 4202.91.00-4202.92.45, 4202.92.60-4202.99.00, 4602.10.21, 4602.10.22, 4602.10.25, and 4602.10.29. Footwear are HTS items 6401.10.00-6402.20.00, 6402.30.30-6405.20.90.90, 6405.90.90-6406.10.50,
1—Continued 6406.10.75-6406.10.80, and 6406.99.15. Work gloves are HTS Items 4203.29.08, 4203.29.18, 6116.10.15, 6116.10.25, 6116.10.35.10-6116.10.35.40, p116.92.20.10-6116.92.20.40, 6116.93.20.10, 6216.00.15, 6216.00.20, 6216.00.25.10, 6216.00.25.25, 6216.00.25.40, 6216.00.38.10, 6216.00.48.10, 6216.00.46.35. Certain leather apparel is HTS item 4203.10.40. Tuna Is comprised of HTS items 1604.14.10, 1604.14.20, and 1604.14.30.
.g Not applicable. Note.—Figures for 1985-88 under the HTS classification system are estimated. Note.—Because of rounding, figures may not add to totals given. Source: Compiled from official statistics of the U.S. Department of Commerce.

APPENDIX C TECHNICAL NOTES TO CHAPTER 3

Technical Notes
The CBERA has been in effect since 1984, therefore the current level of imports from CBERA beneficiary countries contains the effects of the duty-free treatment. The welfare effects of CBERA in 1989 are analyzed by examining the net-welfare cOsts that would result from the elimination of the duty-free treatment.1 The model used in this report is similar to the model described in the third CBERA report.2
The Model
The removal of CBERA duty-free treatment is analyzed in a partial equilibrium framework. Imports from CBERA beneficiary countries, imports from non-CBERA countries, and competing domestic output are assumed to be imperfect substitutes for each other.3 Therefore, each of the three products is characterized by a separate market where differing equilibrium prices can exist. The three markets are depicted in figure C-1. In each of the three diagrams, C—la, C—lb, and C-1c, the vertical axis measures price, and the horizontal axis measures the physical quantity of the product.
It is assumed that the CBERA import supply curve to the U.S. market is upward sloping. This is shown by the curve S c .. (Henceforth, the subscripts c, n, and u refer to CBERA imports, non-CBERA imports, and U.S. output, respectively.) As noted by Rousslang and Lindsey (1984), it is customary to assume that import supply curves are perfectly elastic, or horizonta1.4 However, in the case of CBERA imports, this assumption is inappropriate because the CBERA countries export a substantial portion of their production to the United States. Therefore, they have few opportunities to divert sales from other markets to the U.S. market in response to an increase in U.S. demand.
On the other hand, it is assumed that the supply elasticity for the competing domestic industry is perfectly elastic. This is shown by curve S u in figure C-1c. This assumption has been made so as to estimate the maximum possible effect of the CBERA on domestic production.s
In addition, it is assumed that the non-CBERA import supply curve is perfectly elastic. This is shown by the curve S in figure C—lb. This assumption is made since non-CBERA countries export a smaller proportion of their total production to the United States than do CBERA countries. Therefore, the import supply curve for non-CBERA countries would be more elastic than the import supply curve for CBERA countries.
It is assumed that the CBERA and non-CBERA import demand curves, D and D,,, and the demand curve for the domestic competing output, D u , are all downward sloping.
In addition, it is assumed that an existing ad valorem tariff, t, is in place for non-CBERA imports. This is shown in figure C-lb by the supply curve, S'n, where the relation between the nontariff and tariff equilibrium prices, Pn and P' u, is P' n = P n (1 + t).
' A similar approach is taken by Mendez and Murray in analyzing the effects on less developed countries (LDCs) under special tariff provisions of the United States. Jose Mendez and Tracy Mtirray, "LDC Benefits under Special Tariff of the United States: A comparison," USITC, Office of Economics, Unpublished mimeograph, July 11, 1988.
2 See USITC, Third CBERA report, pages B-1-B-7, for a more in depth discussion of the methodology used in this report. _
° Imperfect substitutability betweenimports and competing-domestic output is-a-sra-ndaYd aisumption - from 33ne- 01 -the -t*- ci bas - models that have traditionally been used to analyze the effects of tariff
reductions. See R. E. Baldwin, "Trade and Employment Effects in the United States of Multilateral Tariff Reductions," American Economic Review, Papers and Proceedings, 66:142-148, 1976, for further discussion.
Donald Rousslang and John Lindsey, "The Benefits of Caribbean Basin Countries From the U.S. CBI Tariff Elimination," Journal of Policy Modeling, 6(4): 513-530 (1984).
5 A similar assumption is made by Richard Boltuck, Jose Mendez, Tracy Murray, and Donald Rousslang, "The Trade Effects of Repealing the U.S. OAP," USITC, Office of Economics, unpublished mimeograph, 1988.

Qc Quantity
S.
Sn
. • Dn D'n
Q'n. Quantity on
Figure C-1 Partial equilibrium analysis of the effect of removing CBERA duty.free privileges on U.S. Imports from CBERA beneficiaries, U.S. Imports from competing non-CBERA countries, and competing domestic industries
Price Price
- -
Pn
0
a. US market for CBERA imports b. US market for non-CBERA imports
Price
0 qu Quantity
c. US market for the competing domestic industry
C-3
Li

--- - - With an increase in the price of CBERA imports, the demand curves for both
non-CBERA imports and domestic output, D n and D u , shift out to D' n and D' respectively. Since the supply curves in both these markets (figs. C-lb and C-1c) are perfectly elastic, the equilibrium prices do not change. The equilibrium quantity supplied in each market increases from Q n and Q u to Q' 0 -and Q"-u,- respectively.
With an increase in the price of CBERA imports, the demand curves for both non-CBERA imports and domestic output, D 0 and D u , shift out to D' n and D' respectively. Since the supply curves in both these markets (figs. C-lb and C-1c) are perfectly elastic, the equilibrium prices do not change. The equilibrium quantity supplied in each market increases from Q n and Q u to Q' n and Q' u , respectively.
The increase in the tariff for CBERA imports causes the tariff revenue collected from CBERA imports to increase. This is measured by the area of the rectangle P "acP ' in figure C-la. In the U.S. market for CBERA imports, there is also a simultaneous decrease in consumer surplus. This is measured by the trapezoid P" c abP
In addition, since the level of U.S. imports from non-CBERA countries increases in figure C-lb, the tariff revenue collected from these imports also increases. This amount is measured by the rectangle efgh in figure C-1b. There are no corresponding changes in tariff revenues or consumer surplus in the market for competing domestic output. However, it is passible to measure the amount by which U.S. output displaces CBERA imports. This is measured by the rectangle Q u ijQ u ' in figure C-1c.
The net-welfare cost of eliminating the duty-free treatment granted CBERA imports is the balance of the increase in tariff revenue and the decrease in consumer surplus. This balance is the sum of the rectangles P dcP' and efgh in figures C-la and C-lb, respectively, minus the triangle abd in figure C-la.
,Description of Data
Import data were taken from official statistics of the U.S. Department of Commerce. The dollar estimates of consumer surplus and tariff revenues that were presented in the text of chapter 3 and the average ad valorem tariff rates discussed above were calculated from 1989 U.S. import data for CBERA and non-CBERA imports aggregated at the eight-digit HTS (Harmonized Tariff Schedule) level.
The calculations for the price elasticity of CBERA import demand, the cross elasticity of demand between non-CBERA and CBERA imports, and the cross elasticity of demand between U.S. domestic output and CBERA imports used in this analysis, were made from the import data described above; domestic-shipment data estimated by the staff of the USITC, and aggregate import-demand elasticities that were reported in 'the literature.6
Finally, as noted by Rousslang and Lindsey, it is extremely difficult to obtain reliable estimates of import-sppply elasticities. For the CBERA import-supply elasticity, this report used the range suggested by Rousslang and Lindsey, 2 to 5.7 Therefore, calculations of net-welfare effects and the displacement of U.S. domestic output by CBERA imports are presented in ranges corresponding to the two supply elasticities.
_
The aggregate import demand elasticities were taken from Robert E. Baldwin, U.S. Tariff Policy: Formation and Effects, U.S. Department of Labor, Discussion Paper, June 1976. The derivation of the cross price elasticities of demand used in this analysis are discussed in further detail in the Third CBERA Report.
7 Rousslang and Lindsey, U.S. CBI Tariff Eliminations, p. 522.
C-4
