márk jukics impact of the internet on globalization
TRANSCRIPT

Márk Jukics
IMPACT OF THE INTERNET ON GLOBALIZATION
Industrial Internet
Bachelor’s Thesis
CENTRIA UNIVERSITY OF APPLIED SCIENCES
Industrial Management
February 2016

ABSTRACT
Unit
Ylivieska
Date
February 2016
Author
Márk Jukics
Degree programme
Industrial management
Name of thesis
Impact of the internet on globalization – Industrial Internet
Instructor
Sakari Pieskä
Pages
30+2
Supervisor
Marjo Heikkilä
The thesis consists of two main parts. The first part is the theoretical framework, the second
part is about assisting in a project of Centria University of Applied Sciences.
The theoretical part of the thesis expounds the evolution and the benefits of the industrial
internet. It explains the roots of globalization, internet, and industries. Lean manufacturing
and management is also involved in the theory, as this way of management is successfully
spreading by the help of globalization. In Lean management, visual guidance is essential, as
well as in the university project work.
My thesis work is involved in a project of Centria University of Applied Sciences, to help
local Finnish companies implement the industrial internet. The purpose of my thesis is to
work out a plan for visualization of data and the implementation using my experiences.
These companies are going to use, so called info monitors for the visual guidance, and its
role is explained in the thesis.
The sample case in the thesis was made based on my experiences, to show an example of a
company’s usage of visualization. It is not the final outcome of the project, because the
project lasts until 2018.
Key words:
Globalization, Industrial Internet, Lean, Visualization
CONTENTS
1. Introduction 1
2. Historical roots 3
2.1 Roots of Globalization 3
2.2 Roots of the Internet 6
3. Rapid growth of the internet in industries 8
3.1 Industrial revolutions 8
3.1.1 First wave: Industrial Revolution 8
3.1.2 Second wave: Electric Revolution 9
3.1.3 Third wave: Digital Revolution 9
3.2 Industry 4.0 10
3.3 Impact of Industrial Internet on industries 12
4. Lean 16
5. Visualization of data 18
5.1 Info monitor in visualization 18
5.2 Sample case 19
5.2.1 Calculations behind visualization 19
5.2.2 Implementation 20
5.2.3 Visualization with graphs 22
6. Conclusion and Discussion 27
References 29

1
1. INTRODUCTION
The reason for choosing industrial internet within globalization is partly because
of my studies in Industrial management and partly because of my experiences
during the professional internship at a multinational company.
The purpose of this thesis is to present the importance and the influence of the
internet on industries. Internet is mostly considered as a tool for entertainment
and communication, which is also true, but it has advanced to a level where it can
be used for greater purposes. Connecting internet with machines and internet-
based tools for analyzing and visualizing will result increased productivity,
reduced costs, downtime, and waste. Elevating connectivity to a higher level, for
example factory level, will result in smart factories.
Implementing this high level of technology to industries is considered the fourth
industrial revolution, a.k.a. Industry 4.0. In order to completely understand how
the technology evolved to this level, and why it is so important, the thesis
demonstrates the historical roots of globalization, internet, and the industrial
revolutions.
In the second part of the thesis the focus is on the industrial internet itself, and the
university project which I am participating in, because it is closely related to my
thesis.
The project began, because several companies realized, that in order to grow, they
need to improve their production, management, and reduce costs, and unplanned
downtimes. The main problem is that their management is still paper-based, so
every information is printed on papers and presented to employees on paper. In
cooperation with these companies, Centria University of Applied Sciences is
working on couple of projects about industrial internet. The one I am
participating in is about implementing info monitors for the companies who are
still using paper-based information. The main challenges are the visualization and
2
implementation of the monitors. The aim is to create a prototype using existing
software, but because of the limited resource of IT employees, the final version of
info monitor software will be created by a third party company. Furthermore, if
any employee of the university decides to establish a company, the software will
be free-to-use for him/her.
The second project about Industrial Internet is called I3 – Innovation & Industrial
Internet. The aim of this research and development project is to innovate and
support the usage of modern technology of small and medium sized enterprises
in the region. The three main tools of this project are digitalization, industrial
internet, and open innovation. Digitalization allows companies to improve their
management operations by digitalizing the documents, thus making it easily
available inside the company. Industrial internet means the “communication” of
the machines, uploading sensor data to cloud servers, and analyzing this data.
The potential of innovation is always growing and it should be always kept in
mind.
The project is funded by European Union Development Funds, and other
international funds. 10 university employees are involved in this particular
project, and it is planned to last 3 years, finishing in the year of 2018.
My role in the project is to assist the visualization and suggest ideas for
implementation. Due to the fact that I am graduating in March 2016, I cannot
participate in the actual finalizing and implementation, but I would like to think
that my thesis work was useful for the improvement of these companies.

3
2. HISTORICAL ROOTS
2.1 Roots of Globalization
The globalization has very strong historical roots. It was here for long time and it
is still evolving. Global capitalism pressures the nations for convergence and
nations somehow embrace globalization, so the differences would wash away, and
there would not be different cultures, no difference in the way of a firm’s work,
only one huge global market. But the history shows that this was never every
nations aim. The globalization, historically meaning, never contained every single
nation, that is a new project.
(Jones, Abdelal & Kirby 2008)
It is argued that stretching the roots of globalization too far in the past is useless
for political analysis, but anyway it started somewhere, and to see the start, we
have to go back few millenniums B.C. An early form of global trade was linked
between Sumer and the Indus Valley Civilization; this was the theory of an
economist, Andre Gunder Frank. An American journalist, columnist and author,
Thomas L. Friedman, created a very interesting division about the periods of
globalization. According to him, there are 3 periods of globalization, the first
period (1492-1800) involved the globalization of countries, the second one (1800-
2000) the globalization of companies, and the third (2000- ) involves the
globalization of individuals.
(Frank 1998)
Throughout the history the great empires, like the Roman Empire or Greece with
huge territories, made trades with commercialized urban centers, and the trade
links between them and Han dynasty assisted to create the Silk Road, which is
probably the most known early form of globalization. Later the Muslims also
influenced the shaping of globalization with the Islamic Golden Age.

4
(Waugh & Lee 2016)
The so-called ‘proto-globalization’ began at the times of Friedman’s 1st period of
globalization, when Europe was reigned by maritime empires. In this era, the first
multinational corporation was created, the British East India Company.
Colonization helped the empires to create a still early, but significantly more
effective form of globalization.
The Age of Discovery opened a new door to the development of globalization.
Trading has begun between Eurasia, Africa and the New World. International
business centers were introduced to the global trading; the enormous exchange of
foods, human population including slaves, animals was the most significant global
event in history.
(McNeill 2016)
The next era of globalization included industrialization, cheap production,
economies of scale, rapid growth of population, thus grow of demand.
The globalization was torn apart by the 2 world wars. At these times, people
thought that only the businesses have benefit from globalization, and it does not
have social benefit, but it does have. So they created markets especially for
avoiding globalization, every nation had its own capitalism. Later, nations started
to trade internationally, but tried to keep their own form of capitalism. But as the
beginning of a new globalization started to take shape, restrictions were slowly
removed about the free movement of goods and services. They created some
distributional politics for other countries. The extent of the market produced
division of labor. It had a fundamental impact on work, societies and economies
started to converge. The biggest transformation of this era of globalization is
China.
We have to admit, despite all the negative reputation of Soviet Union, they are
also responsible for partly creating the country, which now has the biggest

5
influence in globalization on the world, and as previously mentioned, had the
biggest transformation of this era, China. Without the Soviet Union there would
not be communist China, or People’s Republic of China, because the influence
made by soviets resulted this previously isolated country to open up. When China
recognized that ancient traditions did not succeed in 20th century, they begin to
use the university model from Germany, industry and military model from the
USA and Britain, and political model from Russia. In some cases, we can still call
this country isolated. Political leaders still want the complete control over the
country, so they still have a lot of regulations, restrictions. There are many similar
countries, maybe not with so strong regulations, but even nowadays it would still
be impossible to make the world homogenous. The world gets more and more
acceptable with other cultures, as they are mixing within countries, and people get
more enlightened, because using the internet it is possible to see and read literally
everything.
(Jones, Abdelal & Kirby 2008)
Nowadays globalization is represented by huge multinational companies and
their global products, but in fact, globalization is about how every country is
trying to adapt similar or almost same products, firms, and operation of the firms
to match a certain international standard. It means that in very many countries
certain products and services are extremely similar, even if the countries are far
from each other. So in this point of view, globalization is also about how small
firms are implementing the management methods of popular, successful
companies. The best example is the lean manufacturing, which is evolved from
Toyota production system, but nowadays it is used by almost every large
manufacturing company, and even by smaller companies in many cases. Lean
manufacturing is further explained in the 4th chapter of the thesis.
In the case of this thesis, the focus is on small local Finnish companies and how the
project is going to help them to implement operations which are globally used.

6
Visualization of data is still a new way of managing a company, but there is a
huge potential, because many of those small local companies are still using paper-
based information. With visualization, the leaders of those companies are not only
capable of monitoring the operations from the office, or production site, but also
from the other side of the world.
2.2 History of the internet
Internet has revolutionized the information technology and communications in a
way that was never experienced before. The internet is world-wide mechanism for
interaction between people and their computers without the regard of geographic
location. It is the example of what a very successful research and development
program can achieve.
(Leiner 2016)
It basically means that every single person, who can access the internet, is or can
be connected anytime, anywhere, or can access any kind of information or service
using a computer, smartphone or tablet. This provides a huge rise to commerce,
trade, thus helping the globalization.
It all started with creating electronic computers in 1950s. The first concept was to
connect the computers locally, within a few computer science laboratories. The
first message between two networks was sent from a computer in UCLA
(University of California), to SRI (Stanford Research Institute) using ARPANET.
Similar networks are: NPL network, CYCLADES, Merit Network, Tymnet,
Telenet. These networks used communication protocols. The modern internet
began to take shape in 1980s. ARPANET and the similar networks were
decommissioned. Commercial internet providers were taking their place,
providing internet for anyone. GRAPH 1. (see below) shows the growth of the
internet users over the years.
(Yates 1997, 126-146.)

7
GRAPH 1. Internet users in the world (Dye 2014)

8
3. THE RAPID GROWTH OF THE INTERNET USAGE IN INDUSTRIES
We live in a world where almost half of the population of planet Earth is
connected. That connection is provided by the internet, according to statistics by
June 2015 there were more than 3.2 billion users, and nowadays we take it for
granted, but there is a very good reason for that. In the following sections I shall
demonstrate how factories started mass production, and how they changed as
technology improved, and how they try to master the perfection of
manufacturing, professional knowledge, safety, and reducing waste.
3.1 Industrial revolutions
3.1.1 First wave: Industrial Revolution
The first industrial revolution took place in 18th and 19th centuries. Before the
industrialization people manufactured their own everyday things by themselves
or bought it from someone who made it in his/her own home. The incomes and
the quality of life were low; the manufacturing processes were slow and old-
school.
Thanks to the new innovations, like steam engines, producing became cheaper,
easier, and faster. This led to mass-production and improvements in other fields.
For example the cheap production of iron and steel resulted in manufacturing
vehicles, buildings, infrastructure from iron and steel. Steam engine powered
locomotives, ships, machinery which caused a revolution in transportation as well.
Other innovations helped to improve banking and communication, and all of
these innovations together helped the economic growth, increased number of
workplaces and wages, thus a better quality of life.
(History.com 2009)

9
3.1.2 Second wave: Electric Revolution
In the times when electricity was not publicly available, electricity powered
production was a huge step towards modern production and towards providing
public electricity to people. For constructing buildings, ships and railroads they
started to use steel instead of iron, to make it cheaper, and further improving the
transportation.
The list of new innovations contains light bulb, telephone, public automobiles, and
other great inventions.
(Mingay 1986, 25.)
3.1.3 Third wave: Digital Revolution
The third industrial revolution is called Digital Revolution, because analog,
mechanical technology was replaced by digital technology, and many workers
were replaced by machines. Factories started to use computers for information
recording, keeping, handling, and analyzing. The early inventions led to
nowadays technologies, cellphones and computers were invented; much further
improving production and the management of workplaces. Mass production is
nearly as perfect as possible, the production technologies are advanced, the
production sites are safe and clean, and most of the data is digitized. There are
thousands of corporate software, and hundreds of computers are used in the
offices of multinational companies connected with internet. There are no factories
which operate without internet; it connects everybody and everything, anywhere.
Nowadays we are still in this phase, but because of the enormous growth of
internet usage and the need of data analyzing, we are slowly getting into another
revolution, which puts the corporate internet and data analyzing to another level.

10
3.2 Industry 4.0
Industry 4.0 is called the fourth revolution, because it will transform nowadays
technologies into even more advanced ones. It will create smart factories,
products, and for example hospitals. Industry 4.0’s “device” is industrial internet,
which contains mass-data analyzing, info-monitoring systems for the acceleration
of the productivity, and reducing inefficiency.
Industrial machines are going to become intelligent, as they are going to be
provided by digital instrumentation. The costs of these machines will be
affordable, due to decreased costs of instrumentation. Thanks to advanced
computer chips, and advanced analytical software tools, the machines will
compute, analyze and visualize huge amount of data created by the machines. The
key of industrial internet is to understand the “intelligent information” and the
ability to make decisions even in real-time, if necessary. The huge benefit of this is
that the machines or just the intelligent information can be connected to higher
than just factory level. This allows stakeholders to optimize maintenance,
production, and management.
(Evans & Annunziata 2012, 9-10.)
Those intelligent devices or machines, mentioned above, can be connected to
create an intelligent system or network, which potential benefits are vast. In the
perspective of Network Optimization, for example, hospitals can coordinate
interconnected machines to achieve more efficiency, equipment can be linked to
help doctors or nurses route the patient to the correct device more quickly. In
other industries, like transportation, the connected vehicles are able to optimize
the routes, see other vehicles location and destination, and find the most efficient
solution for the transportation.
The intelligent solutions can be implemented to optimize the maintenance as well.
This enables the right number of parts to be delivered to the right place in the
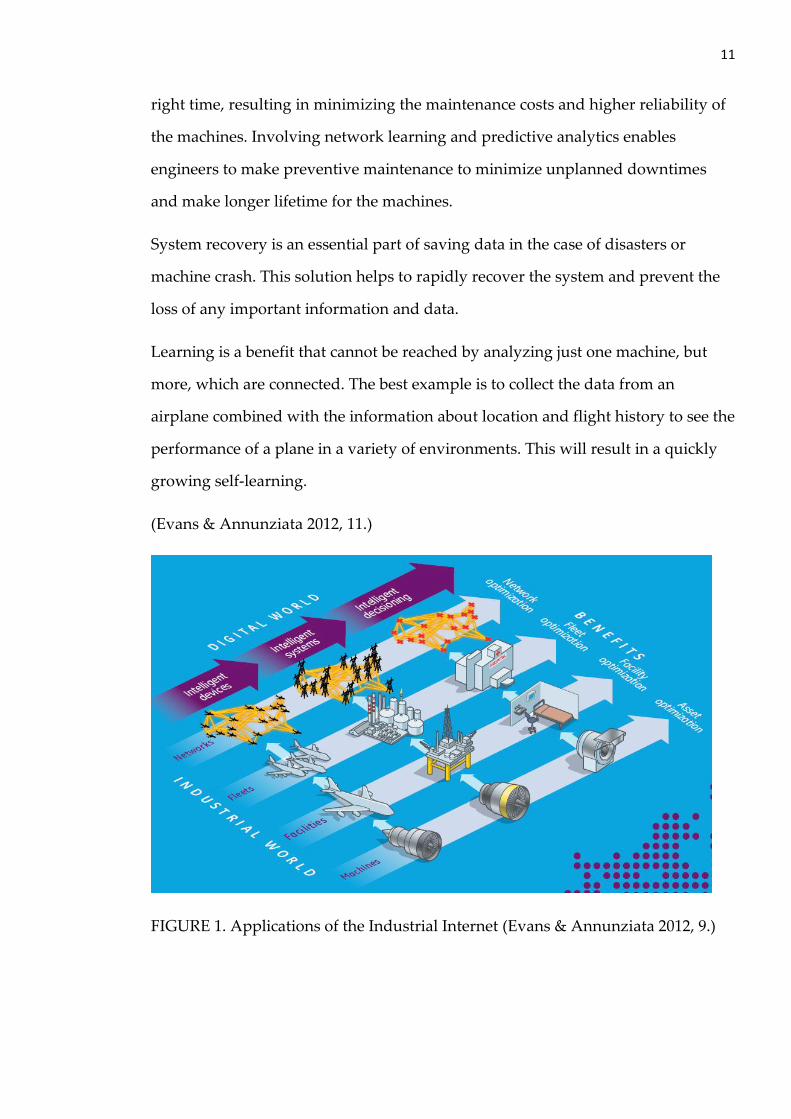
11
right time, resulting in minimizing the maintenance costs and higher reliability of
the machines. Involving network learning and predictive analytics enables
engineers to make preventive maintenance to minimize unplanned downtimes
and make longer lifetime for the machines.
System recovery is an essential part of saving data in the case of disasters or
machine crash. This solution helps to rapidly recover the system and prevent the
loss of any important information and data.
Learning is a benefit that cannot be reached by analyzing just one machine, but
more, which are connected. The best example is to collect the data from an
airplane combined with the information about location and flight history to see the
performance of a plane in a variety of environments. This will result in a quickly
growing self-learning.
(Evans & Annunziata 2012, 11.)
FIGURE 1. Applications of the Industrial Internet (Evans & Annunziata 2012, 9.)

12
3.3 Impact of Industrial Internet on industries
In the previous sections I was explaining and examining the history behind the
main topic of my thesis. In my opinion, it is essential to see and understand how
companies reached this high level of productivity, and why this high level is so
important for companies, customers, and the environment.
Nowadays it is hard to believe that production or products can be even more
advanced, because even now every product is filled with high-tech systems and
hardware, but the industrial internet offers something even more advanced with
the mission to improve industries and productivity, reduce waste, costs, and
pollution.
But the doubt is not irrational; the change offered by industrial internet is very
small in machine level, but it is impressively sizeable when scaled up to economic
level; that is why it is called ‘The power of one percent’.
Commercial aviation can benefit from industrial internet by optimizing the
operations and assets while increasing safety at every phase of its operations.
Operations can be transformed through fuel reduction, improvement in crew
effectiveness, reduction in delays and cancellations, more efficient maintenance
planning and parts inventory, and optimal flight scheduling. The assets can be
optimized by more efficient preventive maintenance which results in longer
engine lives.
(Evans & Annunziata 2012, 19.)

13
FIGURE 2. Aviation Industrial Internet (Evans & Annunziata 2012, 20.)
In the industry of commercial aviation the biggest impact will be the maintenance
area. The intelligent aircraft will tell the maintenance crew which part of the plane
is likely to need replacement and when. This enables to shift maintenance
schedules from regular cycles to a cycle where the actual need for maintenance is
known exactly. The combination of sensor, data analytics, and data sharing
between people and machines is expected to reduce airline costs and improve
maintenance efficiency. Commercial aviation is an industry with the revenue of
$560 billion, but the global industry of aviation is spending $170 billion on fuel,
by adopting the changes of industrial internet, fuel efficiency can be increased
resulting in around 5% saving on jet fuel, which means over $8 billion can be
saved per year. Better asset utilization can save $1.3 billion per year, and every
one percent of improvement in maintenance means a $250 million saving per
year.
(Evans & Annunziata 2012, 20-21.)

14
Rail transportation can also benefit from industrial internet. The locomotive
instrumentation will provide an insight for analytics to solve velocity, reliability
and capacity. Breakdowns can be prevented before they occur by predictive
analytics and real-time diagnostics. Movement planning software for rail
transportation provides real-time information of network operation to make
optimal decisions. According to GE, 2,5% of rail transportation operation costs can
be potentially saved by reducing inefficiency, which means a $5.6 billion.
(Evans & Annunziata 2012, 21.)
Energy production is another sector which will benefit from industrial internet.
1GW of capacity can power approximately 750 000 US homes. The global energy
industry contains 5200GW of generation capacity. Similar benefits can be expected
in this sector as in transportation in the meaning of reliability, safety, increased
productivity, and fuel efficiency. Power outages are costly, disruptive, and
dangerous. Sometimes it takes days or weeks to solve the outages because of the
massive amount of power lines, but with industrial internet the whole system is
connected to internet providing status updates and performance information.
(Evans & Annunziata 2012, 21.)
The sector of Health care makes 10% of the global GDP, of what, according to
statistics, 10% is wasted due to inefficiency of the workflow. In numbers it means a
$731 billion waste per year. The implementation of industrial internet is estimated
to save 25% of these costs. Industrial internet will make the information intelligent
by creating new connections, so the ‘big data’ (which is received by doctors for
making the diagnosis of a patient, for example MRI images) will know where it
needs to go and how to get there. It means the doctor can automatically receive the
images of the patient, and the medical record of the patient will be saved in the
right place.

15
Hospitals are filled with huge amount of equipment which are all the time in
movement, so creating a control system for the equipment can increase asset
capacity utilization, better workflow, increased productivity, and 15-30% drop in
equipment costs.
(Evans & Annunziata 2012, 24.)

16
4. LEAN
Lean manufacturing or production is originated from the successful production of
Toyota Production System. This philosophy is about reducing waste and adding
customer value to the products. Reducing waste seems like an easy task, but it is
rather challenging.
The types of wastes are defined as: muda, mura, muri (Japanese). Muri is about
preparation and planning of the process (avoiding unnecessary work if possible),
mura is how the work design is implemented and elimination of fluctuation,
muda has to be examined after the previous two processes have been
implemented and the processes are running, searching for connection between
muri and mura. The idea is that non-value added work is a waste and therefore
should be eliminated. Non-value added work is the unreasonable work that is
imposed on workers due to poor management; lifting heavy weights, moving
things around, dangerous or fast work. The most common example of mistakes is
that companies are always trying to meet their production plans and look only at
the number of products produced, while doing so they tend to forget that
stretching the production capacity results in modifying the routines and
standards which is leading to wastes like downtime, waiting, correction, back
flow, mistakes.
(Ohno 1988, 58.)
The steps to create a lean manufacturing system are:
A simple manufacturing system with decreased cycle time, less inventory
and increased productivity, visual guidance.
Continuous improvement.
Measuring, for example Overall Equipment Effectiveness (OEE) which is a
tool for measuring productivity and waste.
(Akinlawon. Accessed: 21.1.2016)

17
Lean manufacturing requires lean management. The successful lean management
focuses on processes, because as explained before, when the management wants
to meet the production numbers they forget to focus on processes, which results
in waste, downtime, mistakes, backflow, etc. During the implementation,
companies should consider 4 principal elements of lean management: leader
standard work, visual control, daily accountability process, and discipline. The
most important element, considering my thesis and project work, is the visual
control. With lean visual control there will not be overproduction of unnecessary
products, while the company lacks of the really important ones, furthermore
visualization makes the work easier, because the problems are visible and it lets
the leaders to optimize the decisions, thus the problems can be solved faster. It is
focusing on stability, maintaining the inventory level as well as the production.
(Mann 2010, 11-28.)
Case study on how visual controls improve performance:
In one company, visual display boards for cells were put up to satisfy
the dictate of the division general manager. The general manager
insisted that the information on the boards be kept up to date. When
he was in the plant, which was a half-day drive from the majority of
his responsibilities, he inspected the boards carefully to make sure
they were current.
At first, the boards were current only during his visits and allowed to
lapse as soon as the GM left the plant. The division’s lean “sensei”,
seeing this during one of his trips to the plant, asked a value stream
manager to try actually using the boards for a few weeks to test the
proposition that he might find them useful. During a subsequent
gemba walk with the sensei, the value stream manager exclaimed that
by simply noting misses and making the visual assignments to
respond to them, things had actually improved. Several problems of
long standing were eliminated. Performance and results had
stabilized. Visual controls are important, not because they satisfy
executives’ demands for visual display, but because they bring focus
to the process and, in doing so, drive improvements.
(Mann 2010, 55.)
18
5. VISUALIZATION OF DATA
In lean manufacturing, visual guidance plays a very important role. It helps to
keep the simple solutions, to reduce waste and to focus on production processes.
There are many different ways for a company to display the visualization of data.
The least modern way is the paper-based display. It is the slowest and most
wasteful solution. The visualization can be also delivered to tablets, or
smartphones, which is a more modern and faster solution. In the case of the
Centria University of Applied Sciences project, the companies are going to use
info monitors, which will be implemented directly for visual guidance.
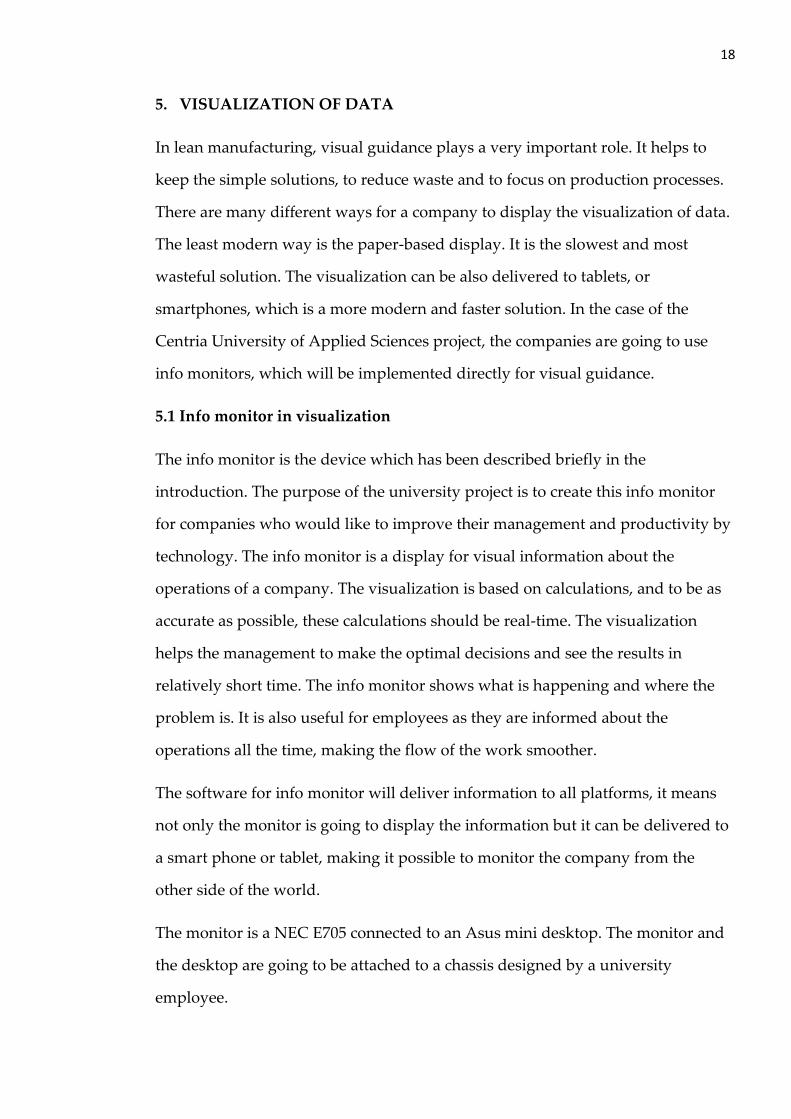
5.1 Info monitor in visualization
The info monitor is the device which has been described briefly in the
introduction. The purpose of the university project is to create this info monitor
for companies who would like to improve their management and productivity by
technology. The info monitor is a display for visual information about the
operations of a company. The visualization is based on calculations, and to be as
accurate as possible, these calculations should be real-time. The visualization
helps the management to make the optimal decisions and see the results in
relatively short time. The info monitor shows what is happening and where the
problem is. It is also useful for employees as they are informed about the
operations all the time, making the flow of the work smoother.
The software for info monitor will deliver information to all platforms, it means
not only the monitor is going to display the information but it can be delivered to
a smart phone or tablet, making it possible to monitor the company from the
other side of the world.
The monitor is a NEC E705 connected to an Asus mini desktop. The monitor and
the desktop are going to be attached to a chassis designed by a university
employee.

19
5.2 Sample case
The aim of the project is to create a useful system for companies who want to
improve their production and operation. In order to provide something useful
with my thesis, I suggested some ideas using my experiences.
5.2.1 Calculations behind visualization
The bases of the visualization are calculations, so in order to display the right
charts and figures we need to implement the right calculations. The multinational
company I have worked with uses OEE (Overall Equipment Effectiveness) to
calculate, analyze and display the efficiency of the production and machines. It is
commonly used as a key performance indicator. In brief, it uses six metrics as
measurements.
The 6 metrics:
Total effective equipment performance (TEEP) measures the effectiveness
against calendar hours, thus the utilization of assets
Loading measures the schedule effectiveness (scheduled time divided by
calendar time)
Availability measures the available operation time compared to scheduled
time, excluding other measures
Performance measures the speed as a percentage at what the production
operates, excluding other measures
Quality measures the good units compared to total units, excluding other
measures
OEE is calculated from the Availability, Performance, and Quality, because
these 3 measures separately does not give the appropriate picture, due to
the fact, that in their own calculations the other measures are excluded
(Capstone Metrics 2016)

20
When using OEE for improving the production there are six categories where the
most losses occur:
TABLE 1. Six most common categories of losses (Overall Equipment Effectiveness
2016)
Availability Performance Quality
Planned Downtime Minor Stops Production Rejects
Breakdowns Speed Loss Rejects on Start up
The purpose of these categories is to see where the need for countermeasures is.
5.2.2 Implementation
This suggestion for implementation of visualization is based on my experience
from one company, this is not a general solution for companies, only one case
which can be used as an example, or a plan for a specific company. We need to
find out how the companies we are working with collect production data, maybe
they have developed the most suitable way for themselves and then try to
implement an advanced way which takes less time.
According to my work experience the production workers have a so called
“station” where they use computer and Excel software (which has a ready-made
template, so they only need to fill some fields, for example the damaged products,
and downtime). To make the work faster the finished products are placed in boxes
which are placed on pallets. Both pallets and boxes have their own barcodes, so
when one box is placed on the pallet, they use scanners to scan the barcode of
boxes and pallets, so later the computer can show which pallet is carrying the
certain box, and when the pallet is taken by forklift by another worker, he/she
scans the pallet’s barcode and the barcode of the place in the storage where they
put it. By this method they are able to track the position of every product, and
every stage of a product is visible.

21
The key of this solution is that the Excel file used by workers is inside the
company computer network, so the analyst can see the data immediately after
saving the uploaded data. Thanks to the template used in the file, it is easy to
create the charts almost real time.
When it is coming to analysing the least effective processes, analysts can use the
results of those continuous data flow, so it will be a very precise chart about
production effectiveness. Certain software is designed for visualizing these data,
but for the prototype I would start with Excel, because it is capable of showing a
wide variety of charts and it can handle a vast amount of calculations, and also
can be easily controlled. Most of the computers use Windows OS, so the info
monitor is going to be compatible with it.
The following table have been created in Excel as an example template from the
example calculations. If the right fields are changed, the percentage will change
accordingly. The purpose of the template is to provide a tool for calculations about
company operations. This is not a general tool, just a plan for a certain company.

22
TABLE 2. OEE Template
5.2.3 Visualization with graphs
The visual display of information is reached by the continuous analysis of
information flow. As a rudimentary tool for analysis, the above mentioned
template can show the example of the benefit of visualization. The following
charts are the part of visualization. These example charts will demonstrate how
can a company follow and compare the operations on a day-to-day or monthly
basis. This visualization will not be used generally, but it is only a plan for one
company.
Overall Equipment Effectiveness with example calculations from Calculations sub-heading
TEMPLATE
Loading (scheduled time/calendar time)
Scheduled time: (5*24) 120
Calendar time: (7*24) 168
(COMMENT: Working 5 days a week for 24 hours| instead of 7 days a week for 24 hours)
Availability (Sched running/operating time)
Sched. Running 480
Sched. Downt. 30
Unsched. Downt. 60
Op. Time 390
Performance (Total Units*standard rate)/operating time
Total units 242
Stand. Rate 1,5 min/unit or 40unit/hour
Op. Time 390
Quality (Total units-defective units)/total units
Total units 242
Defect. Units 21
OEE
(Availability*Performance*Quality)
Loading Availability Performance Quality OEE
71% 81% 93% 91% 69%

23
The first charts are demonstrating Day 1. Operations:
GRAPH 2. Day 1 Availability
GRAPH 3. Day 1 Performance and Quality

24
GRAPH 4. Day 1 OEE
In order, to effectively use the visualization and to be able to make optimal
decisions the analyzing should be continuous. To reach this goal, day-to-day
comparisons should be created, thus it is clearly visible where the problems are
and it will be easy to detect and solve them.
The next chart shows that the operating time is changing every day, because of
unscheduled downtimes; it means that there are breakdowns too often, but it can
be solved by better maintenance, or by instrumenting the machines with sensors
which are monitoring the machine and preventive maintenance can be applied
before an unplanned breakdown.

25
GRAPH 5. Three day-to-day comparison Availability
The performance is affected by operating time, because it is impossible to produce
the same number of units, if there are too many breakdowns. It is also important
to consider, that the lost time cannot be replaced by faster production, because it
will affect the quality and result in huge amount of waste. In the perspective of
quality we need to consider the defected units, if the standard rate is set for a
lower minute/unit number, the quality will be better, but the performance will
drop, so the optimal speed should be decided by day-to-day comparisons.

26
GRAPH 6. Three day-to-day comparison Performance and Quality
The percentages of these aspects separately, are not giving the right picture that is
why they need to be compared. If we take a look at the following chart, we see
that, for example, on Day 3 the quality was very high, this data alone is not
enough, because it shows that Day 3 is an excellent day, but that day the
breakdown was 2 hours long and the total number of units are very low, that is
why there are only few defected units, but the bigger picture shows that this day is
not productive.

27
GRAPH 7. Three day-to-day comparison OEE
At the end of the year, the company is going to have huge amount of data in
which they can see the daily, weekly, and yearly analysis of productivity. The
easiest way to determine the most common problems is to use the table of “six big
losses”, see TABLE 1. (Page 19).

28
6. CONCLUSION AND DISCUSSION
The beginning of the thesis was built on the evolution of the globalization,
internet, and industries. It is important to see why these three things got
connected in order to create the most advanced machines, factories, and networks.
In the early ages, manufacturing was slow and tremendously wasteful, and
harmful for the environment. As time passed and innovations were made,
manufacturing became more advanced, less wasteful, and more environment
friendly solutions were integrated. That is how we got to the industrial internet
where every single machine is connected to reach the best possible results, and to
make the best possible decisions. With the improvement of manufacturing,
management also had to keep up and develop its operations. With such advanced
machines and manufacturing methods, there is more need for better management,
for example, to reduce waste and unnecessary work.
Lean manufacturing and management offers the companies to improve their
operations in both of those fields. Lean manufacturing seeks for simple solutions,
less inventory, less waste, but requires precise production design, visual guidance,
and measurements. Lean management focuses on production processes in order to
avoid waste. It also requires visualization, and furthermore daily accountability
processes and strong discipline.
In my suggestions for implementation, compared to what Mann writes in his book
about the lean management, there is couple of similarities. The book suggests
starting the implementation with the visualization, before making any changes in
other fields. My work is completely about visualization, but it also means that it is
the first step towards improvement. Mann also describes the importance of daily
measures of processes, it is important in my work as well, only the methods differ,
because I am focusing on production measurements.

29
Unfortunately the book does not mention the role of the internet, due to the fact
that industrial internet is still a new thing and it is not commonly used yet. This is
the reason why companies need the help to implement the industrial internet, and
it will still stay in an experimental phase for few years, at least until the university
project ends.
My work will hopefully assist in the start of implementation and in what to
measure for visualization. The calculations and implementation plan I made was
just an example from my experiences, but it gives an idea on where to start, but
this year was only the beginning of the project, it lasts until 2018.

30
REFERENCES
Akinlawon, A.O. Thinking of Lean Manufacturing Systems:
http://www.sae.org/manufacturing/lean/column/leandec01.htm. Accessed:
21.1.2016
Capstone Metrics, Overall Equipment Effectiveness (OEE). A General Discussion
with Calculation Methods.: http://capstonemetrics.com/files/whitepaper-
oeeoverview.pdf, Accessed: 21.01.2016
Dye, Eric. 2014. The Numbers of Internet Use. ChurchMag:
http://churchm.ag/numbers-internet-use/. Accessed: 03.02.2016
Frank, A. G. 1998. Reorient: Global economy in the Asian age. U.C. Berkeley Press.
History.com 2009. Industrial revolution:
http://www.history.com/topics/industrial-revolution. Accessed: 13.1.2016
Jones, G. G. & Abdelal, R. E. & Kirby, W. C. 2008. Harvard Business School,
Historical roots of globalization:
http://www.hbs.edu/centennial/businesssummit/globalization/historical-roots-of-
globalization.html. Accessed: 13.1.2016
Lee, A. & Waugh, D. Silkroad Foundation. Ancient Silk Road Travellers.
http://www.silk-road.com/artl/srtravelmain.shtml. Accessed: 21.1.2016
Leiner, B.M. & Cerf, V.G. & Clark,D.D. & Kahn,R.E. & Kleinrock, L. & Lynch, D.C.
& Postel,J. & Roberts,L.G. & Wolff, S. Internet Society, Brief history of the internet:
http://www.internetsociety.org/internet/what-internet/history-internet/brief-
history-internet. Accessed: 13.1.2016
Mann, D. 2010. Creating a Lean Culture. Tools to Sustain Lean Conversions.
Second Edition. New York: Productivity Press.

31
McNeill, J.R. The Columbian Exchange. The University of North Carolina.
http://www.learnnc.org/lp/editions/nchist-twoworlds/1866. Accessed: 21.1.2016
Mingay, G. E. 1986. The Transformation of Britain, 1830–1939. Routledge
Ohno, T. 1988. Toyota Production System. Productivity Press.
Overall Equipment Effectiveness. “Six big losses”. Wikipedia:
https://en.wikipedia.org/wiki/Overall_equipment_effectiveness#.22Six_Big_Losses
.22. Accessed: 13.1.2016)
Yates, D. M. 1997. Turing's Legacy: A History of Computing at the National
Physical Laboratory 1945–1995. National Museum of Science and Industry.
APPENDIX 1/1
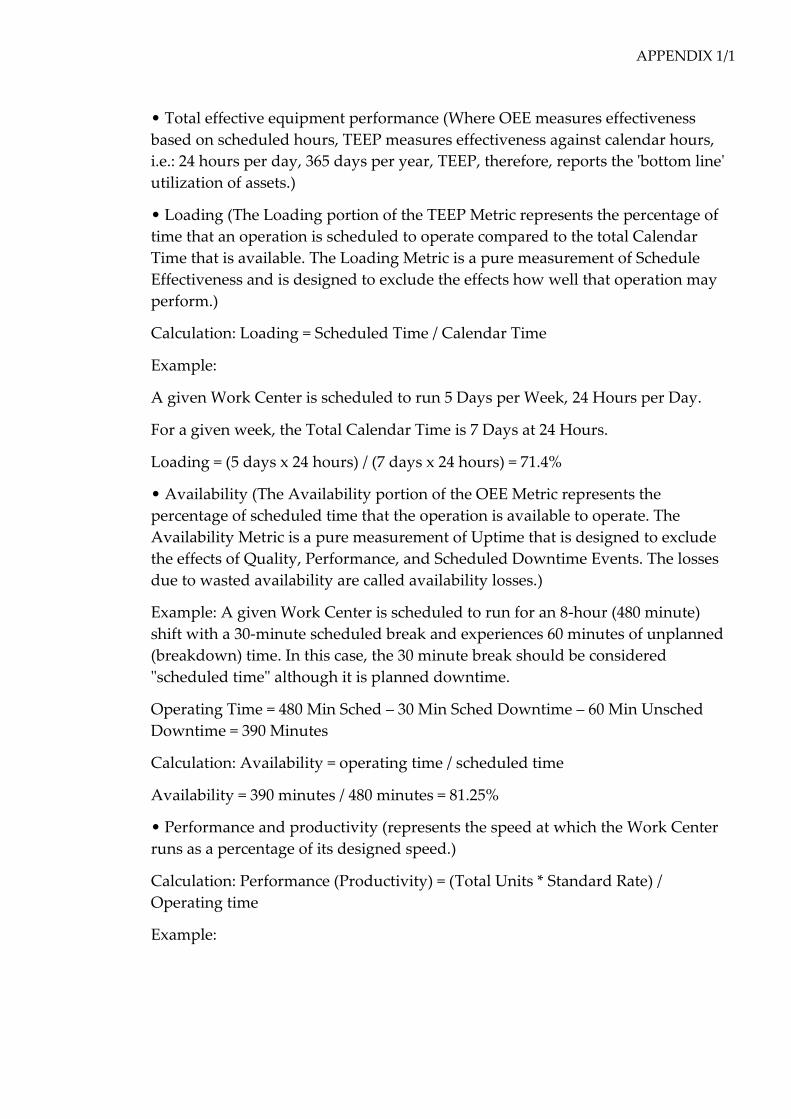
• Total effective equipment performance (Where OEE measures effectiveness
based on scheduled hours, TEEP measures effectiveness against calendar hours,
i.e.: 24 hours per day, 365 days per year, TEEP, therefore, reports the 'bottom line'
utilization of assets.)
• Loading (The Loading portion of the TEEP Metric represents the percentage of
time that an operation is scheduled to operate compared to the total Calendar
Time that is available. The Loading Metric is a pure measurement of Schedule
Effectiveness and is designed to exclude the effects how well that operation may
perform.)
Calculation: Loading = Scheduled Time / Calendar Time
Example:
A given Work Center is scheduled to run 5 Days per Week, 24 Hours per Day.
For a given week, the Total Calendar Time is 7 Days at 24 Hours.
Loading = (5 days x 24 hours) / (7 days x 24 hours) = 71.4%
• Availability (The Availability portion of the OEE Metric represents the
percentage of scheduled time that the operation is available to operate. The
Availability Metric is a pure measurement of Uptime that is designed to exclude
the effects of Quality, Performance, and Scheduled Downtime Events. The losses
due to wasted availability are called availability losses.)
Example: A given Work Center is scheduled to run for an 8-hour (480 minute)
shift with a 30-minute scheduled break and experiences 60 minutes of unplanned
(breakdown) time. In this case, the 30 minute break should be considered
"scheduled time" although it is planned downtime.
Operating Time = 480 Min Sched – 30 Min Sched Downtime – 60 Min Unsched
Downtime = 390 Minutes
Calculation: Availability = operating time / scheduled time
Availability = 390 minutes / 480 minutes = 81.25%
• Performance and productivity (represents the speed at which the Work Center
runs as a percentage of its designed speed.)
Calculation: Performance (Productivity) = (Total Units * Standard Rate) /
Operating time
Example:

APPENDIX 1/2
A given Work Center is scheduled to run for an 8-hour (480 minute) shift with a
30-minute scheduled break.
Operating Time = 450 Min Sched – 60 Min Unsched Downtime = 390 Minutes
The Standard Rate for the part being produced is 40 Units/Hour or 1.5
Minutes/Unit
The Work Center produces 242 Total Units during the shift. Note: The basis is
Total Units, not Good Units. The Performance metric does not penalize for
Quality.
Time to Produce Parts = 242 Units * 1.5 Minutes/Unit = 363 Minutes
Performance (Productivity) = 363 Minutes / 390 Minutes = 93.0%
• Quality (represents the Good Units produced as a percentage of the Total Units
Started.)
Calculation: Quality = (Units produced - defective units) / (Units produced)
Example:
242 Units are produced. 21 are defective.
(242 units produced - 21 defective units) = 221 units
221 good units / 242 total units produced = 91.32%
OEE is calculated with the formula (Availability)*(Performance)*(Quality)
OEE may be applied to any individual Work Center, or rolled up to Department
or Plant levels. This tool also allows for drilling down for very specific analysis,
such as a particular Part Number, Shift, or any of several other parameters. It is
unlikely that any manufacturing process can run at 100% OEE. Many
manufacturers benchmark their industry to set a challenging target; 85% is not
uncommon.
Alternatively, and often easier, OEE is calculated by dividing the minimum time
needed to produce the parts under optimal conditions by the actual time needed
to produce the parts. For example:
Total Time: 8 hour shift or 28,800 seconds, producing 14,400 parts, or one part
every 2 seconds.
Fastest possible cycle time is 1.5 seconds; hence only 21,600 seconds would have
been needed to produce the 14,400 parts. The remaining 7,200 seconds or 2 hours
were lost.
The OEE is now the 21,600 seconds divided by 28,800 seconds (same as maximal
1.5 seconds per part divided by 2 actual seconds per part), or 75%.
(Capstone Metrics. Accessed: 21.01.2016)