mri in multiple sclerosis mri in ms - american … annual meeting/bakshi asn 2015.pdfrohit bakshi,...
TRANSCRIPT
1
Rohit Bakshi, MD, MABreakstone Professor of Neurology & RadiologyDirector, Laboratory for Neuroimaging Research
Senior Neurologist, MS CenterBrigham & Women’s Hospital
Harvard Medical SchoolBoston, MA, USA
MRI in multiple sclerosisMRI in MS
•Conventional MRI lesions
–T2, T1, gad
•Atrophy of the CNS in MS
–MRI assessment
•Recent MRI advances in MS
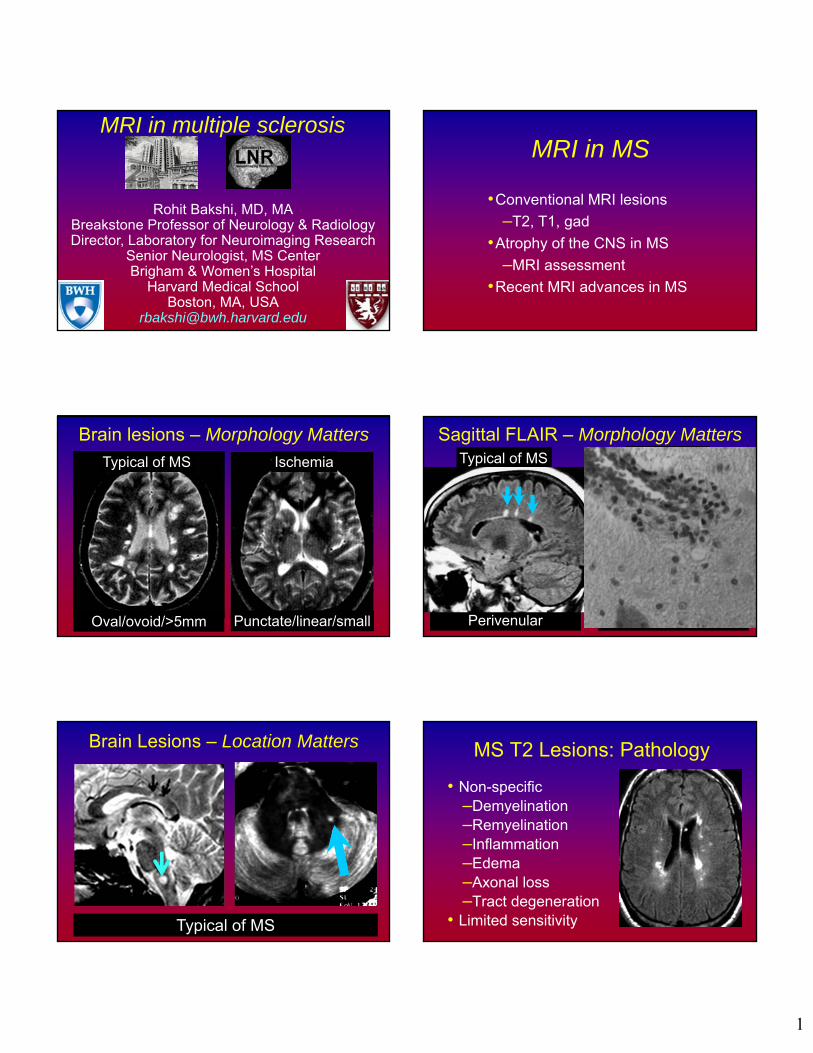
Brain lesions – Morphology Matters
Typical of MS Ischemia
Punctate/linear/smallOval/ovoid/>5mm Random
Sagittal FLAIR – Morphology MattersTypical of MS
Perivenular
Unlikely MS
Brain Lesions – Location Matters
Typical of MS
MS T2 Lesions: Pathology
• Non-specific–Demyelination–Remyelination–Inflammation–Edema–Axonal loss–Tract degeneration
• Limited sensitivity
2
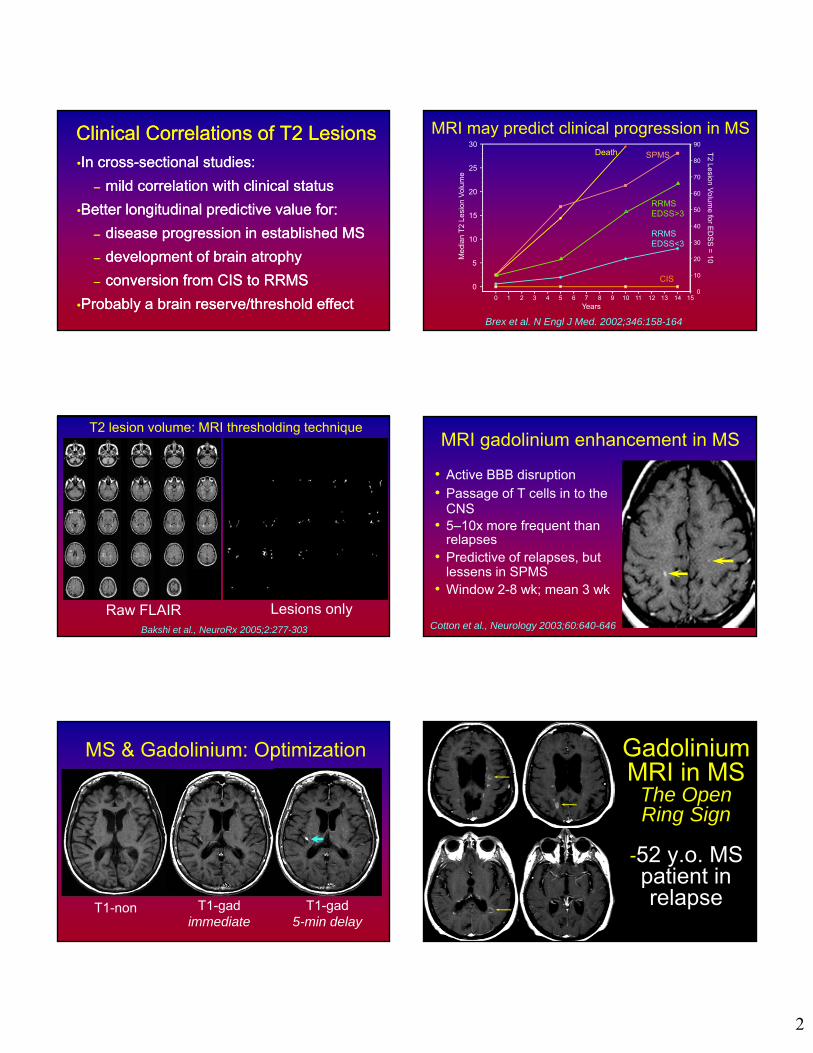
Clinical Correlations of T2 LesionsClinical Correlations of T2 Lesions•In cross-sectional studies:
– mild correlation with clinical status
•Better longitudinal predictive value for:
– disease progression in established MS
– development of brain atrophy
– conversion from CIS to RRMS
•Probably a brain reserve/threshold effect
•In cross-sectional studies:
– mild correlation with clinical status
•Better longitudinal predictive value for:
– disease progression in established MS
– development of brain atrophy
– conversion from CIS to RRMS
•Probably a brain reserve/threshold effect0
10
20
30
40
50
60
70
80
90
T2 Lesion V
olume for E
DS
S =
10
0
5
10
15
20
25
30
Med
ian
T2
Lesi
on V
olum
e
0 1 2 3 4 5 6 7 8 9 10 11 12 13 14 15
Years
Death SPMS
RRMSEDSS>3
RRMSEDSS<3
CIS
Brex et al. N Engl J Med. 2002;346:158-164
MRI may predict clinical progression in MS
T2 lesion volume: MRI thresholding technique
Lesions onlyRaw FLAIRBakshi et al., NeuroRx 2005;2:277-303
MRI gadolinium enhancement in MS
• Active BBB disruption• Passage of T cells in to the
CNS• 5–10x more frequent than
relapses• Predictive of relapses, but
lessens in SPMS• Window 2-8 wk; mean 3 wk
Cotton et al., Neurology 2003;60:640-646
MS & Gadolinium: Optimization
T1-gadimmediate
T1-non T1-gad5-min delay
Gadolinium MRI in MS
The Open Ring Sign
-52 y.o. MS patient in relapse
What is this?
3
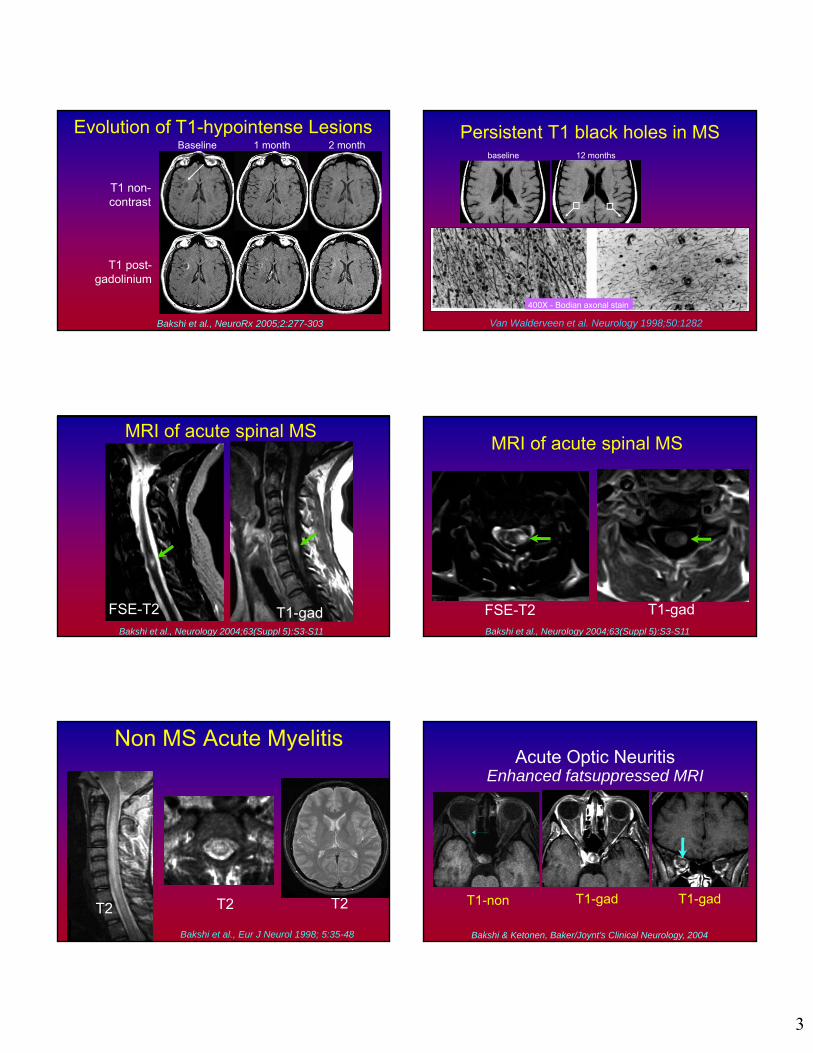
Evolution of T1-hypointense LesionsBaseline
T1 non-contrast
T1 post-gadolinium
1 month 2 month
Bakshi et al., NeuroRx 2005;2:277-303
Persistent T1 black holes in MS
Van Walderveen et al. Neurology 1998;50:1282
400X - Bodian axonal stain
baseline 12 months
MRI of acute spinal MS
T1-gadFSE-T2Bakshi et al., Neurology 2004;63(Suppl 5):S3-S11
MRI of acute spinal MS
T1-gadFSE-T2Bakshi et al., Neurology 2004;63(Suppl 5):S3-S11
Non MS Acute Myelitis
Bakshi et al., Eur J Neurol 1998; 5:35-48
T2T2 T2
Acute Optic NeuritisEnhanced fatsuppressed MRI
T1-gadT1-non T1-gad
Bakshi & Ketonen, Baker/Joynt’s Clinical Neurology, 2004
4
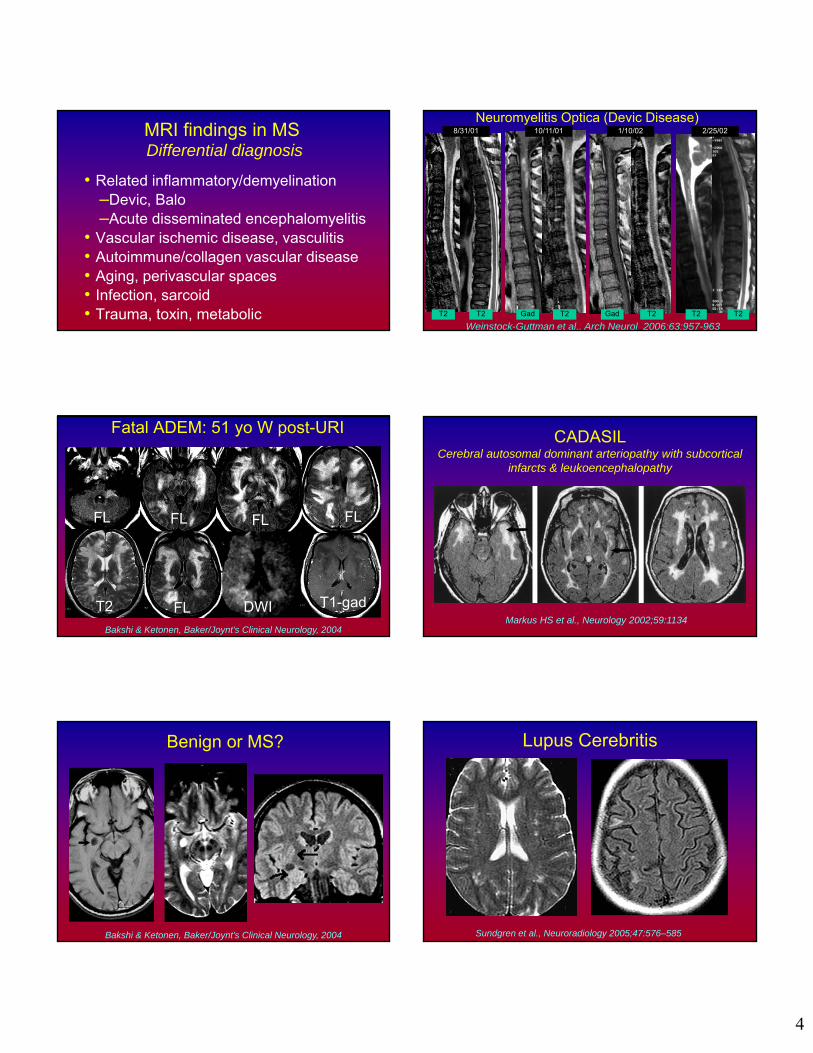
MRI findings in MSDifferential diagnosis
• Related inflammatory/demyelination–Devic, Balo–Acute disseminated encephalomyelitis
• Vascular ischemic disease, vasculitis• Autoimmune/collagen vascular disease • Aging, perivascular spaces• Infection, sarcoid • Trauma, toxin, metabolic
Neuromyelitis Optica (Devic Disease)
Weinstock-Guttman et al., Arch Neurol 2006;63:957-963Gad T2 Gad T2
10/11/018/31/01 2/25/021/10/02
T2 T2 T2 T2
FL FL FLFL
T2 DWIFL T1-gad
Fatal ADEM: 51 yo W post-URI
Bakshi & Ketonen, Baker/Joynt’s Clinical Neurology, 2004
CADASILCerebral autosomal dominant arteriopathy with subcortical
infarcts & leukoencephalopathy
Markus HS et al., Neurology 2002;59:1134
Benign or MS?
Bakshi & Ketonen, Baker/Joynt’s Clinical Neurology, 2004
Lupus Cerebritis
Sundgren et al., Neuroradiology 2005;47:576–585

5
Sjögren’s syndrome
Morgen et al., Semin Arthritis Rheum 2004;34:623-30
LYME OF THE BRAIN• Lesions difficult to distinguish from MS
Bakshi & Ketonen, Baker/Joynt’s Clinical Neurology, 2004
Whipple’s Disease
Duprez et al., AJNR 17:1589, 1996
6 months post-RxPre-RxPre-Rx
Vitamin B12 deficiency
Pre-Rx 8 wk 4 yr
Stojsavljevic et al., Neurology 1997
Brain atrophy in MS
MS
NL
Neema et al., Neurotherapeutics 2007;4:602-617
Brain Atrophy in MSMRI over 7 years in an untreated patient
The MS Collaborative Research Group

6
9/01EDSS 4.0BPF 0.84
3/00EDSS 1.0BPF 0.88
Serial FLAIR-MRI: findings?
Dell'Oglio et al., J Neuroimaging (in press)
Before After
GM
WM CSF
Gray vs. white matter atrophy in MS
Raw
Dell'Oglio et al., J Neuroimaging (in press)
GM vs. WM Brain Atrophy
0
0.1
0.2
0.3
0.4
0.5
0.6
0.7
0.8
0.9
1
Whole brain (BPF) Gray matter White matter
Glo
bal b
rain
fra
ctio
n MS (n=41)Normal controls (n=18)
p=.002
p=.0001
p=.052
Sanfilipo et al., Neuroimage 2005;26:1068–77
Regional brain atrophy in MS: 3T MRIEarly RRMS vs. normal controls
Ceccarelli et al., AJNR 2012;33:1596-601
• Voxel-based morphometry study from 3T MRI scans
• Caudate and thalamus were the only GM structures showing atrophy in MS
Thalamic atrophy related to cognition in MS
Houtchens et al., Neurology 2007;69:1213-23
r = 0.658, p < 0.0001(SDMT)
r = 0.724, p < 0.0001(BVMT)
7
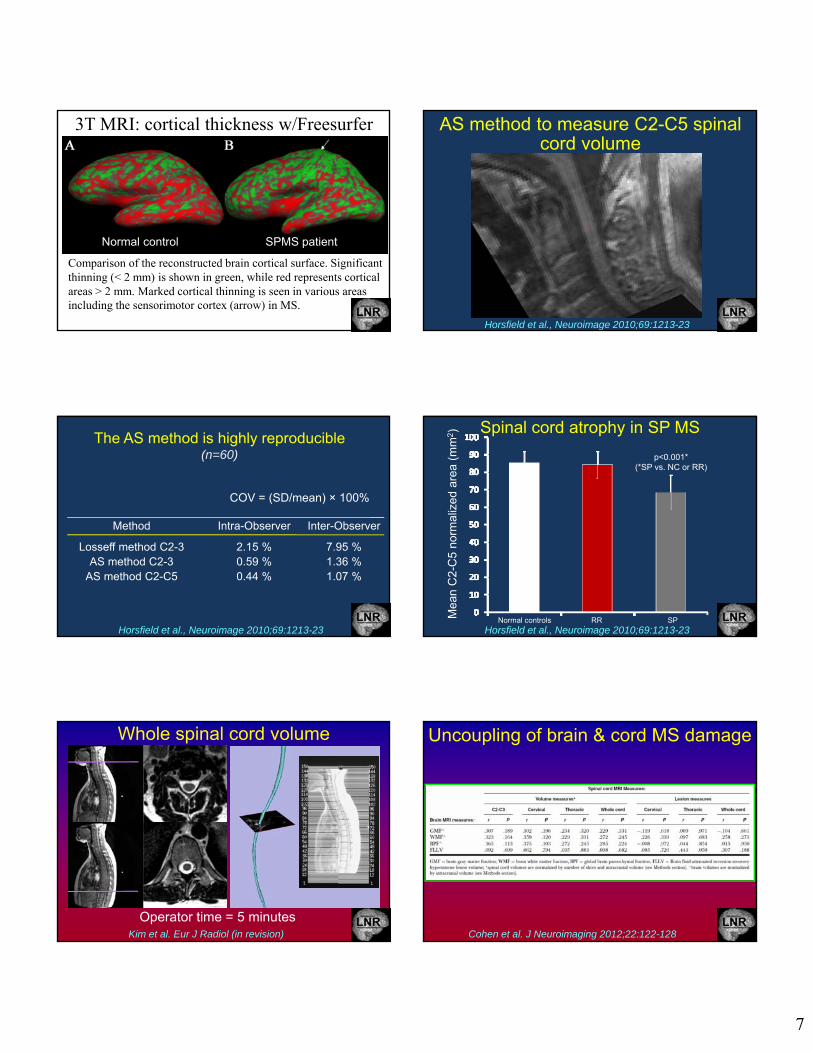
Comparison of the reconstructed brain cortical surface. Significant thinning (< 2 mm) is shown in green, while red represents cortical areas > 2 mm. Marked cortical thinning is seen in various areas including the sensorimotor cortex (arrow) in MS.
3T MRI: cortical thickness w/Freesurfer
Normal control SPMS patient
AS method to measure C2-C5 spinal cord volume
Horsfield et al., Neuroimage 2010;69:1213-23
COV = (SD/mean) × 100%
Method Intra-Observer Inter-Observer
Losseff method C2-3 2.15 % 7.95 %AS method C2-3 0.59 % 1.36 %
AS method C2-C5 0.44 % 1.07 %
The AS method is highly reproducible(n=60)
Horsfield et al., Neuroimage 2010;69:1213-23
Spinal cord atrophy in SP MS
p<0.001*(*SP vs. NC or RR)
Normal controls RR SPMea
n C
2-C
5 no
rmal
ized
are
a (m
m2)
Horsfield et al., Neuroimage 2010;69:1213-23
Whole spinal cord volume
Operator time = 5 minutesKim et al. Eur J Radiol (in revision)
Uncoupling of brain & cord MS damage
Cohen et al. J Neuroimaging 2012;22:122-128
8
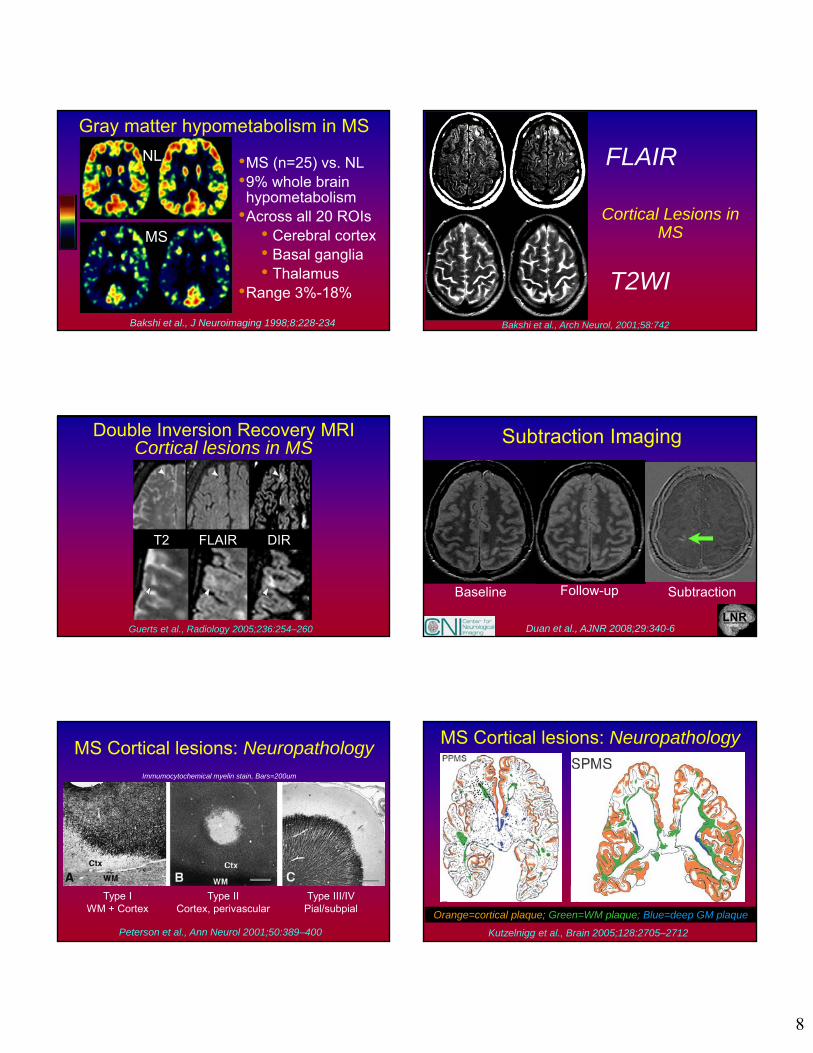
Gray matter hypometabolism in MS
NL
MS
•MS (n=25) vs. NL •9% whole brain hypometabolism
•Across all 20 ROIs• Cerebral cortex• Basal ganglia• Thalamus
•Range 3%-18%
Bakshi et al., J Neuroimaging 1998;8:228-234
Cortical Lesions in MS
FLAIR
T2WI
Bakshi et al., Arch Neurol, 2001;58:742
Double Inversion Recovery MRI Cortical lesions in MS
Guerts et al., Radiology 2005;236:254–260
T2 FLAIR DIR
Subtraction Imaging
Follow-upBaseline Subtraction
Duan et al., AJNR 2008;29:340-6
MS Cortical lesions: Neuropathology
Peterson et al., Ann Neurol 2001;50:389–400
Type IWM + Cortex
Type IICortex, perivascular
Type III/IVPial/subpial
Immumocytochemical myelin stain, Bars=200um
Kutzelnigg et al., Brain 2005;128:2705–2712
MS Cortical lesions: Neuropathology
Orange=cortical plaque; Green=WM plaque; Blue=deep GM plaque
9
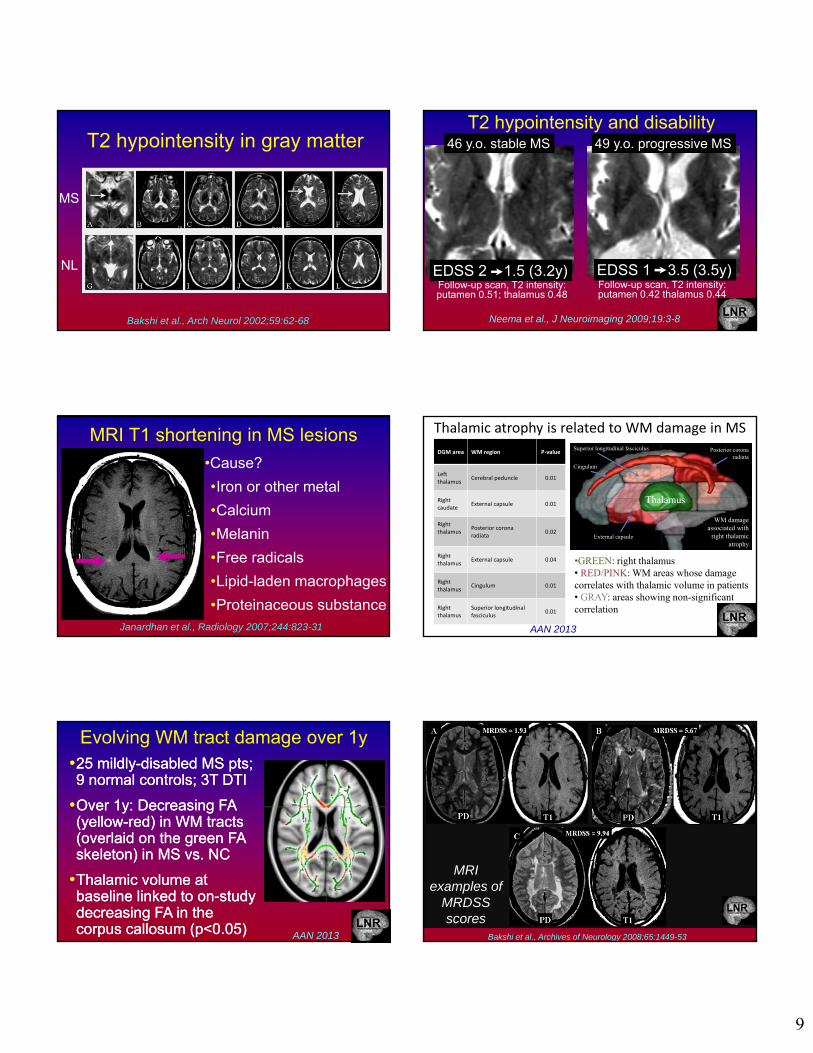
T2 hypointensity in gray matter
NL
MS
Bakshi et al., Arch Neurol 2002;59:62-68
T2 hypointensity and disability
Follow-up scan, T2 intensity:putamen 0.51; thalamus 0.48
EDSS 2 1.5 (3.2y) EDSS 1 3.5 (3.5y)
46 y.o. stable MS 49 y.o. progressive MS
Follow-up scan, T2 intensity: putamen 0.42 thalamus 0.44
Neema et al., J Neuroimaging 2009;19:3-8
MRI T1 shortening in MS lesions
Janardhan et al., Radiology 2007;244:823-31
•Cause?
•Iron or other metal
•Calcium
•Melanin
•Free radicals
•Lipid-laden macrophages
•Proteinaceous substance
Thalamic atrophy is related to WM damage in MS
•GREEN: right thalamus• RED/PINK: WM areas whose damage correlates with thalamic volume in patients • GRAY: areas showing non-significant correlation
Thalamus
DGM area WM region P‐value
Left thalamus
Cerebral peduncle 0.01
Right caudate
External capsule 0.01
Right thalamus
Posterior corona radiata
0.02
Right thalamus
External capsule 0.04
Right thalamus
Cingulum 0.01
Right thalamus
Superior longitudinal fasciculus
0.01
Superior longitudinal fasciculus
Cingulum
Posterior corona radiata
External capsule
WM damage associated with
right thalamic atrophy
AAN 2013
Evolving WM tract damage over 1y•25 mildly-disabled MS pts; 9 normal controls; 3T DTI
•Over 1y: Decreasing FA (yellow-red) in WM tracts (overlaid on the green FA skeleton) in MS vs. NC
•Thalamic volume at baseline linked to on-study decreasing FA in the corpus callosum (p<0.05)
•25 mildly-disabled MS pts; 9 normal controls; 3T DTI
•Over 1y: Decreasing FA (yellow-red) in WM tracts (overlaid on the green FA skeleton) in MS vs. NC
•Thalamic volume at baseline linked to on-study decreasing FA in the corpus callosum (p<0.05) AAN 2013
MRI examples of
MRDSS scores
Bakshi et al., Archives of Neurology 2008;65:1449-53
10
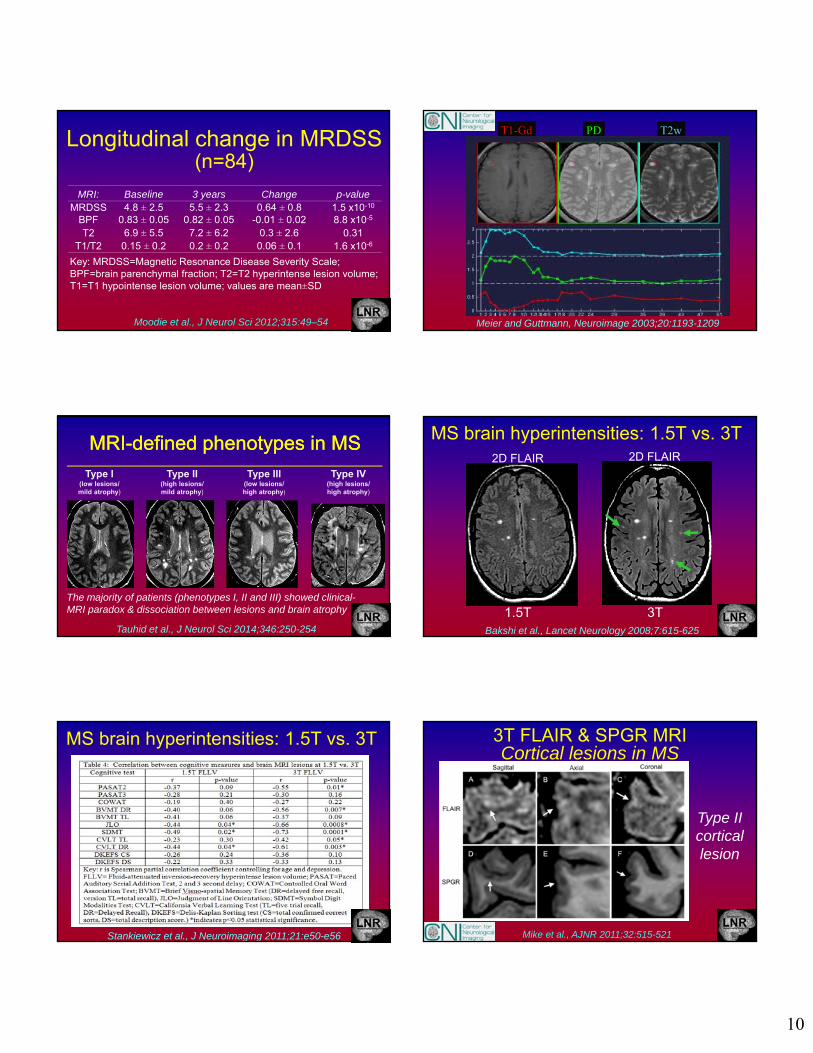
Longitudinal change in MRDSS(n=84)
Moodie et al., J Neurol Sci 2012;315:49–54
Key: MRDSS=Magnetic Resonance Disease Severity Scale; BPF=brain parenchymal fraction; T2=T2 hyperintense lesion volume; T1=T1 hypointense lesion volume; values are mean±SD
MRI: Baseline 3 years Change p-valueMRDSS 4.8 ± 2.5 5.5 ± 2.3 0.64 ± 0.8 1.5 x10⁻¹⁰
BPF 0.83 ± 0.05 0.82 ± 0.05 -0.01 ± 0.02 8.8 x10⁻⁵
T2 6.9 ± 5.5 7.2 ± 6.2 0.3 ± 2.6 0.31T1/T2 0.15 ± 0.2 0.2 ± 0.2 0.06 ± 0.1 1.6 x10⁻⁶
T1-Gd PD T2w
Meier and Guttmann, Neuroimage 2003;20:1193-1209
MRI-defined phenotypes in MSMRI-defined phenotypes in MS
Tauhid et al., J Neurol Sci 2014;346:250-254
Type I(low lesions/mild atrophy)
Type II(high lesions/mild atrophy)
Type III(low lesions/high atrophy)
Type IV(high lesions/high atrophy)
The majority of patients (phenotypes I, II and III) showed clinical-MRI paradox & dissociation between lesions and brain atrophy 1.5T 3T
2D FLAIR 2D FLAIR
MS brain hyperintensities: 1.5T vs. 3T
Bakshi et al., Lancet Neurology 2008;7:615-625
Stankiewicz et al., J Neuroimaging 2011;21:e50-e56
MS brain hyperintensities: 1.5T vs. 3T 3T FLAIR & SPGR MRI Cortical lesions in MS
Mike et al., AJNR 2011;32:515-521
Type II cortical lesion
11
FSE T2 - 3T
FSE T2 - 1.5T
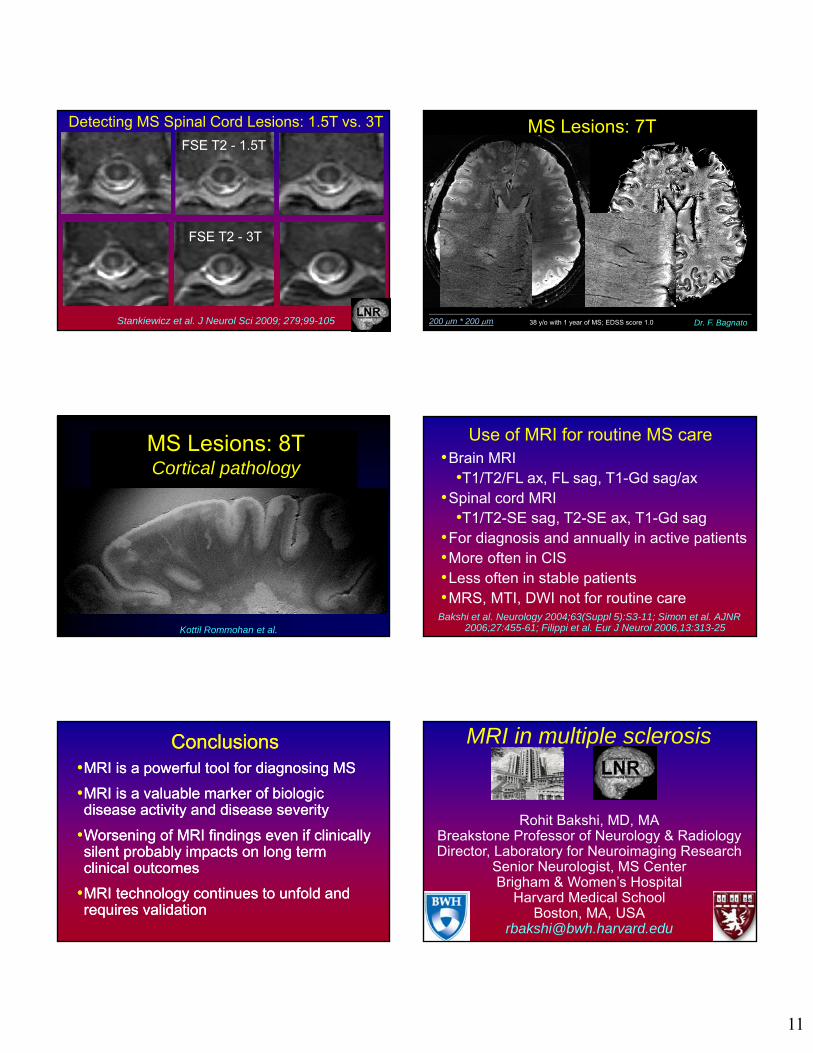
Detecting MS Spinal Cord Lesions: 1.5T vs. 3T
Stankiewicz et al. J Neurol Sci 2009; 279;99-105 200 m * 200 m 38 y/o with 1 year of MS; EDSS score 1.0 Dr. F. Bagnato
MS Lesions: 7T
Kottil Rommohan et al.
MS Lesions: 8TCortical pathology
Use of MRI for routine MS care
Bakshi et al. Neurology 2004;63(Suppl 5):S3-11; Simon et al. AJNR 2006;27:455-61; Filippi et al. Eur J Neurol 2006,13:313-25
•Brain MRI•T1/T2/FL ax, FL sag, T1-Gd sag/ax
•Spinal cord MRI•T1/T2-SE sag, T2-SE ax, T1-Gd sag
•For diagnosis and annually in active patients•More often in CIS•Less often in stable patients•MRS, MTI, DWI not for routine care
ConclusionsConclusions•MRI is a powerful tool for diagnosing MS
•MRI is a valuable marker of biologic disease activity and disease severity
•Worsening of MRI findings even if clinically silent probably impacts on long term clinical outcomes
•MRI technology continues to unfold and requires validation
•MRI is a powerful tool for diagnosing MS
•MRI is a valuable marker of biologic disease activity and disease severity
•Worsening of MRI findings even if clinically silent probably impacts on long term clinical outcomes
•MRI technology continues to unfold and requires validation
Rohit Bakshi, MD, MABreakstone Professor of Neurology & RadiologyDirector, Laboratory for Neuroimaging Research
Senior Neurologist, MS CenterBrigham & Women’s Hospital
Harvard Medical SchoolBoston, MA, USA
MRI in multiple sclerosis