mrcia siqueira rapini - cedeplar - ufmg
TRANSCRIPT

TEXTO PARA DISCUSSÃO N° 286
SPOTS OF INTERACTION: AN INVESTIGATION ON THE RELATIONSHIP BETWEEN FIRMS AND UNIVERSITIES IN MINAS GERAIS, BRAZIL
Márcia Siqueira Rapini
Eduardo da Motta e Albuquerque Leandro Alves Silva
Sara Gonçalves Antunes de Souza Hérica Morais Righi
Wellington Marcelo Silva da Cruz
Fevereiro de 2006

Ficha catalográfica
338.45:62(815.1) R218s 2006
Rapini, Márcia Siqueira
Spots of interaction: an investigation on the relationship between firms and universities in Minas Gerais, Brazil. / Eduardo da Motta e Albuquerque; Leandro Alves Silva; Sara Gonçalves Antunes de Souza; Hérica Morais Righi; Wellington Marcelo Silva da Cruz. Belo Horizonte: UFMG/Cedeplar, 2006. -
47p. (Texto para discussão ; 286)
1. Minas Gerais – Indústrias – Inovações tecnológicas. 2. Pesquisa e desenvolvimento - Minas Gerais. 3. Cooperação universitária - Minas Gerais. I. Albuquerque, Eduardo da Motta e. II. Silva, Leandro Alves. III. Souza, Sara Gonçalves Antunes de. IV. Righi, Hérica Morais V. Cruz, Wellington Marcelo Silva da VI. Universidade Federal de Minas Gerais. Centro de Desenvolvimento e Planejamento Regional. VII. Título. VIII. Série.
CDU
2

UNIVERSIDADE FEDERAL DE MINAS GERAIS FACULDADE DE CIÊNCIAS ECONÔMICAS
CENTRO DE DESENVOLVIMENTO E PLANEJAMENTO REGIONAL
SPOTS OF INTERACTION: AN INVESTIGATION ON THE RELATIONSHIP BETWEEN FIRMS AND UNIVERSITIES
IN MINAS GERAIS, BRAZIL*
Márcia Siqueira Rapini (IEL-FIEMG)
Eduardo da Motta e Albuquerque (Cedeplar-UFMG)
Leandro Alves Silva (Cedeplar-UFMG)
Sara Gonçalves Antunes de Souza (UNIMONTES)
Hérica Morais Righi (Cedeplar-UFMG)
Wellington Marcelo Silva da Cruz (Cedeplar-UFMG)
CEDEPLAR/FACE/UFMG BELO HORIZONTE
2006
* The authors thank Richard Nelson for kindly providing the original questionnaires of the Yale Survey and of the Carnegie
Mellon Survey, and for enlightening discussions and comments on theoretical and methodological issues. The authors also thank Alvin Klevorick and Wesley Cohen for allowing the access to the original questionnaires of those pioneering Surveys. Mariana Rebouças and her team at the IBGE have provided a worthwhile help preparing original tables using data from PINTEC (2003). Silvana Cosac (CNPq) provided essential information about the CNPq Research Groups Directory. Carolina Vargas, Danielle Vieira, Patricia Silva, Wellington Cruz e Luigi Calvette are the research team that screened MG firms and interviewed the R&D performer firms. Research assistance from Thaís Henriques, Elaine Rodrigues, Raquel Guimarães and Felipe da Mata is acknowledged. Discussions of various versions of the questionnaire with Fabiana Santos, Heloísa Menezes, Christian Souza and Mauro Borges Lemos have contributed to shape its final format. Comments and suggestions from participants during two meetings of the Catch Up Project (New York, May 2005; and Tshwane, November, 2005) and from participants of Globelics South Africa, 2005, improved this paper. Roberto Mazzoleni’s suggestions highlighted important issues for this new version. Financial support from BHTEC-UFMG-FINEP, Fapemig and CNPq is acknowledged. This research has benefited from the strategic logistic support of IEL-FIEMG. The usual remainder holds.
3
SUMÁRIO INTRODUCTION ........................................................................................................................ 6
1. BACKGROUND: INTERACTIONS IN IMMATURE NSIs........................................................ 7
2. BRAZIL AND MINAS GERAIS: DATA ON FIRMS AND UNIVERSITIES .............................. 9
2.1. Firms, R&D and Importance of Universities ............................................................................. 10 2.2. Universities, Interactive Research Groups and Firms................................................................ 12 2.3. Islands of R&D Commitment and Interactive Activities ........................................................... 16
3. THE TWO DATABASES ....................................................................................................... 16
3.1. MG Survey................................................................................................................................. 16 3.2. CNPq Research Groups Directory ............................................................................................. 18 3.3. The Potential Complementarity Between these Databases ........................................................ 20
4. MG SURVEY RESULTS: R&D-PERFORMER FIRMS AS RESPONDENTS........................... 21
4.1. Sources of Information............................................................................................................... 21 4.2. Pathways of Knowledge Flow ................................................................................................... 25 4.3. Spots of Interaction (1) .............................................................................................................. 28
5. CNPq DIRECTORY RESULTS: RESEARCH GROUPS AS RESPONDENTS.......................... 31
5.1. Science and Enginnering Fields and Types of Relationship ...................................................... 31 5.2. Interactions Within and Outside Minas Gerais .......................................................................... 33 5.3. Spots of Interaction (2) .............................................................................................................. 35
6. MATCHING THE TWO DATABASES................................................................................... 38
6.1. The Firms in the Intersection ..................................................................................................... 38 6.2. Non-R&D Performers and Their Relationships......................................................................... 39 6.3. Pinpointing Spots of Interaction in Minas Gerais ...................................................................... 40
7. TWO PRELIMINARY CONCLUSIONS AND FURTHER RESEARCH................................... 41
7.1. Two Preliminary Conclusions.................................................................................................... 41 7.2.1. The Nature of Interactions in an Immature NSI ................................................................. 41 7.2.2. The Dual Role of Universities in these Intractions............................................................. 41
7.2. An Agenda for Further Research ............................................................................................... 42
ACKNOWLEDGMENTS ........................................................................................................... 43
REFERENCES........................................................................................................................... 44
APPENDIX................................................................................................................................ 47
4

RESUMO Manchas de interação caracterizam a natureza das conexões parciais entre ciência tecnologia em um sistema imaturo de inovação. Este artigo apresenta uma investigação realizada em Minas Gerais, a partir de uma base com grupos de pesquisa localizados em universidades e institutos de pesquisa do estado (Diretório de Grupos de Pesquisa do CNPq) e de uma base construída a partir de uma versão adaptada do Yale Survey e do Carnegie Mellon Survey. Identificam-se manchas de interação, indicando como setores industriais utilizam-se de disciplinas científicas específicas. Identifica-se também a natureza dual do papel das universidades: substituir e complementar a P&D das firmas. ABSTRACT
Spots of interaction summarize the nature of partial connections (between science and technology) operating in the Brazilian system of innovation. A pilot study in Minas Gerais, Brazil, uses two new research tools (for immature NSIs) and presents a database with research groups located in universities and a database built upon an adapted version of the pioneering Yale and Carnegie Mellon Surveys. These complementary databases identify spots of interaction, indicating how economic sectors use specific science and engineering fields. This investigation identifies a dual role of universities in immature NSIs, as substitutes and/or complements firms R&D. Key Words: Systems of innovation; underdevelopment; interactions between science and technology; surveys; universities. Jel Classification: O0.
5

INTRODUCTION
Partial connections between the scientific and technological dimensions are operating in the Brazilian immature system of innovation. Previous works have identified connections and disconnections between the scientific dimension and the technological dimension (Albuquerque, 2004). Statistics of patents and of scientific papers, the source of these studies, proved to be powerful to hint these “partial connections” but limited to go beyond those hints.
A closer investigation of these partial connections demands new research tools (for the analysis of immature NSIs). Rapini (2004) organizes a database built upon data provided by the Conselho Nacional de Pesquisa (CNPq henceforth, the Brazilian National Science Council), and indicates both the interactive research groups (within universities and research institutes) and the firms they declared to have contact with, pinpointing where these partial connections are operating. Albuquerque et all (2005) suggests the adaptation of the pioneering Yale and Carnegie Mellon Surveys to an immature NSI, concentrating the questionnaire in the issues regarding knowledge flows between firms and universities.
The contribution of this paper is the combination of these two research tools, applying them in a pilot study in Minas Gerais, Brazil. They generate complementary databases. They are complementary because in the CNPq Research Groups Directory the questionnaire respondents are located in universities and research institutes (Research Groups leaders), while in the adaptation of Yale and Carnegie Mellon Surveys the questionnaire respondents are located in firms (R&D personnel).
The need of this complementary look is, in itself, an important result of the effort to adapt the Yale and CM Surveys to Brazilian reality. One important characteristic of Brazilian NSI was unveiled in a very preliminary stage of this research, while collecting available data to identify the universe of survey respondents (at large, the set of firms that would correspond to R&D-performer firms interviewed by the Yale and CM Surveys): the importance of universities to non R&D-performer firms. There are 1,225 non-R&D performer industrial firms that value universities as information source for innovation, while there are only 1,120 systematic R&D-performer industrial firms with such evaluation (see Table II, section 2). The challenge of investigating non R&D-performer firms is an important issue since the beginning of this research (Albuquerque et all, 2005).
This paper focuses on Minas Gerais, Brazil,1 and reports results from a pilot study, based on those two complementary databases. The first database has 140 R&D-performer firms from Minas Gerais (henceforth, MG Survey), built upon an adapted version of the Yale and Carnegie Mellon Surveys.2 The second database has 175 Research Groups located within universities and public
1 A South-Eastern state, Minas Gerais has 17.9 million inhabitants and a GDP of US$ 59.6 billion (the 3rd state GDP in
Brazil). See Map I in the Appendix. Minas Gerais could be located together with Rio Grande do Sul, Paraná, Santa Catarina and Rio de Janeiro as states located at an intermediate level of technological diversification in Brazil, between São Paulo (the leading state) and the remaining states (FAPESP, 2005). For a general overview of the Brazilian NSI, see Viotti et all (2003). For a detailed study of Minas Gerais, see BDMG (2002).
2 Albuquerque et all (2005) presents a broader description of MG Survey. However, as section 3.1 presents, here there is an update of the figures presented there, involving now questionnaires from 140 firms and information not exploited there, as the answers regarding the location of universities quoted by those 140 firms.
6

research institutes from Minas Gerais, reporting contacts with 317 firms (henceforth, MG CNPq Directory).3
This paper describes an initial exploration of these potential complementary databases, introducing a sort of post-interview phase: conversations with researchers in firms and in universities to collect examples and to solve doubts regarding both databases.4
This paper is organized in seven sections. The first discusses interactions in immature NSIs. The second presents data for Brazil as a whole, introducing an evaluation based on a complementary look from firms and from universities. The third section introduces the databases prepared by this investigation. The fourth section presents results from 140 R&D-performer firms interviewed by the MG Survey. The fifth section presents results from 175 university interactive research groups identified in the CNPq Directory. The sixth section presents an initial exploration of the complementarity between the two databases, highlighting the spots of interaction in Minas Gerais. The seventh section presents tentative conclusions about the nature on interactions between firms and universities in immature NSIs and an agenda for further research. 1. BACKGROUND: INTERACTIONS IN IMMATURE NSIS There is a huge literature on the role of universities in developed countries (“mature NSIs”): Mowery & Sampat (2004) present a very broad review of this literature. There are also excellent discussions on the role of universities throughout successful catching up processes: Mazzoleni & Nelson (2005) and Mazzoleni (2005) are important contributions to this subject. This paper would like to investigate the role of universities in a different set of countries, focusing in an “immature” NSI, Brazil (other immature NSIs would be, probably, India, Mexico and South Africa).5
Immature NSIs seem to be under a sort of “red queen effect”:6 a reinterpretation of data presented by Bernardes & Albuquerque (2003) shows how difficult it is to keep the gap constant vis-à-vis the leading countries. In other words, the risks of falling behind are huge. The relationship between immature NSIs and a “red queen effect” would help to identify the permanent risk of “falling behind”; therefore it is not effortless to stay in the same place. This effort to avoid a “falling behind” is a precondition for a successful catch up process, a process that demands that a country “must run at least twice as fast as that!” And large countries as Brazil, India, Mexico and South Africa certainly require a lot of additional energy to run faster.
3 Righi (2005) presents a complete description of this database. However, the data presented here (section 3.2) are updated
and the data presentation rearranged to explore complementarities with MG Survey (especially between Tables VII and X, see below).
4 These example-gathering conversations were suggested by Roberto Mazzoleni. These conversations are reported throughout this paper.
5 This paper uses the term “immature” NSIs for idiosyncratic reasons. This term is compatible with other interpretations, as Viotti (2002). An immature NSI may be identified by exclusion, as countries in an intermediate level of development. They are not neither among developed countries, nor among catching up, nor among countries with only rudiments of innovation system (Albuquerque, 2003).
6 Red queen effect is named after Lewis Carrol’s “Through the looking-glass”. In a passage of that book, “still panting a little”, Alice listens to the Red Queen: “Now, here, you see, it takes all the running you can do, to keep in the same place. If you want to get somewhere else, you must run at least twice as fast as that!”
7

Universities and public labs might have an important role in the effort to avoid the risks of “falling behind”. This paper conjectures that partial connections (between firms and universities) already operating in immature NSIs contribute to this effort. This conjecture informs the investigation on interactions between universities and firms in immature NSIs.
The interactions between science and technology are important since the beginning of development process. These interactions, however, have different features vis-à-vis already developed countries. The investigation of the specific and peculiar nature of this interaction begins with a discussion about the specific role for science in less developed countries. The starting point is a review of the literature on economics of technology and its criticisms of views that underplay the efforts necessary for technological imitation. Silverberg (1990, p. 179) shows how imitation and diffusion of technologies must be seen as a continuation of the innovative process. This effort to imitate depends on internal capabilities: initial stages of development and catching up process depend on “absorptive capability”.
Beyond their key role as supporting the absorptive capability, the scientific institutions have other important contributions for development: 1) a "focusing device" in this process, working as an “antenna” for the creation of links with international sources of technology; 2) the national scientific capability is a major support for industrial development, providing the knowledge necessary for the entry in key industries for the process of development; 3) there is a causal relationship chain between improvements in the scientific dimension and consequent improvements in health, which by its turn, leads to more economic growth; 4) there is a causal link between science and agricultural improvements, because technologies created in more developed countries “cannot be transferred from one zone to another merely through tinkering” (UNDP, 2001, p. 96); 5) assuming that imitation is the initial form of local innovation, it is unavoidable a huge effort to adapt technologies to a new environment (in terms of income, weather, demography and epidemiology).7
The investigation of specificities of immature NSIs has brought evidences on the stage of present interactions between science and technology. Silva (2003) finds a positive polynomial relationship between the increase in technological production and the increase in the scientific production. Silva shows how, in an inter-temporal dimension (data for 1980-2000), the scientific and technological dimensions evolve hand-in-hand. Beyond these inter-temporal interactions, Albuquerque (2004) presents data on inter-sectoral and inter-regional interactions operating in immature NSIs like India and Brazil. Rapini (2004), introducing a new research tool and using data from the CNPq Research Group Directory (year 2002), uncovers spots of interaction for the Brazilian NSI. Rapini searches for matches between firms (by ISIC sectors), and Research Groups (by S&E fields) and finds the following spots of interaction: Agriculture (ISIC sector)-Agronomy (S&E field); Mining-Geosciences; Pulp & Paper-Forest Engineering; Machinery-Mechanical Engineering; Electric & Electronic Equipment-Electric Engineering; Metallurgy-Materials and Metallurgic Engineering; Chemicals-Chemical Engineering.
These data suggest that to survive even in low and in medium tech sectors as mining, pulp and paper, iron and steel, agro-food etc, the role of universities and public institutes should not be underestimated. This may hint an important contribution of universities to avoid a “falling behind” process.
7 For the references supporting these two paragraphs, see Bernardes and Albuquerque (2003, section 3).
8

These partial connections and the process of establishment of interactive, although localized, relationships between firms and universities have complex historical roots.
There are institutions created after a strong demand from economic and social needs: 1) in the health sector, Instituto Manguinhos (Stepan, 1976); 2) in the agricultural sector, Instituto Agronômico de Campinas (Suzigan, 1986, p. 152 and p. 323)8; 3) a general push for educational and research facilities during the expaniosn of coffee production, early industrialization and the urbanization process (Motoyama, p. 201).
There are institutions created “ahead of an industrial demand”: 1) Escola de Minas (Carvalho, 2002; Mazzoleni & Nelson, 2005) and 2) Instituto Tecnológico da Aeronáutica. These institutes were clearly in the “disconnection” side of the system for a long while.9
The existence of these two processes of institution-formation indicates a difference with the endogenous nature of American universities, according to Rosenberg (2000).10
Furthermore, as Nelson & Mazzoleni (2005, p. 30) comment the role of “the user community” necessarily with “strong incentives to improve their practices, and the capability to use what is coming out of the research program”. This capability depends upon firms’ resources and R&D investments are decisive to understand and to monitor what universities are doing.
This comment is an additional indication that it is not easy the formation of these two-way flows between firms and universities. Therefore existing partial connections are very important and precious for immature NSIs. That is why this paper investigates them. 2. BRAZIL AND MINAS GERAIS: DATA ON FIRMS AND UNIVERSITIES The starting point for this investigation is an identification of available data to introduce national statistics capturing these partial connections. These data also locate Minas Gerais in the Brazilian NSI. National data based on a Brazilian Innovation Survey – PINTEC (IBGE, 2005) and data gathered using the CNPq Research Groups Directory (Righi, 2005) identify major characteristics of firms and universities in Brazil. The combination of these two sources also introduces a complementary look on Brazilian NSI: PINTEC reports how firms value universities and the CNPq Directory reports how research groups interact with firms.
8 The strength of demands from the agro-sector can be seen in the recent Brazilian entry in the genomic era with the
sequencing of the Xylela fastidiosa’s genome. This bacterium causes important economic losses to orange producers (Revista FAPESP, 01-02/2000, p. 17).
9 An example of present disconnections is UFMG scientific capability in nanotechnology (Revista FAPESP, 12/2005, pp. 62-67). Temporary disconnections may be part of the formation of innovation systems in LDCs.
10 Carvalho (2002, p. 22 and p. 66) stresses this difference between Brazil and USA. Rosenberg (2003) argues that size matters in the case of US university system and in their relationship with industrial sector. Mazzoleni (2005) presents data that show how the US forged ahead in the numbers of university students vis-à-vis even their European counterparts. Bernardes & Albuquerque (2003) show a threshold level for a more pervasive interactive behavior from firms and universities, and that immature NSIs are below this “critical mass” level.
9

2.1. Firms, R&D and Importance of Universities11
A general picture of industrial firms, their commitment to R&D activities and the importance
of universities as sources of information are presented by Tables I and II.
Table I presents the results of the Brazilian Innovation Survey, disaggregated by states (ranked by systematic R&D-performer firms).
TABLE I Industrial firms, innovative firms, R&D-performer firms and Systematic R&D-performer firms
indicating Universities as important Source of Information, by states, ranked by Systematic R&D-performer firms
Brazil, 2003
Systematic R&D-performer Firms
States Industrial Firms
Innovative Firms
R&D-performer
Firms Total
Firms indicating Universities as
Important source of information
Firms indicating Universities as Not Important
% Firms indicating
universities as important
São Paulo 29,650 9,209 2,212 1,173 306 867 26.05 Rio Grande do Sul 8,273 3,304 736 357 84 272 23.69 Santa Catarina 6,915 2,480 480 244 49 195 19.98 Minas Gerais 10,028 3,503 410 180 80 100 44.55 Rio de Janeiro 5,468 1,367 273 134 31 103 23.17 Paraná 7,057 2,607 354 121 19 103 15.33 Amazonas 530 203 51 38 16 22 42.66 Bahia 1,928 641 60 29 8 21 27.80 Pernambuco 1,674 485 39 26 11 14 44.54 Goiás 2,221 737 53 23 10 13 43.56 Ceará 1,785 603 27 15 8 7 54.03 Pará 1,106 378 46 15 9 6 59.58 Espírito Santo 1,776 645 51 12 4 7 37.27 Total 84,262 28,036 4,941 2,432 649 1,783 26.70
Source: PINTEC, IBGE, 2005. Table I first column shows PINTEC’s universe, that involves all Brazilian industrial firms (mining and manufacturing) with more than 10 employees (84,262 firms). São Paulo is the Brazilian leading industrial state (29,650 firms) and Minas Gerais ranks second (10,028). Table I second column shows 28,036 innovative firms in Brazil and Table I third column presents the subset of R&D-performer firms: 4,941 firms in Brazil.
Table I fourth column focuses a narrower subset of firms: there are 2,432 systematic R&D-performer firms in Brazil.12 São Paulo leads the country (1.173 systematic R&D-performer firms), Rio 11 Data for Tables I and II were kindly prepared under request by the IBGE. These data cross the PINTEC questions related
to firms’ innovative activities and R&D investments with questions regarding the importance of universities and research institutes as source of information. Questions number 31 and 32 inform firm investments in R&D (intramural and/or extramural), and question 115 informs the importance of universities and research institutes to innovative activities. This sub-section is part of the MG Survey investigation, because it indicates the size of its universe. While attempting to define this size, the data presented here unveiled the role of universities to non R&D-performer firms, a very important unintended finding. This finding, by its turn, did put forward the issue of universities substituting firms R&D.
12 PINTEC’s question 44 asks the firm about the nature of its R&D activities between 2001 and 2003: are they continuous or occasional. Systematic R&D-performers are firms that answered the first option. As section IV shows, these systematic R&D activities are divided between firms with formally organized R&D Departments and firms without R&D Departments.
10
Grande do Sul ranks second (357 systematic R&D-performer firms), Santa Catarina is third (244 systematic R&D-performer firms) and Minas Gerais is in the fourth position (180 systematic R&D-performer firms). As section III explains, these 180 systematic R&D-performer firms are the target of the MG Survey, shaping its research universe.13
Table I fifth and sixth columns focus the subject of this research: the correlation between systematic R&D activities and the importance of universities and research institutes as source of information.14 The conjecture that underlies this subject suggests that firms with systematic R&D indicate that universities are more important source of information vis-à-vis firms with occasional R&D. For Brazil as a whole, 26.70% of firms with systematic R&D indicate universities as important sources of information. This percentage is almost twice the average for occasional R&D-performer firms: only 13.87% of them indicate universities as important source of information.15
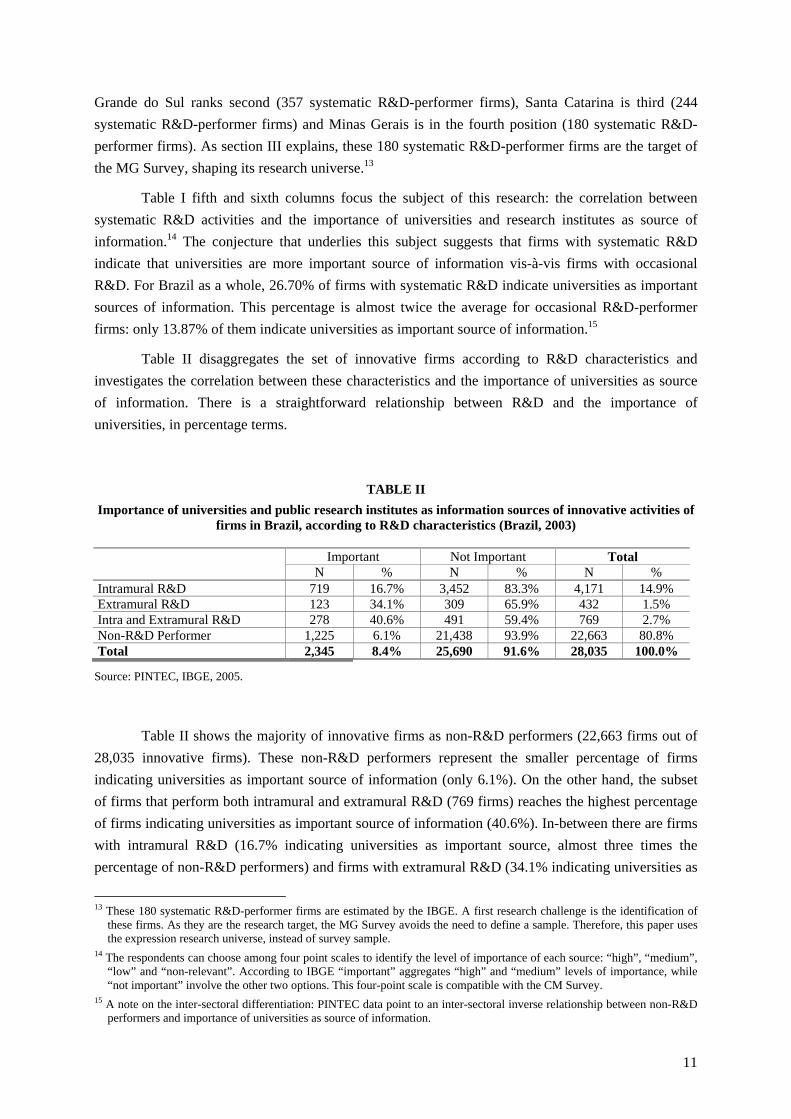
Table II disaggregates the set of innovative firms according to R&D characteristics and investigates the correlation between these characteristics and the importance of universities as source of information. There is a straightforward relationship between R&D and the importance of universities, in percentage terms.
TABLE II Importance of universities and public research institutes as information sources of innovative activities of
firms in Brazil, according to R&D characteristics (Brazil, 2003)
Important Not Important Total N % N % N % Intramural R&D 719 16.7% 3,452 83.3% 4,171 14.9% Extramural R&D 123 34.1% 309 65.9% 432 1.5% Intra and Extramural R&D 278 40.6% 491 59.4% 769 2.7% Non-R&D Performer 1,225 6.1% 21,438 93.9% 22,663 80.8% Total 2,345 8.4% 25,690 91.6% 28,035 100.0%
Source: PINTEC, IBGE, 2005. Table II shows the majority of innovative firms as non-R&D performers (22,663 firms out of 28,035 innovative firms). These non-R&D performers represent the smaller percentage of firms indicating universities as important source of information (only 6.1%). On the other hand, the subset of firms that perform both intramural and extramural R&D (769 firms) reaches the highest percentage of firms indicating universities as important source of information (40.6%). In-between there are firms with intramural R&D (16.7% indicating universities as important source, almost three times the percentage of non-R&D performers) and firms with extramural R&D (34.1% indicating universities as
13 These 180 systematic R&D-performer firms are estimated by the IBGE. A first research challenge is the identification of
these firms. As they are the research target, the MG Survey avoids the need to define a sample. Therefore, this paper uses the expression research universe, instead of survey sample.
14 The respondents can choose among four point scales to identify the level of importance of each source: “high”, “medium”, “low” and “non-relevant”. According to IBGE “important” aggregates “high” and “medium” levels of importance, while “not important” involve the other two options. This four-point scale is compatible with the CM Survey.
15 A note on the inter-sectoral differentiation: PINTEC data point to an inter-sectoral inverse relationship between non-R&D performers and importance of universities as source of information.
11

important source for them). This gradient of importance of universities as source of information (non-R&D performers, intramural R&D, extramural R&D and firms that perform both intra and extramural R&D) supports the conjecture suggested above.
However, Table II absolute numbers highlights a very important issue: there are 1,225 non-R&D performers that indicate universities as important source of information for their innovative activities. This set of firms is larger than the 1,120 R&D performers that indicate universities as important source of information. These data might suggest a very important role of universities in immature NSIs: university activities may be, at least in part, substitutes for firms R&D. But, these data also present new questions: are these non-R&D firms moving towards intramural R&D? These data stimulate a specific subject of research: the investigation of the relationship between non-R&D performers and universities.16
The formal cooperation between universities and firms is reported by PINTEC. The data are interesting to show the localization of the cooperation: 297 firms reported cooperation with universities within their state and 122 reported cooperation outside their states. There is a hint of a pattern that geographical proximity matters for these cooperative arrangements. São Paulo (102 within the state and 55 outside the state), Rio Grande do Sul (85 and 18) and Minas Gerais (58 and 15) follow this pattern. 2.2. Universities, Interactive Research Groups and Firms
The CNPq Directory of Research Groups is a project developed by CNPq since 1992 to gather and organize information regarding research activities in Brazil. The concept of research group is: a group of researchers, students and technical support staff that is organized around the execution of scientific research lines following a hierarchical rule based in the expertise and in the technical-scientific competence. The group members usually share facilities and physical location.
The database information are related to human resources (researcher, students, technicians), research lines, knowledge specificities, the sectors of active involved, scientific, technological and artistic participant’s production and patterns of interactions with productive sector. The unit of investigation in CNPq’s Directory is the research group that is space (institution, federal state and region) and time located (CNPq, 2005).
The CNPq Directory gathers information from public universities (federal, state and municipal); private universities; higher education institutions (non-universities) with at least one formal graduated course; public scientific research institutes; public technology institutes; R&D laboratories from state owned enterprises; non-governmental organizations (NGOs) permanently involved in scientific or technology research. Private enterprises from industrial sector are not included in this Directory.
16 According to IBGE, in Minas Gerais there are 170 non R&D-performer firms that value universities as important source of
information. Note that Table I shows only 80 systematic R&D-performer firms from Minas Gerais indicating universities as important.
12

Since 2002 the CNPq questionnaire introduces specific questions about their interactions with firms and institutions. These answers are an important source of information of university-industry interactions in Brazil. However, it is important to notice that there is an underestimation of the interactive level declared by the research group leader, as identified in Rapini (2004). This underestimation problem remains in the Census 2004.17 This underestimation should be kept in mind throughout this paper.
The adherence to Directory is spontaneous even though researchers have been increasingly stimulated to participate, principally to have access to public finance to scientific research. The Directory universe is increasing during the years and now it covers a representative part of the national scientific community (Carneiro and Lourenço, 2003).
The information from research groups is available in CNPq website (http://lattes.cnpq.br/) and can be obtained in two forms: current database and census database. The Census is a biannual static snapshot from the current database.
Census’s information for this paper is obtained in a module that permits a quantitative picture of the research in Brazil (“Plano Tabular”). The system offers the possibility to cross variables and to generate a variety of tables. For this work, the unit of investigation is a research group. Looking at research groups the investigation may identify the existence (or not) of interactions with firms/institutions. The available variables are: 1) the research groups science and engineering fields; 2) firms/institution that they interact with; 3) types of relationship.
Until now there are six Censuses: 1993, 1995, 1997, 2000, 2002 and 2004. In the first version, there were 99 institutions and 4,402 research groups. In the 2004 version, which is used in this paper, there are 375 institutions and 19,470 research groups (see Table III).
Table III shows the distribution of research groups, total and interactive18, by Brazilian states (ranked by the number of interactive research groups). The distribution of total groups reproduces national inequalities as identified before, being São Paulo the leader with 5,541. Minas Gerais appears in fourth position with 1,694 groups.
17 Conversations with research group leaders provided evidence about this general underestimation. These researchers
explain that the questionnaire is time consuming, sometimes their answers are incomplete. An example of this underestimation problem is the relationship between Biocancer (a biotech firm) and a research group located within a Hospital (Santa Casa). Biocancer keeps a laboratory inside Santa Casa, a laboratory that is shared by the firm and the research group. In the research group questionnaire the relationship with Biocancer is not declared.
18 Interactive research groups are those that their leaders (the questionnaire respondents) declared at least one relationship with firms/institutions.
13
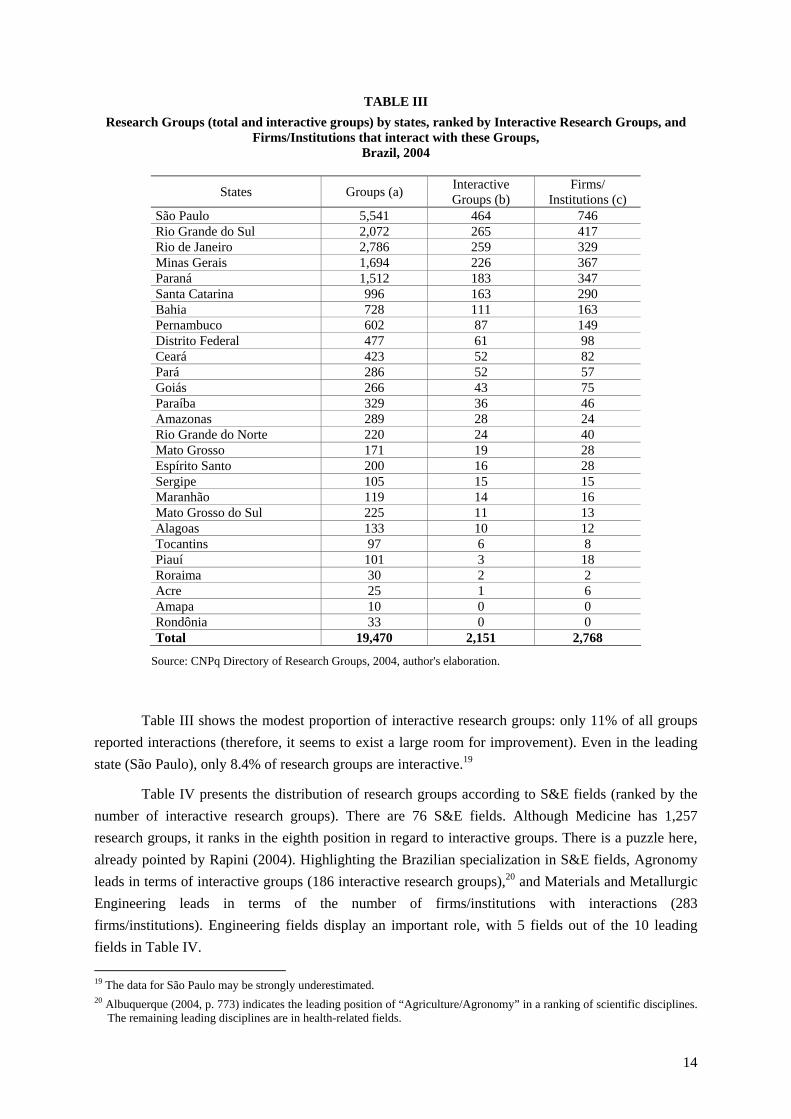
TABLE III Research Groups (total and interactive groups) by states, ranked by Interactive Research Groups, and
Firms/Institutions that interact with these Groups, Brazil, 2004
States Groups (a) Interactive Groups (b)
Firms/ Institutions (c)
São Paulo 5,541 464 746 Rio Grande do Sul 2,072 265 417 Rio de Janeiro 2,786 259 329 Minas Gerais 1,694 226 367 Paraná 1,512 183 347 Santa Catarina 996 163 290 Bahia 728 111 163 Pernambuco 602 87 149 Distrito Federal 477 61 98 Ceará 423 52 82 Pará 286 52 57 Goiás 266 43 75 Paraíba 329 36 46 Amazonas 289 28 24 Rio Grande do Norte 220 24 40 Mato Grosso 171 19 28 Espírito Santo 200 16 28 Sergipe 105 15 15 Maranhão 119 14 16 Mato Grosso do Sul 225 11 13 Alagoas 133 10 12 Tocantins 97 6 8 Piauí 101 3 18 Roraima 30 2 2 Acre 25 1 6 Amapa 10 0 0 Rondônia 33 0 0 Total 19,470 2,151 2,768
Source: CNPq Directory of Research Groups, 2004, author's elaboration.
Table III shows the modest proportion of interactive research groups: only 11% of all groups reported interactions (therefore, it seems to exist a large room for improvement). Even in the leading state (São Paulo), only 8.4% of research groups are interactive.19
Table IV presents the distribution of research groups according to S&E fields (ranked by the number of interactive research groups). There are 76 S&E fields. Although Medicine has 1,257 research groups, it ranks in the eighth position in regard to interactive groups. There is a puzzle here, already pointed by Rapini (2004). Highlighting the Brazilian specialization in S&E fields, Agronomy leads in terms of interactive groups (186 interactive research groups),20 and Materials and Metallurgic Engineering leads in terms of the number of firms/institutions with interactions (283 firms/institutions). Engineering fields display an important role, with 5 fields out of the 10 leading fields in Table IV. 19 The data for São Paulo may be strongly underestimated. 20 Albuquerque (2004, p. 773) indicates the leading position of “Agriculture/Agronomy” in a ranking of scientific disciplines.
The remaining leading disciplines are in health-related fields.
14

Table IV also indicates that there is not a direct relation between groups and firms/institutions, suggesting to the existence of different interactivity levels among different S&E fields. In this regard, Materials and Metallurgic Engineering has the lead, with 35.8% of its Research Groups declaring interactions, followed by Mechanical Engineering (32.0%) and Electrical Engineering (29.5%) (Righi, 2005, p. 22).
TABLE IV Research Groups (total and interactive groups) by Science & Engineering Fields, ranked by Interactive
Research Groups, and Firms/Institutions that interact with these Groups Brazil, 2004
Science & Engineering Fields Groups (a) Interactive Groups (b)
Firms/ Institutions (c)
Agronomy 793 186 263 Electrical Engineering 447 132 232 Computer Sciences 548 101 162 Civil Engineering 377 100 225 Materials and Metallurgic Engineering 274 98 283 Chemistry 818 94 131 Mechanical Engineering 278 89 176 Medicine 1,257 84 89 Geosciences 477 83 131 Chemical Engineering 226 59 114 Food Science and Technology 297 57 142 Veterinary 340 55 78 Production Engineering 219 54 185 Ecology 339 51 106 Zootechny 261 49 98 Forestry Engineering 130 45 90 Business Administration 492 41 89 Education 1,194 41 58 Sanitary Engineering 143 39 82 Pharmacy 245 34 49 Physics 637 34 49 Others (1) 9678 625 1043 Totals 19,470 2,151 3,875
Source: CNPq Directory of Research Groups, Census 2004, author's elaboration (1) There are 55 more S&E Fields Table IV also shows a large room for improvement. Although the relative importance of the leading interactive groups is greater, vis-à-vis the overall picture, even an applied S&E field as Agronomy has only 23.5% of research groups reporting interactions. Among the leading S&E fields, Electrical Engineering reaches 29.5%, Computer sciences 18.4% and Civil Engineering 26.5%.
15
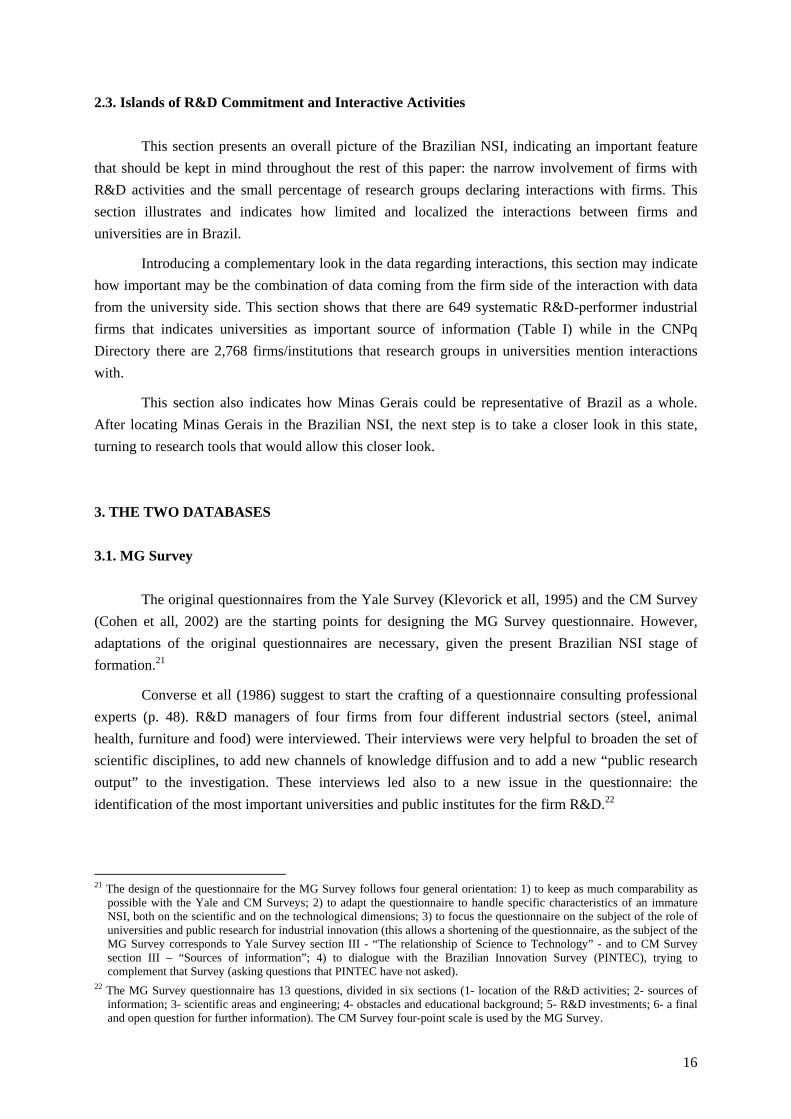
2.3. Islands of R&D Commitment and Interactive Activities This section presents an overall picture of the Brazilian NSI, indicating an important feature that should be kept in mind throughout the rest of this paper: the narrow involvement of firms with R&D activities and the small percentage of research groups declaring interactions with firms. This section illustrates and indicates how limited and localized the interactions between firms and universities are in Brazil.
Introducing a complementary look in the data regarding interactions, this section may indicate how important may be the combination of data coming from the firm side of the interaction with data from the university side. This section shows that there are 649 systematic R&D-performer industrial firms that indicates universities as important source of information (Table I) while in the CNPq Directory there are 2,768 firms/institutions that research groups in universities mention interactions with.
This section also indicates how Minas Gerais could be representative of Brazil as a whole. After locating Minas Gerais in the Brazilian NSI, the next step is to take a closer look in this state, turning to research tools that would allow this closer look. 3. THE TWO DATABASES 3.1. MG Survey
The original questionnaires from the Yale Survey (Klevorick et all, 1995) and the CM Survey (Cohen et all, 2002) are the starting points for designing the MG Survey questionnaire. However, adaptations of the original questionnaires are necessary, given the present Brazilian NSI stage of formation.21
Converse et all (1986) suggest to start the crafting of a questionnaire consulting professional experts (p. 48). R&D managers of four firms from four different industrial sectors (steel, animal health, furniture and food) were interviewed. Their interviews were very helpful to broaden the set of scientific disciplines, to add new channels of knowledge diffusion and to add a new “public research output” to the investigation. These interviews led also to a new issue in the questionnaire: the identification of the most important universities and public institutes for the firm R&D.22
21 The design of the questionnaire for the MG Survey follows four general orientation: 1) to keep as much comparability as
possible with the Yale and CM Surveys; 2) to adapt the questionnaire to handle specific characteristics of an immature NSI, both on the scientific and on the technological dimensions; 3) to focus the questionnaire on the subject of the role of universities and public research for industrial innovation (this allows a shortening of the questionnaire, as the subject of the MG Survey corresponds to Yale Survey section III - “The relationship of Science to Technology” - and to CM Survey section III – “Sources of information”; 4) to dialogue with the Brazilian Innovation Survey (PINTEC), trying to complement that Survey (asking questions that PINTEC have not asked).
22 The MG Survey questionnaire has 13 questions, divided in six sections (1- location of the R&D activities; 2- sources of information; 3- scientific areas and engineering; 4- obstacles and educational background; 5- R&D investments; 6- a final and open question for further information). The CM Survey four-point scale is used by the MG Survey.
16

The target of the research is the set of 180 (systematic) R&D performers firms from Minas Gerais (see Table I, section 2.1), according to IBGE’s estimates. However, the identification of these 180 firms is not an easy task: there is not any available list of all R&D performers firms in Minas Gerais (as there is not any complete list for Brazil, given the confidentiality of IBGE’s data). Therefore, the first step of the field research is the uncovering of these firms.23
The research team (5 interviewers) contacted the firms by phone, investigating whether or not they perform R&D in Minas Gerais.24 In this first screening 339 firms were listed and received the questionnaire. These 339 firms were once more contacted by phone by the research team, to get the answers. These contacts acted as double-checks, solving a lot of doubts from the firms, and in the end more than 100 firms were excluded from the research’s universe. The reasons for these exclusions vary, but are informative: 1) the R&D department is located elsewhere (in another state and/or in another country); 2) the R&D activities of the firm were centralized in another state, and the activities in Minas Gerais discontinued; 3) the R&D activities were discontinued in the last years. 25 The remainder 70 firms declined to answer (probably in the majority of cases, the lack of answer could be seen as a signal of inexistence of R&D activities).
Answers came from 162 questionnaires. From these 162 questionnaires, 22 were excluded because they were either firms with less than 10 employees or firms from sectors outside the scope of this research (services, construction etc). The universe of this research is composed by 140 R&D-performers firms (a number not so distant from the target: the 180 firms systematic R&D-performers estimated by the IBGE, see Table I).
The universe is different from the pioneering surveys, for it involves the mining sector (as in PINTEC, the scope is industry, including mining and manufacturing). In the YS and in the CMS the scope is manufacturing.
Finally, it is important to stress the differences between the industrial structure of Minas Gerais and the distribution of the 140 MG Survey firms according to industrial sectors and size distribution.
In Minas Gerais 94.2% of firms are small firms (10 to 50 employees). Food is the sector with more firms (19.3%), followed by Apparel, Metal Products, Non-metalic mineral products and Furniture. Chemicals is in the eleventh position (however, this sector leads the universe of MG Survey). While in Minas Gerais there are firms distributed throughout 27 industrial sectors, in the MG Survey there are 19 industrial sectors with systematic R&D-performers (seven sectors have not a firm
23 A database with 507 firms was prepared using information from four sources: 1- three files from the industrial association
of Minas Gerais (FIEMG): a list of 341 firms that could perform R&D, a list of the state 100 larger firms and file with 108 biotechnology firms; 2- a database with 80 firms that applied a patent between 1990 and 2001; 3- ANPEI´s and RMT´s files, with 33 and 34 firms; 4- UFMG´s files with firms contracting university’s services).
24 There are firms (or quasi-firms) that are transnational subsidiaries or part of multi-plant national firms and do not perform R&D in Minas Gerais, but perform elsewhere (abroad and/or in other Brazilian states). The screening phase of the MG Survey collected examples of these: Larfage, Nestlé and Novo Nordisk have R&D Department outside Minas Gerais (France, São Paulo and Denmark, respectively).
25 Novo Nordisk provides an interesting example of a closure of an existing R&D department. In 2002 Novo Nordisk acquired Biobrás (an insulin producing firm created as a spin-off from UFMG’s Biochemistry Department, and for long time an example of the potentialities of biotech sector in Brazil). In this acquisition, the R&D department was not included. Therefore, all firm’s R&D is now located in Denmark. Although the transnational corporation has invested US$ 200 million, there is no interest at all in local R&D facilities.
17

with R&D: mining – coal; mining – petroleum; tobacco; lumber; printing/publishing; petroleum; office equipment and computers; and recycling). In addition to these 19 industrial sectors, the MG Survey includes “electricity” (given the importance of local firms); “agriculture” (included for divisions of firms as Agroceres or Bayer CropScience are classified in this sector and for few firms listed as biotech in FIEMG’s files are classified in this sector too); and “biotechnology” (firms classified as such in FIEMG’s files, with manufacturing characteristics, that are classified in health-related services).26
The set of systematic R&D-performers in Minas Gerais have different size and sectoral distribution vis-à-vis the industrial structure as a whole. The size distribution is not so concentrated in the small firms: medium-size firms (100-250 employees) are 31.7% of the universe, followed by the small firms, with 28.8% of the universe. Large firms (firms with more than 500 employees) are better represented in the MG Survey universe, with 7.2% of firms. The sectoral distribution is different too. Chemical industry has 14.4 % of the R&D-performers, Food follows with 13.7%, the third place is Medical Equipment, the fourth is Basic Metallurgy, and the fifth Mining. Only the Food industry is in the five leading positions of both in Minas Gerais and in the MG Survey. 3.2. CNPq Research Groups Directory The CNPq Research Groups Directory’s database is available in the CNPq website, and is prepared to this paper through online search. The database for Minas Gerais is prepared in two steps, using both the Census and the current databases.
The first step is an on-line search through the Census database referring to the year 2004, providing aggregate information organized by institutions.27 The result of this first step is a list with 226 research groups from Minas Gerais (all research groups that their leaders declared at least one relationship with firms or institutions).
With the result of this first step, the second step is a search in the current database - group by group - to identify the firms and the types of relationship that they declared to interact with. 28 The result of this second step is a database with micro-data, involving 223 interactive research groups from Minas Gerais (the remaining three groups were not possible to aggregate as two of them did not declared relationship with productive sector anymore in the current database, and the other one was off-line). This lag between Census 2004 and current base in 2005 suggest that the resulting database may not capture the whole universe of interactive groups in Minas Gerais, but certainly it is representative and helpful. Probably the more important weakness of this database is the underestimation of interactions in Minas Gerais (hints of this underestimation are presented in sections 5 and 6).
26 It is important to stress that among the 22 questionnaires excluded from the research’s universe, there were firms clearly
identified as in the service sector (consulting firms, software firms etc). 27 Census 2004 was generated from CNPq’s current database in 21/10/2004. 28 This second step was not possible in previous Directory versions. Righi (2005) benefited from an improvement in CNPq’s
online database, as in the 2004 version it is possible to identifiy the firms that interact with research groups.
18

During this second step, a further refinement of the database is processed, selecting the research groups that interacted (directly and indirectly) with industrial firms (mining and manufacturing), with firms in agricultural sector and firms in services. The “indirect” interactions involve contacts between research groups and entrepreneurial associations that are able to gather firms demands and to articulate cooperative projects with universities. The database, therefore, excludes contacts between research groups and other universities, higher education institutions, regulatory agencies, non profit foundations and societies, governments (in all three levels). The resulting database, after the exclusion of 48 groups, involves 175 interactive research groups from Minas Gerais (see Table V).
CNPq’s methodology proposes 9 types of relationship running from groups to firms.29 Examples of these types of relationship are “scientific research with immediate application”, “scientific research without immediate application”,30 “training”, “technological transfer”, “consultancy”, “no routine engineering”, “software development” and “others”. Each group leader may list up to 3 types of relationship as important for them. Righi (2005, p. 26) ranks these types of relationship for Brazil as a whole: 1) “scientific research with immediate application”; 2) technological transfer; 3) “scientific research without immediate application”, 4) consultancy and 5) training.
Table V displays an overall picture of the resulting database for Minas Gerais, according to a distribution of interactive research groups by science and engineering fields. The five leading S&E fields are Agronomy, Mechanical Engineering, Electrical Engineering, Civil Engineering and Forest Engineering. There is a similar pattern vis-à-vis the Brazilian distribution, but two disciplines are in the list from Minas Gerais: Mechanical Engineering and Forest Engineering (they replace Computer Sciences and Materials and Metallurgic Engineering) (see Table IV). Following the Brazilian pattern, Medicine has a huge participation in terms of research groups but a very limited participation in terms of interactive research groups. The highest interactive density appears in Electrical Engineering, Agrarian Engineering, and Forest Engineering.
29 There are 4 types of relationship running the other way: from firms to research groups. To preserve the complementarity
between the two databases of this paper, these relationships are not taken into account. In a next round of this research, these relationships could be investigated. One type of relationships from groups to firms was excluded from our analyses as they do not involve a collaborative relationship – “input materials not related to a joint project”.
30 There seems to be a difference between scientists and engineers in the ability to differentiate research with and without immediate application. A research group leader from immunology answered that he could not remember why exactly he had chosen to mark “without immediate application” for a research in his field contracted by a drug firm. In his view, for the firm all scientific research would be seen as having immediate application. In contrast, two leaders from Engineering-related fields answered that for them and for the interacting firms this differentiation is very clear. These comments would suggest caution to avoid an overestimation of this differentiation.
19

TABLE V Research Groups (total and interactive groups) by Science & Engineering Fields, ranked by Interactive
Research Groups, and Firms/Institutions that interact with these Groups Minas Gerais, 2005
Science & Engineering Fields Groups (a) Interactive Groups (b)
Firms/ Institutions (c)
Agronomy 122 28 65 Mechanical Engineering 32 14 25 Electrical Engineering 39 13 43 Civil Engineering 31 11 20 Forest Engineering 24 11 36 Computer Sciences 43 10 21 Materials and Metallurgic Eng. 27 9 21 Chemistry 88 7 9 Geosciences 43 6 8 Agricultural Engineering 20 6 17 Ecology 26 6 6 Zootechny 52 5 13 Veterinary 41 5 15 Medicine 105 4 4 Chemical Engineering 9 3 13 Pharmacy 24 3 4 Mining Engineering 10 3 9 Food Science and Technology 26 3 8 Biochemistry 35 3 3 Others(1) 897 56 38 Total 1,694 175 317
Source: CNPq Directory of Research Groups, current database 2005, author's elaboration (1) There are 17 more S&E Fields in Minas Gerais, with two or less interactive groups 3.3. The Potential Complementarity Between these Databases
The complementarity between these two databases may be important for investigations of the role of universities and public labs in immature NSIs. They complement each other as the MG Survey captures the look from R&D-performer firms to universities and the CNPq Directory captures the look from universities to firms (R&D and non R&D-performers).
From the firms side (MG Survey), as section 3.1 shows, the respondents are R&D personnel working within firms, and they report how useful they evaluate, inter allia, university research is for their work. And they may answer that university research is not important for them. As section 4 shows, universities and public institutes are important for 40.7% (new projects) and 55.7% (project completion) of firms. Investigating this set of firms points that universities may perform no role at all for this set of firms.
From the universities side (CNPq Directory), as section 3.2 reports, the respondents are research group leaders working within universities, and they inform how they evaluate their contacts with firms. They identify the nature of the relationships that firms have with them. And they have contacts that go beyond the R&D-performer group.
20

The complementary nature of these two databases is clear as the firms perform R&D but does not use universities and the research groups have contacts with non-R&D-performer firms.
For this paper, the matching of these two databases may inform the specific features of firms in this intersection (there are 32 firms in common), pointing to R&D-firms with special interests in universities. And a look at non R&D-performer firms that have contacts with universities may introduce an investigation relevant for an immature NSI, specially gathering information on a possible substitutive role that universities may have for these non R&D-performer firms. This conjecture was presented in a previous draft (Albuquerque et all, 2005) and may be investigated now as a new database is used here.
These two databases complement each other in another important way. The MG Survey may present a picture of the needs of firms from Minas Gerais in relation to S&E fields and the CNPq Directory may present the potential contribution of universities from Minas Gerais to firms in general.
For a continental country as Brazil, regional issues are important, and the two databases complement each other in this regard. In the MG Survey, 40 firms quote at least one university outside Minas Gerais in the question about the relevance of S&E fields. In the CNPq Directory, 139 firms outside Minas Gerais have relationships with research groups from Minas Gerais.
Finally, as the CNPq Directory names the interactive research groups, it is possible to contact them and to interview them to understand how they describe their relationships with specific firms. The result is a more complete picture of interactions in Minas Gerais. 4. MG SURVEY RESULTS: R&D-PERFORMER FIRMS AS RESPONDENTS This section presents the MG Survey results, regarding 140 R&D-performer firms. 4.1. Sources of Information Figures I and II show the answers on the importance of sources of information, both for suggesting new projects and for contributing to project completion. In the CM Survey, Figures 1 and 2 (Cohen et all, p. 6) present similar data.
Figure I presents the answers on the information sources suggesting new projects.31
31 It is important to note the higher standard-deviation in the MG Survey, both in Figure III and IV, vis-à-vis the standard-
deviation of the CM Survey.
21


The firms own manufacturing operations is the most important source (for 79.3% of respondents), followed by customers (74.3%). The third place is “fairs and expositions” (included in the MG Survey, not present in the CM Survey) (58.6%), followed by “publications”. Universities and research institutes are in the sixth position (40.7% of respondents). Internet is included as a source of information, in the fifth position (43.8% of respondents).
Two important differences with the CM Survey: customers are the first source and Universities and Public Labs are relatively less important sources, with 31.6% of respondents indicating them.
Figure II presents the answers on the information sources contributing to project completion.
23


Figure II shows the firms own manufacturing operations as the most important source contributing to project completion (85.0% of respondents), once more followed by customers (63.6 %). Universities and research institutes are in the third position (55.7% of respondents). 32
Two important similarities with the CM Survey: universities and research institutes are more important as sources contributing for project completion, and the firms own manufacturing operations are the most important source for project completion.33
It is worthwhile to put forward the greater importance of universities as source of information both for new projects and for project completion in the MG Survey vis-à-vis the CM Survey: 40.7% and 55.7% in Minas Gerais and 31.6% and 36.3% in the CM Survey.
Viotti et all (2005, p. 674) compare Innovation Surveys from Brazil and from the EU, pointing that the importance of universities as source of information is higher in the Brazilian case (9% of respondents) than in any other European country (Denmark is in the second position, with 6% of respondents indicating universities as important). Even after normalizing the data, Brazil keeps the second position, swapping his position with Denmark. This information hints coherence in the comparison between the MG Survey and the CM Survey.
These comparisons present a very interesting research issue. A conjecture on this issue suggests that as in immature NSI the firms involvement with R&D is small, they would depend upon the university more than in a NSI with strong firms R&D investments and resources. Universities in immature NSIs may be both substitutes and complements for relatively weaker firms R&D investments. 4.2. Pathways of Knowledge Flow The pathways of knowledge flow from universities to industrial firms are investigated in question 8. Table VI presents the results.
32 Nature of capital and formal R&D influence these results. These two issues are important for immature NSIs, as they deal
with the nature of capital (domestic or foreign) and the formalization of R&D activities. Among the 140 systematic R&D-performers in Minas Gerais there are 26 foreign firms (firms with at least 50% of foreign capital). Domestic firms score universities and research institutes as important sources of information above the average for the whole survey, both for new projects and for project completion, and foreign firms are below the average for both cases. Foreign firms are above the average for “affiliated suppliers” both for new projects and for project completion, and domestic firms are below the average in this regard. In regard to formal R&D, there are 87 firms with R&D departments and 52 without R&D departments. Interestingly, firms with R&D Department are above the average in the importance of universities as source of information for new projects and for project completion.
33 Nine firms declared universities as the most important source for suggesting new projects (6.43%) and 21 firms (15%) as the most important source for project completion. The percentages for these answers in the CM Survey are 3% and 5% (Cohen et all, 2002, p. 7).
25

TABLE VI Importance to Industrial R&D of Information Sources on Public Research
Mee
tings
or
conf
eren
ces
Con
sulti
ng
Pers
onne
l ex
chan
ges
Pate
nts
Con
tract
re
sear
ch
Rec
ent h
ires
Coo
pera
tive
/ JV
's
Publ
icat
ions
an
d re
ports
L Tech
nolo
gy
icen
sed
nfor
mal
I inte
ract
ion
ISIC code Industrial sector N
Percentage of Respondents Indicating Source “Moderately” or “Very” Important 01 + 02 Agriculture 5 60.0 80.0 20.0 40.0 40.0 100.0 60.0 80.0 60.0 80.0 13 + 14 Mining 10 60.0 90.0 40.0 30.0 90.0 70.0 70.0 50.0 50.0 70.0
15 Food 19 47.4 26.3 31.6 10.5 26.3 57.9 26.3 68.4 10.5 63.217+18+19 Apparel, Textiles And Leather 8 12.5 0.0 0.0 0.0 25.0 12.5 12.5 12.5 0.0 25.0
21+24 Paper And Chemicals 21 42.9 42.9 38.1 19.0 38.1 57.1 47.6 52.4 14.3 47.625 Ruber/Plastic 5 40.0 60.0 0.0 0.0 20.0 20.0 60.0 20.0 20.0 40.026 Non-Metalic Mineral Products 4 50.0 50.0 25.0 25.0 75.0 75.0 75.0 100.0 50.0 75.027 Basic Metallurgy 11 45.5 54.5 36.4 27.3 54.5 54.5 45.5 63.6 9.1 54.528 Metal Products 8 50.0 25.0 12.5 12.5 12.5 37.5 37.5 50.0 25.0 37.529 Machinery And Equipment 8 62.5 62.5 25.0 0.0 62.5 37.5 50.0 25.0 12.5 62.531 Electrical Machinery And Equipment 9 0.0 22.2 22.2 0.0 0.0 55.6 33.3 11.1 0.0 22.232 Electronic And Comm. Equip. 3 0.0 33.3 0.0 0.0 66.7 66.7 100.0 33.3 33.3 66.733 Medical Equip. And Precision Instr. 11 27.3 54.5 18.2 9.1 27.3 63.6 18.2 27.3 9.1 45.5
34 + 35 Car/Truck 6 16.7 50.0 33.3 0.0 16.7 50.0 16.7 0.0 0.0 33.336 Furniture 6 16.7 16.7 16.7 33.3 16.7 33.3 16.7 16.7 33.3 50.040 Electricity 3 66.7 100.0 33.3 33.3 66.7 66.7 66.7 100.0 66.7 100.085 Biotechnology 3 66.7 78.4 0.0 0.0 0.0 0.0 100.0 66.7 0.0 100.0
TOTAL 140 39.3 44.3 25.0 14.3 36.4 52.1 42.1 45.0 18.6 52.9
Source: authors' elaboration.

Informal interactions are the most important channel between universities and firms (52.9% of respondents scored at least “moderately important”). An example of this channel is a respondent from a machinery sector firm that is currently a UFMG post-graduate student: he takes advantage of his contacts in the university to discuss questions arising within the firm with teachers etc.
Figure II shows recent hires in the second position (52.1%), while they are in the sixth position in the CM Survey (19.6%). Some answers may be mixing training in this question: a firm in the steel industry illustrates its relationship with universities by training programs, explaining the recent hires answer the R&D manager informed a contract with UFOP and UFMG to post-graduate employees in firm’s fields of interest (and other incentives to R&D employees take post-graduate courses and incentives to current PhD students to choose research subjects related to the firm’s interests).34 It should be noted that the present form of the MG Survey questionnaire does not capture the training program as a pathway of knowledge from universities to firms.
Publications and reports are the third channel (45.0%).35 The differences with the CM Survey may be illustrative: publications and reports are in the first position and informal interaction in the second.
It is too early to draw conclusions from these comparisons, but tentatively three points should deserve a closer scrutiny: 1) the stage of formation of an immature NSI may explain the importance of “informal interaction”; 2) the importance of “recent hires” in the MG Survey reinforces the role of universities in immature NSIs, 3) this role is further reinforced with a comparison between the role of “personnel exchanges”, 5.8% in the CM Survey and 25.0% in the MG Survey.36
In a post-interview stage, an example of a cooperative research came from a steel industry firm: a research about “the characterization of phosphate layers through infrared spectrometry”, a project that helps the technical assistance area of the firm, as it unveils the mechanisms of resistance to corrosion of paintings.37 This may be an example of the complementary role that university research may perform with firm’s R&D.
Another related question is the “use of public research outputs and resources in industrial R&D” (see Table 2, Cohen et all, 2002, p. 9). In the MG Survey a new topic is included: laboratories. And laboratories are scored as at least “moderately important” by 62.6% of respondents. This finding suggests that universities resources may be an outsourcing alternative for expensive investments by R&D-performers. Two examples illustrate this point. First: one firm in the steel industry contracted a laboratory from the UFOP to perform analysis of iron ore extracted from a new mine. The reason for 34 At least to other examples of training as an important pathway were gathered during and after interviews: another firm in
the steel industry and one firm in the mining sector report programs of post-graduate studies for their researchers. In all cases, it is important to stress the direction of the flow: the demand comes from firms. These examples suggest a necessary improvement in the questionnaire to capture this pathway more clearly.
35 A R&D manager of a food sector firm reported the use of publication (scientific publication) to solve a very specific problem in her firm. During a bell-pepper processing phase, there is a problematic product discoloration. Looking to ways to avoid this discoloration, the researcher looked for papers in the libraries of two universities (UFV and UFLA), preparing a file with all theoretical solutions to her problem and selecting a solution feasible to the firm. Of course, the use of universities facilities was possible by her contacts established during her undergraduate and graduate courses. This case probably highlights that a previous involvement with universities is necessary even for the prosaic use of library facilities.
36 Personnel exchanges involve internship programs for undergraduate students, a topic that could be better investigated under a question specific to training.
37 This research may be characterized as “scientific research with immediate application” in section 5.1.
27

this contract is that the equipment is very expensive and the firm would use it only sporadically. Second: one firm from the food sector contracted a laboratory from Unicamp (Campinas, São Paulo) to evaluate the nutritional features of a new product (necessary to put in the product label and to market its fat-less nature). Again, for the firm there is no reason to buy such expensive equipment to be used occasionally, indicating that the university equipment may enjoy scale economies as it performs the same service for other firms in the food sector (and this scale economy may exist also in the cases of mining and steel sectors). These reports about the role of universities laboratories to firms are another indication of how universities may complement firm’s R&D.
Comparing with the CM Survey, research findings were the most scored public research output, followed by instruments and techniques. In the MG Survey, besides the leading role of laboratory use, there is an inversion between the positions of “research findings” (50,4% of respondents) and “instruments and techniques” (52.5%). “Prototypes” are important for 29.5% of respondents.38 4.3. Spots of Interaction (1) The investigation of the relevance of scientific and engineering disciplines to industrial innovation is one of the most important contributions from the Yale Survey to the economics of technology. The CM Survey further investigates this subject, presenting a table with the “importance of public research by academic disciplines” disaggregated by industrial sectors (Cohen et all, 2002, p. 11).
The MG Survey has a question (number 9) to investigate this relationship in Minas Gerais. Few modifications were introduced: 1) disciplines that were in the Yale Survey but not in the CM Survey are re-included, given the industrial structure of Minas Gerais (Geology, Metallurgy, Agricultural sciences); 2) new disciplines are included, given the specificities of Brazilian economy (Veterinary, Food Science and Technology, Industrial Design, Civil Engineering, and Mechanical Engineering).
The results are in Table VII. Table VII has less industrial sectors and more S&E fields vis-à-vis CM Survey Table 3 (Cohen et all, p. 11).39
38 Cohen et all (2002, p. 9) use “weighted percentage of R&D projects” in their Table 2. Therefore, the comparison may be
only ordinal. 39 There are 18 firms without a 3 or a 4 in question 9 (12.9% of the respondents).
28

TABLE VII Importance of Public Research by Science & Engineering Fields
Agr
onom
y
Com
pute
r Sc
ienc
e Fo
od S
cien
ce
aT
olo
nd
echn
gy
Bio
logy
Indu
stria
l D
esig
n
Civ
il En
gine
erin
g
Mat
eria
ls a
nd
Met
al. E
ng
Min
ing
Enge
neer
ing
Elec
trica
l En
ginn
erin
g
Mec
hani
cal
Engi
neer
ing
Che
mic
al
Engi
nner
ing
Phys
ics
Geo
scie
nces
Mat
hem
atic
s
Med
icin
e
Vet
erin
ary
Che
mis
try
ISIC code ISIC sector N
Percentage of Respondents Indicating Research “Moderately” or “Very” Important 01 + 02 Agriculture 5 80.0 60.0 20.0 80.0 0.0 0.0 0.0 0.0 0.0 0.0 0.0 0.0 20.0 40.0 0.0 40.0 0.013 + 14 Mining 10 20.0 30.0 0.0 0.0 20.0 20.0 80.0 90.0 30.0 40.0 40.0 20.0 50.0 20.0 10.0 0.0 20.0
15 Food 19 42.1 10.5 84.2 26.3 0.0 0.0 5.3 0.0 0.0 5.3 21.1 0.0 0.0 0.0 5.3 36.8 31.617+18+19 Apparel, Textiles and Leather 8 37.5 50.0 12.5 25.0 37.5 12.5 12.5 12.5 12.5 25.0 25.0 25.0 12.5 0.0 12.5 0.0 37.5
21+24 Paper And Chemicals 21 14.3 14.3 14.3 57.1 28.6 9.5 23.8 4.8 4.8 23.8 42.9 9.5 4.8 4.8 33.3 42.9 38.125 Rubber/Plastic 5 0.0 40.0 40.0 0.0 80.0 0.0 20.0 0.0 20.0 20.0 80.0 0.0 0.0 20.0 0.0 0.0 40.026 Non-Metalic Mineral Products 4 0.0 0.0 0.0 0.0 0.0 0.0 100.0 25.0 25.0 25.0 75.0 25.0 0.0 25.0 0.0 0.0 50.027 Basic Metallurgy 11 27.3 18.2 0.0 0.0 36.4 36.4 81.8 36.4 36.4 45.5 54.5 0.0 0.0 9.1 9.1 0.0 27.328 Metal Products 8 0.0 12.5 0.0 0.0 25.0 12.5 50.0 0.0 0.0 37.5 25.0 12.5 0.0 12.5 0.0 0.0 25.029 Machinery and Equipment 8 0.0 37.5 0.0 0.0 37.5 12.5 25.0 25.0 37.5 75.0 0.0 12.5 0.0 12.5 0.0 0.0 0.031 Electrical Machinery and Equip. 9 0.0 11.1 0.0 0.0 22.2 0.0 33.3 0.0 55.6 22.2 11.1 0.0 0.0 0.0 0.0 0.0 0.032 Electronic and Comm. Equip. 3 0.0 100.0 0.0 0.0 33.3 0.0 0.0 0.0 66.7 33.3 0.0 33.3 0.0 33.3 0.0 0.0 0.033 Medical Equip. and Precision Inst. 11 0.0 45.5 0.0 9.1 18.2 9.1 36.4 18.2 54.5 45.5 0.0 27.3 0.0 9.1 27.3 0.0 9.1
34 + 35 Car/Truck 6 0.0 0.0 0.0 0.0 16.7 0.0 66.7 0.0 16.7 50.0 33.3 33.3 0.0 16.7 0.0 0.0 50.036 Furniture 6 16.7 0.0 0.0 0.0 16.7 0.0 16.7 0.0 0.0 16.7 33.3 0.0 0.0 0.0 0.0 0.0 0.040 Electricity 3 33.3 66.7 0.0 66.7 33.3 66.7 66.7 33.3 100.0 66.7 33.3 66.7 33.3 66.7 0.0 33.3 33.3 85 Biotechnology 3 0.0 33.3 0.0 100.0 0.0 0.0 0.0 0.0 0.0 0.0 33.3 0.0 0.0 0.0 66.7 0.0 0.0
TOTAL 140 17.9 25.0 16.4 20.7 22.9 10.0 35.0 15.0 22.1 30.0 29.3 12.1 6.4 10.7 11.4 13.6 23.6
Source: authors' elaboration.

Table VII shows a basic coherence: Geosciences, for instance, is indicated as important to 50% of respondents in the Mining sector; Biology is important for more than 50% of respondents in “Agriculture”, Leather, Chemicals (Drugs is in this sector), Electricity (environmental conditions might be an issue) and “Biotechnology”.40 Food science and technology is important for 84.2% of respondents in the Food industry. In general, this picture shows how a diversified economy needs a diversified scientific infrastructure to feed its industrial innovation.
Materials and Metallurgic Engineering are the most pervasive disciplines in the MG Survey (35.0% of respondents scored them as at least moderately important). The most important discipline in the CM Survey is Materials Science (42.6% of respondents scored it as at least moderately important). Mechanical Engineering is in the second rank (30.0%), Chemical Engineering is third (29.3%) and Computer Science is fourth (25.0%). In the CM Survey, Computer Science is in the second position.
There are differences in the importance of public research disaggregated by academic discipline, probably indicating the more diffused nature of public research in mature NSIs and a more concentrated impact (in the relationship between industrial sectors and academic disciplines) in the case of immature NSIs. A look at zeros in Cohen’s Table 3 (5.6% of Table’s cells) and in Table VII (41.2% of Table’s cells) suggests this point . Therefore, Table VII identifies interactions between ISIC sectors and S&E fields, but these are just spots.
The MG Survey includes an adaptation of the original surveys to capture which universities or public institute the respondents mention as the most relevant in each discipline (that they had scored 3 or 4). The results show UFMG quoted at least once by 61 firms, followed by UFV with 19 firms and USP with 14 firms. The first public institutes are ITAL (11th position in general) and EMBRAPA, with 5 firms each, followed by CEFET (14th position) with 4 firms. These results show that geographical proximity is important, but that quality of research (and/or lack of local resources) may lead to knowledge flows beyond the state boundaries.
The MG Survey questionnaires are answered by R&D Managers (or by a person in an equivalent position, where there is not a formal R&D Department). The are 29 PhDs (20.7%); 46 Masters (32.9%); 59 researchers with University degrees (42.1%) and 6 technicians with secondary level degrees (4.3%). It is noteworthy that there is a correlation between the institution where the R&D manager got his/her education and the institutions quoted as most relevant in each S&E field (question 9): 46.8% of respondents indicate the institution where he/she graduated as important in question 9. This makes sense, according to one pre-interview conversation: once a researcher faces a problem, it is natural for him/her to look for the team of his/her former supervisor to discuss solutions.
40 Souza-Antunes (2001) provides a general overview of biotechnology in Minas Gerais, investigating 36 biotechnology
firms. Most, 81%, of these companies consider the proximity with important universities and 67% declares some link with them (supply of skilled labor, equipments and laboratories, besides facilitating traineeship and agreements, development of products, projects together and ideas with industrial application). Furthermore, the contribution of universities is demonstrated for the founders / partners have graduated in these institutions or they worked for them. Beyond the supply of labor, 52% of the interviewees considering proximity with the university as important indicate "facilitating research" (including equipment use) as the most important advantage of proximity. However, the entrepreneurs point difficulties for joint projects, mentioning the lack of interest in private sector projects the lack of an appropriate structure for these negotiations. Therefore, such relationships assume an informal character. Previous connections with universities may explain this informality: 36% of the sample firms are spin-offs of the universities in Minas Gerais. They used the structure of the university to create their own companies and to maintain their activities outside the university. It seems that these informal relationships are related to the problem of lack of continuity of the projects.
30

A preliminary exercise to investigate these spots of interaction, taking as reference an arbitrary number of at least 5 firms scoring the S&E field as important, would show 14 spots of interaction: 1) Mining (ISIC 13 and 14) and Materials and Metallurgic Engineering; 2) Mining and Mining Engineering, 3) Mining and Geosciences, 4) Food Industry (ISIC 15) and Agronomy, 5) Food and Food S&T, 6) Paper and Chemicals (ISIC 21 and 24)41 and Biology, 7) Paper and Chemicals and Chemical Engineering, 8) Paper and Chemicals and Veterinary, 9) Basic Metallurgy (ISIC 27) and Materials and Metallurgic Engineering, 10) Basic Metallurgy and Chemical Engineering, 11) Machinery (ISIC 29) and Mechanical Engineering, 12) Electrical Machinery (ISIC 31) and Electrical Engineering, 13) Medical and Precision Instruments (ISIC 33) and Computer Science, and 14) Medical and Precision Instruments and Electrical Engineering.
The spots are more concentrated in low and medium tech sectors, reflecting the specialization of Minas Gerais around the metal-mechanic industrial complex (mining, iron, steel and machinery) and in industrial sectors as food industry (with its roots in agricultural and cattle-raising activities). It shows a more limited presence of high tech sectors as chemicals and precision instruments. 5. CNPQ DIRECTORY RESULTS: RESEARCH GROUPS AS RESPONDENTS This section presents results from the MG CNPq Directory, with its 175 interactive research groups from Minas Gerais interacting with 317 firms. 5.1. Science and Enginnering Fields and Types of Relationship The specialization of Minas Gerais by S&E fields is not well captured by the MG Survey (see Table VII). The MG CNPq Directory offers a broader view on this regard (see Table IV and Table VIII).
Section 3.2 shows the concentration of research groups-firms interactions in Minas Gerais in groups from Agronomy and Engineering related fields. Table VIII shows the distribution of relationships types in the 15 more interactive S&E fields.
Table VIII shows the relationships flow originating in research groups toward firms. The more frequent relationship is “scientific research with immediate applications”, followed by “technology transfer” and “scientific research without immediate applications”. This pattern is more or less the same in all S&E fields, the exceptions being related to knowledge specificities. In Electrical Engineering “no routine engineering” is more frequent than technology transfer, as in Computer Science “software development” is more frequent than “scientific research without immediate applications”. In other hand, in Ecology, Geosciences and Chemical Engineering “scientific research without immediate applications” is more frequent than “technology transfer”. This general framework suggests the use of universities and public labs as alternatives to firms R&D internal activities (these data, however, does not help to understand whether the universities substitute or complement firms R&D).
41 There are 20 firms from the Chemicals industry and one from pulp and paper.
31

TABLE VIII Leading Science & Engineering Fields by types of relationship
Minas Gerais, 2005
Types of relationship
Agr
onom
y
Mec
hani
cal
Eng.
Elec
trica
l Eng
.
Civ
il En
g.
Com
pute
r Sc
ienc
es
Fore
st E
ng.
Agr
icul
. Eng
.
Mat
. & M
etal
. En
g.
Min
ing
Eng.
Vet
erin
ary
Ecol
ogy
Med
icin
e
Zoot
ecni
ccny
Geo
scie
nces
Food
S&
T.
Che
mic
al E
ng.
Che
mis
try
Tota
l
Scientific research with immediate application 19 12 12 8 7 8 5 8 1 4 1 2 3 5 2 3 2 102Technology transfer 15 7 5 7 7 5 6 4 2 3 1 3 1 1 3 1 3 74Scientific research without immediate application 10 6 7 5 3 3 2 4 2 0 4 3 1 2 1 2 1 56Training 5 3 4 1 2 4 1 2 1 2 0 2 2 0 2 1 0 32Consultancy 4 4 1 5 0 2 2 2 0 1 1 0 2 1 0 0 1 26No routine engineering 0 4 6 1 3 0 1 2 2 0 0 0 0 0 0 1 1 21Software development 0 5 5 0 5 0 0 0 0 0 0 0 0 0 0 0 0 15Others 3 2 0 0 0 3 2 0 2 1 1 1 0 0 0 0 0 15
Total 56 43 40 27 27 25 19 22 10 11 8 11 9 9 8 8 8 341
Source: CNPq Directory of Research Groups, current database 2005, author's elaboration.

Size matters for these types of relationship. In regard to “scientific research”, small firms demand relatively more the type “with immediate application” and medium/large firms demand more the type “without immediate application”.42 A look at the specific demands of micro/small/medium-sized firms shows that they demand more the type of relationship “technological transfer” vis-à-vis the demands of large firms.
An example of this “scientific research with immediate application” was collected in the post-interview phase of the MG Survey. One biotech firm (in the drug sector) demanded to a research group (in the field of imuno-parasitology) a diagnosis method for an acute form of toxoplasmosis. The research group created a research line on this, and after six years of research (leading to two papers and two PhD Dissertations) the research group delivered a high precision diagnostic kit. Afterwards the firm adapted it to large scale production. This drug/biotech firm is a small firm. This case may be another example of university research substituting for firm’s R&D.43 Unfortunately, the research group does not declare this relationship, a further indication of how the CNPq Directory may be underestimating the interactivity level of important research groups.
The importance of training as a relationship between groups and firms is clear in Table VIII. As section 4.2 mentions, in conversations with R&D managers for the MG Survey this appears as important for firms in the mining and in the steel sectors. There is other anecdotal evidence pointing to an underestimation of this type of relationship by the CNPq Directory. One physicist, working within a network of Materials Engineering Program, reports teaching activities involving post-graduate courses demanded by firms that were not informed in his research group questionnaire. 5.2. Interactions Within and Outside Minas Gerais
This section presents the distribution of interactive research groups according to their institution (universities and research institutes). Table IX shows the leading institutions from Minas Gerais, ranked by the number of interactive groups. Table IX introduces important information regarding the location of firms that interact with each university. There are 178 firms from Minas Gerais (56%) and 139 firms from other states (44%).
42 Rapini (2004) presents an explanation for this differentiation, for small firms do not have internal resources to transform
results “without immediate application” straight into new products/processes. On the contrary, larger firms have these resources.
43 This example is interesting because the firms start the process, demanding a research to the university. Therefore, even in a LDC biotech sector, the linear model does not fit well.
33

TABLE IX Relationship between Universities/Research Institutions from Minas Gerais and Firms: Total, Firms
located within and outside Minas Gerais, by Interactive Groups and Firms interacting with these groups, Minas Gerais, 2005
All Firms Firms within MG Firms outside MG
Institution Groups Firms Institution Groups Firms Institution Groups Firms UFMG 53 85 UFMG 48 61 UFV 23 45 UFV 33 88 UFV 26 43 UFMG 15 24 UFLA 15 36 UFLA 15 22 UFU 7 17 UFU 13 30 UFU 13 13 UFLA 6 14 UFJF 12 17 UFJF 11 13 Unifei 4 27 Puc Minas 9 15 Puc Minas 8 9 UFOP 3 3 UFOP 7 13 UFOP 7 10 UFJF 3 4 Cetec 4 8 Unifei 4 4 Puc Minas 3 6 Unifenas 4 4 Cetec 4 8 Cnen 2 2 Unifei 4 31 Epamig 4 5 Uniube 1 3 Epamig 4 6 Unifenas 3 3 Unifenas 1 1 Cnen 2 5 Fafeid 2 1 Funed 1 1 Uniube 2 6 Cefet/MG 2 3 Fiocruz 1 1 Cefet/MG 2 3 Uniube 2 3 Epamig 1 1 Others 12 14 Others 8 13 Embrapa 1 1 Total 176 317 Total 157 178 Total 72 139
Source: CNPq Directory of Research Groups, 2005, author's elaboration
Regarding within the state interactions, UFMG, UFV and UFLA lead. Righi (2005) reports the different specializations of these leading universities. The more interactive research groups from UFMG are distributed among four S&E fields (Civil and Mechanical Engineering, Computer Science and Veterinary), while the groups from UFV and UFLA are predominantly from Agronomy, Agriculture Engineering and Forestry Engineering.
Regarding interactions beyond the state boundaries, the ranking is different: UFV, UFMG and UFU. The firms are distributed along Brazilian states, with São Paulo in the leading position (49% of these interactions). Once more, different patterns of specialization are identified. Forest Engineering, Zootechny and Agronomy are the leading S&E fields in UFV;44 Mining and Electric Engineering lead in the case of UFMG; and Mechanical Engineering leads in UFU.
UNIFEI is an interesting case, as it has interactions with firms distributed among 11 different Brazilian states: this might be attributed to its long lasting expertise in electrical engineering and its strategic location, near São Paulo and Rio de Janeiro. Public research institutes as EPAMIG and CETEC reported only within the state interactions.
These data may help to identify a pattern of division of labor between institutions from Minas Gerais. And this division of labor may help to improve the overall state capabilities and inform a more accurate design of public policies.
44 It is important to stress that in the case of UFV there are interactions between its research groups and large domestic and
transnational firms from the pulp and paper sector.
34

5.3. Spots of Interaction (2) Table X presents an overall picture of interactions between ISIC sectors and S&E fields, according to the interactive research group point of view. This Table displays for Minas Gerais what Rapini (2004) shows for Brazil.
As in Table VII, Table X crosses ISIC sectors and S&E fields. However, in Table X each cell has two-numbers information (nrg/nf), informing the number of research groups (nrg) (of that specific S&E field) and the number of firms (nf) (of that specific ISIC sector) with interaction. One firm (and one research group) may be counted more than once in a cell (and therefore in the line total and in column total), for they may interact with more than one research group (or firm).
35

TABLE X ISIC sectors and Science & Engineering Fields, by Research Groups and Firms with interaction,
Minas Gerais, 2005
ISIC Code Economic Sector
Firm
s (N
)
Agr
onom
y
Com
pute
r Sci
.
Food
S&
T
Ecol
ogy
Agr
ic. E
ng.
Civ
il En
g.
Mat
. Met
al. E
ng.
Min
ing
Eng.
Elec
trica
l Eng
.
Mec
hani
cal E
ng.
Che
mic
al E
ng.
Phar
mac
y
Phar
mac
olog
y
Geo
scie
nces
Med
icin
e
Vet
erin
ary
Che
mis
try
Fore
st E
ng.
Zoot
echn
y
Oth
ers
Tota
l (1)
G
roup
s/Fi
rms
1+2+5 Agriculture 31 15/20 / 1/2 / / / / / / / / / / / / 1/1 / 5/11 1/1 1/1 24/36 11+13+14 Mining &Oil 16 3/3 / 1/1 1/1 / 2/2 1/1 1/3 1/1 / 1/1 / / 3/3 / / 1/1 3/1 / / 18/18
15 Food 24 3/8 / 2/3 / / / / / 1/1 / 2/3 / / / / 2/7 / 1/1 1/1 2/2 14/26 20 Wood &Cork (not furniture) 4 / / / / / 1/1 / / 1/1 / / / / / / / / 2/2 / / 4/4
21+22 Paper &Publishing 18 6/7 / / / 1/2 / / / 1/2 / 1/1 / / / / / 1/1 8/15 / 1/1 19/29 23 Refined Petroleum and Nuclear Fuels 9 1/7 / / 1/1 / / / / 1/1 1/1 1/1 / / / / / / / / / 5/11 24 Chemicals 32 4/6 / / / / 1/1 / / / 1/1 2/2 3/3 2/6 / 1/1 2/2 4/4 / 1/4 6/7 27/37 25 Rubber/Plastic 2 / / / / / / / / / 1/1 / / / / / / / / / 1/1 2/2 26 Non-Metallic Mineral Products 3 1/1 / / / / / / 1/1 1/1 / / / / / / / / / / / 3/3 27 Basic Metallurgy 18 / 1/1 / / / 3/3 7/10 1/1 2/4 7/5 1/1 / / / / / / 3/2 / / 25/27 28 Metal products 6 / / / / / 1/1 2/2 / / 2/3 / / / / / / / / / / 5/6 29 Machinery 10 / 1/1 / / 2/6 / 2/2 / / 1/1 / / / / / / / / / / 6/10
30+31+32 Office, Electrical &Electronic Machinery 5 / 1/1 / / / / 1/1 / 2/2 1/1 / / / / / / / / / / 5/5
33 Precision Instr. 6 / 2/2 / / 1/1 / / / 1/2 / / / / / / 1/1 / / / / 5/6 34+35 Car/Truck 4 / / / / / / 1/1 / / 7/8 / / / / / / / / / / 8/4
36 Furniture 3 / / / / / 1/1 / / 1/1 / / / / / / 1/1 / / / / 3/3 40 Electricity 26 3/1 2/5 / 4/2 / 1/1 / / 8/20 3/1 1/1 / / 1/1 / / 1/1 2/2 1/1 5/7 32/43 72 Computer & Related Activities 11 / 5/7 / / / / / / 1/2 1/1 / / / 1/1 / / / / / / 8/11 85 Health & Biotechnology 10 / / / / / / / / / / / / / / 3/3 1/1 1/1 / / 6/6 11/11
Others (2) 79 12/12 4/4 2/2 3/2 8/8 10/10 4/4 2/4 5/5 7/7 3/3 1/1 / 3/3 / 1/2 1/1 2/2 5/6 9/10 82/86 Total (1) Groups/Firms 317 48/65 16/21 6/8 9/6 12/17 20/20 18/21 5/9 26/43 32/25 12/13 4/4 2/6 8/8 4/4 9/15 9/9 26/36 9/13 31/35 306/378
Source: CNPq Directory of Research Groups, 2005, author's elaboration (1) Total presented may count firms and research groups more than once (2) ISIC Sectors 37,41,45,51,52,60,64,73,74,75,80,91, and firms in non identified sectors.

On the one hand, the lines totals inform the more interactive ISIC sectors. Ranking the ISIC sectors by the number of firms in the total (the second number), Electricity leads (32/43), followed by Chemicals (27/37), Agriculture (24/36), Basic Metallurgy (27/37) and Paper & Publishing (19/29). These numbers are correlated with the number of firms in each ISIC sector. Another important information is on the number of S&E fields with whom each ISIC sector interacts: Electricity has interactions with 11 S&E fields (excluding others), Chemicals with 10; Agriculture with 5; Basic Metallurgy with 8 and Paper & Publishing with 6.
On the other hand, the columns totals inform the more interactive S&E fields. Ranking the S&E fields by the number of research groups in the total (the first number), Agronomy leads (48/65), followed by Mechanical Engineering (32/25), Electrical Engineering (26/43), Forest Engineering (26/36), Civil Engineering (20/20) and Materials and Metallurgic Engineering (18/21). Regarding the influence of S&E fields on ISIC sectors, Agronomy has interactions with 8 sectors (excluding others); Mechanical Engineering with 10; Electrical Engineering with 12; Forest Engineering with 7; Civil Engineering with 6 and Materials and Metallurgic Engineering 6.
Combining lines and columns, the cells show the spots of interaction. Searching for cells with at least 5 research groups interacting with at least 5 firms (5/5), there are 9 spots of interaction: Agriculture and Agronomy (15/20); Electricity and Electrical Engineering (8/20); Paper & Publishing and Forest Engineering (8/15); Basic Metallurgy and Materials and Metallurgic Engineering (7/10); Car/Truck and Mechanical Engineering (7/8); Basic Metallurgy and Mechanical Engineering (7/5); Paper & Publishing and Agronomy (6/7); Agriculture and Forest Engineering (5/11); and Computer & Related Activities and Computer S&T (5/7).45
As section 4.3 indicates, the spots are more concentrated in low and medium tech sectors. The data reinforce the identification Minas Gerais specialization around the metal-mechanic industrial complex (car/truck is included here) and highlight Agriculture (and its S&E related fields), Pulp and Paper (and Forest Engineering as S&E field).
45 The puzzle of the weak interactive level of health-related disciplines may have something to do with the disaggregation level of
these S&E fields: there are 11 S&E health-related fields (involving Biochemistry, Physiology, Immunology, Genetics, Parasitology etc) that are aggregated under “others” in Table X. In an attempt to circumvent this problem, these 11 health-related disciplines are counted together, and Medicine and Pharmacology are further included. The result is two more spots of interaction: 1) Chemicals and these 13 health-related disciplines (8/13); 2) Health and Biotechnology (ISIC sector 85) and these health related disciplines (9/9). Furthermore, if Veterinary and Zootechny are counted as a single S&E field, another spot would appear: Health and Biotechnology (ISIC sector 85) and Veterinary and Zootechny (6/8). Therefore, there would be 12 spots of interaction, instead of 9, as reported in this section.
37

6. MATCHING THE TWO DATABASES This section describes the findings that these two bodies of information may uncover as they are putted together. Although this matching of the two databases is an initial exploration of their contributions, three important findings are highlighted. Indications of further research are presented in the next section. 6.1. The Firms in the Intersection There are 32 R&D-performer firms from MG in both databases.46
Table XI presents data collected for these 32 firms, regarding the importance of information sources (from the MG Survey) and the more frequent types of relationship (from CNPq Directory).
TABLE XI Firms in the intersection between the MG Survey and the CNPq Research Groups Directory,
Information Sources (MG Survey) and Types of Relationship with Research Groups (CNPq Directory) Minas Gerais, 2005
Information Sources (1) (MG Survey)
Respondents (Firms) Indicating Source as
Important
Types of Relationship (2) (CNPq Research Group Directory)
Respondents (Research Groups) Indicating Types of
Relationships
Cooperative or jointed R&D Projects 22 Scientific Research with immediate application 26
Consulting (of universities and researchers) 21 Scientific Research without immediate application 17
Informal interaction 20 Technology transfer from group to firm 14 Meetings or conferences 18 Training 10 Recent hires 18 Software development 8 Contract Research from Universities or Research Institues 18 Consultancy 7
Publications and Reports 18 No routine engineering to the firm 6 Temporary exchange programs 7 Other relationships 2 Licensed technology 7 Patents 5 Total of Firms 32 Total of Firms 32
Source: CNPq Directory of Research Groups, MG Survey, 2005, author's elaboration
(1) See Table VI for the answers of all MG Survey Firms. (2) See Table VIII for the answers of all Research Groups from Minas Gerais.
The comparison between Table XI and the Tables regarding the whole universe (Tables VI and VIII) indicates important ranking differences in the answers.
46 This intersection is larger than these 32 firms, given underestimation problems in the CNPq Directory and the existence of
R&D-performer firms that declined to answer the MG Survey questionnaire but are in the CNPq Directory.
38

Regarding the MG Survey as a whole, Table XI indicates more formalized information sources: on the one hand, informal interaction, in first place in Table VI, falls to third position in Table XI. On the other hand, cooperative research, in fifth position in the whole MG Survey universe jumps to the first position in the intersection shown in Table XI.
Regarding the CNPq Directory, the main change is in the second position: scientific research without immediate application ranks second in Table XI while it is in third position in Table VIII. Probably this is an indication of more sophisticated long term research contracted by these firms.
In sum, this intersection shows that the interactions between firms and universities are less informal, more cooperative, emphasizes scientific research, even without immediate application. Furthermore, this intersection highlights the role of a more long term relationship between them: training. 6.2. Non-R&D Performers and Their Relationships
The matching of the two databases suggests a way to investigate the non-R&D performer firms that indicate universities as important source of information. In the case of Minas Gerais, this can be done tentatively: exclude the intersection between the two databases from the MG CNPq Directory and the result might be the non-R&D performer firms (146 firms). A look at Table XII provides preliminary information about the use of universities by these non-R&D performer firms from Minas Gerais (there are 135 firms, because 9 firms that were not in the MG Survey are clearly R&D-performer that did not answer the questionnaire).
There are two main differences with the ranking of types of relationships from the firms in the intersection. First, scientific research without immediate application falls to the third position. Second, consultancy jumps to the fourth position, overtaking training and software development.
TABLE XII Types of Relationship declared by Research Groups with non-R&D Performer Firms
MinasGerais, 2005
Types of relationship Firms Scientific Research with immediate application 89 Technology transfer from group to firm 73 Scientific Research without immediate application 33 Consultancy 30 Training 23 Software development 12 No routine engineering to the firm 10 Total of Firms 135
Source: CNPq Directory of Research Groups, MG Survey, 2005, author's elaboration
39

In sum: the non R&D-performer firms in Minas Gerais seem to value scientific research with immediate application (which may indicate the substitutive role of university research). The decline of training and the rise of consultancy may signal a more short term relationship with universities (universities as trouble-shooter). 6.3. Pinpointing Spots of Interaction in Minas Gerais The research tools suggested by this pilot study are useful to identify partial connections hinted in previous investigations on immature NSIs. They identify “spots of interaction” in Minas Gerais, Brazil. This identification is relatively precise, and the matching of questionnaires answered by firms with questionnaires answered by university research groups contributes to pinpoint where are these spots of interaction (ISIC sectors and S&E fields).
Tables VII and X summarize these spots. A combination between them informs on the one hand, economic sectors with more pervasive relationship S&E fields and, on the other hand the S&E fields that are more pervasive in their links to industrial R&D. The ranking of S&E fields is different in these Tables. In the case of firms evaluating S&E fields, the ranking is: 1) Materials and Metallurgic Engineering; 2) Mechanical Engineering; 3) Chemical Engineering; 4) Computer Sciences. In the other way, research groups reporting interactions, the ranking according to the number of firms is 1) Agronomy; 2) Electrical Engineering; 3) Forest Engineering; 4) Mechanical Engineering.
Another difference is the position of Medicine and Veterinary: they are closer in Table VII (11.4 and 13.6) than in Table X (4/4 and 9/15). A further difference involves Food S&T and Civil Engineering: Food S&T is ahead in Table VII (16.4 against 10.0) but behind in Table X (6/8 against 20/20).
These differences could be explained by the inclusion of non-R&D performer firms and firms located outside Minas Gerais and by the exclusion of universities outside Minas Gerais from the MG CNPq Directory (base for Table X). Therefore, Table VII presents a picture of the needs of firms from Minas Gerais in relation to S&E fields (that spill over towards other states) and Table X presents the potential contribution of universities from Minas Gerais to firms in general (that attracts firms from other states).
As an introduction for public policies, these matches and mismatches may help their design: on the one hand, strengthening S&E fields that are weak in Minas Gerais and that have demands within the state (food S&T, for example); on the other hand, providing incentives to local firms to take advantage of local scientific specializations (Agronomy, and Engineering fields)
40

7. TWO PRELIMINARY CONCLUSIONS AND FURTHER RESEARCH This one state pilot study may be seen as an opportunity for a stepwise approach in the preparation of a broader research, involving Brazil as a whole and in a collaborative effort with other research groups. This stepwise approach means that conclusions of one phase may be transformed into new questions in a further phase.
The most important contribution of this paper is the experience accumulated for next steps of this research. This observation explains why this section presents only two very preliminary conclusions. 7.1. Two Preliminary Conclusions
This investigation suggests two preliminary conclusions that are tentative answers to questions discussed in section 1, about the nature of interactions in immature NSIs and about the role of universities in these interactions. These two preliminary conclusions may inform next steps in this research. 7.2.1. The Nature of Interactions in an Immature NSI
Spots of interaction summarize the nature of the relationships between firms and universities in an immature NSI. On the one hand, spots of interaction show how and where firms and universities interact in immature NSIs. On the other hand, they indicate their localized nature. Although localized, spots of interaction suggest that universities in immature NSIs may not be seen as “ivory towers”. These spots of interaction are deeply related to local scientific and technological specializations.
The importance of these spots of interaction should not be underestimated, as they probably contribute to keep the gap vis-à-vis developed countries more or less constant: these spots of interaction are related to the “red queen effect” and to the running necessary to stay in the same place.
These spots of interaction are related to the technological heterogeneity that structuralists have identified to characterize the nature of Brazilian underdevelopment (Furtado, 1986). 7.2.2. The Dual Role of Universities in these Intractions
These spots of interaction present questions for a research agenda on the role of universities in immature NSIs. This paper suggests that beyond traditional functions (source of information, supply of specialized labor, training, etc), universities may, regarding interactions with firms, perform a dual role: they substitute and they complement firms R&D.
41

The weaker firms’ involvement in R&D activities in immature NSIs vis-à-vis mature NSIs might explain this dual role.47 The substitutive role is clear in the case of non-R&D performer firms that contract university research. It is also clear in the case of R&D-performer firms that contract research they can not perform within their labs. The complementary role is clear in the case of larger firms that may use expensive resources as laboratory equipment in universities and perform some tasks in their own labs. This complementarity may be related to the scientific infrastructure role as an “antenna” for international sources of science and technology and strengthen the role of universities and research institutes (important for the most sophisticated domestic firms).
In this dual role, it is important to stress that universities in immature NSI (even in a state like Minas Gerais) perform research-related functions that are typical of universities in more developed countries. In Minas Gerais (as an important CM Survey finding indicated), universities are more important as sources of information for project completion than for suggesting new projects. Probably, there is a division of labor between the substitutive and complementary roles. 7.2. An Agenda for Further Research
The next step is an investigation involving Brazil as a whole (Brazil Survey, henceforth).48 This broader database would allow safer comparisons with Yale and CM Surveys.
This is the scenario where the complementarity between the two databases could be better exploited.
This complementarity would help the preparation of the Brazil Survey database: the target is 2,432 systematic R&D-performer firms (and there is the need of an initial phase where the goal is the identification of these 2,432 firms). During this initial phase, a database from the CNPq Directory can be prepared, with its 2,151 interactive research groups and the 2,768 firms/institutions that they have contact with. Beginning this way, it would be possible to interview the R&D-performer firms with information in advance of firms in the intersection. Even the design of Brazil Survey questionnaire may be improved by CNPq data, especially data regarding S&E fields.
The complementarity may be further exploited during the Brazil Survey, organizing case studies crossing firms R&D and universities research groups. The firms in the intersection of these two databases could be the focus of this investigation.
The two preliminary conclusions (spots of interactions and dual role of universities) should be investigated in this new step. First, the Brazil Survey questionnaire may be further adapted to introduce a question about the substitutive and complementary roles of universities. Second, a conjecture to be further
47 Cohen et all (2002, p.14) find indications that “public research may partly substitute for a firm’s own R&D”. 48 This section benefits from a meeting with Prof. Wilson Suzigan (Campinas, SP, 20 December 2005) about a Brazil Survey and
conversations with Jorge Britto (UFF) and Ana Cristina Fernandes (UFPE).
42

investigated: the spots of interactions may vary deeply across Brazilian states. São Paulo might have larger spots of interaction than Minas Gerais. Therefore, indicators to measure these spots may be designed in further research steps.
One additional next research step involves an investigation about the non-R&D performer firms in Minas Gerais. It is necessary to tailor a specific questionnaire to understand how these firms use universities, investigating the conjecture of the substitutive role performed by universities. This research step benefits from the complementarity between the two databases, as the matching between the MG Survey and the CNPq provides a list of 135 firms to be interviewed. ACKNOWLEDGMENTS
The authors thank Richard Nelson for comments on a draft version of this paper, for kindly providing the original questionnaires of the Yale Survey and of the Carnegie Mellon Survey, and for enlightening discussions on theoretical and methodological issues. The authors also thank Alvin Klevorick and Wesley Cohen for allowing the access to the original questionnaires of those pioneering Surveys. Mariana Rebouças and her team at the IBGE have provided a worthwhile help preparing original tables using data from PINTEC (2003). Silvana Cosac (CNPq) provided essential information about the CNPq Research Groups Directory and about the changes introduced in its 2004 version. Research assistance from Thaís Henriques, Elaine Rodrigues, Raquel Guimarães and Felipe da Mata is acknowledged. Discussions of various versions of the questionnaire with Fabiana Santos, Heloísa Menezes, Christian Souza and Mauro Borges Lemos have contributed to shape its final format. Comments and suggestions from participants during two meetings of the Catch Up Project (New York, May 2005; and Tshwane, November, 2005) and from participants of Globelics South Africa, 2005, improved this paper. Roberto Mazzoleni’s suggestions highlighted important issues for this new version. Financial support from BHTEC-UFMG-FINEP, Fapemig and CNPq is acknowledged. This research has benefited from the strategic logistic support of IEL-FIEMG. The usual remainder holds.
43

REFERENCES
ALBUQUERQUE, E. (2003) Immature systems of innovation: introductory notes about a comparison between South Africa, India, Mexico and Brazil based on science and technology statistics. Rio de Janeiro: First Globelics Conference (available at www.globelics.org).
ALBUQUERQUE, E. (2004) Science and technology systems in Less Developed Countries. In: MOED, H.; GLÄNZEL, W.; SCHMOCH, U. (eds) (2004) Handbook of quantitative science and technology research. Dordrecht: Kluwer Academic Publishers.
ALBUQUERQUE, E.; SILVA, L.; RAPINI. M.; SOUZA, S. (2005) Interactions between firms and universities in an immature system of innovation: a survey of R&D-performer firms in Minas Gerais, Brazil. Tshwane: Third Globelics Conference (available at http://www.globelics2005africa.org.za/papers/p0050/index.php).
BDMG (2002) Minas Gerais no século XXI. Belo Horizonte: BDMG (available at www.bdmg.mg.gov.br).
BERNARDES, A.; ALBUQUERQUE, E. (2003) Cross-over, thresholds and the interactions between science and technology: lessons for less-developed countries. Research Policy, v. 32, n. 5, pp. 867-887.
CARNEIRO, LOURENÇO (2003) Pós-graduação e pesquisa na universidade. In: VIOTTI, E.; MACEDO, M. M. (orgs) Indicadores de ciência, tecnologia e inovação no Brasil. Campinas: Editora Unicamp.
CARVALHO, J. M. (2002) A Escola de Minas de Ouro Preto: o peso da glória. Belo Horizonte: Editora da UFMG, 2ª. edição.
COHEN, W.; NELSON, R.; WALSH, J. (2002) Links and impacts: the influence of public R&D on industrial research. Management Science, v. 48, n. 1, pp. 1-23.
COLYVAS, J.; CROW, M.; GELIJNS, A.; MAZZOLENI, R.; NELSON, R. ROSENBERG, N.; SAMPAT, B. (2002) How do university inventions get into pratice? Management Science, v. 48, n. 1, pp. 61-72.
CONVERSE, J. M.; PRESSER, S. (1986) Survey questions: handcrafting the standardized questionnaire. Newbury Park/London: Sage Publications.
FAPESP (2005) Science, technology & innovation indicators in the state of São Paulo/Brazil 2004. São Paulo: FAPESP (available at http://www.fapesp.br/english/materia.php?data[id_materia]=463).
FURTADO, C. (1986) Teoria e política do desenvolvimento econômico. São Paulo: Nova Cultural (2ª edição).
IBGE (2005) Pesquisa Industrial – Inovação Tecnológica 2003 – PINTEC. Rio de Janeiro: IBGE. (available at http://www.pintec.ibge.gov.br/).
44

KLEVORICK, A.; LEVIN, R.; NELSON, R.; WINTER, S (1995). On the sources and significance of inter-industry differences in technological opportunities. Research Policy, v. 24, p. 185-205.
MAZZOLENI, R. (2003) The role of universities and public research in catching up process. (available at http://redesist.ie.ufrj.br/globelics/pdfs/GLOBELICS_0057_Mazzoleni.PDF).
MAZZOLENI, R. (2005) Historical patterns in the coevolution of higher education, public research and national industrial capabilities. Background paper prepared for UNIDO (2005), Vienna: UNIDO (available at www.unido.org).
MAZZOLENI, R.; NELSON, R. (2005) The roles of research at universities and public labs in economic catch up. New York (manuscript).
MOTOYAMA, S. (org.) (2004) Prelúdio para uma história: ciência e tecnologia no Brasil. São Paulo: EDUSP.
MOWERY, D.; NELSON, R.; SAMPAT, B.; ZIEDONIS, A. (2004) Ivory tower and industrial innovation: university-industry technology transfer before and after the Bayh-Dole Act. Stanford: Stanford University.
MOWERY, D.; SAMPAT, B. (2005) Universities in National Innovation Systems. In: FAGERBERG, J.; MOWERY, D.; NELSON, R. (2005) The Oxford Handbook of Innovation. Oxford: Oxford University Press.
NELSON, R.; ROSENBERG, N. (1993) Technical innovation and national systems. In: NELSON, R. (ed). National innovation systems: a comparative analysis. New York, Oxford: Oxford University, p. 3-21.
RAPINI, M. S. (2004) Interação Universidade-Indústria no Brasil: uma análise exploratória a partir do Diretório dos Grupos de Pesquisa do CNPq. Dissertação de Mestrado. Rio de Janeiro: IE-UFRJ.
RIGHI, H. (2005) Interação universidade-empresa em Minas Gerais: uma análise exploratória a partir do Diretório de Grupos de Pesquisa do CNPq. Monografia de Graduação. Belo Horizonte: FACE-UFMG.
ROSENBERG, N. (2000) Schumpeter and the endogeneity of technology: some American perspectives. London: Routledge.
SILVA, L. (2003) Padrões de interação entre ciência e tecnologia. Dissertação de Mestrado. Belo Horizonte: Cedeplar-UFMG.
SILVERBERG, G. (1990) Adoption and diffusion of technology as a collective evolutionary process. Freeman, C.; Soete, L. (eds) New explorations in the economics of technological change. London: Pinter Publishers, pp. 177-192.
45

SOUZA-ANTUNES, S. (2001) Potencialidades da biotecnologia em Minas Gerais: Estudo sobre Empresas e suas Relações com Universidades. Dissertação de Mestrado. Belo Horizonte: Cedeplar-UFMG.
STEPAN, N. (1976) Beginnings of Brazilian science: Osvaldo Cruz, medical research and policy, 1890-1920. New York: Science History Publications.
SUZIGAN. W. (1986) A indústria brasileira: origem e desenvolvimento. São Paulo: Brasiliense.
UNDP (2001) Making new technologies work for human development: Human Development Report 2001. New York: Oxford University (captured at www.undp.org).
VIOTTI, E.; BAESSA, A. KOELLER, P. (2005) Perfil da inovação na indústria brasileira: uma comparação internacional. In: NEGRI, J. A.; SALERNO, M. Inovações, padrões tecnológicos e desempenho das firmas industriais brasileiras. Brasília: IPEA, pp. 653-687.
VIOTTI, E. (2002) National Learning Systems. Technological Forecasting and Cultural Change, Sept.
VIOTTI, E.; MACEDO, M. M. (orgs) (2003) Indicadores de ciência, tecnologia e inovação no Brasil. Campinas: Editora Unicamp.
46

APPENDIX
MAP I Geographical location: Minas Gerais, Brazil
Source: Fundação João Pinheiro (2004)
47