mr. pratap , jubilant - conclave.qci.org.inconclave.qci.org.in/2012/pres/jubilant.pdf• overview of...
TRANSCRIPT
1
1
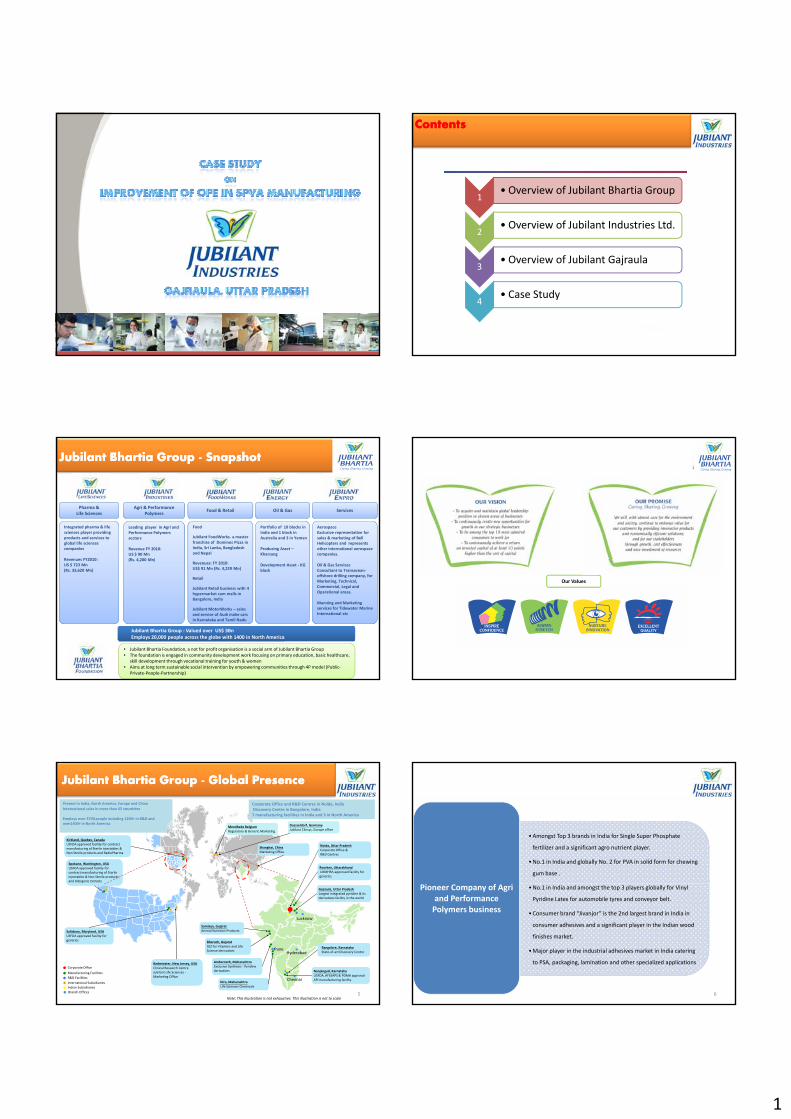
1• Overview of Jubilant Bhartia Group
2• Overview of Jubilant Industries Ltd.
ContentsContents
2
3• Overview of Jubilant Gajraula
4• Case Study
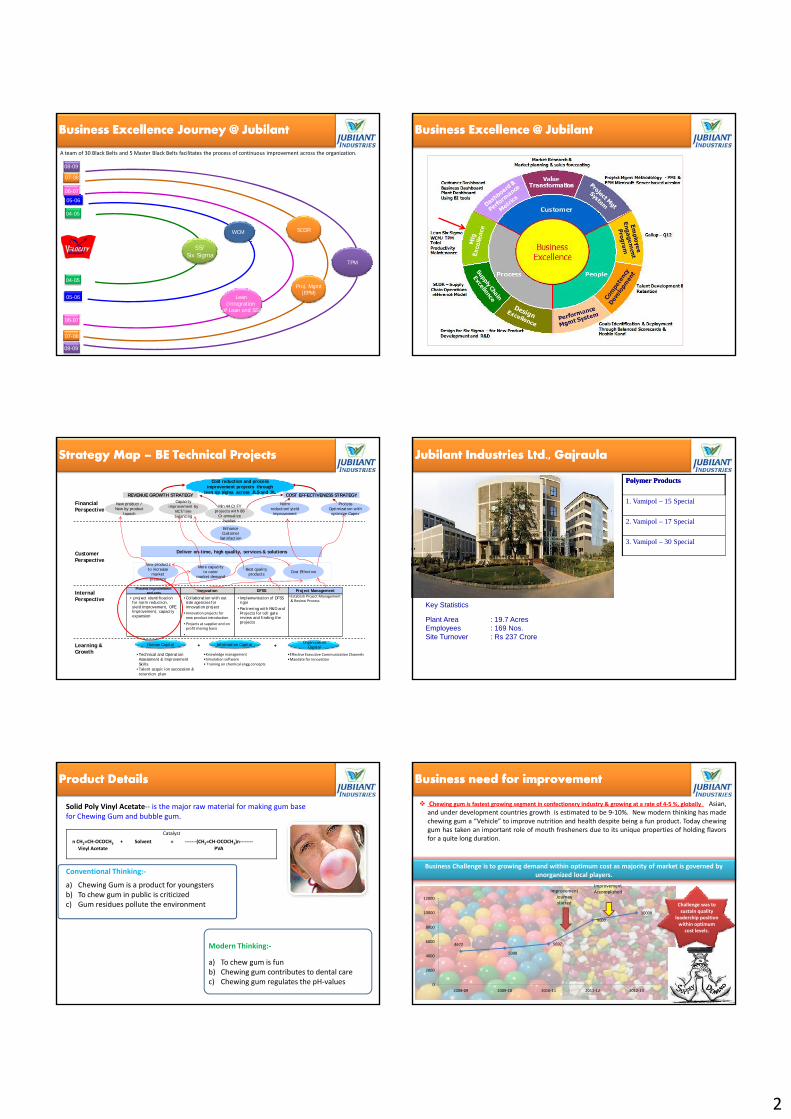
Jubilant Bhartia Group - SnapshotJubilant Bhartia Group - Snapshot
Pharma &Life Sciences
Integrated pharma & lifesciences player providing products and services to global life sciences companies
Revenues FY2010:
Leading player in Agri and Performance Polymers sectors
Revenue FY 2010:US $ 90 Mn(R 4 200 M )
Food
Jubilant FoodWorks- a master franchise of Dominos Pizza in India, Sri Lanka, Bangladesh and Nepal
Portfolio of 10 blocks in India and 1 block in Australia and 3 in Yemen
Producing Asset –Kharsang
AerospaceExclusive representative for sales & marketing of Bell Helicopters and represents other international aerospace companies.
Agri & Performance Polymers Food & Retail Oil & Gas Services
3
Jubilant Bhartia Group : Valued over US$ 3BnEmploys 20,000 people across the globe with 1400 in North America
• Jubilant Bhartia Foundation, a not for profit organisation is a social arm of Jubilant Bhartia Group • The foundation is engaged in community development work focusing on primary education, basic healthcare,
skill development through vocational training for youth & women• Aims at long term sustainable social intervention by empowering communities through 4P model (Public-
Private-People-Partnership)
Revenues FY2010: US $ 723 Mn(Rs. 33,620 Mn)
(Rs. 4,200 Mn)Revenues: FY 2010: US$ 91 Mn (Rs. 4,239 Mn)
Retail
Jubilant Retail business with 4 hypermarket cum malls in Bangalore, India
Jubilant MotorWorks – sales and service of Audi make cars in Karnataka and Tamil Nadu
Development Asset - KG block
Oil & Gas ServicesConsultant to Transocean-offshore drilling company, for Marketing, Technical, Commercial, Legal and Operational areas.
Manning and Marketing services for Tidewater Marine International etc
Our Vision, Promise & ValuesOur Vision, Promise & Values
Our Values
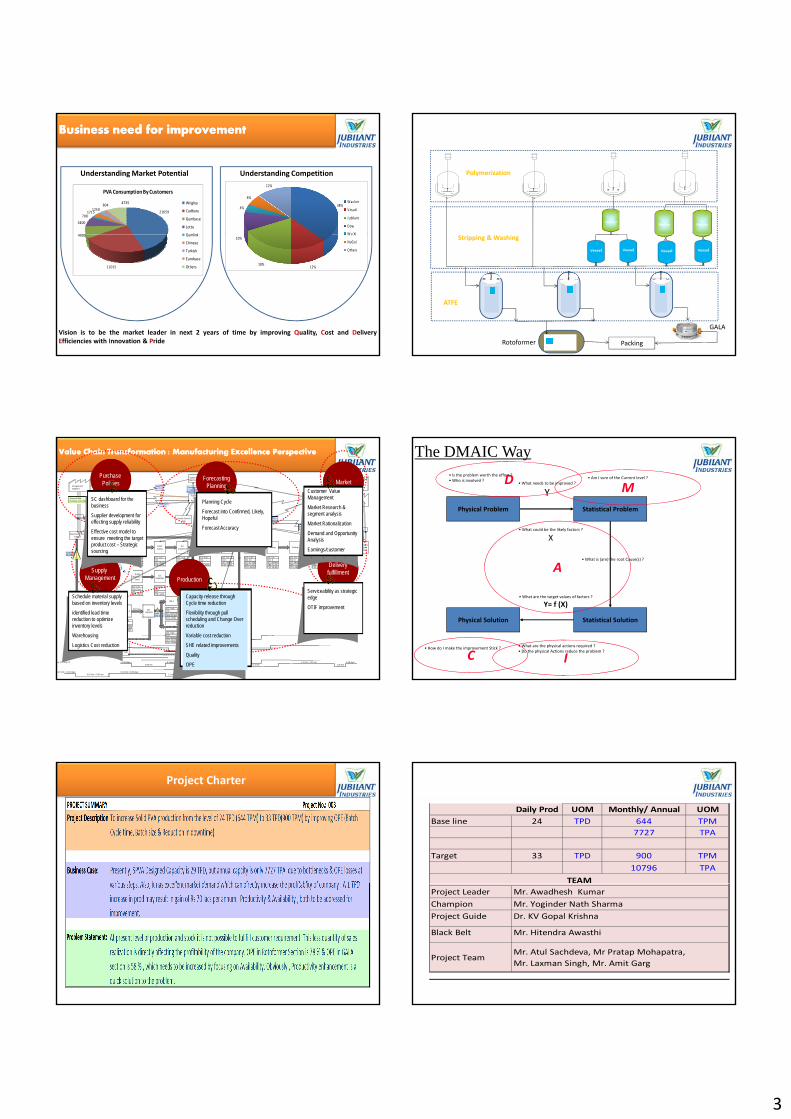
Jubilant Bhartia Group - Global PresenceJubilant Bhartia Group - Global Presence
Present in India, North America, Europe and ChinaInternational sales in more than 65 countries
Employs over 5700 people including 1200+ in R&D and over1400+ in North America
Roorkee, UttarakhandUKMHRA approved facility for generics
Roorkee, UttarakhandUKMHRA approved facility for generics
Noida, Uttar PradeshCorporate Office &R&D Centres
Noida, Uttar PradeshCorporate Office &R&D Centres
Kirkland, Quebec, CanadaUSFDA approved facility for contract manufacturing of Sterile injectables & Non Sterile products and RadioPharma
Kirkland, Quebec, CanadaUSFDA approved facility for contract manufacturing of Sterile injectables & Non Sterile products and RadioPharma
Spokane, Washington, USAUSFDA approved facility for contract manufacturing of Sterile injectables & Non Sterile products and Allergenic Extracts
Spokane, Washington, USAUSFDA approved facility for contract manufacturing of Sterile injectables & Non Sterile products and Allergenic Extracts
Merelbeke BelgiumRegulatory & Generic MarketingMerelbeke BelgiumRegulatory & Generic Marketing
Shanghai, ChinaMarketing OfficeShanghai, ChinaMarketing Office
Corporate Office and R&D Centres in Noida, IndiaDiscovery Centre in Bangalore, India7 manufacturing facilities in India and 3 in North America
Dussseldorf, GermanyJubilant Clinsys, Europe officeDussseldorf, GermanyJubilant Clinsys, Europe office
5
Gajraula, Uttar PradeshLargest integrated pyridine & its derivatives facility in the world
Gajraula, Uttar PradeshLargest integrated pyridine & its derivatives facility in the world
Ambarnath, MaharashtraExclusive Synthesis - Pyridine derivatives
Ambarnath, MaharashtraExclusive Synthesis - Pyridine derivatives
Bangalore, KarnatakaState-of-art Discovery CentreBangalore, KarnatakaState-of-art Discovery Centre
Samlaya, GujaratAnimal Nutrition ProductsSamlaya, GujaratAnimal Nutrition Products
Nira, MaharashtraLife Sciences ChemicalsNira, MaharashtraLife Sciences Chemicals
Bharuch, GujaratSEZ for Vitamins and Life Science derivatives
Bharuch, GujaratSEZ for Vitamins and Life Science derivatives
Nanjangud, KarnatakaUSFDA, AFSSAPS & PDMA approval API manufacturing facility
Nanjangud, KarnatakaUSFDA, AFSSAPS & PDMA approval API manufacturing facility
Salisbury, Maryland, USAUSFDA approved facility for generics
Salisbury, Maryland, USAUSFDA approved facility for generics
Bedminster, New Jersey, USAClinical Research CentreJubilant Life Sciences -Marketing Office
Bedminster, New Jersey, USAClinical Research CentreJubilant Life Sciences -Marketing Office
Corporate Office
Branch Offices
Manufacturing FacilitiesR&D Facilities
Indian SubsidiariesInternational Subsidiaries
PuneHyderabad
Chennai
Lucknow
Note: This illustration is not exhaustive. This illustration is not to scale
Jubilant Industries – OverviewJubilant Industries – Overview
• Amongst Top 3 brands in India for Single Super Phosphate
fertilizer and a significant agro nutrient player.
• No.1 in India and globally No. 2 for PVA in solid form for chewing
gum base .
6
• No.1 in India and amongst the top 3 players globally for Vinyl
Pyridine Latex for automobile tyres and conveyor belt.
• Consumer brand “Jivanjor” is the 2nd largest brand in India in
consumer adhesives and a significant player in the Indian wood
finishes market.
• Major player in the industrial adhesives market in India catering
to PSA, packaging, lamination and other specialized applications
Pioneer Company of Agriand Performance
Polymers business
2
04-05
08-09
SCOR
07-08
05-06
06-07
WCM
A team of 30 Black Belts and 5 Master Black Belts facilitates the process of continuous improvement across the organization.
Business Excellence Journey @ JubilantBusiness Excellence Journey @ Jubilant
5S/Six Sigma
04-05
TPM
08-09
07-08
Proj. Mgmt(EPM)
05-06
06-07
Lean(Integration
of Lean and SS)
Business Excellence @ JubilantBusiness Excellence @ Jubilant
Norm reduction/yield improvement
Min 44 Cr FY projects with 88
Cr annualize bucket
Cost reduction and process improvement projects through
lean six sigma across JLS and JILREVENUE GROWTH STRATEGY COST EFFECTIVENESS STRATEGY
Financial Perspective
Customer P ti
Process Optimization with optimize Capex
Deliver on-time, high quality, services & solutions
New product / New by product
launch
Enhance Customer
Satisfaction
Capacity improvement by
BCT/line balancing
Strategy Map – BE Technical ProjectsStrategy Map – BE Technical Projects
Human Capital Information CapitalOrganization
Capital+ +
Internal Perspective
Perspective
Learning & Growth
New products to increase
market presence
More capacity to cater
market demand
Best quality products
Cost Effective
•Technical and Operation Assessment & Improvement Skills
•Talent acquit ion succession & retention plan
•Knowledge management•Simulation software • Training on chemical engg concepts
•Effective Executive Communication Channels•Mandate for innovation
Process improvement projects Innovation DFSS
• project identification for norm reduction, yield Improvement, OPE Improvement, capacity expansion
• Collaboration with out side agencies for innovation project
• Innovation projects for new product introduction
• Projects at supplier end on profit sharing basis
• .
• Implementation of DFSS rigor
• Partnering with R&D and Projects for toll gate review and finding the projects
Project Management• Establish Project Management
& Review Process
Jubilant Industries Ltd., GajraulaJubilant Industries Ltd., Gajraula
Polymer ProductsPolymer Products
1. Vamipol – 15 Special
2. Vamipol – 17 Special
3. Vamipol – 30 Special
Plant Area : 19.7 AcresEmployees : 169 Nos.Site Turnover : Rs 237 Crore
Key Statistics
Product DetailsProduct Details
Solid Poly Vinyl Acetate-- is the major raw material for making gum basefor Chewing Gum and bubble gum.
Conventional Thinking:-
) Ch i G i d t f t
Catalystn CH2=CH-OCOCH3 + Solvent = -------(CH2=CH-OCOCH3)n--------
Vinyl Acetate PVA
a) Chewing Gum is a product for youngstersb) To chew gum in public is criticizedc) Gum residues pollute the environment
Modern Thinking:-
a) To chew gum is funb) Chewing gum contributes to dental carec) Chewing gum regulates the pH-values
Business need for improvementBusiness need for improvement
Chewing gum is fastest growing segment in confectionery industry & growing at a rate of 4-5 %, globally Asian,and under development countries growth is estimated to be 9-10%. New modern thinking has madechewing gum a “Vehicle” to improve nutrition and health despite being a fun product. Today chewinggum has taken an important role of mouth fresheners due to its unique properties of holding flavorsfor a quite long duration.
Business Challenge is to growing demand within optimum cost as majority of market is governed by unorganized local players.
Challenge was to sustain quality
leadership position within optimum
cost levels.
Improvement Journey started
4672
5098
5692
9000
10008
0
2000
4000
6000
8000
10000
12000
2008-09 2009-10 2010-11 2011-12 2012-13
Improvement Accomplished
3
Business need for improvementBusiness need for improvement
21659
4000
3400700
17151250
804 4735
PVA Consumption By Customers
Wrigley
Cadbury
Gumbase
Lotte
Gumlink
Understanding Market Potential Understanding Competition
38%4%
6%
12%
Wac ker
V inavil
J ubilant
Dow
Wu Xi
11015
4000 Gumlink
Chinese
Turkish
Eurobase
Others 12%18%
10%Wu Xi
NuG el
Others
Vision is to be the market leader in next 2 years of time by improving Quality, Cost and DeliveryEfficiencies with Innovation & Pride
SPVA – Process Flow SPVA – Process Flow
Hammer Mill 1
ReactorReactorReactor
Polymerization
Vessel
Rotoformer
GALA
Packing
Stripping & WashingVessel VesselVessel
ATFE
5.6 days 6.06 days, 11.92 days 2.32 days 45.02 lacs 48.24 lacs94.82 lacs 18.5 lacs
C/T- 1.44 C/T- 1.21 C/T- 0.10 C/T- 0.10 C/T- 0.2 C/T- 1.33 C/T- 0.9 C/T- 0.9 C/T- 1.07 C/T- 1.25
Daily ProductionReport
Daily DispatchReport
Sales team member visit for
sales order
Daily DispatchReport
Purchase Approvals - High Value RM (Monthly)
R-201(Reaction)
R-202(Conc)
Trnsf to Storage
TankPreheating Blending Drying Cooling
Screening & Lump
breakerPackaging
Warehouse (Internal + External)
Customer small
Institutional Customer
Daily Production Planning & Reporting
A.Nu HO Sales & Marketing
Monthly Production Plan(S2F Plan) to Manager Production
Supply Chain -Savli (RM
Procurement)
Supply Chain - HO (RM Procurement)
Q.C. Inspection
Supply Chain -Dispatch Savli
A.Nu Marketing
(Savli)
Unorganized Supplier's
Seasonal Bulk Purchase- Corn Cob
Warehouse - Ext + Internal
Organized Supplier's
TMA EO HCl SawDust
Lead time 3 days
Lead time 1 days
Lead time 1 days
Lead time 1 day
e-payments to RM suppliers (Reliance & Alkyl Amines)
Payments to RM suppliers (Cheques)
Quality Control Savli
Value Chain Transformation : Manufacturing Excellence PerspectiveValue Chain Transformation : Manufacturing Excellence Perspective
MarketPurchase Policies
ForecastingPlanning
Customer Value Management
Market Research & segment analysis
Market Rationalization
Demand and Opportunity Analysis
Earnings/customer
Planning Cycle
Forecast into Confirmed, Likely, Hopeful
Forecast Accuracy
SC dashboard for the business
Supplier development for effecting supply reliability
Effective cost model to ensure meeting the target product cost – Strategic sourcing
C/O- C/O- C/O- C/O- C/O- C/O- 16 C/O- 0 C/O- 0 C/O- 0 C/O- 0U/T- 76.14 U/T- 76.14 U/T- U/T- U/T- 99.8% U/T- 97.78% U/T- 98.34% U/T- 98.89% U/T- 99.95 U/T- 99.98FTR- 100% FTR- 100% FTR- 100% FTR- 100% FTR- 100% OPE-71.1% OPE-71.1% OPE-71.1% OPE-71.1% OPE-71.1%
FTR- 98.2% FTR- 98.2% FTR- 98.2% FTR- 98.2% FTR- 98.2%
C/T- 2.71 C/T- 0.10C/O- 8 hrs C/O-U/T- U/T- FTR- 100% FTR- 100%
6 MT 3 MT 2.1 MT0.83 days 0.83 days 0.29 days
C/T- 0.97 C/T- 0.97 C/T- 0.43 C/T- 1.35C/O- 0 C/O- 0 C/O- C/O- 0U/T- 98.87 U/T- 99.41% U/T- 99.74% GRIT (Waste) U/T- 99.84%OPE- 63.86 OPE-63.86% OPE-63.86%10 MT / dayFTR- 100% FTR- 100% FTR- 100%
3 MT0.83 days
Aq. CC+ Dry CC 2.32 days 0.1 min+0.1 min + 5.6 days + 0.2 min 1.4 min + 1.07 min 6.06 days2.65 min 1.5 min + 1.4 min 1.25 min
Corn Cob 11.92 days 0.43 min + 0.83 days 0.43 min + 0.83 days + 0.97 min + 0.29 days + 1.35 min0.97 min + 0.97 min 1.2 min
HM-1 UG Screen-3
Bee-Swing
Silo
Silo-7/8/9/10
Oversize
HM-2
Screen-4
Jumbo Bag Packaging & Trnsfr to Dry
CC plant
Weighing & Charging to
Mixer
R-204(Reaction +
Conc)
Q.C. Inspection
R-204 is used for Aq CC + CDC
HM-3
C/T- 3.02C/O- U/T- 98.07%OPE-63.86%FTR- 100%
C/T- 3.02C/O- U/T- 98.45%OPE-63.86%FTR- 100%
C/T- 0.43C/O- U/T- 99.59%OPE-63.86%FTR- 100%
C/T- 0.97C/O- U/T- 99.84%OPE-63.86%FTR- 100%
Deliveryfulfillment
Production
Supply Management
Serviceability as strategic edge
OTIF improvement
Capacity release through Cycle time reduction
Flexibility through pull scheduling and Change Over reduction
Variable cost reduction
SHE related improvements
Quality
OPE
Schedule material supply based on inventory levels
identified lead time reduction to optimize inventory levels
Warehousing
Logistics Cost reduction
The DMAIC Way
Physical Problem
• Is the problem worth the effort ?• Who is involved ? • What needs to be improved ?
YD
Statistical Problem
• Am I sure of the Current level ?
M
• What could be the likely factors ?
X
• What is (are) the root Cause(s) ?• What is (are) the root Cause(s) ?
• What are the target values of factors ?
Y= f (X)
Statistical Solution
A
• What are the physical actions required ?• Do the physical Actions reduce the problem ?
• How do I make the improvement Stick ?
Physical Solution
IC
Project Charter
Daily Prod UOM Monthly/ Annual UOMBase line 24 TPD 644 TPM
7727 TPA
Target 33 TPD 900 TPM10796 TPA
TEAM
Critical To Quality (CTQ)
Project Leader Mr. Awadhesh KumarChampion Mr. Yoginder Nath SharmaProject Guide Dr. KV Gopal Krishna
Black Belt Mr. Hitendra Awasthi
Project TeamMr. Atul Sachdeva, Mr Pratap Mohapatra, Mr. Laxman Singh, Mr. Amit Garg
4
Start End Revised01-May-11 30-Oct-11
Tollgates Target StatusDefine May 11 Completed
Schedule
Reasons for delay
Tollgates
Define May-11 CompletedMeasure May-11 Completed
Analyse Jul-11 CompletedImprove Sep-11 Completed
Control Oct-11 Completed
Timeliness is the Great
Aspect
# CTQ Measure
Unit Discrete / Continuous
Operational Definition LSL USL Target Value
Measurement System
1 SPVA Production
TPD Continuous Daily Production of SPVA is the major performance(Productivity) indicator.
28 35 33 Weight Measurement of Product
2 SPVA OPE (Rotoformer)
% Continuous Monthly OPE of Rotoformer Stream is the another performance indicator for Availability
78 90 85 Production & Downtime
3 SPVA OPE (GALA)
% Continuous Monthly OPE of GALA Stream is the important performance indicator for Availability
58 90 85 Production & Downtime
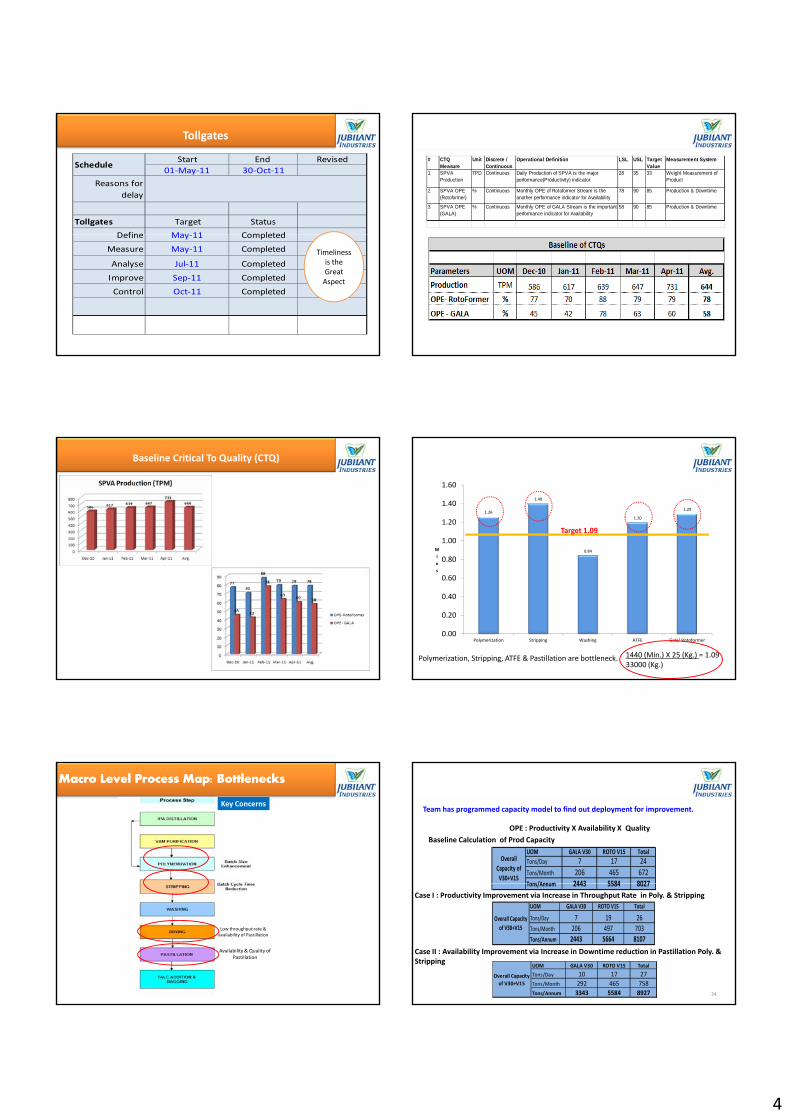
Critical To Quality (CTQ) Performance Standard
Baseline Critical To Quality (CTQ) Effective Cycle Time Vs Takt timeEffective Cycle Time Vs Takt time
1.26
1.40
0.84
1.20
1.29
0 80
1.00
1.20
1.40
1.60
Mi
Target 1.09
Polymerization, Stripping, ATFE & Pastillation are bottleneck.
0.00
0.20
0.40
0.60
0.80
Polymerization Stripping Washing ATFE Gala/ Rotoformer
ns
1440 (Min.) X 25 (Kg.) = 1.0933000 (Kg.)
Macro Level Process Map: Bottlenecks Macro Level Process Map: Bottlenecks
Key Concerns
Low throughput rate & availability of Pastillation
Availability & Quality of Pastillation
Stepwise Evaluation of Productivity & Availability
OPE : Productivity X Availability X QualityBaseline Calculation of Prod Capacity
UOM GALA V30 ROTO V15 TotalTons/Day 7 17 24Tons/Month 206 465 672Tons/Annum 2443 5584 8027
Overall Capacity of
V30+V15
Team has programmed capacity model to find out deployment for improvement.
24
Tons/Annum 2443 5584 8027Case I : Productivity Improvement via Increase in Throughput Rate in Poly. & Stripping
UOM GALA V30 ROTO V15 Total
Tons/Day 7 19 26Tons/Month 206 497 703Tons/Annum 2443 5664 8107
Overall Capacity of V30+V15
Case II : Availability Improvement via Increase in Downtime reduction in Pastillation Poly. & Stripping
UOM GALA V30 ROTO V15 TotalTons/Day 10 17 27Tons/Month 292 465 758Tons/Annum 3343 5584 8927
Overall Capacity of V30+V15

5
Project Streamlining
The Capacity Model enables to streamline the improvement Journery in two aspects: 1. Throughput rate in Polymerization & Stripping2. Downtime Reduction in Pastillation
Production Capacity Enhancement
To increase Productivity of Polymerization
To reduce downtime in Pastillation
To increase Batch Size of Polymerization
To reduce Batch Cycle Time of Stripping
To reduce downtime of GALA Pastillation System
To reduce downtime of Rotoformer Pastillation System
PROJECT 1: To increase Productivity of SPVA by improving batch sizein polymerization & reduction in BCT in Stripping. ( 644 TPM to 750 TPM)
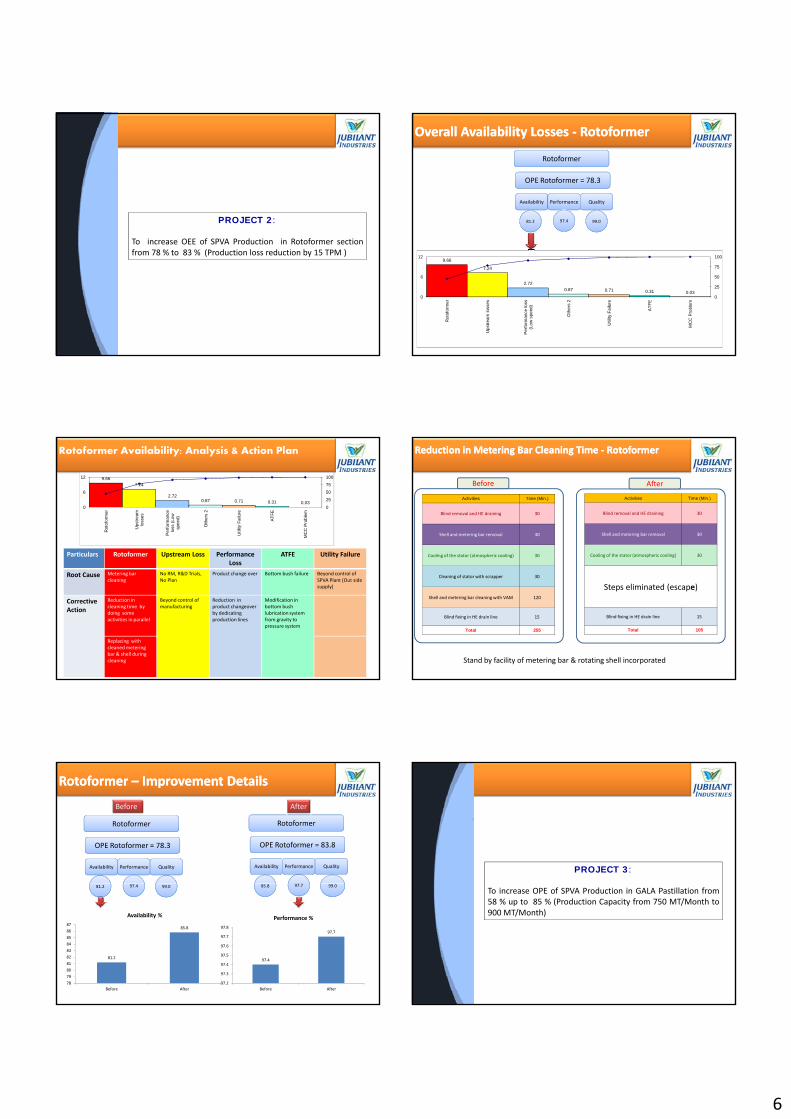
PROJECT 2 T i OEE f SPVA P d i i R fPROJECT 2: To increase OEE of SPVA Production in Rotoformersection from 78 % to 83% (Production loss reduction by 15 TPM )
PROJECT 3: To increase OPE of SPVA Production in GALA Pastillation from 58 % up to 85 % ( Production Capacity from 750 MT/Month to 900 MT/Month)
PROJECT 1:
To increase Productivity of SPVA by improving batch size in polymerization & reduction in BCT in Stripping. (644 TPM to 750 TPM)
PROBLEM CATEGORY CORRECTIVE ACTION
Back pressure in polymerizationreactor results in further increaseof batch size.
Machine • Vapour line increased from 6’’ to 10’’resulted in increased batch size by 10%.
Stripping cycle time Method Feed charging & heating made parallel Reduction in inspection time Optimization of stripping steps
Productivity Enhancement Action Plan
(atmospheric & vacuum) with outaffecting manufacturing norms.Cycle time reduced from 823 minutes to660 minutes
Increase in ATFE throughput rate Machine • Increase in polymer drying temperatureby increasing steam pressure.Throughput rate increased from 500Kg/Hr. to 700 Kg./Hr.
Modification in Polymerization & Stripping ReactorModification in Polymerization & Stripping Reactor
10” 6”
Productivity Enhancement Action Plan
6
PROJECT 2:
To increase OEE of SPVA Production in Rotoformer sectionfrom 78 % to 83 % (Production loss reduction by 15 TPM )
Overall Availability Losses - RotoformerOverall Availability Losses - Rotoformer
Rotoformer
OPE Rotoformer = 78.3
Availability Performance Quality
81.2 97.4 99.0
9.66
7.24
2.720.87 0.71 0.31 0.03
0
25
50
75
100
0
6
12
Rot
ofor
mer
Ups
trea
m lo
sses
Per
form
ance
loss
(L
ow s
peed
)
Oth
ers
2
Util
ity F
ailu
re
AT
FE
MC
C P
robl
em
Particulars Rotoformer Upstream Loss Performance ATFE Utility Failure
Rotoformer Availability: Analysis & Action Plan
9.667.24
2.720.87 0.71 0.31 0.03
0
25
50
75
100
0
6
12
Rot
ofor
mer
Ups
trea
m
loss
es
Per
form
ance
lo
ss (
Low
sp
eed)
Oth
ers
2
Util
ity F
ailu
re
AT
FE
MC
C P
robl
em
Loss
Root Cause Metering bar cleaning
No RM, R&D Trials,No Plan
Product change over Bottom bush failure Beyond control of SPVA Plant (Out side supply)
Corrective Action
Reduction in cleaning time by doing some activities in parallel
Beyond control of manufacturing
Reduction in product changeover by dedicating production lines
Modification in bottom bush lubrication system from gravity to pressure system
Replacing with cleaned metering bar & shell during cleaning
Before
Reduction in Metering Bar Cleaning Time - RotoformerReduction in Metering Bar Cleaning Time - Rotoformer
After
Activities Time (Min.)
Blind removal and HE draining 30
Shell and metering bar removal 30
Cooling of the stator (atmospheric cooling) 30
Activities Time (Min.)
Blind removal and HE draining 30
Shell and metering bar removal 30
Cooling of the stator (atmospheric cooling) 30
Cleaning of stator with scrapper 30
Shell and metering bar cleaning with VAM 120
Blind fixing in HE drain line 15
Total 255
Steps eliminated (escape)
Blind fixing in HE drain line 15
Total 105
Stand by facility of metering bar & rotating shell incorporated
Rotoformer – Improvement DetailsRotoformer – Improvement Details
Rotoformer
OPE Rotoformer = 78.3
Availability Performance Quality
Rotoformer
OPE Rotoformer = 83.8
Availability Performance Quality
Before After
81.2 97.4 99.0 85.8 97.7 99.0
97.4
97.7
97.2
97.3
97.4
97.5
97.6
97.7
97.8
Before After
Performance %
81.2
85.8
78798081828384858687
Before After
Availability %
PROJECT 3:
To increase OPE of SPVA Production in GALA Pastillation from58 % up to 85 % (Production Capacity from 750 MT/Month to900 MT/Month)
7
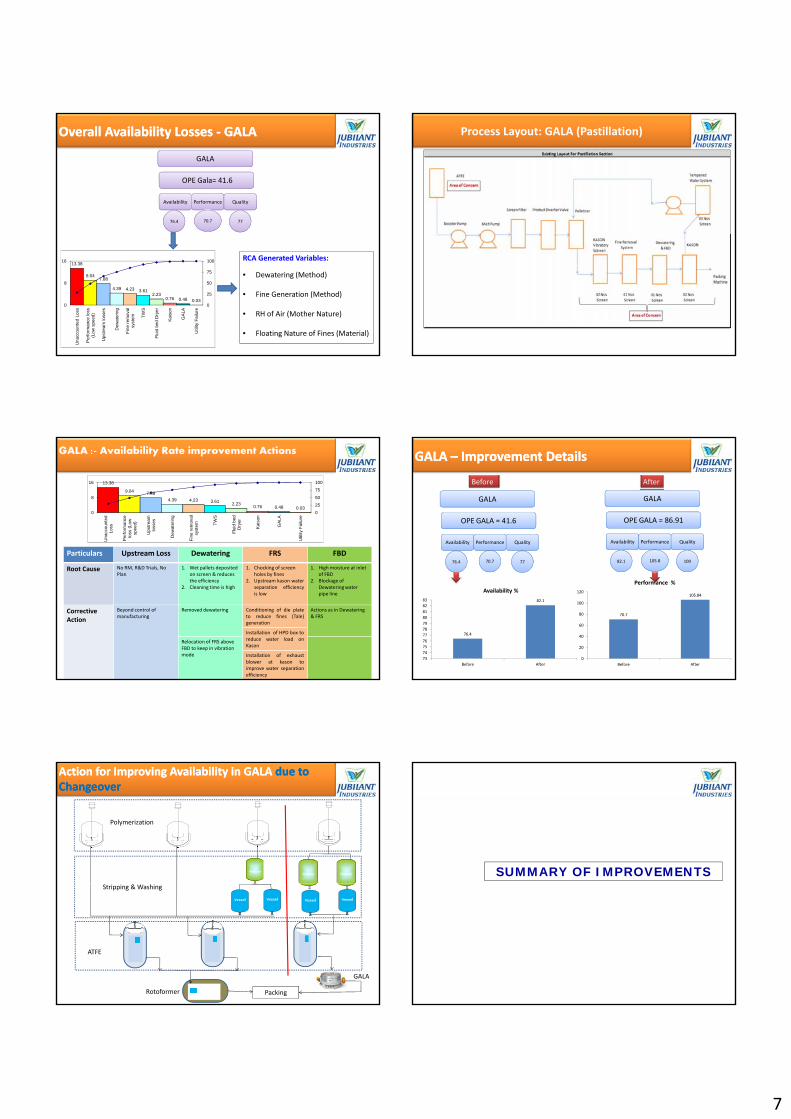
Overall Availability Losses - GALAOverall Availability Losses - GALA
GALA
OPE Gala= 41.6
Availability Performance Quality
76.4 70.7 77
13.38
9.047.88
4.39 4.23 3.612.23
0.76 0.48 0.030
25
50
75
100
0
8
16
Una
ccou
nted
Los
s
Per
form
ance
loss
(L
ow s
peed
)
Ups
trea
m lo
sses
Dew
ater
ing
Fin
e re
mov
al
syst
em TW
S
Flu
id b
ed D
ryer
Kai
son
GA
LA
Util
ity F
ailu
re
RCA Generated Variables:
• Dewatering (Method)
• Fine Generation (Method)
• RH of Air (Mother Nature)
• Floating Nature of Fines (Material)
Process Layout: GALA (Pastillation)
Particulars Upstream Loss Dewatering FRS FBD
GALA :- Availability Rate improvement Actions
13.38
9.04 7.88
4.39 4.23 3.612.23
0.76 0.48 0.030
25
50
75
100
0
8
16
Una
ccou
nted
Lo
ss
Per
form
ance
lo
ss (
Low
sp
eed)
Ups
trea
m
loss
es
Dew
ater
ing
Fin
e re
mov
al
syst
em TW
S
Flu
id b
ed
Dry
er
Kai
son
GA
LA
Util
ity F
ailu
re
Root Cause No RM, R&D Trials, No Plan
1. Wet pallets deposited on screen & reduces the efficiency
2. Cleaning time is high
1. Chocking of screen holes by fines
2. Upstream kason waterseparation efficiencyis low
1. High moisture at inlet of FBD
2. Blockage of Dewatering water pipe line
Corrective Action
Beyond control of manufacturing
Removed dewatering Conditioning of die plateto reduce fines (Tale)generation
Actions as in Dewatering & FRS
Installation of HPD box toreduce water load onKason
Relocation of FRS above FBD to keep in vibration mode Installation of exhaust
blower at kason toimprove water separationefficiency
GALA – Improvement DetailsGALA – Improvement Details
GALA
OPE GALA = 41.6
Availability Performance Quality
GALA
OPE GALA = 86.91
Availability Performance Quality
Before After
76.4 70.7 77 82.1 105.8 100
70.7
105.84
0
20
40
60
80
100
120
Before After
Performance %
76.4
82.1
7374757677787980818283
Before After
Availability %
Action for Improving Availability in GALA due to ChangeoverAction for Improving Availability in GALA due to Changeover
Hammer Mill 1
ReactorReactorReactor
Polymerization
Vessel
Rotoformer
GALA
Packing
Stripping & WashingVessel VesselVessel
ATFE
SUMMARY OF IMPROVEMENTS
8
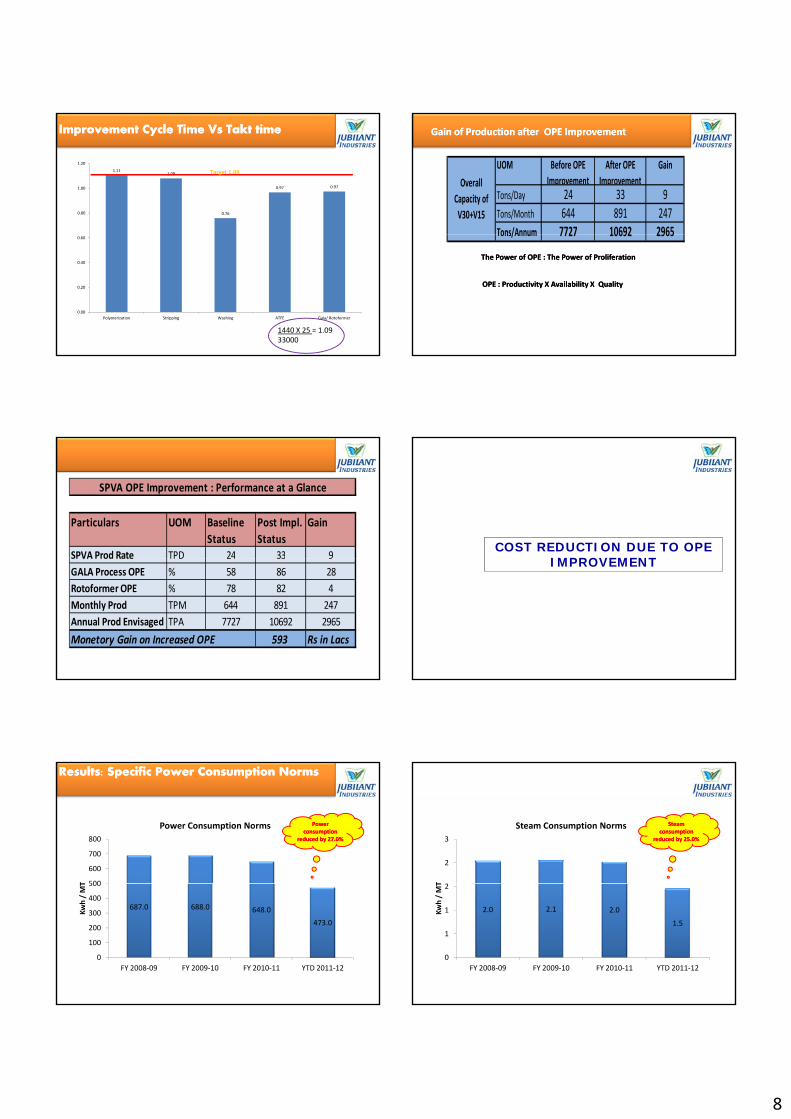
Improvement Cycle Time Vs Takt timeImprovement Cycle Time Vs Takt time
1.111.08
0.76
0.97 0.97
0.80
1.00
1.20
Target 1.09
0.00
0.20
0.40
0.60
Polymerization Stripping Washing ATFE Gala/ Rotoformer
1440 X 25 = 1.0933000
Gain of Production after OPE ImprovementGain of Production after OPE Improvement
UOM Before OPE Improvement
After OPE Improvement
Gain
Tons/Day 24 33 9Tons/Month 644 891 247Tons/Annum 7727 10692 2965
Overall Capacity of
V30+V15
OPE : Productivity X Availability X QualityOPE : Productivity X Availability X Quality
The Power of OPE : The Power of ProliferationThe Power of OPE : The Power of Proliferation
Tons/Annum 7727 10692 2965
Particulars UOM Baseline Status
Post Impl. Status
Gain
SPVA Prod Rate TPD 24 33 9
SPVA OPE Improvement : Performance at a Glance
S od ate 33 9GALA Process OPE % 58 86 28Rotoformer OPE % 78 82 4Monthly Prod TPM 644 891 247Annual Prod Envisaged TPA 7727 10692 2965Monetory Gain on Increased OPE 593 Rs in Lacs
COST REDUCTION DUE TO OPE IMPROVEMENTIMPROVEMENT
500
600
700
800
T
Power Consumption Norms
Results: Specific Power Consumption NormsResults: Specific Power Consumption Norms
Power Power consumption consumption
reduced by reduced by 2727..00% %
687.0 688.0 648.0473.0
0
100
200
300
400
500
FY 2008-09 FY 2009-10 FY 2010-11 YTD 2011-12
Kwh
/ M
T
2
3
T
Steam Consumption Norms
Results: Steam Consumption NormsResults: Steam Consumption Norms
Steam Steam consumption consumption
reduced by reduced by 2525..00% %
2.0 2.1 2.0
1.5
0
1
1
2
FY 2008-09 FY 2009-10 FY 2010-11 YTD 2011-12
Kwh
/ M
T
9
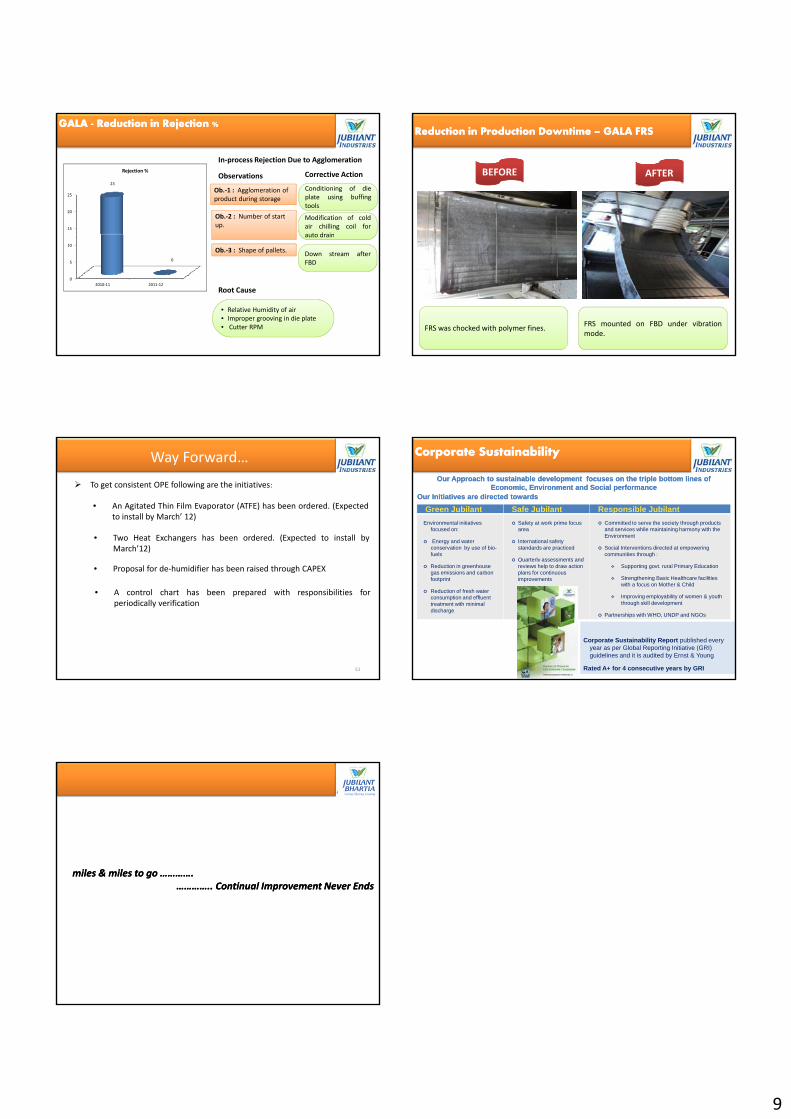
Conditioning die
tools
Conditioning of dieplate using buffingtools
GALA - Reduction in Rejection % GALA - Reduction in Rejection %
Ob.-1 : Agglomeration of product during storage
Ob.-2 : Number of start up.15
20
25
23
Rejection %
Modification coldModification of coldair chilling coil forauto drain
In-process Rejection Due to Agglomeration
Observations Corrective Action
Ob.-3 : Shape of pallets.
0
5
10
2010-11 2011-12
0
autoauto drain
Down stream afterFBD
Root Cause
• Relative Humidity of air• Improper grooving in die plate• Cutter RPM
BEFORE AFTER
Reduction in Production Downtime – GALA FRSReduction in Production Downtime – GALA FRS
FRS was chocked with polymer fines. FRS mounted on FBD under vibrationmode.
Way Forward… To get consistent OPE following are the initiatives:
• An Agitated Thin Film Evaporator (ATFE) has been ordered. (Expectedto install by March’ 12)
• Two Heat Exchangers has been ordered. (Expected to install byMarch’12)
51
• Proposal for de-humidifier has been raised through CAPEX
• A control chart has been prepared with responsibilities forperiodically verification
Corporate SustainabilityCorporate Sustainability
Green Jubilant Safe Jubilant Responsible Jubilant
Environmental initiatives focused on:
Energy and water conservation by use of bio-fuels
Safety at work prime focus area
International safety standards are practiced
Quarterly assessments and
Committed to serve the society through products and services while maintaining harmony with the Environment
Social Interventions directed at empowering communities through :
Our Approach to sustainable development focuses on the triple bottom lines of Economic, Environment and Social performance
Our Approach to sustainable development focuses on the triple bottom lines of Economic, Environment and Social performance
Our Initiatives are directed towardsOur Initiatives are directed towards
Reduction in greenhouse gas emissions and carbon footprint
Reduction of fresh water consumption and effluent treatment with minimal discharge
Quarterly assessments and reviews help to draw action plans for continuous improvements
Supporting govt. rural Primary Education
Strengthening Basic Healthcare facilities with a focus on Mother & Child
Improving employability of women & youth through skill development
Partnerships with WHO, UNDP and NGOs
52
Corporate Sustainability Report published every year as per Global Reporting Initiative (GRI) guidelines and it is audited by Ernst & Young
Rated A+ for 4 consecutive years by GRI
miles & miles to go ………….miles & miles to go ………….C ti l I t N E dC ti l I t N E d………….. Continual Improvement Never Ends………….. Continual Improvement Never Ends