mpra paper 3234
TRANSCRIPT
8/6/2019 MPRA Paper 3234
http://slidepdf.com/reader/full/mpra-paper-3234 1/20
Munich Personal RePEc Archive
Does sports performance influence
revenues and economic results in Spanish
football?
Barajas, Angel, Fernandez-Jardon, Carlos and Crolley, Liz
Universidad de Vigo
July 2005
Online at http://mpra.ub.uni-muenchen.de/3234/
MPRA Paper No. 3234, posted 07. November 2007 / 03:03
8/6/2019 MPRA Paper 3234
http://slidepdf.com/reader/full/mpra-paper-3234 2/20
1
DOES SPORTS PERFORMANCE INFLUENCE REVENUES ANDECONOMIC RESULTS IN SPANISH FOOTBALL?
ANGEL BARAJAS, CARLOS FERNÁNDEZ-JARDÓN AND LIZ CROLLEY
CONTACT DETAILS:
ANGEL BARAJAS:University of VigoDpto. Economía Financiera y ContabilidadCampus Universitario32004 OurenseSpain
Tel: 0034 988 36 87 13Fax: 0034 988 36 89 23email: [email protected]
CARLOS FERNÁNDEZ-JARDÓN:University of VigoDpto. Economía AplicadaCampus Universitario Lagoas-Marcosende36310 Vigo (Pontevedra)Spain
Tel: 0034 986 81 24 91Fax: 0034 986 81 24 01email: [email protected]
LIZ CROLLEY:University of LiverpoolManagement SchoolChatham StreetLiverpoolL69 7ZHUKTel: 0044 151 795 3809Fax: 0044 151 795 3007email: [email protected]
8/6/2019 MPRA Paper 3234
http://slidepdf.com/reader/full/mpra-paper-3234 3/20
2
DOES SPORTS PERFORMANCE INFLUENCE REVENUES AND
ECONOMIC RESULTS IN SPANISH FOOTBALL?
ABSTRACT
English football began taking steps towards becoming a business earlier thanSpanish football did, and academic studies on the football industry to date alsofocus primarily on football in the UK. The evidence for the relationship betweensports performance and revenues appear clear in English football. There iseven research about the effects of a club’s wealth on its sports performance, orthe effects of a club’s sporting situations on its finances. In this paper, we ana-lyse the relationship between sports performance and the revenues of footballclubs as well as the effect of sports performance on the financial results inSpanish professional football. In order to carry out this research we have had toselect which variables to analyse and choose the most appropriate methods ofmeasurement. We have designed a system which obtains a variable of sportsperformance that includes information from every competition in which the foot-ball club participates.
Key Words : sports performance, economic results, football (soccer), footballclub finances.

8/6/2019 MPRA Paper 3234
http://slidepdf.com/reader/full/mpra-paper-3234 4/20
3
1 INTRODUCTION
Most studies about professional sport in the United States consider that clubs
are profit maximisers. Sloan (1971) broke with this tradition pointing out that, atleast for English football, profit-making clubs were not the norm. However, theincorporation for English football clubs to the financial markets might havechanged this tendency for some clubs. In this context we were interested in therelationship between performance on the pitch and revenues in Spanish foot-ball, and whether or not the economic results of a club can be explained by itssports performance. Before outlining the results of the research, it is worth re-viewing some of the most relevant studies on this topic.
The profit and loss account reflects the capacity that a company has to obtain(or not) a surplus from its turnover once all its expenses are deducted. For this
reason, as far as economic results are concerned, it is worth observing the ef-fect of sports performance on revenues, and the relationship of these revenueswith costs Although both turnover and expenses really depend on managerialskills, the expenses are more easily controlled than turnover because incomerelates to consumer demand. Control of expenses would lead to profits. If thereis no policy for expenses to achieve a margin, there is little chance of profitabil-ity.
Most research into economic and financial features of football analyse the rela-tionship between sports performance and income, expecting them to be posi-tive. Szymanski and Kuypers (1999) state that the proportion of the change inincome during the 1996/97 season is explained by 82% (R2=0.82) by the Eng-lish league position in that season. The result raises to an R2 of 0.89 when theywork with a longer period (1978-97). They use the logarithm of the revenues ofeach club divided by the yearly mean of the revenues of the all clubs as awhole. They conclude that winning teams, in the long term, are likely to attracthigh incomes.
Deloitte and Touche (1999; 2000 b) carry out analogous studies adjusting, bymeans of a non-linear regression, the total incomes of Spanish football clubs inthe First Division with their ranking at the end of the league championships in
seasons 1996/97, 97/98 and 98/99.
Clubs, in general, need funds to cover their expenses. These funds may comefrom operations but if the turnover is not high enough then most of the clubs willhave to go into debt. In this sense, it can be stated that the greater the club‘swealth, the higher its ability to spend money is and, as a consequence, theprobability of it performing better on the pitch is also higher.
In this way, Murphy (1999 a and b) looks for the relationships between sportingperformance and the rising wealth in English and Scottish football. He startsfrom the widespread idea that concentration of economic resources is inevitably
reflected on the pitch and therefore in the performance rankings. He tries to testthis hypothesis and whether or not a gap has appeared between the richest and
8/6/2019 MPRA Paper 3234
http://slidepdf.com/reader/full/mpra-paper-3234 5/20
4
the poorest clubs in the English and Scottish leagues. In the English case, hisdata do not deny a growing correlation between financial resources and sport-ing performance – measured by final league positions However, there are noclear indications that the accumulation of financial resources has broadened thegap between clubs. According to Murphy, there is a strong likelihood that some
clubs from the Premier League will maintain their status whereas the position ofothers will weaken. As a consequence, these weaker clubs will be more likely tobe relegated. Therefore the number of ‘yo-yo’ clubs1 increases. In the Scottishcase, he observes that the gap – measured by points and goals – between therichest and the worst-off in the Scottish Premier League is narrowing. At thesame time, the probability of one of the main clubs – Glasgow Celtic or GlasgowRangers – winning the league is increasing. To summarise, he concludes that inthe Scottish Premier League the relationship between economic results andsports performance is less direct and more complex than we might expect.
The Deloitte and Touche Annual Report (2000 a) also analyses the effects of
relegation. Initially, it refers to the levels of attendance and states, althoughwithout a solid base, that in the season which follows relegation fans continue toattend matches through force of habit. However, it claims that other revenues,such as commercial or sponsorship, will be affected more dramatically.
The point of view offered by Noll (2002) in his study is slightly different, mainlybecause he approaches the issue from another perspective. Making use ofEnglish football data, he reaches the conclusion that players’ wages of teamsinvolved in promotion or relegation are higher than expected. At the same time,promotion and relegation have a positive effect on attendance and, finally, hethus maintains that the effects of promotion and relegation are ambiguous.
Developing this, Gerrard (2002) explores further the impact that relegation trig-gers on a club’s finances. He returns to the initial proposition in that sports per-formance influences turnover and not the contrary, as Murphy maintained. Afteranalysing the clubs relegated from the (English) Premier League in1999 and2000, he concludes that relegation has a double effect from a financial point ofview. On one hand, relegated clubs have the advantage of enjoying greater in-comes than the rest of clubs in their division.2 On the other hand, they have toface up to inflexible wage costs and run the increased financial risk if the clubscontinue with high expenses in wages in order to try and win a quick promotion
back to the Premiership. He also perceives a rise in relegation costs for ‘yo-yo’teams and notes that hardly any club in this situation reduces its salaries.
Noll’s first two conclusions concur with the aforementioned analysis of Gerrard(2002). He claims that one of the advantages of the European system of openleagues lies in the relevance that matches assume as a consequence of thefear of relegation and, at the same time, there are extra incentives for maximis-
1The term ‘yo-yo’ club is used to describe clubs that go ‘down’ and ‘up’ divisions, that is, they
are relegated and promoted, sometimes repeatedly.2
They take advantage of the ‘parachute’ payments, aimed to soften the financial blow of relega-tion, which means that they share part of the revenues paid to the Premier League for their tele-vision rights.
8/6/2019 MPRA Paper 3234
http://slidepdf.com/reader/full/mpra-paper-3234 6/20
5
ing effort. Nevertheless, this system is also harmful. He mentions the rise in thecost of capital derived from the growing financial risk that clubs assume in theiraim to win or avoid relegation. Finally, he points out that relegated clubs facethe danger of being involved in a vicious circle.
As we have explained, there is no evidence of whether performance on thepitch is the cause of revenue levels or if these revenues, along with structuralfunds, are themselves the origin of better performances. In any case, we canargue the existence of a relationship that might constitute a virtuous circle: goodperformance implies higher turnover and funds that may be invested on improv-ing the sporting results.
In accordance with the ideas just presented we aim to test whether or not inSpanish football, as in the English case, better performance on the pitch meanshigher revenues and whether good sports performance explains well the eco-nomic results of clubs.
So the structure of this paper begins by showing the features of the sample wehave analysed (Section 2). Then in Section 3 we introduce the different meas-urements of sports performance used by academics in previous studies. Wedesign an appropriate variable that includes the effect of performance in allcompetitions. It also involves assigning a ranking indicator for performance inknock-out (cup) competitions. Then we explain the revenue variables that wehave employed. So, in Section 4 we use a visual approach, as do Deloitte andTouche (2000 b). This allows us to test the sort of function most appropriate torevenues. We analyse the relationship between performance on the pitch andthe different incomes of the club. The section ends with an analysis of the corre-lation between revenues and expenses in order to understand the ability ofclubs to obtain profits. The following step, in section 5, consists of testing theinfluence of sports performance on economic results. We do this by means of adescriptive statistical study and a regression analysis. Finally, we present ourconclusions.
2 THE SAMPLE
The fact that the aim of this study links financial and sports performance vari-ables leads us to deal with data from financial statements. Ideally, we would
have liked to work with data from all Spanish professional football clubs, but it isimpossible to find the financial information for every club. Despite the fact thatSpanish companies must submit their annual financial report to a public regis-ter, a high number of Spanish Sociedades Anónimas Deportivas (SADs)3 do notfulfil this requirement, at least on time. In the case of those clubs that are notcompanies, since they do not have this obligation, it is only possible to accesstheir accounts if they supply them personally.
3In Spain, football clubs had to become (sporting) companies in early 1990s, although those
which fulfilled certain economic requirements, such as having a positive net worth at that time,could remain as clubs. The sports companies in Spain are called Sociedades Anónimas Depor-tivas (S.A.D.).

8/6/2019 MPRA Paper 3234
http://slidepdf.com/reader/full/mpra-paper-3234 7/20
6
We requested the annual accounts of all clubs in the Spanish First and SecondDivision for the period under study (1998-2002). When the individual SAD didnot provide us with the information requested, we sought it in the correspondingpublic register. We obtained those annual accounts that had been submitted tothe register by September 2003.
This is the reason why we eventually worked with a wide sample of clubs ratherthan the total number. We have analysed a sample of 134 valid cases for thestatistic and econometric work. These cases correspond to 34 different clubsfrom the Spanish First and Second Division “A” during the period 1998-2002.Considering that each year a club’s features (the division in which it plays andits results) change, the sample consists of 84 First Division clubs and 50 fromthe Second Division “A”. So, each club is a different case for each year. We un-derstand that, for the purpose of this study, that the sporting and financial be-haviour of the club might change from season to season or, on the contrary, if aclub has a clear policy that relates its economic results with the team perform-
ance then it would be consistent through time and the econometric analysiswould detect this.
3 THE MEASUREMENT OF SPORTS PERFORMANCE
The measurement of sports performance depends on the competition underscrutiny and the perspective on which the study is focused. For example, if theobject of analysis is the effect of performance on the pitch on attendance, it willbe more useful to employ variables such as the ‘percentage of victories’ (Daw-son et al ., 2000; Marques, 2002; Boulier and Stekler,4 2003), ‘number of goalsscored by match’ (Palacios-Huerta, 2002), ‘team’s goal average weighted byrelative quality of rival team’ (Koning et al. 2001), ‘score/goal difference’ (Boulierand Stekler, 2003; Palacios-Huerta, 2002), and even variables which incorpo-rate the ‘playing style’ (Cocco and Jones, 1997). Koning (2003) working on anevaluation of the effect of hiring coaches on team performance used ‘averagegoal difference,’ ‘goals conceded,’ and ‘goals scored.’
Studying forecast models, Goddard (2005) develops two approaches: goals-based and results-based models. The variables he employs are ‘goals scored’,‘goals conceded’ and ‘results’ (with a ‘points score’ of 1 point for a win, 0.5 for adraw and 0 for a defeat).
If the study focuses on open league competitions, the variables will be of ‘rank-ing’ or ‘points obtained’ type. We are able to measure these variables in severalways. Some of them may be direct such as ‘points obtained in league’ (Gerrard,2001). Others will be formulated adjusting it with some kind of reference, forexample, ‘points obtained in league over all possible points’ (Dawson et al .,2000). For these types of measurements, we have decided to employ the‘points obtained in league’ variable, as Gerrard does, but accumulating thepoints obtained for the champion of the Second Division to those obtained by
4In this case it is applied to the NFL.

8/6/2019 MPRA Paper 3234
http://slidepdf.com/reader/full/mpra-paper-3234 8/20
each team in the First Division. This variable will be called accumulated points(ACPTS).
When the tendencies over several seasons are analysed, average values areemployed. They may be ‘position average value’ (Deloitte & Touche, 2000 a) or
‘average of modified variables’ (Szymanski and Kuypers, 1999).
‘Final league ranking’ may be used directly as a variable (Magaz, 2002). How-ever, this measure is not very useful for our purposes as it presents an inverserelationship with most of the variables we are going to employ. The sign of thecoefficient of the regression line will be negative due to an ordinary ranking as-signing the least value to the team with the best performance. This is the reasonwhy most of authors work with modified variables that we call ‘ranking meas-ures’, µ(C1), where µ is a monotone decreasing function of ranking. Dobson andGoddard (2001) suggest:
(1)n
p1n)C( l −+=µ
Where n is the number of teams who take part in the competition and p is theposition they achieved in the ranking.
In this line, the formulation employed by Szymanski and Kuypers (1999) is:
(2) ⎟⎟ ⎠
⎞⎜⎜⎝
⎛
−+−=µ
p1n
plog)C( l
As they work with 92 teams, the expression above becomes:
(3) ⎟⎟ ⎠
⎞⎜⎜⎝
⎛
−−=µ
p93
plog)C( l
We are going to estimate the league ranking, as a measure of sports perform-ance, following along the lines of Szymanski and Kuypers (1999) working withthe following expression:
(4) ⎟⎟ ⎠
⎞⎜⎜⎝
⎛
−−=
p
pC l
43log)(µ
The difference with Szymanski and Kuypers’ formula lies in the number of clubsinvolved. Due to the fact that professional football in Spain consists of 20 clubsin the First Division and 22 Second Division “A” clubs, the total number of clubsinvolved in our study is 42. For this reason we take 43 (n+1) in the denominator.Finally, as far as ‘position’ is concerned, we take the end of the season ranking.First Division rankings range from 1 (the top club) to 20 (the bottom club). The
top of the Second Division will rank as 21
st
position; the second one will be
7

8/6/2019 MPRA Paper 3234
http://slidepdf.com/reader/full/mpra-paper-3234 9/20
place as 22nd, and so on, until the bottom of the Second Division, who will begraded 42nd. We call this league position variable LPOS.
When we deal with other types of competitions, with a knock-out (cup) format,the measurement of the variable becomes complex. In fact, no author has pre-
viously suggested a measurement. Almost all the research papers work exclu-sively with league results since that type of competition is more easily measur-able and, being a stable and regular competition, it reflects the ability to achievefinancial and sporting results in the long term. Besides, league position impliesfuture expectations about participation in European competitions, promotion orrelegation.
Baimbridge (1997) carries out a study about the effects of a knock-out competi-tion: the 1996 European Championship. Nevertheless, due to his focus on at-tendance he does not develop a variable for measuring sports results. Koning et al. (2001) research a cup competition too in order to forecast results. However,
they do not provide measures for the variables we are going to study. For thisreason we have had to design a system for measuring performances in theCopa del Rey 5, the UEFA Champions’ League and the UEFA Cup.
Due to the fact that the cup competition system works neither on a ranking ba-sis nor employs points, we have developed a method for expressing the posi-tion of a particular team within cup competitions. We shall apply this ranking tothe participation of clubs in the Copa del Rey , the UEFA Champions’ League,and the UEFA Cup. We shall only take into account the Intertoto Cup if the clubqualifies for the UEFA Cup because it is a less important competition played inthe summer, often with reserve team players.
Figure 1. Diagram of measurement of result variable for cup-style competitions
8
5The Spanish Cup organised by the Real Federación Española de Fútbol (the Spanish Football
Association)
8/6/2019 MPRA Paper 3234
http://slidepdf.com/reader/full/mpra-paper-3234 10/20
9
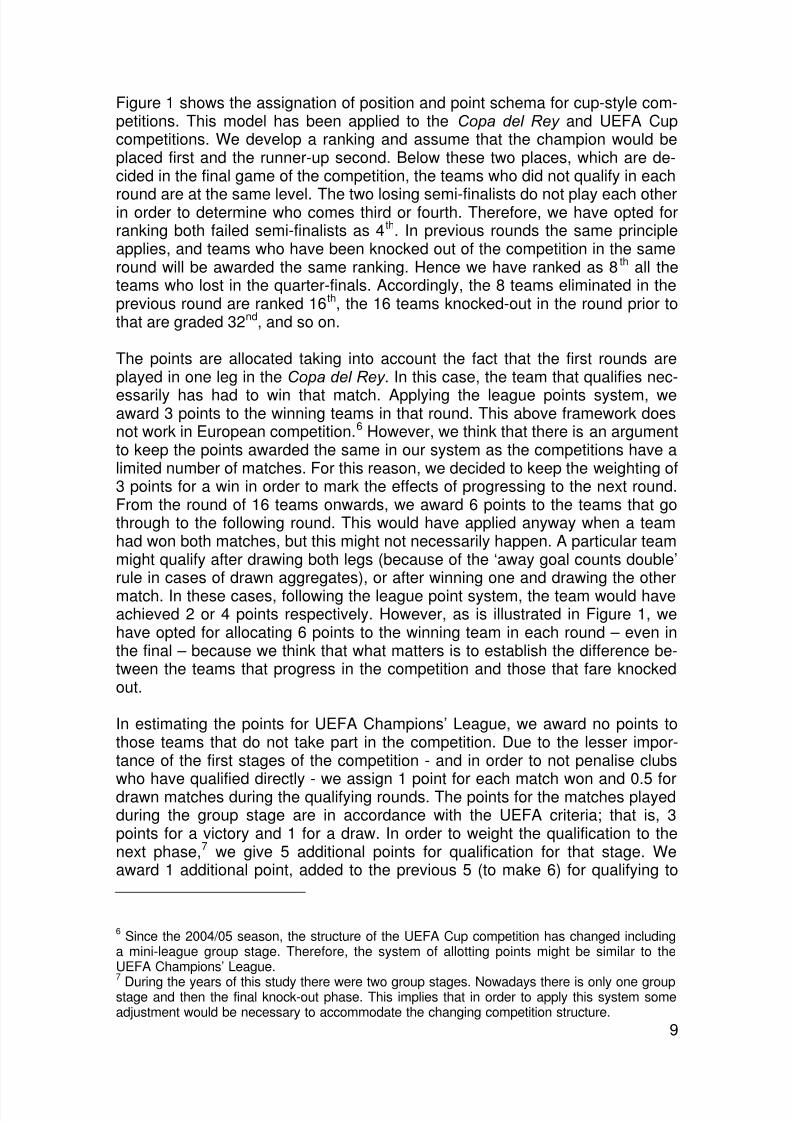
Figure 1 shows the assignation of position and point schema for cup-style com-petitions. This model has been applied to the Copa del Rey and UEFA Cupcompetitions. We develop a ranking and assume that the champion would beplaced first and the runner-up second. Below these two places, which are de-cided in the final game of the competition, the teams who did not qualify in each
round are at the same level. The two losing semi-finalists do not play each otherin order to determine who comes third or fourth. Therefore, we have opted forranking both failed semi-finalists as 4th. In previous rounds the same principleapplies, and teams who have been knocked out of the competition in the sameround will be awarded the same ranking. Hence we have ranked as 8 th all theteams who lost in the quarter-finals. Accordingly, the 8 teams eliminated in theprevious round are ranked 16th, the 16 teams knocked-out in the round prior tothat are graded 32nd, and so on.
The points are allocated taking into account the fact that the first rounds areplayed in one leg in the Copa del Rey . In this case, the team that qualifies nec-
essarily has had to win that match. Applying the league points system, weaward 3 points to the winning teams in that round. This above framework doesnot work in European competition.6 However, we think that there is an argumentto keep the points awarded the same in our system as the competitions have alimited number of matches. For this reason, we decided to keep the weighting of3 points for a win in order to mark the effects of progressing to the next round.From the round of 16 teams onwards, we award 6 points to the teams that gothrough to the following round. This would have applied anyway when a teamhad won both matches, but this might not necessarily happen. A particular teammight qualify after drawing both legs (because of the ‘away goal counts double’rule in cases of drawn aggregates), or after winning one and drawing the othermatch. In these cases, following the league point system, the team would haveachieved 2 or 4 points respectively. However, as is illustrated in Figure 1, wehave opted for allocating 6 points to the winning team in each round – even inthe final – because we think that what matters is to establish the difference be-tween the teams that progress in the competition and those that fare knockedout.
In estimating the points for UEFA Champions’ League, we award no points tothose teams that do not take part in the competition. Due to the lesser impor-tance of the first stages of the competition - and in order to not penalise clubs
who have qualified directly - we assign 1 point for each match won and 0.5 fordrawn matches during the qualifying rounds. The points for the matches playedduring the group stage are in accordance with the UEFA criteria; that is, 3points for a victory and 1 for a draw. In order to weight the qualification to thenext phase,7 we give 5 additional points for qualification for that stage. Weaward 1 additional point, added to the previous 5 (to make 6) for qualifying to
6Since the 2004/05 season, the structure of the UEFA Cup competition has changed including
a mini-league group stage. Therefore, the system of allotting points might be similar to theUEFA Champions’ League.7
During the years of this study there were two group stages. Nowadays there is only one groupstage and then the final knock-out phase. This implies that in order to apply this system someadjustment would be necessary to accommodate the changing competition structure.

8/6/2019 MPRA Paper 3234
http://slidepdf.com/reader/full/mpra-paper-3234 11/20
the second group stage, 7 for reaching the quarter-finals, 8 for the semi-finalsand 9 for winning the final. Furthermore, we also allot 3 points for winning and 1for drawing during the final phase which is played as a knock-out competition.Those teams that are eliminated from the UEFA Champions’ League and jointhe UEFA Cup will get points from both competitions.
In the League, we accumulate the points achieved by the First Division teamsonto the number obtained by the Second Division Champions each year. Wealso use the points from other competitions according to the schema explainedabove.
In order to measure the effect of all the important competitions combined, wehave defined a compound index (IND) which consists of the points achieved ineach competition. These are weighted according to the importance of the com-petition for the overall valuation of the performance of the team.
If Pi represents the points achieved in the i competition and α i represents theweight of each competition considered (the Copa del Rey , UEFA Cup, League,UEFA Champions’ League) then the compound index (IND) may be expressedas:
∑=α=
4
1i
iiPIND
We have chosen the weightings to develop the compound index by taking intoaccount the relative importance that they have for the clubs from an economicviewpoint. So, the Copa del Rey is weighted as 1; UEFA Cup (and Cup Win-
ner’s Cup, when it existed) and the League are weighted as 2; and UEFAChampions’ League (UCL) as 3. We do not think that it is necessary to weightthe League competition higher because every team plays a large number ofmatches and, consequently, the accumulated points will already have a bonusvalue, especially for First Division teams who accumulate the points of the Sec-ond Division Champions. The expression of this index will be thus:
(5) IND = Cup Pts. + 2•UEFA Pts. + 2•League Pts. + 3•UCL Pts.
4 INFLUENCE OF SPORTS PERFORMANCE ON REVENUES
10
As we said at the beginning of the paper, there exists general agreement thatgood performance on the pitch will bring higher incomes (Szymanski andKuypers, 1999; Deloitte & Touche 1999, 2000 b). These are not the only au-thors who consider the club’s revenues as a function of sports performance – exclusively or considered alongside other factors. For example, El Hodiri andQuirk (1971) express the incomes of a sporting club as a function of the popula-tion in which it is based and the sports performance is measured by a win ratio.Haan et al. (2002) explain the total turnover according to a club’s ticket sales – a consequence of income derived from the quantity of squad talent - and themoney for winning linked to the likelihood of victory the club has. Finally, Hoehnand Szymanski (1999), within the context of an analysis of competitive balance,

8/6/2019 MPRA Paper 3234
http://slidepdf.com/reader/full/mpra-paper-3234 12/20
determine a club’s revenues, along with other factors, from the percentage ofvictories each team gets.
Taking this theoretical background as reference, we are going to test if a bettersports performance is a source of higher revenues for Spanish clubs . We
seek the verification of this hypothesis by mean of a simple univariate regres-sion analysis. Previously, we have observed that the relationship between in-come and performance on the pitch has an exponential character. As a conse-quence of this, the highest-ranked teams usually have much higher turnoverthan the lowest-ranked ones. Besides, the difference in incomes among thelowest-ranked teams is much less significant. Hence, we decided to work withthe logarithm of income variables.
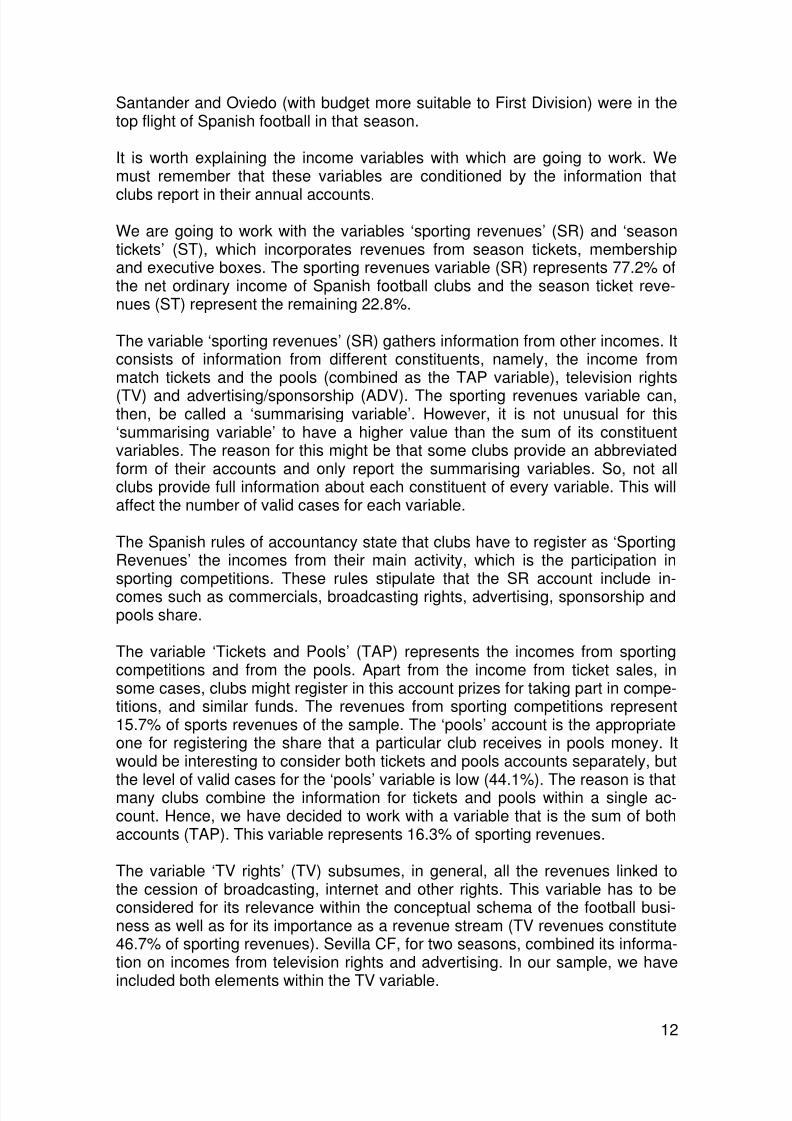
Figure 2. Budget, number of members and league ranking (Season 2001/2002)
R a c i n g d e S a n t a n d e r
R e
c r e a t i v o
X e r
e z
E l c h e S p o r t i n g d e G i j ó n
O v i e d o
E i b a r
R a c i n g d e F e r r o l
A l b a c e t e
S
a l a m a n c a
B a d a j o z
C ó r d o b a
L e g
a n é s
M u r c i a
B u r g o s
N
u m a n c i a
P o l i d e p o r t i v o E j i d o
L
e v a n t e
G i m
n a s t i c
E x t r e m a d u r a
J a é
n
V a l e n c i a
B a r c e l o n a
C e l t a
B e t i s
A l a v é s
S e v i l l a A t h l e t i c d e B i l b a o
M á l a g a
R
a y o V a l l e c a n o
V a l l a d o l i d
R e a l S o c i e d a d
E s p a ñ o l
V i l l a r r e a l
M a l l o r c a
T e n e r i f e
O s a s u n a
L a s P a l m a s
Z a r a g o z a
A t l é t i c o d e M a d r i d
D e p o r t i v o
-50
0
50
100
150
200
250
300
-10 0 10 20 30 40 50
In order to corroborate what we have just asserted above, we have followed thevisual model employed by Deloitte and Touche (2000) and we have performeda similar analysis with all the Spanish clubs8 during the 2001/2002 season. Theresults are shown in Figure 2. In this case, the budget9 (in millions of euros) is
represented on the y-axis, while the ranking in the League for that season ap-pears on the x-axis. The width of the bubble represents each club’s number ofmembers. Figure 2 also includes the line that adjusts the exponential regressionbetween budget and ranking in league. The level of explanation of that regres-sion is 55.12%. It would be better if teams as Atlético de Madrid, Racing de
8We have had to exclude Real Madrid from the sample since its budget for that season was
extraordinarily inflated as consequence of the sale of the land of its training grounds sited in the
city.
11
9Budget is defined from expected total income. In this sense our approach is similar tthat of
Deloitte and Touche.
8/6/2019 MPRA Paper 3234
http://slidepdf.com/reader/full/mpra-paper-3234 13/20
12
Santander and Oviedo (with budget more suitable to First Division) were in thetop flight of Spanish football in that season.
It is worth explaining the income variables with which are going to work. Wemust remember that these variables are conditioned by the information that
clubs report in their annual accounts.
We are going to work with the variables ‘sporting revenues’ (SR) and ‘seasontickets’ (ST), which incorporates revenues from season tickets, membershipand executive boxes. The sporting revenues variable (SR) represents 77.2% ofthe net ordinary income of Spanish football clubs and the season ticket reve-nues (ST) represent the remaining 22.8%.
The variable ‘sporting revenues’ (SR) gathers information from other incomes. Itconsists of information from different constituents, namely, the income frommatch tickets and the pools (combined as the TAP variable), television rights
(TV) and advertising/sponsorship (ADV). The sporting revenues variable can,then, be called a ‘summarising variable’. However, it is not unusual for this‘summarising variable’ to have a higher value than the sum of its constituentvariables. The reason for this might be that some clubs provide an abbreviatedform of their accounts and only report the summarising variables. So, not allclubs provide full information about each constituent of every variable. This willaffect the number of valid cases for each variable.
The Spanish rules of accountancy state that clubs have to register as ‘SportingRevenues’ the incomes from their main activity, which is the participation insporting competitions. These rules stipulate that the SR account include in-comes such as commercials, broadcasting rights, advertising, sponsorship andpools share.
The variable ‘Tickets and Pools’ (TAP) represents the incomes from sportingcompetitions and from the pools. Apart from the income from ticket sales, insome cases, clubs might register in this account prizes for taking part in compe-titions, and similar funds. The revenues from sporting competitions represent15.7% of sports revenues of the sample. The ‘pools’ account is the appropriateone for registering the share that a particular club receives in pools money. Itwould be interesting to consider both tickets and pools accounts separately, but
the level of valid cases for the ‘pools’ variable is low (44.1%). The reason is thatmany clubs combine the information for tickets and pools within a single ac-count. Hence, we have decided to work with a variable that is the sum of bothaccounts (TAP). This variable represents 16.3% of sporting revenues.
The variable ‘TV rights’ (TV) subsumes, in general, all the revenues linked tothe cession of broadcasting, internet and other rights. This variable has to beconsidered for its relevance within the conceptual schema of the football busi-ness as well as for its importance as a revenue stream (TV revenues constitute46.7% of sporting revenues). Sevilla CF, for two seasons, combined its informa-tion on incomes from television rights and advertising. In our sample, we have
included both elements within the TV variable.

8/6/2019 MPRA Paper 3234
http://slidepdf.com/reader/full/mpra-paper-3234 14/20
13
The last variable that forms part of sporting revenues is ‘advertising’ (ADV). Thisvariable represents 20% of the total amount of sporting revenues. Although thename of the variable is advertising, it includes sponsorship as well.
Incomes from the main activity, but related to membership fees, membership
cards, season tickets, and so on, are accounted as ‘season tickets’ (ST). Aswas mentioned earlier, this variable shows an important weighting in the netordinary income (22.8%).
Now that the variables have been explained, we can present the resultsachieved from the regression analysis. We have had to exclude Real Betis fromthe sample due to the fact that it has handed over all its exploitation rights to aservice company and hence it does not enter any amount in the income ac-counts that are analysed here.
Due to the exponential character of the functions of revenues explained above,
we have worked with their logarithm. For this reason, we have expressed thevariables with the prefix ‘L’.
Table 1. Statistics of regression between sports performance and revenues.
LSR R 2 t sig. LADV R 2 t sig.
LPOS 0,722 18,143 0,000 LPOS 0,587 11,735 0,000
ACPTS 0,775 20,940 0,000 ACPTS 0,513 10,105 0,000
IND 0,885 29,371 0,000 IND 0,669 13,644 0,000
LTAP R 2
t sig. LST R 2
t sig.
LPOS 0,592 12,102 0,000 LPOS 0,599 12,872 0,000ACPTS 0,496 9,968 0,000 ACPTS 0,538 11,363 0,000
IND 0,739 16,413 0,000 IND 0,668 14,128 0,000
LTV R 2
t sig.
LPOS 0,612 12,497 0,000
ACPTS 0,731 16,412 0,000
IND 0,745 16,400 0,000
Note: dependent variables are shown in bold italics
Table 1 shows the results that we have reached. Based on this information wecan state that, in general, the different measures for the sports performancevariable explain to a high percentage and in a statistically significant way themain revenue streams of Spanish professional football clubs. It appears thatsports performance does indeed affect the main revenues of a football club inSpain. These outcomes agree with those reached by Szymanski and Kuypers(1999), particularly referring to sporting revenues. Besides, the behaviour of thecompound index (IND) is especially good for explaining revenues of clubs.
The variable that best explains the performance on the pitch (independent ofthe measure used) is the sporting revenues (SR), as might be expected. Also
the revenues from television rights (TV) explain sports results strongly.
8/6/2019 MPRA Paper 3234
http://slidepdf.com/reader/full/mpra-paper-3234 15/20
14
Finally, as we pointed out in the introduction, the main aim of our work is tocheck whether or not sports performance influences economic results. Sincethe bottom line is a consequence of the subtraction of expenses from turnover,in addition to the study of the relationship between sports performance andrevenues, an analysis of the sports performance on expenses (or a similar
study) would be appropriate. We have opted to test the existence of a correla-tion between revenues and expenses. If a relationship exists, then the regres-sion analysis would give an outcome of analogous results such as that whichwe obtained previously. A very high correlation exists between revenues andcosts. It is significant at a 0.01 level (2-tailed) and the value of the correlationbetween sporting revenues and staffing costs for the sample under considera-tion is 93.2%. This means that the main expenses account is going to havepractically the same patterns of behaviour as the core account of ordinary in-come. Bearing in mind that staffing costs represent approximately 70% of totalincomes of Spanish football clubs, it is logic to conclude that profits will not behigh. In this case, it means that sports performance will have little explanation
power over economic results. This issue is will be analysed further in the follow-ing section.
5 INFLUENCE OF SPORTS PERFORMANCE ON ECONOMIC RESULTS
Now, we will provide empirical evidence to support (or reject) the theories out-lined at the start of this paper. Independent of what the core football businessconcept might be, of whether or not football clubs are profit-maximisers, each ofthe following proposals implies that there is no relationship between sports per-formance and economic results: 1) balance between sports performance andprofit of the club in the long term (Szymanski and Kuypers, 1999); 2) seekingthe best possible sports performance while maintaining financial solvency (Mor-row, 1999); 3) looking to maximise sports performance once the minimum profitlevels have been achieved (Gerrard and Dobson, 2000); 4) considering nullprofit as the aim: or 5) that once the economic target has been satisfied, any theexcess resources will be spent on improving the squad (Guijarro et al., 2000).
The hypothesis that is tested here is the following: even when clubs achievegood sporting performances, this does not condition their economic re-sults, or if it does, it does so only weakly.
Prior to the econometric analysis, a statistical study was carried out of profit be-fore and after taxes, total turnover of ordinary activities and extraordinary re-sults. With this analysis we try to find out if, on average, the economic results ofSpanish football clubs tend to be close to zero; also if the average profit repre-sents an high percentage of revenues; and, finally, to show the relevance ofextraordinary results in the Spanish clubs’ profit an loss account.

8/6/2019 MPRA Paper 3234
http://slidepdf.com/reader/full/mpra-paper-3234 16/20
15
Table 2. Statistics on revenues and economic results (1st & 2nd Divisions, 1998-2002)(data in euros) Mean Median Std. Deviat. Range
Net Profit 375,963 116,632 7,090,508 74,326,842
Profit before taxes 713,386 144,937 7,862,456 74,326,842Total Ordinary Revenue 24,355,909 14,853,016 31,503,993 162,241,342
Extraordinary Results 12,441,800 5,674,272 32,636,209 340,094,785
Table 3. Statistics on revenues and economic results (1st Division, 1998-2002)(data in euros) Mean Median Std, Deviat, Range
Net Profit 1,900,872 271,123 7,795,448 68,874,178
Profit before taxes 2,427,858 434,216 8,759,167 68,874,178
Total Ordinary Revenue 35,447,344 21,514,165 35,285,960 155,501,863
Extraordinary Results 18,097,299 9,206,201 40,134,718 340,094,785
Table 4. Statistics on revenues and economic results (2nd Division, 1998-2002)(data in euros) Mean Median Std, Deviat, Range
Net Profit -2,185,883 -628,130 4,779,430 29,296,696
Profit before taxes -2,166,927 -571,190 4,932,384 29,460,736
Total Ordinary Revenue 5,722,298 4,229,989 4,438,351 22,102,473
Extraordinary Results 2,940,562 1,363,823 3,950,782 19,006,563
We find that the average net profit of Spanish football clubs during the period ofstudy is slightly positive but with a more robust estimator, as the median is, thisresult decreases remarkably. There is a wide range among the economic re-sults obtained for clubs over the period of study and a high standard deviation.This would mean that extreme values would influence the average.
Another point worth highlighting is the small proportion that expected profitrepresents with respect to the total ordinary revenue and the extraordinary re-sults. This implies a high volume of expenses.
The results, dividing the sample according the division in which the club be-longed in each season, illustrate that in First Division on average the clubs
make a profit, while in Second Division they lose money. In addition, in thiscase, it is notable that the amount of average losses is more than a third (in ab-solute terms) of the total ordinary revenue.
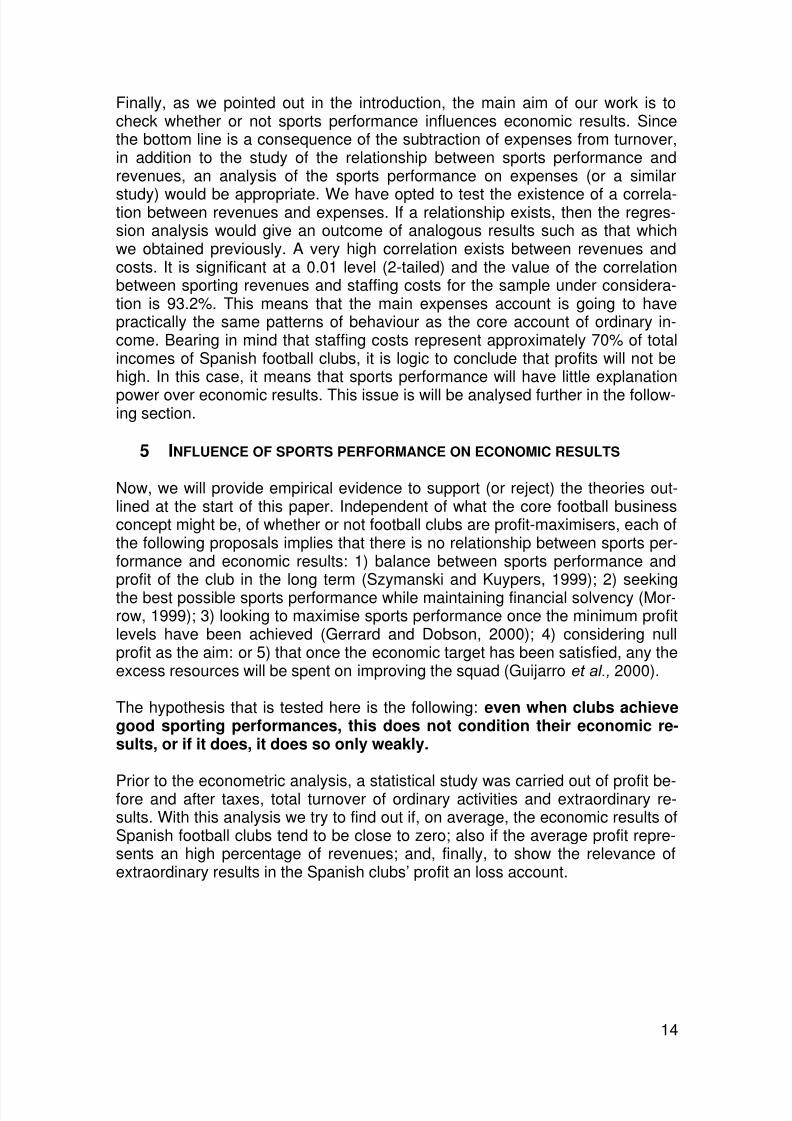
Nevertheless these data are not enough when we try to test that, in generalterms, the profit of Spanish football clubs tends to be null. For this reason a fre-quency analysis was carried out in order to find out the distribution function ofthe economic results of the sample. Figure 3 shows us a clear concentration ofprofits and losses around zero. The fact is that 91.8% of the clubs in the samplemake a profit of less than 10 million euros and greater than -10 million euros.Besides, 31.1% of the clubs have profit of less than 500,000 euros.

8/6/2019 MPRA Paper 3234
http://slidepdf.com/reader/full/mpra-paper-3234 17/20
Figure 3. Net Profit distribution function
-40,000,000.00 -20,000,000.00 0.00 20,000,000.00 40,000,000.00 60,000,000.00
0
20
40
60
80
In a second stage, we have carried out a univariate ordinary least squared(OLS) regression analysis in order to verify the hypothesis proposed at the startof this section. The dependent variable we have employed is the Net Profit offootball clubs and SADs. The independent variable is performance on the pitch.We have used the measurement of sports performance outlined earlier, that is,a measure of ranking (LPOS, according to expression (4)), of accumulatedpoints obtained (ACPTS), and the compound index (IND estimated as indicatedin (5)).
Table 5. Statistics of regression between sports performance and economic results.
Independent variables R2 t Sig,
LPOS 0,080 3,387 ,001
ACPTS 0,090 3,621 ,000
IND 0,141 4,255 ,000Dependent variable: NP (Net Profit)
The outcome of the regression shows us that the independent variables ex-plaining power is considerably low. The compound index (IND) explains only14% of the net profit of Spanish football clubs. The other two variables demon-strate an even poorer explanation power, as they do not even explain 10% ofthe dependent variable. Consequently, other causes not included in the modelhave a higher explaining power than sports performance. So, we may supposethat the sports performance has little conditioning effect on economic results of
football clubs and SADs.
16
8/6/2019 MPRA Paper 3234
http://slidepdf.com/reader/full/mpra-paper-3234 18/20
17
We have also checked the relationship analysed in Table 5 considering onlydata from season 1999-2000. The idea was to test if a higher explanation powerwould be found in a shorter term. However, the results obtained are even worse(R2 of 0.018; 0.001 and 0.089 for LPOS, ACPTS and IND respectively).
We may find an explanation for this outcome in Table 2. As has already beenpointed out, it can be observed that the mean of clubs’ net profit is very low,especially if we compare it with the mean of revenues. The average net profitonly represents 1.5% of the mean of the total ordinary revenues. Taking a mostrobust estimator as median, the percentage falls to 0.8%. These facts supportthe hypothesis that the Spanish clubs tend to null profit. However, at the sametime, we have to be prudent when we interpret these figures because of thehigh dispersion in the data that we have found.
6 CONCLUSIONS
We have found that there is a non-linear relationship, with an explanation de-gree of 55.12%, between budget (expected income) of Spanish football clubsand sports performance. This outcome is consistent with the findings of Deloitteand Touche (2000).
Independent of the measurement to reflect sports performance, it explains in ahigh and statistically significant way the main sources of revenues of Spanishfootball clubs. Due to the characteristics of the sample and the way that theclubs report their financial statements, the ‘sporting revenues’ is the best vari-able to explain performance on the pitch. These results concur with those ob-tained by Szymanski and Kuypers (1999) for English football.
The compound index (IND), which reflects the performance of the team in themain competitions, shows the highest degree of explanation of the differentrevenues streams of Spanish football clubs. We think that the most relevantpoint here is the fact that we did not limit our data to results of league competi-tions. We are aware that the system designed by us is open to discussion, butwhat is clear is that it is worth working with measures of performance that in-clude all the competitions in which the club is involved.
We have proven the existence of a very high, significant correlation between
‘sporting revenues’ and the main expenses account, that is, staffing costs. Tak-ing into account that staffing costs represent more than 70% of total incomes inSpanish football clubs, it is not surprising that we found that the average netprofit of Spanish football clubs in the period 1998-2002 to be only slightly posi-tive. If we split the sample between First and Second Divisions, the result is thatthe average First Division clubs shows a profit while the average Second Divi-sion club shows a loss. Even in the case of First Division clubs, the average netprofit obtained represents an undersized proportion of total ordinary revenue.Furthermore, after a study of frequencies, we found an important concentrationof cases in the sample with a net profit around zero.
Finally, the results of the regression analysis between sports performances andeconomic results during the period 1998-2002 show us that sports performance

8/6/2019 MPRA Paper 3234
http://slidepdf.com/reader/full/mpra-paper-3234 19/20
18
has almost no explanation power of economic results. Following the approachof Szmanski and Kuypers (1999), and trying to verify whether or not in the shortterm a higher relationship could exist, we have tested the dependence betweenboth variables in the 1999-2000 season, and the results are even worse. So wehave to conclude that in Spanish football there must be other causes not-
included in the model (economic results = f[sports performance]) with a higherpower to explain economic results than performance on the pitch.
7 REFERENCES
Baimbridge, M. (1997). Match attendance at Euro 96: was the crowd waving ordrowning?. Applied Economics Letters, 4, pp. 555-558.
Boulier, B. L., & Stekler, H.O. (2003). Predicting the outcomes of National Foot-ball League games. International Journal of Forecasting , 19, pp. 257-270.
Cocco, A., & Jones, J.C.H. (1997). On Going South: the Economics of Survivaland Relocation of Small Market NHL Franchises in Canada, Applied Economics, 29, pp. 1537-1552.
Dawson, P., Dobson, S., & Gerrard, B. (2000). Estimating Coaching Efficiencyin Professional Team Sports: Evidence from English Association Football.Scottish Journal of Political Economy , Vol. 47, No. 4, September, pp.399-421.
Deloitte & Touche (1999). Informe Anual 1996/97 sobre las Finanzas en la Pri-mera División del Fútbol en España. Deloitte & Touche.
Deloitte & Touche (2000 a). Annual Review of Football Finance, A review of the1998/1999 season. Deloitte & Touche, august.
Deloitte & Touche (2000 b). Informe Anual 1997/98 y 1998/99. Las Finanzas enla Primera División del Fútbol en España. Deloitte & Touche.
Dobson, S., & Goddard, J. (2001). Revenue Divergence and Competitive Bal-ance in a Professional Sports League. Working Paper enhttp://econserv2.bess.tcd.ie/DEW/qub1dobson.doc.
El Hodiri, M., & Quirk, J. (1971). An economic model of a profesional sportsleague, Journal of Political Economy , Vol. 79, pp. 1302-19.
Gerrard, B. (2001). A New Approach to Measuring Player and Team Quality in
Professional Team Sports. European Sport Management Quarterly . Vol.1 – n. 3. September, pp. 219-234.
Gerrard, B. (2002). Going down, going down, going down: the economics ofrelegation. Comunicación al 10th EASM Congress. Jyväskylä, 4-7 Sep-tiembre.
Gerrard, B., & Dobson, S. (2000). Testing For Monopoly Rents in the Market forPlaying Talent. Journal of Economic Studies. Vol. 27 – n. 3, pp. 142-164.
Goddard, J. (2005). Regression models for forecasting goals and match resultsin association football. International Journal of Forecasting, 21(2), 331-340. Retrieved July 27, 2005, from EconLit database.

8/6/2019 MPRA Paper 3234
http://slidepdf.com/reader/full/mpra-paper-3234 20/20
19
Guijaro, F., Blasco, A., Rival, F. J., & Rodríguez, J. A. (2000). Aplicación deCostes Presupuestarios para la Valoración de Marcas de Clubes de Fút-bol Españoles. Comunicación al Congreso ACODI, Octubre.
Haan, M., Koning, R. H., & Witteloostuijn, A. van (2002). Market Forces inEuropean Soccer . Communication to 17th Annual Congress EUROPEAN
ECONOMIC ASSOCIATION, 25th January .Hoehn, T., & Szymanski, S. (1999). The Americanisation of European Football.
Economic Policy , April, pp. 205-240.
Koning, R. H. (2003). An econometric evaluation of the effect of firing a coachon team performance. Applied Economics, 35, 555–564
Koning, R. H., Ridder, G., Koolhaas, M., & Renes, G. (2001). Simulation Model for Soccer Championships, University of Groningen, SOM Research Re-ports 01A66.
Magaz, A. M. (2002). Los Resultados del Sector de Fútbol Profesional. Comu-nicación al Congreso Científico Internacional de Fútbol Salamanca 2002 .
Mayo.
Marques, A. (2002). Competitive balance in the Portuguese premiere league ofprofessional soccer. Working Papers in Economics. Re-PEc:wpa:wuwpio:0211025.
Morrow, S. (1999). The new bussines of Football: Accountability and Finance inFootball . Palgrave Macmillan, Houndmills.
Murphy, P. (1999 a). Banking on Success: Examining the Links Between Per-formance and the Increasing Concentration of Wealth in English EliteFootball, Singer & Friedlander . Review 1998-99 Season, pp. 37-44.
Murphy, P. (1999 b). For Richer, for Poorer North of the Border: Examining the
Link Between Resources and Performance in Scottish Elite Football,Singer & Friedlander . Review 1998-99 Season, pp. 45-49.
Noll, R. G. (2002). The Economics of Promotion and Relegation in SportsLeagues: The Cases of English Football. Journal of Sport Economics;3(2), May, pp. 169-203.
Palacios-Huerta, I. (2002). Structural Breaks During a Century of the World’sMost Popular Sport, Working Paper, Brown University, March.
Sloane, P. (1971). The economics of professional football: the football club as autility maximiser. Scottish Journal of Political Economy , 17, pp.121-146.
Szymanski, S. & Kuypers, T. (1999). Winners and Losers: The Business Strat-egy of Football. Penguin, Harmondsworth.