mpcp longitudinal educational growth study baseline … · leadership, policy, accountability, and...
TRANSCRIPT

MPCP Longitudinal Educational Growth Study Baseline Report
John F. Witte University of Wisconsin-Madison
Patrick J. Wolf University of Arkansas
Joshua M. Cowen University of Wisconsin-Madison
David J. Fleming University of Wisconsin-Madison
Juanita Lucas-McLean Westat
SCDP Milwaukee Evaluation Report #5
February 2008

The University of Arkansas
was founded in 1871 as the flagship institution of higher education for the state of Arkansas.
Established as a land grant university, its mandate was threefold: to teach students, conduct research, and perform service and outreach.
The College of Education and Health Professions established the Department of Education Reform in 2005. The department’s mission is to advance education and economic development by focusing on the improvement of academic achievement in elementary and secondary schools. It conducts research and demonstration projects in five primary areas of reform: teacher quality, leadership, policy, accountability, and school choice.
The School Choice Demonstration Project (SCDP), based within the Department of Education Reform, is an education research center devoted to the non-partisan study of the effects of school choice policy and is staffed by leading school choice researchers and scholars. Led by Dr. Patrick J. Wolf, Professor of Education Reform and Endowed 21st Century Chair in School Choice, SCDP’s national team of researchers, institutional research partners and staff are devoted to the rigorous evaluation of school choice programs and other school improvement efforts across the country. The SCDP is committed to raising and advancing the public’s understanding of the strengths and limitations of school choice policies and programs by conducting comprehensive research on what happens to students, families, schools and communities when more parents are allowed to choose their child’s school.

MPCP Longitudinal Educational Growth Study Baseline Report
John F. Witte University of Wisconsin-Madison
Patrick J. Wolf University of Arkansas
Joshua M. Cowen University of Wisconsin-Madison
David J. Fleming University of Wisconsin-Madison
Juanita Lucas-McLean Westat
SCDP Milwaukee Evaluation Report #5February 2008
School Choice Demonstration Project Department of Education Reform
University of Arkansas 201 Graduate Education Building
Fayetteville, AR 72701
479-575-6345
http://www.uark.edu/ua/der/SCDP/Research.html

MPCP Longitudinal Educational Growth Study Baseline Report
1February 2008
CONTENTS
EXECUTIVE SUMMARY . . . . . . . . . . . . . . . . . . . . . . . . . . . . . . . . . . . . . . . . . . . . . . . . . . . 2
INTRODUCTION . . . . . . . . . . . . . . . . . . . . . . . . . . . . . . . . . . . . . . . . . . . . . . . . . . . . . . . . . 3
METHODOLOGY . . . . . . . . . . . . . . . . . . . . . . . . . . . . . . . . . . . . . . . . . . . . . . . . . . . . . . . . . 7
BASELINE DESCRIPTIVES . . . . . . . . . . . . . . . . . . . . . . . . . . . . . . . . . . . . . . . . . . . . . . . . . 11
A Snapshot in Time: Baseline Test Scores in MPS and MPCP . . . . . . . . . . . . . . . . . . . 11
Parent and Student Views: MPCP and MPS Survey Results . . . . . . . . . . . . . . . . . . . 15
SUMMARY/CONCLUSION . . . . . . . . . . . . . . . . . . . . . . . . . . . . . . . . . . . . . . . . . . . . . . . . 32
APPENDIX A: Description of the Study Mandate . . . . . . . . . . . . . . . . . . . . . . . . . . . . . 36
APPENDIX B: Constructing the Sample for Study . . . . . . . . . . . . . . . . . . . . . . . . . . . . 39
APPENDIX C: Data Collection Procedures and Protocols . . . . . . . . . . . . . . . . . . . . . . . 41
APPENDIX D: Parental Survey Tables . . . . . . . . . . . . . . . . . . . . . . . . . . . . . . . . . . . . . . 42
APPENDIX E: Student Survey Tables . . . . . . . . . . . . . . . . . . . . . . . . . . . . . . . . . . . . . . . 59

MPCP Longitudinal Educational Growth Study Baseline Report
2 February 2008
EXECUTIVE SUMMARY
This report focuses on the initial design, implementation and baseline results of the five-year Longitudinal
Educational Growth Study (LEGS) of the Milwaukee Parental Choice Program (MPCP) being
conducted by the School Choice Demonstration Project (SCDP). The LEGS will be the first evaluation
of the participant effects of the MPCP using student-level data since the initial pilot program expanded
dramatically in 1995. Included in this initial report are baseline descriptions of achievement tests for
a representative sample of MPCP students in grades 3 through 9, as well as outcomes for comparable
samples of students in Milwaukee Public Schools (MPS). Also included are a descriptive analysis
of survey results of MPCP parents and a carefully matched sample of MPS parents as well as a brief
description of the results of student surveys for both samples.
The first section of the baseline report discusses the construction of a sample of 2,727 MPCP students in
grades 3-9. The report also discusses the selection of 2,727 similar Milwaukee Public School students. For
both samples the core of this longitudinal study will be to track educational progress through school year
2011-12. We demonstrate that the sample of MPS students constructed by the SCDP is more similar to
the representative MPCP sample along demographic and initial achievement criteria than other potential
comparison groups of MPS students. Because this is a baseline report, readers should infer no causal links
between participation in MPCP and test score outcomes.
The baseline results indicate that MPCP students in grades 3 to 5 are currently scoring slightly lower on
the math and reading portions of the Wisconsin Knowledge and Concepts Examinations (WKCE) than
their MPS counterparts. However, no such difference exists for students in grades 6 to 8. Benchmark
Test results for 9th graders are also similar between the two groups. The differences in grades 3 to 5 are
almost exclusively due to lower MPCP math scores that disappear in grades 6 to 8.
According to our surveys of parents and students, MPCP parents have lower incomes, but higher levels
of education than MPS parents. The two groups are also quite similar on how they learned of their
child’s school and the qualities they sought in schools. A key difference was that MPCP parents received
more information from churches and valued religious instruction more than MPS parents. In both
groups, over 70 percent of students were attending their parents’ first choice of schools. Both MPCP
and MPS parents and students show high levels of satisfaction with their schools—in some cases higher

MPCP Longitudinal Educational Growth Study Baseline Report
3February 2008
than national averages. However, MPCP parents and students are generally more positive about their
schooling experience than their counterparts in MPS. MPCP parents are less likely to report problems
at school such as school violence, and had slightly higher educational expectations for their children, than
comparable MPS parents. Students are also very positive about their schools, differing only slightly in
their evaluation of their school climate depending on whether they were in the MPCP or MPS.
The LEGS is a student-based extension of the evaluation of the MPCP made possible by WI Act
125, Sec. 8, 119.23 (7)(e), 2 to be carried out by the SCDP based at the University of Arkansas. This
project is being funded by a diverse set of philanthropies including the Annie E. Casey, Joyce, Kern
Family, Lynde and Harry Bradley, Robertson, and Walton Family foundations. We thank them for their
generous support and acknowledge that the actual content of this report is solely the responsibility of the
authors and does not necessarily reflect any official positions of the various funding organizations, the
University of Arkansas, the University of Wisconsin, or Westat, Inc. We also express our gratitude to
MPS, the private schools in the MPCP, and the state Department of Public Instruction for their willing
cooperation, advice, and assistance.1
INTRODUCTION
The Milwaukee Parental Choice Program
The Milwaukee Parental Choice (Voucher) Program (MPCP) was the first parental choice program in the United States to allow urban parents to send their children to private schools with public funds covering the entire costs.2 Often simply referred to as the “Choice” program, it is the largest of 12 voucher programs in the United States.3 In 2006-07, the baseline year of this report, a total of 17,749 students
1 We thank Thomas Nechyba of Duke University, Paul E. Peterson of Harvard University, and Robert K. Yin of COSMOS Corporation for insightful comments on earlier drafts of this report. We also thank David E. Campbell of the University of Notre Dame, Anneliese Dickman of the Milwaukee Public Policy Forum, and Tom Loveless of the Brookings Institution for helpful advice they offered during the Research Advisory Board meeting in January 2008. All errors are ours alone.
2 Since the late 1800s, Maine and Vermont have provided school vouchers to students in certain rural areas that lacked a public school, originally allowing them to attend any public or private school of their choosing in the area at public expense. The Maine program was subsequently limited to public or non-sectarian private schools. There is no clear consensus in the school choice literature regarding whether or not Maine and Vermont’s “town tuitioning” programs are actual voucher programs, though in concept and operation they are similar instruments of parental school choice.
3 This count includes the town tuitioning programs in Maine and Vermont; means-test programs in Cleveland, the District of Columbia, and Milwaukee; disability programs in Arizona, Florida, Georgia, Ohio, and Utah; a foster-care program in Arizona; and a statewide program in Ohio limited to students attending public schools in need of improvement. Of

MPCP Longitudinal Educational Growth Study Baseline Report
4 February 2008
received vouchers worth a maximum of $6,501 to attend one of 122 participating private schools in Milwaukee.
The MPCP began in September 1990, based on legislation passed the year before as part of the biennial budget bill. The program was targeted to low-income students (175% of the poverty line or less) who either had attended Milwaukee Public Schools (MPS) or were not in school the prior year. Only secular private schools were allowed to participate, and they had to limit their voucher students to 49 percent of total enrollment. The program was capped at 1 percent of the MPS student population (approximately 1,000 students in 1990). The voucher was equal to the annual per pupil MPS state aid ($2,446 in 1990). Annual evaluations and reports were required and the program was to terminate with the 1994-95 year.
There have been three major modifications in the program. In 1993-94 the maximum enrollment of Choice students in a school was raised from 49 to 65 percent and the total program cap was raised to 1.5 percent of the MPS enrollment. All sunset provisions were removed. Major changes in 1995 allowed sectarian schools to participate; allowed students who were in private schools in kindergarten through third grade to participate; eliminated any cap on voucher students per school; increased the program cap to 15 percent of MPS students; and eliminated all evaluation and reporting requirements.
Another series of major changes was made in 2005, with Wisconsin Act 125. The students’ prior school criteria were completely dropped, so that any student living in Milwaukee was potentially eligible. The family income cap for continuing Choice students was raised to 220 percent of the poverty line if they had been admitted earlier with an income under 175 percent. The program limit was raised to 22,500 students. Private schools faced a set of new accreditation and testing requirements. Those new testing requirements of Act 125 were coupled with the call for an independent evaluation of the MPCP by the School Choice Demonstration Project, to be reviewed annually by the Legislative Audit Bureau.4
The general purposes of this report are two fold. The first is to outline the general research and methodological issues that will guide the research over the five-year period of the Longitudinal Educational Growth Study (LEGS). Those issues and the research design are focused on longitudinal changes in the educational outcomes of comparable students over the period. The second purpose is to present baseline descriptions of MPCP participants both in terms of baseline test scores, from which we will judge growth in achievement, and baseline survey results of samples of both Choice and MPS parents and students. We first briefly review prior research and outline the major research questions.
Prior Research
Prior research on publicly funded voucher programs in the United States has been limited to four locations: Milwaukee, Cleveland, Florida, and the District of Columbia. Privately funded voucher
these, only Florida’s McKay Scholarship Program for students with disabilities has an enrollment (16,812 in 2006-07) that rivals the MPCP.
4 This report is a student-based extension of the evaluation made possible by Act 125.

MPCP Longitudinal Educational Growth Study Baseline Report
5February 2008
programs have also been studied, with most attention being given to programs in New York City, Washington, D.C. and Dayton, OH (Howell et al, 2002). Despite the limited number of voucher programs, numerous researchers have contributed a considerable body of evidence to the debate over vouchers. The type of research falls into two broad areas: 1) the differences in achievement and other outcomes between students in voucher schools and various comparison groups; and 2) the systemic, “competitive” effects of voucher programs on the remaining public schools. The LEGS deals only with the former question. Future reports from the School Choice Demonstration Project will address the latter area.
The evidence on achievement from prior studies has yet to produce a strong academic consensus, with reported voucher impacts ranging from 0 to statistically significant gains of 3-4 percentile points per year. Prior research on Milwaukee from 1990 to 1994 found mixed results on student achievement, with all researchers agreeing that there were not significant differences between private (voucher) students and a random sample of similarly eligible MPS students on reading scores even after as long as three years in the program. There was considerable disagreement on possible math differences, with the three studies differing over the size of the advantage of private schools (Witte, 2000, chapter 6; Rouse, 1998; Greene et al, 1999). In terms of who participated in the prior Milwaukee voucher program, there was agreement that the private schools did not “cream skim” the best students, although choice parents, while very poor and often heading single-parent households, were more educated, had higher levels of prior parental involvement, and placed somewhat more importance on education than otherwise comparable MPS parents (Witte 2000, chapter 4). Finally, researchers agreed that choice parents were less satisfied with their prior public schools and more satisfied with their subsequent (private) schools than MPS parents.
Studies of other voucher programs have found similar results on parental satisfaction but have mixed, and contested results on student achievement. In Cleveland there appeared to be no overall differences on achievement test scores between voucher recipients and public school students (Metcalf et al, 2003). The same was true in Washington, DC based on the first year outcome report of an experimental evaluation (Wolf et al, 2007). In Florida there are a series of different programs including a vouchers-for-failing-schools program (recently ruled in violation of the Florida constitution); a program for students with disabilities; and a program awarding scholarships to poor students to attend private schools financed by corporate contributions in lieu of some state taxes. Research on these programs has thus far focused primarily on the effects of voucher competition on student achievement in public schools. Three different research teams have all reported that the Florida voucher programs have resulted in public (i.e. non-voucher) students achieving at higher levels, but disagree regarding how much of the public school gains are due to voucher competition and how much are simply due to the desire to avoid the stigma of failure (Figlio and Rouse 2006; West and Peterson 2005; Greene and Winters 2003).
Research Questions in the Longitudinal Educational Growth Study
A number of important research questions surrounding educational choice fall within the domain of “participant” effects, which is the focus of the LEGS. They fall into two broad categories. The first concerns the effects of the Choice program on students themselves. The second is an understanding of

MPCP Longitudinal Educational Growth Study Baseline Report
6 February 2008
how parents and students react to choice environments and how these families are impacted by such programs. The research in this study covers both of these areas.
Program Impacts on Students. There are two general sets of issues that have repeatedly been analyzed in choice intervention studies, as well as studies comparing public and private schools. The two issues deal with educational achievement and attainment. The former, relying on standardized tests as key outcome variables, is often the major focus of education evaluations. To the extent that standardized tests are proxies for meaningful educational outcomes, these studies are necessary and valuable. Achievement gains are also important in that they are linked to what we know absolutely has lifelong value – educational attainment. Attainment is usually measured by years of education completed or by reaching certain milestones, such as high school graduation. Hundreds of studies have linked the number of years of education completed to outcomes such as higher lifetime incomes, and lower chances of living in poverty, incarceration, or having children out of wedlock. Thus both achievement and attainment are crucial outcome measures in studying the effects of educational policies and interventions.
One of the primary research tasks for the LEGS is to compare the pupils in the MPCP to a similar group of students in MPS in terms of growth in both achievement and attainment. The LEGS Achievement study will be based on the progress of students beginning in grades 3 through 8 on the Wisconsin Knowledge and Concepts Examinations (WKCE). The LEGS Attainment study will be based on following 9th graders in 2006-07 through high school and beyond. Achievement outcomes will be judged by estimating growth in scale scores on the WKCE controlling for prior levels of achievement and other student and family characteristics. In the future, we will look at attainment on a yearly basis in terms of remaining in school and progressing from one grade to the next. We will follow the 2006-07 9th graders through what would typically constitute the four years of their high school education, and measure outcomes such as college enrollment or employment after either completing or dropping out of high school. We will also study how the LEGS components are related. For example, do achievement gains predict high school graduation? What are the effects of grade retention on subsequent achievement gains or on the probability of graduating?
Another major issue that affects a number of aspects of education, but specifically achievement and attainment, is student mobility. Mobility is defined as students moving between schools when they have not reached a terminal grade in a school. Mobility may be between schools in the same system or between school systems or districts. In the last several decades educators and researchers have become keenly aware of the extremely high mobility rates for inner-city students. In the 1990s in Milwaukee such mobility at the elementary school level was judged to be between 22 and 28 percent per year (Witte, 2000, pp. 143-44). Thus we will be measuring and studying student mobility both as an outcome measure and as a variable that we hypothesize will negatively affect both achievement and attainment.
Data for both these studies will come from administrative records, test records, and parental and student surveys of comparable groups. The precise methodology and data collection protocols are described below and in the appendices.
Families and Educational Choice. Another important set of research questions revolves around families and choice environments. There are two broad sets of issues involving families. The first is to try to

MPCP Longitudinal Educational Growth Study Baseline Report
7February 2008
understand how families make school choices and what impact those choices may have on school enrollments. One critical issue is the characteristics of families who elect to use vouchers to attend private schools. One hypothesis is that families with higher socio-economic status (SES) are more likely to use vouchers, thus leaving the traditional public schools with lower SES families and more difficult to educate children. An alternative hypothesis is that choosing parents will do so because their children are not doing well in traditional public schools and they look to the private schools as a way to improve the educational outcomes of their low-performing children.
As noted above, earlier studies of the MPCP provided some evidence for each hypothesis (Witte 2000). Voucher students averaged initial test scores that were equal to or lower than comparable MPS students. The Choice families also had considerably lower income and parents were very unhappy with their prior public schools. However, Choice parents also were more educated, spent more time on their children’s education, and valued education more than comparable MPS parents. The research in this study may shed further light on the critical question of whether voucher programs primarily serve advantaged or disadvantaged students.
Family characteristics are also fundamental to understanding achievement and attainment issues. Parent education, parent involvement, and family status all have been linked to higher student achievement and attainment. Thus it is imperative to have controls for these variables in estimating the effects that private or MPS schools may have on achievement and attainment gains.
A second set of family related issues, affecting both parents and students, are the levels and changes in attitudes toward the schools students attend. How do they judge their schools overall? How satisfied are they? How do they “grade” their schools? More specifically, what aspects of schools do they find most and least effective? The answers to these questions will provide us with clues as to what parents believe to be most important in schools, and if programs like the choice program allow more families to find schools with the qualities they desire. Given that higher income families have more residential and hence public school choice, this study will seek to determine if the Choice program facilitates parental matching of schools for lower income families. The answer to that question may come from parent surveys over time, but also from student mobility between schools and into and out of the program.
METHODOLOGY
One of our first research tasks was to identify two comparable samples of students—one from the MPCP and one from MPS. Samples were required (rather than entire populations) because of resource limitations on surveying parents, testing students, and tracking students over time. After estimating the size of the samples needed for identifying any statistically significant results after five years (given anticipated attrition), a grade-stratified random sample of MPCP students was drawn for grades 3 to 8. Those grades were selected because MPS administers the Wisconsin Knowledge and Concepts Examinations (WKCE) annually in those grades for federal accountability purposes. We selected all the

MPCP Longitudinal Educational Growth Study Baseline Report
8 February 2008
Choice students in the 9th grade to follow so that we had a large enough sample to withstand attrition for our five-year attainment study.5
The question then was what to use for a comparable sample of MPS students. The ideal arrangement would be to have an experimental design in which all students desiring a voucher would be randomly selected to receive one or not. However, there is no statutory provision for random assignment under Wisconsin Act 125. Furthermore, since the student limits on the program had been increased in anticipation of increasing demand, it was impossible to construct a comparable group from waiting lists or students not picked in school and grade-level lotteries.6
Because the study will rely on changes over time in measures of achievement and attainment, it was important to be able to match samples on three critical criteria: 1) current levels of achievement, indicated by baseline test scores; 2) observable demographic characteristics known by researchers to be related to educational outcomes, and 3) variables that might serve as proxies for unobservable factors that may affect the comparable outcomes for each group.7 To meet these criteria, we developed a unique and innovative approach in the construction of a sample of MPS students comparable to the representative MPCP sample. We used a combination of matching on specific student characteristics and a method of matching based on the propensity of certain students to participate in the program. Sample selection thus involved a three-stage process.
In the first stage we matched students in the same grade on their neighborhoods in Milwaukee. We did this in sequence for each student in the sample of MPCP students. Following the advice of demographers and city planners, we used census tracts to identify student neighborhoods. Census tracts are drawn by the U.S. Census Bureau to follow neighborhood boundaries. In our sample, MPCP students come from 213 different census tracts. In this stage, for any given MPCP student in our sample, we restricted the list of potential MPS matches to students in the same tract. One indication that our categorization of neighborhoods has substantive support comes from the survey results outlined in Appendix D (question 58). These results indicate nearly identical responses from MPCP and MPS parents regarding the safety of their neighborhoods. In particular, roughly 8 percent of respondents from both groups designated their neighborhoods “very unsafe,” while 20 percent responded to the “very safe” designation.
5 See Appendix C for more information on the MPCP sample selection process.
6 Previous research on educational choice has used both of these methods. For the potential problems with using “rejects” from school lotteries as a control group, see Witte, 2000, pp. 136-42. However, the problem with waiting lists may be even more severe in that the schools with waiting lists are not randomly assigned across schools. One would have to assume that waiting lists indicate more desirable schools, and thus the full impact of the program (i.e. the full set of private schools) would not be adequately assessed using wait-listed students as a control group.
7 Random assignment with large enough samples fulfills these criteria. Test scores should be on average equally distributed between the treatment and control groups. Factors that we can and cannot measure that might lead some families to choose to participate, but could also be correlated with outcomes, are also equally distributed through the randomization process, thereby preventing “selection bias.”

MPCP Longitudinal Educational Growth Study Baseline Report
9February 2008
In the second stage, we matched students within census tracts within the same 5 percentile bandwidth of WKCE baseline test scores. In the final stage, if more than one MPS student was matched to the MPCP student based on census tract and test scores, or if there was missing values for either variable for an MPCP student, we matched by estimating propensity scores (Rosenbaum and Rubin 1983). The propensity score matching process identifies characteristics commonly associated with enrollment in the MPCP that are present in MPS students, making those public school students a good “match” for Choice students. In this step, we estimated the propensity of MPCP participation as a function of the mean of math and reading baseline test scores, gender, race and an indicator for students with English Language Learning (ELL) status. This estimation occurred by grade so we could account for the potential that the predictor variables had different impacts on the likelihood of school choice for different ages. The MPS student with the closest propensity score to the MPCP student was then selected. If missing predictors made it impossible to construct a propensity score for the MPCP student, a MPS student was selected at random from those remaining after matching on census tract and prior test. If the missing predictor was student test score, matches were made at random within tract.8
Propensity scores have been increasingly used in recent evaluation research when random assignment is not possible. We believe that by first selecting students using neighborhood and prior test scores and then using propensity scores to break ties or augment matches, we improve on simply matching on or controlling for baseline tests scores and therefore reduce the threat of selection bias. The leverage on selection effects hinges on the assumption that similar neighborhoods will serve as a control for unobserved variables that may affect outcomes.9
Although our future models for estimating gains in achievement and attainment will also include a large number of observed control variables that we know affect achievement, it is important to note that our matching method results in a comparison sample of MPS students with very similar observable characteristics to the MPCP sample. As indicated below in Table 1 and Figure 1 our matched MPS sample is closer to the MPCP sample on test scores, gender, and race than to an obvious alternative comparison group: a random sample of MPS students.10
8 See Appendix B for a detailed discussion of the sample construction.
9 Evidence for neighborhood effects on social outcomes is presented across several social science disciplines. See, e.g., Aaronson (1998) for evidence of neighborhood effects on educational outcomes even after family characteristics are taken into account; Ludwig, Ladd and Duncan (2001) and Leventhal and Brooks-Gunn (2004) for experimental evidence linking neighborhood improvements to improvements in student outcomes; and Sampson, Morenoff and Gannon-Rowley (2002) for a general discussion. See also Cullen, Jacob and Leavitt (2005) for use of census tract information in research on school choice.
10 After creating the random sample of MPS students, we compared this sample to the population of MPS students. We found no significant differences between our random sample and the MPS population. It is unclear if a closer match would be to use a random sample of all MPS students or just those MPS students eligible for reduced/free lunch. The MPCP income limit is 175% of the poverty line or less; the reduced/free lunch cutoff is 185% of the poverty line. Eighty-three percent of MPS now qualify for free lunch, with a number undoubtedly under identified (especially at the high school level). Complicating the decision is that some students in MPCP can now have incomes up to 220% of the poverty line, but no current data exist on how many. The issue is not critical because our major comparison will be with

MPCP Longitudinal Educational Growth Study Baseline Report
10 February 2008
Figure 1 indicates that for test scores for students in grades 3, 4 and 5, the MPS students matched via our algorithm (MPS Matched) are considerably closer to our MPCP sample than scores from a random sample of MPS students. Test scores for the various groups converge in the latter grades. If the goal for selecting a comparison group is to simply align baseline test scores as closely as possible to ensure that any diverging scores in future years are compared to a similar starting point, our method is at least as accurate as other methods in grades 6, 7 and 8, and preferable to other methods for the earlier grades. The fact that, in our comparison group, students’ neighborhood, race, gender, ELL status and the joint effect of these characteristics on school choice (students’ propensity scores) are accounted for further supports our method.
Figure 1: Combined Math/Reading Comparisons (2006-2007)
350
370
390
410
430
450
470
490
510
530
550
3 4 5 6 7 8
Grade
Mea
n M
ath/
Rea
ding
Sca
le S
core
MPCPMPS MatchedMPS Random
Table 1 displays demographic data on students in our MPCP sample and students in both of the potential comparison groups. Perhaps the most important statistic is the proportion of white students in each sample, which indicates disproportionately high participation in MPCP among minority students. Nine percent of students in the MPCP sample and our MPS Match sample are white compared to 15 percent in the MPS Random sample. In both the MPCP and MPS Matched samples, African-Americans represent roughly two-thirds of the students, compared to 60 percent in the Random MPS sample.
the matched MPS sample we constructed using the procedures outlined above. For this report we merely included a random sample of all MPS students as another possible comparison.

MPCP Longitudinal Educational Growth Study Baseline Report
11February 2008
Compared to the MPCP sample, Hispanics are slightly underrepresented in the MPS Matched sample, where the 20 percent of students classified as Hispanic is closer to the MPS Random sample. The MPCP sample and our MPS Matched sample are more similar in gender and ELL breakdowns than the MPCP sample is to the MPS Random sample.
Table 1: Comparisons of Student Characteristics in Three Possible Study Samples, 2006-07
Sample Black Hispanic White Female ELL Free/Reduced LunchMPCP 0.66 0.23 0.09 0.55 0.11 0.87MPS-Matched 0.67 0.20 0.09 0.53 0.10 0.86MPS-Random 0.60 0.20 0.15 0.48 0.13 0.84
Note: Cell values represent proportions of the total sample.
BASELINE DESCRIPTIVES
A Snapshot in Time: Baseline Test Scores in MPS and MPCP
The matching procedure was necessary to produce appropriate samples for comparisons between MPS and MPCP students in subsequent years of the study. Because the matching procedure included neighborhood, student characteristics, and baseline test scores, future reports will be able to estimate the effects of MPCP participation on student educational growth. These “value-added” estimates for individual students are now the standard in estimating the effects of education interventions. What we will be estimating in the future are gains in educational achievement for individual students, comparing the results for the MPCP Random sample and MPS Matched sample. In this report, however, only a general description of the baseline test scores of the MPCP sample, the MPS Matched sample and the MPS Random sample of students are possible. This description is simply a “snapshot” in time and cannot be used as evidence of any effect of MPCP participation on student achievement.
Table 2 reports average math and reading scale scores on the Wisconsin Knowledge and Concepts Examinations (WKCE) for 3rd through 8th graders among MPCP, MPS Matched students and a grade-stratified random sample of MPS students.11 We include the random MPS group for additional comparison and to further indicate the success of our matching procedure. The table also reports the combined scale score—the mean of math and reading scores—for the three groups. Results from difference-in-means tests between MPCP and the two MPS groups are indicated in the table key.
11 For more information on testing protocols see Appendix C.

MPCP Longitudinal Educational Growth Study Baseline Report
12 February 2008
Table 2: Sample WKCE Scores (Grades 3-8), 2006-07
Grade Sample N Mean Reading
Scale Score
Reading SD Mean Math
Scale Score
Math SD Combined
Mean Scale
Combined SD
3 MPCP 341 427.9 44.1 380.5 48.1 404.1 42.63 MPS-Matched 341 429.9 42.9 390.1** 47.8 410.1* 41.13 MPS-Random 341 440.3*** 38.2 401.8*** 49.8 421.7*** 40.34 MPCP 324 436.0 49.4 414.8 49.8 425.3 44.74 MPS-Matched 324 437.5 49.8 423.0** 49.9 430.0 45.24 MPS-Random 324 447.2*** 53.3 434.4*** 46.6 440.8*** 46.55 MPCP 338 441.8 47.2 437.9 43.2 439.6 41.95 MPS-Matched 338 440.6 51.1 444.6** 41.5 442.7 41.05 MPS-Random 338 448.2 56.4 452.4*** 44.3 450.8 46.76 MPCP 330 463.7 48.4 467.5 38.5 465.4 39.86 MPS-Matched 330 466.3 50.0 471.5 42.5 468.9 41.46 MPS-Random 330 464.3 54.3 469.4 43.7 467.9 43.87 MPCP 303 472.0 51.0 492.1 44.9 481.3 46.67 MPS-Matched 303 467.9 49.8 494.2 41.9 481.1 42.57 MPS-Random 303 476.7 48.9 498.6* 46.5 488.1* 44.08 MPCP 290 487.2 53.9 495.9 42.9 490.7 44.08 MPS-Matched 290 483.6 58.8 500.3 46.6 492.2 47.68 MPS-Random 290 488.4 55.3 497.3 50.1 493.0 49.5
TOTAL MPCP 1926 453.5 53.1 445.7 61.1 449.4 53.0TOTAL MPS-Matched 1926 453.5 53.9 452.1*** 59.6 453.0** 51.8TOTAL MPS-Random 1926 460.0*** 54.0 457.2*** 58.0 459.2*** 51.6
Note: “SD” stands for standard deviation. ***Different from MPCP at p<0.01 **Different from MPCP at p<0.05 *Different from MPCP at p<0.10
As expected by our algorithm, the MPCP students are generally very close to the MPS matched sample on most tests. And where there is a statistically different mean, the mean differences are quite small. Thus, as outlined in the last section, our algorithm for constructing the MPS Matched sample worked very well.
When compared to the MPS random sample, the MPS Matched test scores are generally closer to the MPCP scores. When there are statistically significant differences between MPCP and MPS Matched test scores, the MPS Matched scores are still closer to the MPCP scores than the MPS random sample scores are. Difference in means tests indicate that test scores in reading for students in grades 3 to 5 were generally higher in 2006 for MPS students than for MPCP students, but that these differences disappear for later grades. The trend in math is slightly more persistent, as MPS students also score higher in grade
MPCP Longitudinal Educational Growth Study Baseline Report
13February 2008
7. Slight but significant differences between MPCP and MPS Matched students are evident in math achievement for grades 3 to 5. However, with one exception (grade 3), these differences are not found in the combined score.
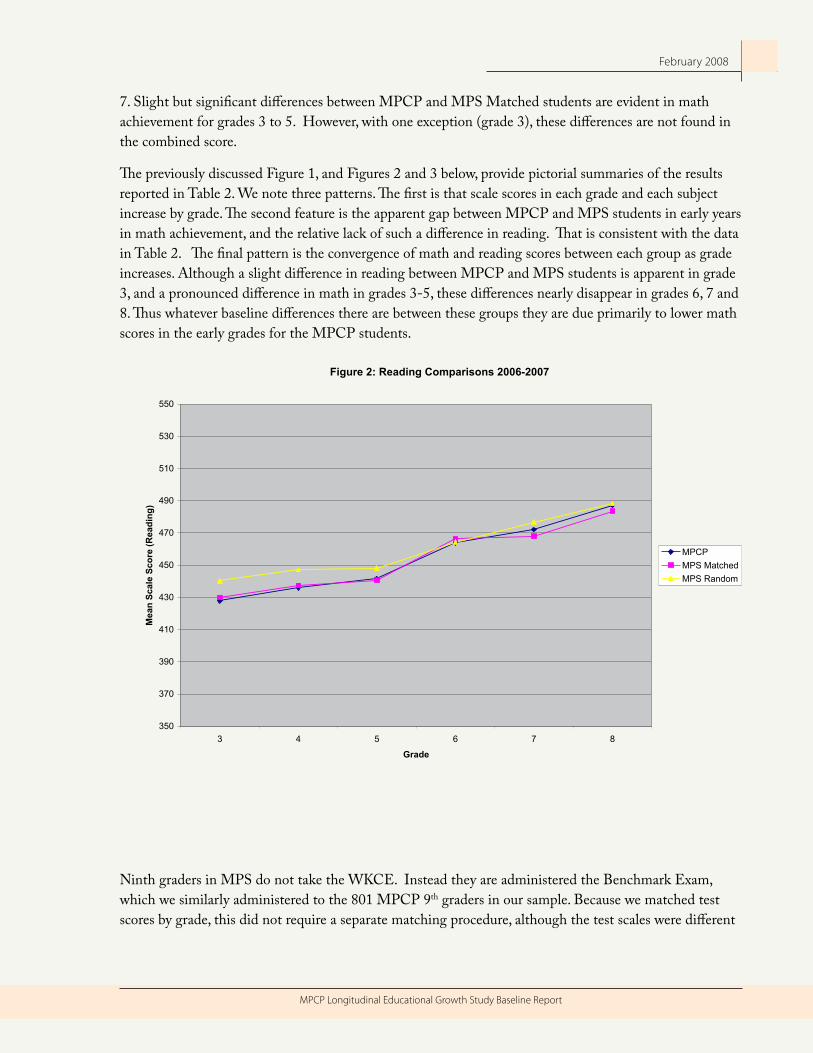
The previously discussed Figure 1, and Figures 2 and 3 below, provide pictorial summaries of the results reported in Table 2. We note three patterns. The first is that scale scores in each grade and each subject increase by grade. The second feature is the apparent gap between MPCP and MPS students in early years in math achievement, and the relative lack of such a difference in reading. That is consistent with the data in Table 2. The final pattern is the convergence of math and reading scores between each group as grade increases. Although a slight difference in reading between MPCP and MPS students is apparent in grade 3, and a pronounced difference in math in grades 3-5, these differences nearly disappear in grades 6, 7 and 8. Thus whatever baseline differences there are between these groups they are due primarily to lower math scores in the early grades for the MPCP students.
Figure 2: Reading Comparisons 2006-2007
350
370
390
410
430
450
470
490
510
530
550
3 4 5 6 7 8
Grade
Mea
n Sc
ale
Scor
e (R
eadi
ng)
MPCPMPS MatchedMPS Random
Ninth graders in MPS do not take the WKCE. Instead they are administered the Benchmark Exam, which we similarly administered to the 801 MPCP 9th graders in our sample. Because we matched test scores by grade, this did not require a separate matching procedure, although the test scales were different

MPCP Longitudinal Educational Growth Study Baseline Report
14 February 2008
(scale scores for the WKCE; percent mastery in subject for the Benchmark).12 We report the results of 9th grade Benchmark scores in Table 3. As in earlier grades, the MPCP 9th graders are closer to the MPS Matched than to the random sample of MPS students in the same grade. Unlike the earlier grades, however, MPCP 9th graders appear to exceed their MPS counterparts in one subject area (reading), and this difference carries over to the combined math/reading scores. Observed with the pattern of converging scores (albeit from separate testing instruments) evident in Figures 1 to 3, these results indicate relative parity between MPCP students, the MPS Matched students, and the MPS population in the later grades. Across the grade levels, there is little evidence that MPCP schools are “cream-skimming” the “best” students, at least in terms of test scores.
Figure 3: Math Comparisons 2006-2007
350
370
390
410
430
450
470
490
510
530
550
3 4 5 6 7 8
Grade
Mea
n Sc
ale
Scor
e (M
ath)
MPCPMPS MatchedMPS Random
12 The Benchmark test is not nationally normed and is used primarily as a classroom diagnostic test given multiple times in a year. We used it for matching purposes because it was all that was available as a measure of baseline achievement for the 9th graders in each sample. We will not include these ninth graders in the LEGS Achievement Study. Whether we include these test scores as covariates in the LEGS Attainment Study will be determined next year when we will have 10th grade WKCE scores for the 9th graders still in school in 2007-08.

MPCP Longitudinal Educational Growth Study Baseline Report
15February 2008
Table 3: Sample Benchmark Scores (Grade 9), 2006-07
Grade Sample N Mean Reading
Reading SD
Mean Math
Math SD Combined Combined SD
9 MPCP 801 49.6 18.8 42.6 16.7 46.1 15.69 MPS-Matched 801 46.2*** 19.1 43.9 18.2 44.8 16.39 MPS-Random 801 44.6*** 20.6 42.8 18.9 42.7*** 18.2
***Different from MPCP at p<0.01 **Different from MPCP at p<0.05 *Different from MPCP at p<0.10
Parent and Student Views: MPCP and MPS Survey Results
Introduction
In order to more fully understand the school choice environment in Milwaukee, we surveyed the parents and students of our MPCP sample and the MPS Matched sample. Westat telephoned MPCP and MPS Matched parents. MPCP students in grades 4 to 9 and their MPS matches also completed surveys subject to parental consent. During the testing period, MPCP students were given a written survey to be completed on their answer key. Those students who did not complete the survey at this time were noted and were later telephoned, as were all MPS Matched students.13
The response rates for the parent and student surveys are presented in Table 4. For the MPCP parent survey, two different samples are offered. The first MPCP column includes response rates for the parents of students in the final sample (n = 2727) plus those parents who refused to have their children participate in the testing portion of the study (n = 134). Although we did not analyze the test scores for any student whose parent refused participation in the study, we did include these parents and their children in the survey sample. The total completed survey response rate for this sample was 64.9 with 12.3 percent of the sample completing surveys in Spanish. This rate is quite impressive given the mobility of the survey population. The second MPCP sample pertains to the response rates for the final sample only (n = 2727). Excluding study refusals the MPCP response rate was 65.4 percent. The response rate for MPS parents was 51.6 percent. The MPS survey was conducted later in the year, so it is unsurprising that the number of parents who were not locatable was higher (39.3) in the MPS sample than the MPCP sample. It is encouraging that only 1.8 percent of MPCP parents and 3.9 percent of MPS parents outright refused to be interviewed once they were contacted by survey administrators.
The response rates for the student survey are in the bottom of Table 4. Since third grade students were not surveyed, the sample sizes are smaller for the student survey than the parental survey. MPCP students could complete the survey in one of two ways: with paper and pencil at the time of test taking, or in a phone survey. Almost three-quarters of MPCP students responded on the paper survey. The total
13 For more information on the survey protocols, see Appendix C.

MPCP Longitudinal Educational Growth Study Baseline Report
16 February 2008
completed survey response rate is 83 percent for the total sample. All of the MPS student surveys were completed over the phone. The MPS student response rate is 46.6 with 4.0 percent of MPS student surveys completed in Spanish.
Table 4: Response Rates 2006-2007
Parental Survey MPCP MPCP MPS
Total Sample With Testing Parental Refusals
Final Sample
Matched Sample
Completed-Total 64.9 65.4 51.6Completed-English 52.5 52.6 47.0Completed-Spanish 12.3 12.8 4.6
Partial Completion 0.1 0.2 1.1Ineligible 0.8 0.8 0.4Language Problem 0.2 0.2 0.4Refused to be Interviewed 2.0 1.8 3.9Not Locatable 23.0 22.5 39.3Missing 9.0 9.1 3.2TOTAL (N) 2,861 2,727 2,727
Student Survey MPCP MPCP MPS
Total Sample With Testing Parental Refusals
Final Sample
Matched Sample
Completed-Total 83.0 84.5 46.6Completed-Paper Survey 74.6 77.8
Completed-Phone Survey 8.4 6.8 46.6^Child Disabled 0.1 0.1 0.5Child Moved 0.7 0.7 2.2Ineligible 0.6 0.7 0.6Language Problem 0.0 0.0 0.5Refused to be Interviewed 0.3 0.3 4.7Not Locatable 8.0 6.6 41.2Missing 7.2 7.1 3.7TOTAL (N)* 2,499 2,386 2,386
Note: The cell values represent percentages.*There are fewer student surveys than parental surveys because 3rd graders were not surveyed.
^4.0 percent of the MPS student surveys were completed in Spanish.

MPCP Longitudinal Educational Growth Study Baseline Report
17February 2008
The survey results provide us with a nuanced understanding of education circumstances. The main purposes of the survey were: (1) to understand who participates in the program; (2) to understand the school choice environment in the city of Milwaukee; (3) to understand parental participation in and expectations for their children’s achievement; (4) to examine parental reports of student success; and (5) to gauge levels of parental satisfaction with their children’s educational experiences. In the future, we will be able to use information from the surveys to model growth in student achievement.
Who Participates in the Choice Program?
The complete results of the parental survey are available in Appendix D. The MPCP parental results include 1,856 fully completed surveys and 4 partially completed surveys from those in the total sample (including testing parental refusals). Results from 1,438 completed surveys from MPS parents are also included. Analyzing the demographic characteristics of parents provides some insight into who chooses and who does not. However, one must remember that we matched students based on test scores, census tracts and, in some cases, student demographic information. Therefore, we did not expect large differences between MPCP and MPS parents, at least not at baseline.
Race. The majority of survey respondents are African-American (Q37). While a greater percentage of MPS (62.5 percent) respondents were African-American when compared to the MPCP (57.6 percent), Hispanics make up a greater proportion of MPCP respondents (24.5 percent) than in MPS (18.7). The number of white parent respondents is similar in each program.
What is your ethnicity?
MPCP MPSAmerican Indian 3.3 2.2Asian or Pacific Islander 2.1 2.8Black 57.6 62.5Hispanic 24.5 18.7White 15.8 14.3Other/Refused/Don’t Know 1.5 3.0
Note: Respondents could select more than one category.
Education. There are some important differences when examining the highest education level of respondents (Q38). About 51 percent of MPCP respondents have a high school diploma or less, while 14.0 percent have at least a four-year college degree. On the other hand, MPS respondents are comparatively less-well educated with roughly 57 percent of parents having a high school diploma or less and 11.1 percent having a college degree or more. This result is consistent with Witte’s (2000) previous analysis of the Milwaukee choice program from 1990 to 1994. Witte found that 45 percent of mothers with a child enrolled in the MPCP were a high school graduate or less, while only 8 percent had a four-year college diploma or post-graduate work. One of the major differences in Witte’s (2000) results and ours is that Witte found that 46 percent of MPCP mothers had some college education, while only 30 percent of MPCP parents and 26.3 percent of MPS parents in our sample are in the “some college education” category.
MPCP Longitudinal Educational Growth Study Baseline Report
18 February 2008
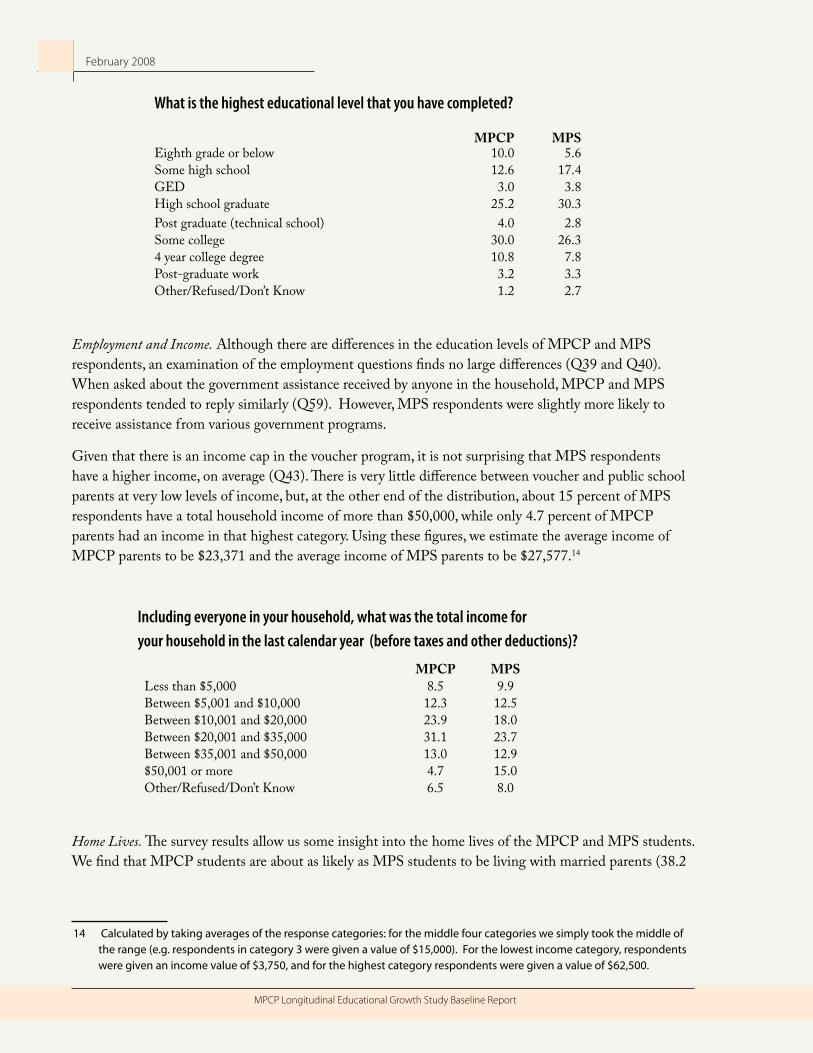
What is the highest educational level that you have completed?
MPCP MPSEighth grade or below 10.0 5.6Some high school 12.6 17.4GED 3.0 3.8High school graduate 25.2 30.3Post graduate (technical school) 4.0 2.8Some college 30.0 26.34 year college degree 10.8 7.8Post-graduate work 3.2 3.3Other/Refused/Don’t Know 1.2 2.7
Employment and Income. Although there are differences in the education levels of MPCP and MPS respondents, an examination of the employment questions finds no large differences (Q39 and Q40). When asked about the government assistance received by anyone in the household, MPCP and MPS respondents tended to reply similarly (Q59). However, MPS respondents were slightly more likely to receive assistance from various government programs.
Given that there is an income cap in the voucher program, it is not surprising that MPS respondents have a higher income, on average (Q43). There is very little difference between voucher and public school parents at very low levels of income, but, at the other end of the distribution, about 15 percent of MPS respondents have a total household income of more than $50,000, while only 4.7 percent of MPCP parents had an income in that highest category. Using these figures, we estimate the average income of MPCP parents to be $23,371 and the average income of MPS parents to be $27,577.14
Including everyone in your household, what was the total income for your household in the last calendar year (before taxes and other deductions)?
MPCP MPSLess than $5,000 8.5 9.9Between $5,001 and $10,000 12.3 12.5Between $10,001 and $20,000 23.9 18.0Between $20,001 and $35,000 31.1 23.7Between $35,001 and $50,000 13.0 12.9$50,001 or more 4.7 15.0Other/Refused/Don’t Know 6.5 8.0
Home Lives. The survey results allow us some insight into the home lives of the MPCP and MPS students. We find that MPCP students are about as likely as MPS students to be living with married parents (38.2
14 Calculated by taking averages of the response categories: for the middle four categories we simply took the middle of the range (e.g. respondents in category 3 were given a value of $15,000). For the lowest income category, respondents were given an income value of $3,750, and for the highest category respondents were given a value of $62,500.

MPCP Longitudinal Educational Growth Study Baseline Report
19February 2008
percent vs. 35.7 percent). This is an increase for both groups from 1990-1994 (23 percent for MPCP, 35 percent for low-income MPS families). According to our survey, about 57 percent of MPCP and MPS respondents said that the child’s other parent or guardian does not live in the household (Q42). There is almost no difference in family size for the two groups, while MPCP respondents are slightly more likely to own their own home (41 percent vs. 38 percent) (Q56). Given that there are more Hispanics in the MPCP sample than the MPS sample, it is unsurprising that more MPCP respondents said that they speak Spanish at home with their children (19.3 percent) than MPS respondents (11.3 percent).
Home Life 2006-2007MPCP MPS
Married 38.2 35.7Single parent household 57.9 57.4Spanish spoken in household 19.3 11.3Lived in Milwaukee more than 25 years 50.8 53.4Homeowners 41.0 38.0
Finally, there are few differences between and MPS and MPCP respondents when asked how long they have lived at their current address (Q55). When asked how long they have lived in Milwaukee, the majority of both MPS and MPCP parents answered more than 25 years (Q57).
Religion. Since 1996 religion and religious schools have played an integral role in the Choice program. We asked respondents several questions regarding the role of religion in their lives. In terms of religious preferences, there are more Catholics (30.0 percent vs. 20.5 percent) and Lutherans (9.1 percent vs 3.3 percent) in MPCP than MPS (Q52). Twelve percent of MPS parents said that they had no religious affiliation, while only 5.9 percent of MPCP parents answered similarly. When trying to understand why some parents participate in the choice program and some do not, the level of religiosity may be as important as parents’ religious preferences. MPCP respondents are more religious than MPS respondents (Q54). Almost two-thirds of the MPCP parents said that they attend religious services once a week or more, while only about 54 percent of MPS parents said the same.
What is your religious preference?
MPCP MPS7th Day Adventist 1.1 0.4Apostolic/Pentecostal 7.2 7.2Catholic 30.0 20.5Christian, Non-Denominational 16.8 20.1Church of God in Christ 2.5 2.2Islamic 2.9 1.0Jewish 1.1 0.1Lutheran 6.3 3.3Baptist 21.2 24.3None 5.9 12.0Other/Refused/Don’t Know 5.0 8.9

MPCP Longitudinal Educational Growth Study Baseline Report
20 February 2008
The Choice Environment
Tenure in Schools. Beyond demographic information, the survey results provide a deeper understanding of the education environment in Milwaukee. For example, there is great mobility in Milwaukee’s schools. About 39 percent of MPCP students and 37 percent of MPS students have been at their school for one year or less (Q2). On the other hand, 41.2 percent of MPCP students have been in their schools for three or more years. There are, however, clearly some highly mobile families in that 28.2 percent of MPS parents and 21.3 percent of MPCP parents said that their child has attended four or more schools (Q20).
How many years has your child been at this school?
MPCP MPSLess than 1 Year 10.9 3.71 Year 28.1 33.12 Years 13.5 20.73 Years 15.3 14.54 Years 9.8 7.8More than 5 Years 22.1 20.1Other/Refused/Don’t Know 0.3 0.1
Choosing Schools. The many and varied school choice options for parents to consider make Milwaukee an interesting case study. Less than one half (45.1 percent) of MPS students attend their residentially assigned school (Q4). Before choosing a school, MPCP parents visited or contacted about one public school and one private school, whereas MPS parents contacted or visited 1.6 public schools but only .3 private schools, on average (Q18).
Is this your neighborhood assigned or residentially assigned school?MPS
Yes 45.1No 52.8Other/Refused/Don’t Know 2.1
Parental information levels are an important component of school choice programs. About 38 percent of MPCP parents learned about the voucher program from friends or relatives (Q7, first response). In the same way, over 33 percent responded that they heard of the program from their school. The importance of social networks is also evident in choosing a specific school. When asked how they initially heard of their child’s school, the first response of 54 percent of MPCP parents and 42 percent of MPS parents was from friends or relatives (Q15). The major difference between the groups regarding how they heard about their current schools is that MPCP parents received information from their church (9.4 percent) or from other private schools (4.5 percent) while MPS parents did not.

MPCP Longitudinal Educational Growth Study Baseline Report
21February 2008
On the MPS side, roughly 60 percent of parents had heard of the Milwaukee Parental Choice Program but only 13.8 percent of them had applied for a voucher at one point (Q8, Q9). Of those that applied, roughly 14 percent had children that previously participated in the MPCP, while about 15 percent were ineligible for the program (Q10). We also asked those who did not apply to the MPCP why they did not apply (Q11). The majority blamed a lack of information: 43.3 percent said they did not know the MPCP existed, 18.6 percent said they did not know enough about the program, and 1 percent said they did not know enough about individual Choice schools. Another one-fifth of MPS respondents said that they did not apply to the MPCP because they were satisfied with their current school.
How did you learn about the Parental Choice Program, also known as the voucher program?
MPCP 1st Response 2nd ResponseFriends or Relatives 38.4 24.4My Child’s School 33.5 32.0Other Private Schools 5.2 10.5Newspaper/Magazine 4.4 8.1Church 4.0 4.7Television or Radio 3.6 12.2Community Center 1.2 1.7Internet 0.7 0.6Other 8.5 5.8Refused/Don’t Know 0.5 0.0
How did you initially hear about your child’s current school?
MPCP MPSFriends or Relatives 54.0 41.6Church 9.4 0.3Other Private Schools 4.5 ----Flyers/Brochures 3.7 4.6Call From School 2.8 3.9Community Center 2.2 2.2Community Events 1.7 0.5Newspaper/Magazine 1.3 0.9Home Visit 1.0 0.2Television or Radio 0.9 0.8Internet 0.6 0.8Other 17.3 43.7Refused/Don’t Know 0.6 1.1
Note: Parents asked to choose all that apply. First response.

MPCP Longitudinal Educational Growth Study Baseline Report
22 February 2008
Charter schools play a prominent role in Milwaukee’s education environment. MPS parents (72.0 percent) were more likely than MPCP parents (65.1 percent) to have heard of these public schools of choice (Q12). Of those who have heard of charter schools, roughly one-fifth of both MPCP and MPS parents have applied to a charter school (Q13). About 7 percent of MPCP parents and 10 percent of MPS respondents said that their child has attended a charter school.
What do parents want in their children’s schools? The survey results indicate that MPCP parents and MPS parents have similar desires (Q16). The educational quality of the school is by far the most important characteristic, while student safety and teacher quality are also quite important (Q17). The largest difference between MPCP and MPS parents concerns the importance of religious instruction. About 9 percent of MPCP parents considered religious instruction their most important criterion, while only 1.7 percent of MPS parents did. In a school choice environment with many possible options, roughly three-fourths of both MPCP and MPS parents said that their child’s school was their first choice (Q3).
Which school characteristic is the most important?
MPCP MPSEducational quality of the school 53.2 48.5Teacher quality 11.9 16.4Safety in the school 11.3 16.6Religious instruction 8.6 1.7Discipline in the school 4.3 3.6School leadership 2.7 3.0Financial considerations 1.6 0.4Class size 1.6 2.6Location of the school 1.3 1.9Extracurricular activities (sports, etc.) 1.3 1.0Racial diversity 0.9 1.5School facilities (library, gym, textbooks) 0.5 0.6Special programs offered by the school 0.3 1.5Other children in the family attending the same school 0.2 0.2Other/Refused/Don’t Know 0.3 0.5
Was this school your first choice for your child?
MPCP MPSYes 77.9 74.1No 21.7 23.9Other/Refused/Don’t Know 0.4 2.0

MPCP Longitudinal Educational Growth Study Baseline Report
23February 2008
Parental Involvement, Expectations, and Importance of Education
The survey included several measures of parental involvement. MPCP parents were more involved in school activities than MPS parents, including volunteering at their child’s school, attending parent/teacher conferences, taking part in the activities of a parent/teacher organization, and belonging to other education organizations (Q26). In terms of contact with schools (Q25), results were mixed between the two groups. Both groups were contacted most often concerning their child’s academic performance. MPCP parents were more likely to be contacted for volunteering or fundraising.
Did you (or someone in your household) do any of the following at your child’s school this past year?
MPCP MPS
Volunteer at your child’s school 54.7 37.9
Attend parent/teacher conferences 94.5 91.8
Take part in activities of a parent/teacher organization 47.4 32.1
Belong to other organizations dealing with school matters 26.7 18.5
Note: Cells report percentages of respondents answering “yes.”
We also asked parents how many times in a normal week they participate in activities that are educationally beneficial to their children. On this measure, MPS respondents are more likely than MPCP respondents to participate in these types of behaviors (Q27). About 74 percent of MPS parents said that they help their child with their homework three or more times a week, while 62 percent of MPCP parents do the same. Likewise, MPS parents were more active than MPCP parents in reading with their children, working on math, helping with writing and watching educational television programs. One might think that MPS parents are more active than MPCP parents because MPS students are assigned more homework. We find no evidence of this, as MPCP parents report that their children spent more time on homework than MPS students (Q29).
Weekly Participation in Child’s School-Related Activities*
MPCP MPS
Help your child with homework 62.0 73.7Read with or to your child 45.9 55.2Work on arithmetic or math 46.1 59.3Work on penmanship or writing 30.8 44.2Watch educational programs on TV with your child 40.2 45.7
*Note: Percent answering three or more times per week.

MPCP Longitudinal Educational Growth Study Baseline Report
24 February 2008
When asked about the educational expectations they have for their child, MPCP parents were more positive than their MPS counterparts. Over 54 percent of MPCP parents expect their child to graduate from college or go to graduate school, whereas only 46.7 percent of MPS parents expect the same (Q33). Likewise, 16.2 percent of MPS parents believe their child will achieve a high school diploma or less, as opposed to 8 percent of MPCP parents. In addition, MPCP parents believed their school had higher expectations for their children. Roughly 47 percent of Choice parents strongly agreed with the statement that their child’s school has high expectations for academic achievement compared to 36.1 percent of MPS respondents (Q31).
How far do you expect your child to go in school? MPCP MPSFinished some high school 0.3 1.7Graduated from high school 7.6 14.5Go to vocational school after high school 1.3 1.9Go to college 35.7 33.5Graduate from college 29.7 33.7Go to graduate school (law, medicine, masters degree) 24.5 13.0Other/Refused/Don’t Know 0.9 1.7
In order to measure how important education is to parents, we asked them to compare the importance of education to other goals (Q34). For example, about three-fourths of both MPCP and MPS parents said that education is more important than having a good job. Examining the survey results for these questions, one finds few differences between MPCP and MPS respondents. Overall, MPCP parents are slightly more likely to say that education is just as important as these other goals. In another attempt to determine the importance of education to parents, we asked them if they have ever moved so that their children may attend a better school. We found that this is a relatively rare occurrence, as only 15.7 percent of MPCP respondents and 14.1 percent of MPS respondents said that they moved for this reason (Q30).
How would you rate the importance of education in family compared to other goals?
Education is more important Education is just as important MPCP MPS MPCP MPSHaving a good job 75.1 77.0 23.8 21.8Having enough money in the family 59.0 61.9 37.5 33.8Maintaining religious observances/faith 31.7 33.5 56.8 52.4Maintaining family ethnic traditions 35.5 36.9 57.6 53.8Having a healthy family 20.4 18.4 62.7 61.8Having a good place to live 30.2 25.1 63.0 64.8

MPCP Longitudinal Educational Growth Study Baseline Report
25February 2008
Parental Reports of Student Success
The survey results provide us with the opportunity to learn more about our MPCP and MPS students beyond what we know from administrative data. Asked what was the average grade their child received in school this past year, three-fourths of MPCP parents and 64 percent of MPS parents said their child generally received As or Bs (Q32). According to the results from this question, it appears as if MPCP students in our sample received slightly higher grades than their MPS matches (MPCP GPA: 3.0 vs. MPS GPA: 2.8).
What is the average grade your child received in school this past year?
MPCP MPSA 30.4 22.5B 45.1 41.8C 19.3 26.6D 2.3 4.4F 0.9 1.6Other/Refused/Don’t Know 2.0 3.1GPA 3.0 2.8
A relatively small percentage of MPCP students (2.7 percent) and MPS students (4.2 percent) in our sample have physical handicaps (Q46). Those parents with handicapped children were also asked how well their child’s school meets their child’s needs. MPS parents seemed more satisfied, as 51.7 percent of MPS parents said that the facilities met their child’s needs very well, while only 44 percent of MPCP parents responded similarly (Q47).
While there was only a small difference in regard to physical handicaps, there is a larger difference between MPS and MPCP students with regards to the prevalence of learning disabilities (Q48). The percentage of respondents who said that their child has a learning disability is twice as large in the MPS sample (18.2 percent) than in the MPCP sample (8.7). Discussions with our Milwaukee Principal Advisory Panel indicated that MPCP school personnel are less likely to identify slow learners specifically as “learning disabled” than are MPS school personnel. It is possible that some or even all of this large difference in the reported rates of learning disabled students across the two groups is due to this difference in labeling practices and not necessarily because MPCP schools are serving fewer learning disabled students. There is very little difference in opinions between public and choice school parents regarding how well the school meets their children’s needs regarding learning disabilities (Q49).
According to the parent survey, MPS students were more likely to miss school and have been suspended than MPCP students. About 29 percent of MPS respondents said that their child missed at least 3 days of school in the last month as opposed to only 17.4 percent of MPCP parents (Q50). During the past year, 33.5 percent of the children of the MPS respondents were suspended for disciplinary reasons (Q51). Less than 20 percent of the MPCP respondents’ children were suspended in that same time frame.
MPCP Longitudinal Educational Growth Study Baseline Report
26 February 2008
Parental Reports of School Satisfaction
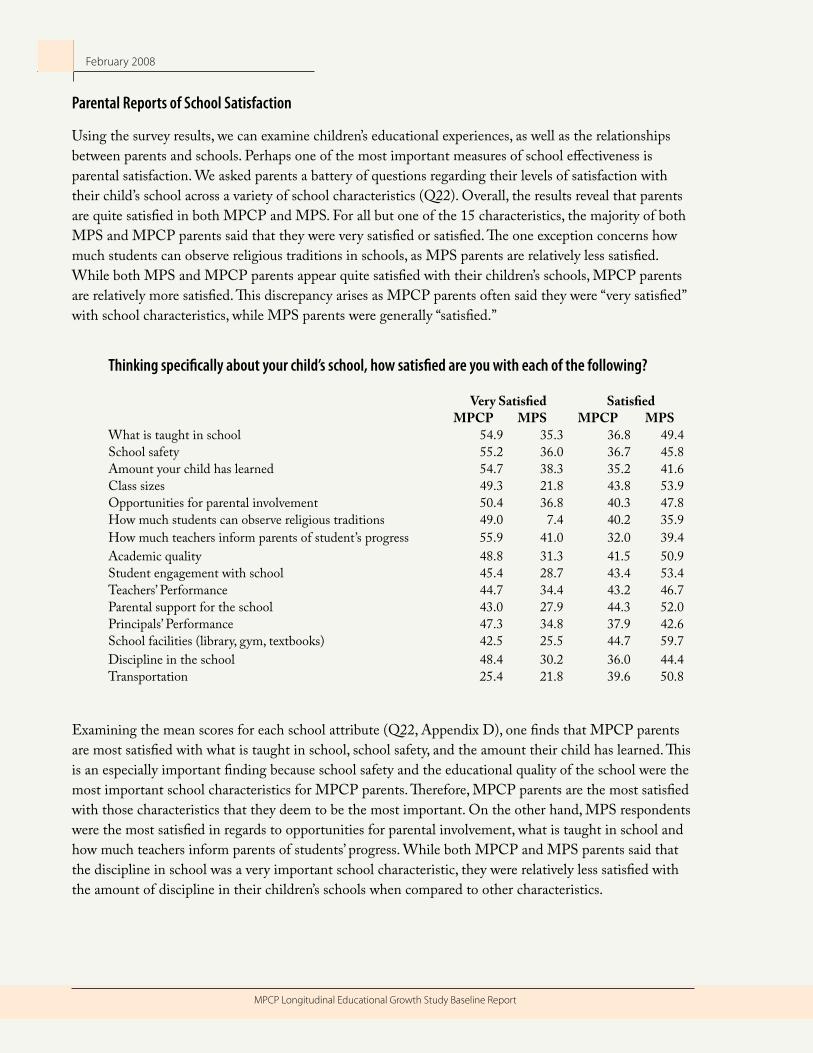
Using the survey results, we can examine children’s educational experiences, as well as the relationships between parents and schools. Perhaps one of the most important measures of school effectiveness is parental satisfaction. We asked parents a battery of questions regarding their levels of satisfaction with their child’s school across a variety of school characteristics (Q22). Overall, the results reveal that parents are quite satisfied in both MPCP and MPS. For all but one of the 15 characteristics, the majority of both MPS and MPCP parents said that they were very satisfied or satisfied. The one exception concerns how much students can observe religious traditions in schools, as MPS parents are relatively less satisfied. While both MPS and MPCP parents appear quite satisfied with their children’s schools, MPCP parents are relatively more satisfied. This discrepancy arises as MPCP parents often said they were “very satisfied” with school characteristics, while MPS parents were generally “satisfied.”
Thinking specifically about your child’s school, how satisfied are you with each of the following?
Very Satisfied Satisfied MPCP MPS MPCP MPSWhat is taught in school 54.9 35.3 36.8 49.4School safety 55.2 36.0 36.7 45.8Amount your child has learned 54.7 38.3 35.2 41.6Class sizes 49.3 21.8 43.8 53.9Opportunities for parental involvement 50.4 36.8 40.3 47.8How much students can observe religious traditions 49.0 7.4 40.2 35.9How much teachers inform parents of student’s progress 55.9 41.0 32.0 39.4Academic quality 48.8 31.3 41.5 50.9Student engagement with school 45.4 28.7 43.4 53.4Teachers’ Performance 44.7 34.4 43.2 46.7Parental support for the school 43.0 27.9 44.3 52.0Principals’ Performance 47.3 34.8 37.9 42.6School facilities (library, gym, textbooks) 42.5 25.5 44.7 59.7Discipline in the school 48.4 30.2 36.0 44.4Transportation 25.4 21.8 39.6 50.8
Examining the mean scores for each school attribute (Q22, Appendix D), one finds that MPCP parents are most satisfied with what is taught in school, school safety, and the amount their child has learned. This is an especially important finding because school safety and the educational quality of the school were the most important school characteristics for MPCP parents. Therefore, MPCP parents are the most satisfied with those characteristics that they deem to be the most important. On the other hand, MPS respondents were the most satisfied in regards to opportunities for parental involvement, what is taught in school and how much teachers inform parents of students’ progress. While both MPCP and MPS parents said that the discipline in school was a very important school characteristic, they were relatively less satisfied with the amount of discipline in their children’s schools when compared to other characteristics.
MPCP Longitudinal Educational Growth Study Baseline Report
27February 2008
The means indicate that the second largest discrepancy concerns class sizes. About 49 percent of MPCP parents were very satisfied with the class sizes in their child’s school, but only 21.8 percent of MPS parents were very satisfied. Transportation is the one characteristic for which MPS parents were more satisfied than their MPCP counterparts.
Another approach to measuring school satisfaction is to allow parents to assess problems that schools face in Milwaukee (Q24). Across the six dimensions we examined, MPS parents were more likely to say that these problems were more serious than were MPCP respondents. For example, 16.6 percent of MPS parents said that weapons in school were a very serious or somewhat serious problem in their child’s school as opposed to 6.3 percent of MPCP parents. Likewise, about three-quarters of MPCP parents said that fighting is not a serious problem, while only 53.2 percent of MPS respondents answered similarly. This finding that the parents of students in Choice schools view their child’s educational environment as less dangerous than do the parents of students in public schools has been uncovered in every previous voucher study that asked such questions (e.g. Wolf et al, 2007).
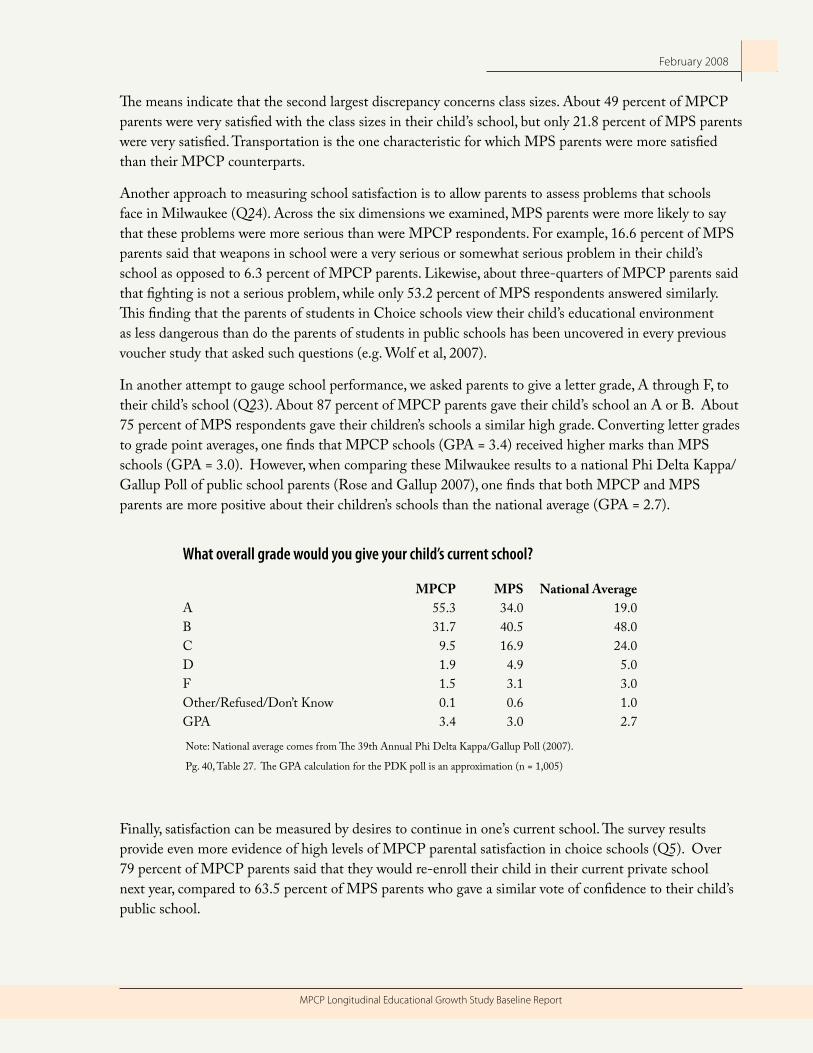
In another attempt to gauge school performance, we asked parents to give a letter grade, A through F, to their child’s school (Q23). About 87 percent of MPCP parents gave their child’s school an A or B. About 75 percent of MPS respondents gave their children’s schools a similar high grade. Converting letter grades to grade point averages, one finds that MPCP schools (GPA = 3.4) received higher marks than MPS schools (GPA = 3.0). However, when comparing these Milwaukee results to a national Phi Delta Kappa/Gallup Poll of public school parents (Rose and Gallup 2007), one finds that both MPCP and MPS parents are more positive about their children’s schools than the national average (GPA = 2.7).
What overall grade would you give your child’s current school?
MPCP MPS National AverageA 55.3 34.0 19.0B 31.7 40.5 48.0C 9.5 16.9 24.0D 1.9 4.9 5.0F 1.5 3.1 3.0Other/Refused/Don’t Know 0.1 0.6 1.0GPA 3.4 3.0 2.7
Note: National average comes from The 39th Annual Phi Delta Kappa/Gallup Poll (2007).
Pg. 40, Table 27. The GPA calculation for the PDK poll is an approximation (n = 1,005)
Finally, satisfaction can be measured by desires to continue in one’s current school. The survey results provide even more evidence of high levels of MPCP parental satisfaction in choice schools (Q5). Over 79 percent of MPCP parents said that they would re-enroll their child in their current private school next year, compared to 63.5 percent of MPS parents who gave a similar vote of confidence to their child’s public school.

MPCP Longitudinal Educational Growth Study Baseline Report
28 February 2008
Do you plan to enroll your child in the same school next year?
MPCP MPSYes 79.1 63.5No 20.3 36.2Other/Refused/Don’t Know 0.6 0.3
Student Survey Results
The complete results of the student surveys are available in Appendix E. Although similar, the question wording for the survey provided to students in grades four through eight was different than the ninth grade questionnaire. Therefore, the results we present are disaggregated. The results include the answers from 1415 elementary and middle school MPCP students (1299 paper surveys, 116 telephone survey) and 660 MPCP 9th grade students (560 paper surveys, 100 telephone surveys). The MPS results for the phone survey were provided by 795 students in grades four to eight and 318 ninth graders.
Student’s Views of the General School Environment
Overall, both MPS and MPCP students gave positive responses regarding the school environment, yet MPCP students were more positive than were MPS students. Compared to MPS students, MPCP elementary and middle school students had higher mean levels of agreement on 29 of the 35 questions, although some of the differences are quite small. Similarly, MPCP ninth graders were more positive about their schools than MPS students on 31 of the 35 statements. Examining general questions regarding the school environment, the majority of MPCP elementary and middle school students strongly agreed that they are expected to do their best all the time at their school, and that they have the books and supplies they need to do well. These two questions also received high levels of mean agreement from comparable MPS students. Over 46 percent of MPCP fourth through eighth graders said they strongly agree with the statement that their school is a good place for learning, while only 28 percent of MPS students strongly agreed (Q5).
The largest difference in mean levels of agreement for elementary and middle school students concerns the statement, “I have choices about what I learn” (Q20). This statement received the lowest mean agreement score of all 35 statements for the MPCP sample (2.7), while the mean score for MPS was 3.0.
Grades 4 to 8: Do you agree with this statement?
Strongly Agree Agree MPCP MPS MPCP MPSAt school I am expected to do my best all the time. 61.9 46.3 30.9 51.5The adults at my school care about the students. 48.5 35.7 35.7 56.7My school building is a good place for learning. 46.7 27.7 40.8 64.4I have choices about what I learn. 19.4 19.6 28.7 56.5

MPCP Longitudinal Educational Growth Study Baseline Report
29February 2008
Among the 9th grade general question results, both MPS and MPCP students have high mean agreement scores for the same two statements. The statement, “My school has high academic expectations of me,” received a mean score of 3.4 for MPCP students and 3.3 for MPS students, and the statement, “I have the books and supplies I need to do well in school,” received a mean score of 3.4 for MPCP 9th graders and 3.3 for MPS. The MPCP and MPS 9th grade respondents were similar in their dissatisfaction regarding other aspects of their school environment. Only 8 percent of MPCP 9th grade students and 7 percent of their MPS counterparts strongly agreed with the statement that students at their school focus on learning (Q20). Over a quarter of both groups disagreed or strongly disagreed with the statement that students and adults respect each other at their school (Q19).
Grade 9: Do you agree with this statement?
Strongly Agree Agree MPCP MPS MPCP MPSMy school has high academic expectations of me. 45.8 35.9 41.8 53.1I have the books and supplies I need to do well in school. 43.5 37.1 49.1 59.4My school building has a positive atmosphere for learning. 33.3 18.9 52.4 65.1I usually look forward to coming to school. 21.6 20.8 49.9 65.1The students and adults in my school respect each other. 19.1 13.5 43.0 54.4Students at my school focus on learning. 8.3 6.6 51.7 53.1
Many of the largest mean differences between MPCP and MPS 9th graders concern the general school atmosphere. MPCP students were more positive than their MPS counterparts toward the statement, “My school building has a positive atmosphere for learning” (Q7), as well as the statement, “My school has a friendly and welcoming atmosphere” (Q10). MPS high school students were more positive than MPCP ones when considering two statements: “I usually look forward to coming to school” (Q17), and “I am pleased with my academic progress” (Q18).
Safety, Discipline, and Diversity
Beyond general questions regarding the school environment, the student survey included three more categories of questions: safety/discipline, diversity, and new teachers. Across these fifteen questions, students gave relatively positive responses. Over 60 percent of MPCP middle and elementary students said they strongly agreed with the statements that their school promotes a drug-free environment (Q21) and that adults make sure that they follow the rules at their school (Q22). Although similar MPS students provided mostly positive responses to these statements, the difference in mean agreement for Q21 (mean difference: .2) and Q22 (mean difference: .2) were relatively large. One of the least positive responses for MPCP and MPS fourth through eighth graders across these three categories was for the statement, “My school building is neat and clean” (Q29).
Both MPS and MPCP students gave high marks to their schools in terms of their support for diversity and new teachers. Almost 80 percent of MPCP students and over 92 percent of MPS students strongly agreed or agreed with the statement that adults at their school help students of different races to get along (Q31). Forty-nine percent of MPCP middle and elementary students and almost 30 percent of MPS students strongly agreed that their school teaches them to value and respect others who are different (Q30).

MPCP Longitudinal Educational Growth Study Baseline Report
30 February 2008
Grades 4 to 8: Do you agree with this statement?
Strongly Agree Agree MPCP MPS MPCP MPS
My school building is neat and clean. 31.6 19.9 42.0 60.5The adults at my school make sure I follow the rules. 60.3 37.5 32.8 60.0I understand my school’s rules about behavior. 56.2 35.0 35.4 57.7The adults at my school help children of different races get along with each other.
43.5 34.5 35.6 57.9
My school teaches me to value and respect others who are different from me
49.1 29.6 39.8 65.8
The 9th grade results for the safety/discipline, diversity and new teachers categories are similar to the elementary and middle school results, as both MPS and MPCP students gave generally positive responses, though the MPCP students were more positive. MPCP students had an almost 20 percentage point advantage (51.4 vs. 31.5) in the strongly agree category for the statement, “My school provides a drug-free environment” (Q21). Similarly, 42.7 percent of MPCP students compared to 28.9 percent of MPS students strongly agreed that their schools “make sure that classrooms are safe and orderly.” These results fit well with MPCP parental differences on satisfaction with discipline noted earlier.
Grade 9: Do you agree with this statement?
Strongly Agree Agree MPCP MPS MPCP MPSMy school promotes a drug-free environment. 51.4 31.5 37.1 59.1My school makes sure that classrooms are safe and orderly. 42.7 28.9 47.1 59.1My school treats all students with respect regardless of their race or ethnic background.
38.5 35.5 43.3 52.8
Survey Summaries
Our main goals and findings for the parent survey were fourfold.
1. Who Participates in the Choice Program?
MPCP parents had lower household incomes than MPS parents.•
MPCP parents had slightly more education.•
Family structure and sizes were very similar between MPS and MPCP families. •
MPCP parents were significantly more religious.•

MPCP Longitudinal Educational Growth Study Baseline Report
31February 2008
2. Understanding the Choice Environment
With the exception of information from churches and private schools, sources of information on •schools were similar between MPCP and MPS parents.
There were also few differences in qualities parents sought in schools. •
Over 70 percent of parents in both groups responded that they received their first choice of •schools.
3. Parental Involvement, Expectations, and Importance of Education
MPCP parents were more likely to be involved in school activities than MPS parents.•
However, MPS parents were more likely than MPCP parents to be involved with their child at •home.
MPCP parents have higher expectation in terms of student educational attainment. •
However, there was no difference on the importance parents placed on education. •
4. Parental Reports of Student Success
MPCP students generally received higher grades in school than MPS students.•
MPS students were more likely to have missed school and to have been suspended than MPCP •students.
5. Parental Satisfaction with Their Current Schools
Overall levels of satisfaction are very high for both groups and on “grades for their school” higher •than the national average.
On a number of measures MPCP parents are somewhat more satisfied than MPS parents. •
Our main findings from the school climate survey administered to students were twofold.
Overall, for both 41. th through 8th graders and 9th graders (studied separately), attitudes were very positive in both MPS and MPCP schools.
In general on all the dimensions there were small differences between MPCP and MPS student 2. attitudes, with these differences usually favoring MPCP schools.

MPCP Longitudinal Educational Growth Study Baseline Report
32 February 2008
SUMMARY AND CONCLUSIONS
This report discusses the initial stage of the Longitudinal Educational Growth Study (LEGS) of the Milwaukee Parental Choice Program (MPCP). The results presented here are the products of a single “snapshot” in time. This report can describe the educational reality of MPCP and MPS parents and students, but it cannot make reliable claims regarding the extent to which the Choice program itself has caused any of these conditions. Only when longitudinal growth data have been collected can such programmatic claims be made with any confidence. This baseline report does, however, provide several indications of both similarities and differences currently existing between MPCP and public school students. Among these are:
WKCE math and reading scores for MPCP students in grades 3-5 are slightly lower •
at baseline than those of a random sample of MPS students. These differences may be the result of a variety of factors unexplored in this baseline report, and the subject of examination in future years of the LEGS.
WKCE math and reading scores for MPCP students in grades 6-8 do not differ from the •
scores of the MPS students.
Benchmark Test results for 9• th graders are also similar between the two groups.
MPCP and MPS parents and students are generally satisfied with their respective schools. •
Overall, MPCP parents and students were more positive than their MPS counterparts.
MPCP parents have higher levels of education and attend religious services more •
regularly than MPS parents. MPS respondents have higher incomes, on average.
Later reports will expand upon the results presented here at baseline. Growth in student achievement, the rate of student entry, exit, and potential re-entry into the MPCP program, and the effect of these choices on education outcomes are all subjects of future stages of the Longitudinal Educational Growth Study.

MPCP Longitudinal Educational Growth Study Baseline Report
33February 2008
REFERENCES
Aaronson, Daniel. 1998. “Using Sibling Data to Estimate the Impact of Neighborhoods of Children’s Educational Outcomes.” Journal of Human Resources. 33(4): 915-946.
Cullen, Julie Berry, Brian A. Jacob and Steven D. Leavitt. 2005. “The Impact of School Choice on Student Outcomes: An Analysis of the Chicago Public Schools.” Journal of Public Economics. 89(5-6): 729-760.
Figlio, David N. and Cecelia Elena Rouse. 2006. “Do Accountability and Voucher Threats Improve Low-Performing Schools?” Journal of Public Economics. 90(1-2): 239-255.
Greene, Jay P., Paul E. Peterson, and Jiangtao Du. 1999. “Effectiveness of School Choice: The Milwaukee Experiment.” Education and Urban Society, 31, January, pp. 190-213.
Greene, Jay P., and Marcus A. Winters. 2003. “When Schools Compete: The Effects of Vouchers on Florida Public School Achievement.” (New York: Manhattan Institute Education Working Paper, No. 2, August).
Howell, William G., Patrick J. Wolf, David E. Campbell, and Paul E. Peterson. 2002. “School Vouchers and Academic Performance: Results from Three Randomized Field Trials.” Journal of Policy Analysis and Management. 21(2), pp. 191-217.
Leventhal, Tama and Jeanne Brooks-Gunn. 2004. “A Randomized Study of Neighborhood Effects on Low-Income Children’s Educational Outcomes.” Developmental Psychology. 40(4): 488-507.
Ludwig, Jens, Helen Ladd, and Greg J. Duncan. 2001.” The Effects of Urban Poverty on Educational Outcomes: Evidence from a Randomized Experiment.” In Urban Poverty and Educational Outcomes. Brookings-Wharton Papers on Urban Affairs. Edited by William Gale and Janet Rothenberg Pack. Washington, DC: Brookings Institution Press. pp.147-201.
Metcalf, Kim K., Stephen D. West, Natalie Legan, Kelli Paul and William J. Boone. 2003. “Evaluation of the Cleveland Scholarship and Tutoring Program.” Indiana Center for Evaluation Technical Report.
Rose, Lowell C., and Alec M. Gallup. 2007. “The 39th Annual Phi Delta Kappa/Gallup Poll Of the Public’s Attitudes Toward the Public Schools.” Phi Delta Kappan. 89(1): 33-45.

MPCP Longitudinal Educational Growth Study Baseline Report
34 February 2008
Rosenbaum, Paul R. and Donald B. Rubin. 1983. “The Central Role of the Propensity Score in Observational Studies for Causal Effects.” Biometrika. 70(1): 41-55.
Rouse, Cecilia Elena. 1998. “Private School Vouchers and Student Achievement: An Evaluation of the Milwaukee Parental Choice Program.” The Quarterly Journal of Eco-nomics., 113(2): 553–602.
Sampson, Robert J., Jeffrey D. Morenoff, and Thomas Gannon-Rowley. 2002. “Assessing `Neighborhood Effects’: Social Processes and New Directions in Research.” Annual Review of Sociology. 28: 443-478.
West, Martin and Paul Peterson. 2005. “The Efficacy of Choice Threats Within School Accountability Systems,” Harvard Program in Education Policy and Governance Working Paper 05-01, http://ww.ksg.harvard.edu/pepg/PDF/Papers/West_Peterson_Choice_Threats.pdf
Witte, John F. 2000. The Market Approach to Education. Princeton, NJ: Princeton University Press.
Wolf, Patrick J., Babette Guttman, Michael Puma, Lou Rizzo, Nada Eissa and Marcia Silverberg. 2007. Evaluation of the D.C. Opportunity Scholarship Program: Impacts After One Year. Institute for Education Sciences, National Center for Education Evaluation and Regional Assistance: U.S. Department of Education. Available at http://ies.ed.gov/ncee/pubs/20074009/

MPCP Longitudinal Educational Growth Study Baseline Report
35February 2008
APPENDIX A
Description of the Study Mandate
The legal responsibility of the School Choice Demonstration Project under Act 125 is limited to collecting standardized data from the private schools and turning it over to the Legislative Audit Bureau each year beginning in 2007. The standardized test scores were collected from participating schools throughout the 2006-07 academic year, organized into a single database, and delivered to the Legislative Audit Bureau on December 28, 2007. Those data are discussed in the MPCP Annual School Testing Summary Report.
This particular report is focused on fulfilling the SCDP’s vision of conducting a longitudinal evaluation of a representative panel of choice students closely matched to a panel of MPS students in order to estimate the actual effects of the MPCP on important student and family outcomes. This idea of a rigorous longitudinal evaluation of school choice in Milwaukee has been endorsed by the SCDP’s Research Advisory Board and is being supported by the six foundations that have thus far agreed to underwrite the School Choice Demonstration Project’s Milwaukee study.
Although this project is being accomplished without state funds we are grateful to the state of Wisconsin for providing legislation in the form of Act 125 to make possible this important research project. We also thank the leadership and staff of the Wisconsin Department of Public Instruction and the Milwaukee Public School District for their critical assistance with this study. Finally, we acknowledge the extensive efforts to cooperate with this evaluation undertaken by the personnel at the various private schools that participate in the MPCP. We will continue to work closely with these entities, the legislature, the Legislative Audit Bureau, and other relevant state authorities to carry out the most complete, accurate, and informative study possible within the confines of the data and research circumstances that we encounter.

MPCP Longitudinal Educational Growth Study Baseline Report
36 February 2008
APPENDIX B
Constructing the Sample for Study
To identify a representative sample of students to study over the 5-year duration of the LEGS Achievement and LEGS Attainment studies, we first selected a random sample of participants in the Milwaukee Parental Choice Program (MPCP) from a September 15, 2006 list of applied and accepted students. To obtain proportions of students for the LEGS Achievement study in grades 3-8 that were representative of the MPCP population, we stratified the selection by the number of students in each grade in the program. We then drew random samples for each grade, for a total of 2,184 students. For the LEGS Attainment study we selected all of those in 9th grade (911 students). The samples combined for a total of 3,095 students comprising 18 percent of the population of all MPCP participants in grades 3-9.
We then examined the audited list of voucher recipients on the 3rd Friday count (September 15, 2006) from the Department of Public Instruction.15 Two hundred twenty-seven students were not on this list or had duplicate records and were dropped from the study.16 We informed each MPCP school as to which of their students had been selected. The parents or guardian of each student were informed via letter from their child’s school of their child’s selection, and were given the opportunity to decline participation. Of those students in the sample, 134 (4.7 percent) opted out of the study. An additional 7 students were not included in the study because their grade levels were no longer within grades 3 through 8. For those students who remained after these adjustments, we obtained information on students’ race, gender, and other variables through school records. To the extent possible, for those students missing administrative data, we added data with student survey data administered during the baseline testing session. The final analytic sample was comprised of 2,727 students in the MPCP program. See Appendix C for additional information regarding MPCP sample selection.
The next step in the sample construction was the selection of students in Milwaukee Public Schools (MPS) who would constitute valid comparisons to the MPCP participants. Without such a process, we would not be certain that differences in student achievement growth and other outcomes of interest between MPCP and MPS would be attributable to differences in student baseline characteristics, or differences that influence both the decision to leave or remain in public schools and the outcomes of interest. To obtain a valid comparison group, we designed a multi-step procedure to incorporate students’
15 The 3rd Friday in September is used in Wisconsin as the official enrollment count for all public schools. State aid and other formulas and aid programs depend on this count.
16 The 3rd Friday list included only students who applied, were accepted and were enrolled on that date in the private schools. The students who were dropped were on the original September 1 list, but were not in the schools on September 15th, the third Friday of the month. That is very common in Milwaukee where students often apply to multiple schools under a number of choice programs (e.g. charter schools, magnet schools, and suburban schools).

MPCP Longitudinal Educational Growth Study Baseline Report
37February 2008
neighborhood information, prior achievement levels, and student demographics into the selection of our MPS sample.
The basic sample design was to first match MPCP students to MPS students on their neighborhood, then on baseline test scores, and then to use propensity scores for being in MPCP to order the MPS students already matched on neighborhood and/or baseline test. The matching was done without replacement, meaning that each MPS student could only be matched to one MPCP student. The first step in this procedure was the inclusion of the census tract corresponding to the home address reported for each MPCP and MPS student. Census tracts are geographic locations given unique identification numbers by the United States Census Bureau.17 In this step, potential MPS matches for a given MPCP student were limited to those in the MPCP student’s census tract. In our MPCP sample, there were students from 213 unique tracts in Milwaukee.
We next narrowed potential MPS matches within each tract for grade 3-8 students with similar scores on the Wisconsin Knowledge and Concepts Examinations (WKCE). Similarly, we matched 9th graders based on the Benchmark Exam scores (see below). To define which scores were “similar” we divided the distribution of MPCP scale scores (the mean of math and reading tests) by grade, and then further into twenty test bands, each corresponding to every 5th percentile of the grade-specific distribution of scores. In the first band were students whose scores fell between the 1st and the 5th percentile. In the twentieth band were students whose scores fell on or exceeded the 95th percentiles. We restricted test score matches for each MPCP student to those MPS students whose raw test scores fell within the same test band defined by the MPCP distribution.
Finally, we narrowed potential matches further by estimating the influence of students’ race, gender, ELL status and baseline test score (the mean of the math and reading tests) on the likelihood that any student would select private education (MPCP=1). In this step, we estimated a propensity score, choice, using a logit model:
for each student based on these characteristics, X, with models estimated separately by grade. Within census tracts and test bands, MPS students were matched to MPCP students by selecting the MPS student with the closest raw value of choice to the MPCP student. In our initial data collection at baseline, we were unable to gather complete data for all students in our sample, although the data are complete for the vast majority of students, as Table B-1 indicates. For MPCP students whose propensity scores we were unable to estimate due to missing data on race, gender, or ELL we simply drew an MPS student at random from within census tract and test band matches. If a missing test score caused the missing propensity score, we drew the MPS match at random from within the set of census tract-matched
17 Census tract was selected as the critical neighborhood proxy rather than a distance variable on advice of the Milwaukee Public Housing Authority, and after investigation that confirmed that the census tracts in Milwaukee were carefully drawn to represent neighborhood demarcations.

MPCP Longitudinal Educational Growth Study Baseline Report
38 February 2008
students. All selections were without replacement. Table B-2 summarizes the success of these matches. As the table indicates, nearly all (99 percent) of students were matched on census tract, while only 56 percent of students were subsequently matched on test band.
After creating the matches, we verified with the 3rd Friday list that each MPS student was in the same grade as their MPCP match. For those who were not in the same grade, the matching procedure was repeated until a correct match was made. After the matching process was completed we received 211 additional MPCP test scores that were previously coded as missing, as well as 642 additional MPS tracts that were previously missing. We updated the tract information on the 642 MPS students and repeated the matching algorithm for the 211 MPCP students. Recently, we received an additional 158 MPCP test scores. Because of their late arrival, we were unable to include test scores in the matching algorithm for these students. Instead, we included for these students the original MPS matches made through random selection within census tract. As discussed in the text, Tables 1-2 and Figures 1-3 show comparisons of our matched students, a random sample of MPS students, and our MPCP sample.
Table B-1 : Complete MPCP Data
Reading
3-8
Math
3-8
Reading
9
Math
9
Race Gender ELL Free/Reduced Lunch
N
(% complete)
1,640
(85.2)
1,636
(84.9)
583
(72.8)
583
(72.8)
2,464
(90.4)
2,470
(90.6)
2,314
(84.9)
2,114
(77.5)
Reading and math percentages for grades 3-8 based on a denominator of 1,926 students; For grade 9 scores the denominator is 801 students.
Table B-2: Matching By Tract and Testband
N (pct) No Tract Match Tract Match TotalNo Testband Match 9
(0.8)
(30.0)
1, 197
(99.3)
(44.4)
1,206
(100.0)
(44.2)Testband Match 21
(1.4)
(70.0)
1,500
(98.6)
(55.6)
1,521
(100.0)
(55.8)Total 30
(1.1)
(100.0)
2,697
(98.9)
(100.0)
2,727
(100.0)
(100.0)

MPCP Longitudinal Educational Growth Study Baseline Report
39February 2008
APPENDIX C
Data Collection Procedures and ProtocolsIn this section, we describe the methodology for selecting the sample of panel students and the protocols used for each of the following data collection activities:
Administering the WKCE-CRT to panel students in grades 3-8, •
Administering the Milwaukee Benchmark exam to 9• th grade panel students,Conducting the survey of all panel students,•
Conducting the telephone survey of parents of panel students, and•
Conducting the telephone survey of MPS students and their parents.•
MPCP Sample Selection
Included below is a description of the methodology used to randomly select the MPCP panel for the Evaluation of the Milwaukee Parental Choice Program. The design of the study called for a random sample of 3,000 panel students in grades 3-8 and a census of all 9th grade students in schools attended by panel students. The steps taken to draw the sample are described below:
In September 2006, the Milwaukee Department of Public Instruction (DPI) provided Westat with an •un-audited data file of 16,892 students who were expected to be enrolled in the Milwaukee Parental Choice Program (MPCP) during the 2006-07 school year. This un-audited file was used to draw the sample of panel students because the audited data file was not available prior to the state mandated window for administering the WKCE-CRT-CRT. A sample of 3,095 panel students in grades 3 through 9 was drawn. Please note the census of 9th graders were included in the sample. After removing 20 duplicate records, the panel size was reduced to 3,075 students in grades 3 through 9.
In late April 2007, DPI provided Westat with an • audited file of 17,798 students confirmed to be enrolled in MPCP. Westat attempted to match the sample of 3.075 panel students (drawn from the un-audited file) against this audited file. We matched students based on their school identification number and the last name, first name, and date of birth of the child. In order to be included in the baseline sample, the student’s name had to be included on the audited file. Using this criterion, the matching process resulted in a total of 2,869 unduplicated students.
Testing Protocol
Prior to conducting the baseline testing, the study team prepared some informational materials to share with principals of participating schools to inform them about the requirements of the evaluation. In addition, principals received other testing related mailings in advance of the planned testing. The advance communication with principals of MPCP schools is outlined below:
On September 8, 2006, the co-principal investigators and members of the study team attended a •meeting of MPCP school principals in Milwaukee to introduce the study and to answer questions.
In mid-September, 2006, Westat mailed the list of 3,075 panel students (original sample drawn from •the DPI un-audited file) to each school. As part of this process, schools were asked to verify the enrollment of students. At this time, schools reported that 2,894 panel students were enrolled. We attempted to test these students at the schools where they were confirmed as enrolled.

MPCP Longitudinal Educational Growth Study Baseline Report
40 February 2008
The representative sample, or “panel,” of MPCP students in grades 3-8 were tested in reading and math using the Wisconsin Knowledge and Concepts Examinations - Criterion-Referenced Tests (WKCE-CRT). Panel students in grade 9 were tested in the same subjects using the Discovery Think Link Benchmark exam. These tests were chosen for panel testing because they were also being administered by Milwaukee Public Schools. The protocol for testing all panel students follows:
WKCE-CRT Testing. Sampled panel students in grades 3-8 were administered the WKCE-CRT in their own schools by school personnel between November 7–24, 2006. The testing conditions replicated how MPS students are tested and therefore allow proper comparisons between the performance of MPCP and MPS students. The testing window was required by DPI and coincided with testing being conducted by MPS schools.
Benchmark Testing. The census of panel students in grade 9 were tested using the Milwaukee Benchmark exam between December 8-20, 2006.
Prior to testing the panel students, the study team participated in a MPS sponsored web-cast training on administering the WKCE-CRT-CRT. This training formed the basis for developing the materials used to train MPCP staff who would be administering the WKCE-CRT to panel students. Listed below is a summary of the training related activities that occurred prior to testing.
Westat incorporated DPI’s specific testing protocols and requirements into training materials developed for •the in-person training of MPCP test administrators. The training materials mirrored the training modules and content of the DPI training.
Westat conducted an on-site training of MPCP teachers and staff who would be the test administrators •for their schools, from November 7-9, 2006. Each MPCP school was required to send at least one test administrator to be trained. Several important modules were incorporated into the training, including:
MPCP Study and Testing OverviewRole of the Test AdministratorMaterials needed for testingGetting familiar with the test bookletsAdministering the WKCE-CRT-CRT using appropriate testing proceduresMake-Up SessionsTest Security GuidelinesParticipation of students with special needs and accommodationsUse of calculators
Prior to testing, schools sent home an informational letter to parents and a parental consent form to the •parents of all MPCP panel students. Parents could choose to op-out of the study. Student’s whose parents opted out of the students were not tested or surveyed.
MPCP Parent and Student Surveys
Included below is a description of the process used to survey students and their parents as part of the evaluation of the Milwaukee Parental Choice Program. The design of the study called for a survey of the parents of all panel students, as well as panel students in grades four to nine, to learn about their opinions and their educational experiences. Westat’s IRB granted approval to conduct the telephone survey as part of the evaluation of the MPCP on April 3, 2007.
Paper and Pencil Student Surveys – Fall 2006. In Fall 2006, panel students were administered a paper and pencil survey immediately after completing the WKCE-CRT or Benchmark exam. The survey was not mandatory.

MPCP Longitudinal Educational Growth Study Baseline Report
41February 2008
Students could refuse to participate in the survey component of the study. This survey is the same one that MPS administers every year to their students in grades four and higher. The question wording was slightly different in the elementary/middle school questionnaire and the high school questionnaire.
Student and Parent Telephone Surveys
In April 2007 Westat received the audited file from DPI. After removing students not in the audited file (see previous section), Westat contacted MPCP schools in an attempt to obtain up-to-date phone numbers for these households. During this process schools informed us that additional students were no longer enrolled or had moved out of Milwaukee. Of the 2,727 students in the panel, the vast majority (see Table 4) had completed paper surveys in the Fall. Sixty-five percent had parents who ultimately completed the survey (see Table 4). The 35 percent parental non-response rate includes students whose parents refused to allow participation in the testing; parents who refused the survey outright; parents whose students had withdrawn from their original school during the 2006-2007 academic year; and those who were not locatable.
In May 2007, Westat’s Telephone Research Center began the telephone survey of MPCP parents. Parents were given $20 for their participation in the approximately 30-minute survey. All parents were told to answer questions based on their experiences during the 2006-2007 school year. In addition, attempts were made during the phone calls to survey students who had not completed the paper and pencil survey during the fall 2006 testing period.
1,860 Parent Phone surveys were completed by the end of August, 2007. o
215 Student Phone surveys were completed by the end of August, 2007, bringing the total of o Student Surveys completed (paper/ pencil and phone) to 2,075.
MPS Parent and Student SurveysIn July 2007, 2,727 Milwaukee Public School students were selected as the control group panel to the MPCP panel of students. The goal of all MPCP Evaluation data collection activities is to compare the results of MPCP students with those of the control group of MPS students, therefore the design of the study called for the survey of MPS panel students and their parents to learn about their opinions and their educational experiences.
In mid-July 2007, Westat’s Telephone Research Center began the telephone survey of the 2,727 •MPS parents and students in grades four to nine. Parents were given $20 for their participation in the approximately 30-minute survey. All parents were told to answer questions based on their experiences during the 2006-2007 school year. By mid-November,
1,113 Student Surveys had been completed, ando
1,438 Parent Surveys had been completed.o
Survey Response Rates
For the Parent Survey:64.9 percent for the MPCP sample including testing parental refusals•65.4 percent for the MPCP sample excluding testing parental refusals•51.6 percent for the MPS Matched sample•
For the Student Survey:83.0 percent for the MPCP sample including testing parental refusals•84.5 percent for the MPCP sample excluding testing parental refusals•46.6 percent for the MPS Matched sample•

MPCP Longitudinal Educational Growth Study Baseline Report
42 February 2008
Appendix D: Parent Survey Tables
Note: Cell values are generally percentages. Percentages may not add up to equal one because of rounding and the possibility that respondents could give multiple answers for some questions.
Q1. What grade is [CHILD] in now? MPCP MPS2nd Grade 0.2 0.13rd Grade 12.2 13.84th Grade 11.5 10.95th Grade 13.0 13.56th Grade 12.6 12.27th Grade 11.1 13.18th Grade 10.3 11.69th Grade 27.8 23.910th Grade 1.1 0.811th Grade 0.2 0.1Ungraded, Special Needs Program 0.1 0.0Other/Refused/Don’t Know 0.1 0.0
Q2. How many years has [CHILD] been at this school? MPCP MPSLess than 1 Year 10.9 3.71 Year 28.1 33.12 Years 13.5 20.73 Years 15.3 14.54 Years 9.8 7.8More than 5 Years 22.1 20.1Other/Refused/Don’t Know 0.3 0.1
Q3. Was this school your first choice for [CHILD]? MPCP MPSYes 77.9 74.1No 21.7 23.9Other/Refused/Don’t Know 0.4 2.0
Q4. Is this your neighborhood assigned or residentially assigned school? MPSYes 45.1No 52.8Other/Refused/Don’t Know 2.1
Q5. Do you plan to enroll [CHILD] in the same school next year? MPCP MPSYes 79.1 63.5No 20.3 36.2Other/Refused/Don’t Know 0.6 0.3

MPCP Longitudinal Educational Growth Study Baseline Report
43February 2008
Q6. Why will [CHILD] not be attending the same school next year? (Circle all that apply) MPCP MPSSchool was in inconvenient location 5.0 5.2School was too expensive 0.8 0.2Child offered admission to a preferred private/parochial school 1.9 1.0Child was offered admission to a preferred public school 1.1 1.7Child was not comfortable at school 9.0 6.1Wanted all children to be in same school 1.6 3.1Quality of school/teachers was unacceptable 12.4 9.8Concerned about school safety 1.9 4.0Coursework was too difficult 2.4 0.4Coursework was too easy 4.5 1.7School didn’t meet child’s special needs 4.5 3.8Child asked not to return 3.2 1.5Child suspended or expelled 1.3 1.3Child moved away 4.0 7.5School closed 0.8 4.0Next grade level not offered 32.0 37.8Child graduating from school this year 14.6 7.1Other 19.3 11.7Refused/Don’t Know 1.6 4.4
Note: Only asked if respondent answered “No” to Q5.
Q7. How did you learn about the Parental Choice Program, also known as the voucher program? (CIRCLE ALL THAT APPLY) MPCP 1st Response 2nd ResponseFriends or Relatives 38.4 24.4My Child’s School 33.5 32.0Other Private Schools 5.2 10.5Newspaper/Magazine 4.4 8.1Church 4.0 4.7Television or Radio 3.6 12.2Community Center 1.2 1.7Internet 0.7 0.6Other 8.5 5.8Refused/Don’t Know 0.5 0.0Note: A total of 172 respondents gave a second response.
Q8. Have you heard of the Milwaukee Parental Choice Program? MPSYes 60.4No 39.4Other/Refused/Don’t Know 0.2

MPCP Longitudinal Educational Growth Study Baseline Report
44 February 2008
Q9. Did you ever apply for the Milwaukee Parental Choice Program? MPSYes 13.8No 85.1Other/Refused/Don’t Know 1.1
Q10. What was the outcome of your application to the Milwaukee Parental Choice Program? MPSDetermined not eligible 14.6Accepted, Chose not to participate - Could not get into desired school 4.5Accepted, Went to another public school 8.5Accepted, Used for a while - Didn’t like chosen school and stopped participating 10.1Accepted, Child didn’t want to leave current school 3.5Accepted, Didn’t use. Private school too far away/transportation issues 2.5Accepted, Chose not to participate for other reasons 9.6Accepted, Previously attended school 13.6Other 19.0Refused/Don’t Know 14.1
Note: Only asked if respondent answered “Yes” to Q9.
Q11. Why did you not apply to the Milwaukee Parental Choice Program? MPSDid not know program existed 43.3Not enough information about program 18.6Not enough information about individual schools 1.0Private school was not conveniently located 1.7Satisfied with current school 20.5Private school was not as good as current school 0.9Private school doesn’t have same programs as public school 1.4Private schools not racially integrated 0.1We didn’t meet program’s income requirements 1.7Unsure if program would continue in future 0.4Other 7.0Refused/Don’t Know 3.4
Note: Only asked if respondent answered “No” to Q9.
Q12. Have you heard of charter schools? MPCP MPSYes 65.1 72.0No 34.9 24.6Other/Refused/Don’t Know 0.0 3.4
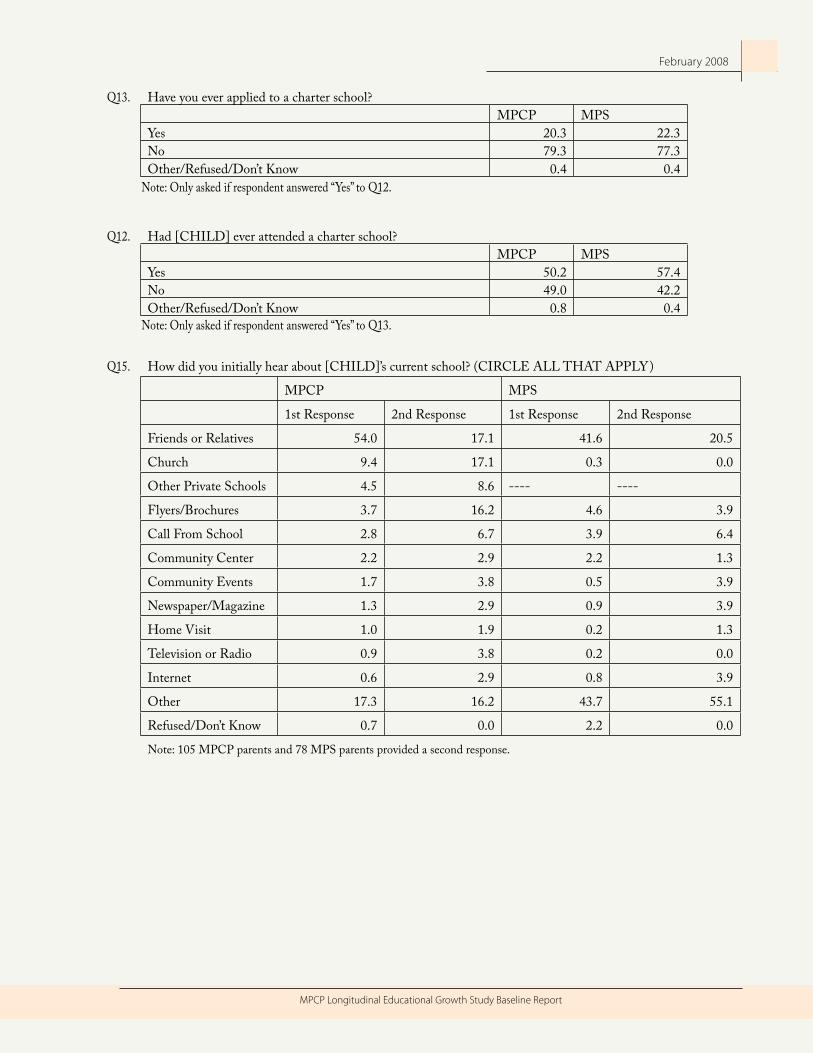
MPCP Longitudinal Educational Growth Study Baseline Report
45February 2008
Q13. Have you ever applied to a charter school? MPCP MPSYes 20.3 22.3No 79.3 77.3Other/Refused/Don’t Know 0.4 0.4
Note: Only asked if respondent answered “Yes” to Q12.
Q12. Had [CHILD] ever attended a charter school? MPCP MPSYes 50.2 57.4No 49.0 42.2Other/Refused/Don’t Know 0.8 0.4
Note: Only asked if respondent answered “Yes” to Q13.
Q15. How did you initially hear about [CHILD]’s current school? (CIRCLE ALL THAT APPLY)
MPCP MPS
1st Response 2nd Response 1st Response 2nd Response
Friends or Relatives 54.0 17.1 41.6 20.5
Church 9.4 17.1 0.3 0.0
Other Private Schools 4.5 8.6 ---- ----
Flyers/Brochures 3.7 16.2 4.6 3.9
Call From School 2.8 6.7 3.9 6.4
Community Center 2.2 2.9 2.2 1.3
Community Events 1.7 3.8 0.5 3.9
Newspaper/Magazine 1.3 2.9 0.9 3.9
Home Visit 1.0 1.9 0.2 1.3
Television or Radio 0.9 3.8 0.2 0.0
Internet 0.6 2.9 0.8 3.9
Other 17.3 16.2 43.7 55.1
Refused/Don’t Know 0.7 0.0 2.2 0.0
Note: 105 MPCP parents and 78 MPS parents provided a second response.

MPCP Longitudinal Educational Growth Study Baseline Report
46 February 2008
Q16. Please rate the importance of the following school characteristics. Please rate as: Very important, Important, Somewhat Important, or Not Important.
Very Important Important
Somewhat Important
Not Important
Other/Refused/Don’t Know Mean
MPCP MPS MPCP MPS MPCP MPS MPCP MPS MPCP MPS MPCP MPSSafety in the school 87.6 82.7 11.6 16.2 0.7 0.9 0.1 0.2 0.0 0.0 3.9 3.8Educational quality of the school 84.1 79.6 15.0 19.6 0.5 0.6 0.2 0.2 0.2 0.0 3.8 3.8Teacher quality 81.6 75.8 16.7 22.3 1.3 1.3 0.4 0.6 0.0 0.0 3.8 3.7Discipline in the school 77.4 69.5 19.8 25.7 2.3 3.6 0.5 1.1 0.0 0.1 3.7 3.6School leadership 69.5 62.0 26.9 33.5 3.1 3.7 0.4 0.5 0.1 0.3 3.7 3.6School facilities (library, gym, textbooks) 62.6 56.3 31.7 35.8 5.0 6.5 0.7 1.2 0.0 0.2 3.6 3.5Financial considerations 59.8 39.4 31.8 38.0 5.9 12.9 2.2 9.2 0.3 0.5 3.5 3.1Special programs offered by the school 59.0 57.2 32.0 35.5 6.7 5.7 2.3 1.5 0.0 0.1 3.5 3.5
Class size 59.5 51.4 30.5 34.9 8.0 9.1 1.9 4.3 0.1 0.3 3.5 3.3Religious instruction 61.5 24.1 25.8 29.9 7.9 18.3 4.7 26.8 0.1 0.9 3.4 2.5Extracurricular activities (sports, etc.) 45.3 43.4 39.0 37.3 13.1 14.7 2.5 4.6 0.1 0.0 3.3 3.2Racial diversity 53.5 48.8 27.0 32.6 8.7 8.4 10.6 10.1 0.2 0.1 3.2 3.2Location of the school 44.1 39.4 37.2 36.2 11.8 12.8 6.8 11.7 0.1 0.0 3.2 3.0Other children in the family attending the same school 48.8 32.3 24.9 27.0 9.6 10.7 16.7 29.4 0.0 0.6 3.1 2.6
Note: To calculate the means: Very Important = 4, Important = 3, Somewhat Important = 2, and Not Important = 1. The characteristics were reordered based on the MPCP mean values.

MPCP Longitudinal Educational Growth Study Baseline Report
47February 2008
Q17. Of the 13 school characteristics you just rated, which do you consider the most important?
MPCP MPS
Educational quality of the school 53.2 48.5
Teacher quality 11.9 16.4
Safety in the school 11.3 16.6
Religious instruction 8.6 1.7
Discipline in the school 4.3 3.6
School leadership 2.7 3.0
Financial considerations 1.6 0.4
Class size 1.6 2.6
Location of the school 1.3 1.9
Extracurricular activities (sports, etc.) 1.3 1.0
Racial diversity 0.9 1.5
School facilities (library, gym, textbooks) 0.5 0.6
Special programs offered by the school 0.3 1.5
Other children in the family attending the same school 0.2 0.2
Other/Refused/Don’t Know 0.3 0.5
Q18. How many schools did you visit or contact before choosing a school for [CHILD]?
0 Schools 1-2 Schools 3-4 Schools5 or more Schools
Other/Refused/ Don’t Know Mean
MPCP MPS MPCP MPS MPCP MPS MPCP MPS MPCP MPS MPCP MPSNumber of Public Schools: 50.9 27.6 37.8 51.1 8.9 15.9 2.1 4.7 0.3 0.7 1.0 1.6Number of Private Schools: 32.8 80.7 56.9 15.6 8.4 2.0 1.7 0.4 0.2 1.3 1.1 0.3Number of Charter Schools: 86.1 88.0 11.2 8.9 1.4 1.1 0.4 0.4 0.9 1.6 0.2 0.2

MPCP Longitudinal Educational Growth Study Baseline Report
48 February 2008
Q19. Would you enroll [CHILD] in a private school next year if you had to pay tuition instead of having it paid by the choice program? MPCPYes 51.3No 47.0Other/Refused/Don’t Know 1.7
Q20. How many schools has [CHILD] ever attended? MPCP MPS1 16.9 16.82 31.3 26.53 29.4 27.94 13.0 15.25 5.3 7.56 or more 3.1 5.4Other/Refused/Don’t Know 1.0 0.7
Q21. How many were public schools? MPCP MPS0 20.0 7.2
1 40.2 36.12 22.3 31.83 11.2 12.44 3.4 7.95 1.0 2.46 or more 0.9 0.7Other/Refused/Don’t Know 1.0 1.5
Note: If MPCP respondents answered “1” for Q20, Q21 was skipped.

MPCP Longitudinal Educational Growth Study Baseline Report
49February 2008
Q22. Now, thinking specifically about [CHILD]’s school, how satisfied are you with each of the following?
Very Satisfied Satisfied Neutral DissatisfiedVery
DissatisfiedOther/Refused/
Don’t Know Means
MPCP MPS MPCP MPS MPCP MPS MPCP MPS MPCP MPS MPCP MPS MPCP MPSWhat is taught in school 54.9 35.3 36.8 49.4 5.1 7.7 2.2 5.6 1.0 1.7 0.0 0.3 4.4 4.1
School safety 55.2 36.0 36.7 45.8 3.3 7.4 3.7 7.5 1.0 3.1 0.1 0.2 4.4 4.0Amount your child has learned 54.7 38.3 35.2 41.6 5.1 7.1 3.7 10.2 1.1 2.7 0.2 0.1 4.4 4.0
Class sizes 49.3 21.8 43.8 53.9 4.1 10.6 2.0 11.0 0.7 2.2 0.1 0.5 4.4 3.8Opportunities for parental involvement 50.4 36.8 40.3 47.8 5.4 8.2 3.0 6.1 0.8 1.0 0.1 0.1 4.4 4.1How much students can observe religious traditions 49.0 7.4 40.2 35.9 7.4 37.8 2.4 11.9 0.5 2.4 0.5 4.6 4.4 3.4How much teachers inform parents of student’s progress 55.9 41.0 32.0 39.4 4.9 6.7 5.4 9.5 1.6 3.2 0.2 0.2 4.4 4.1Academic quality 48.8 31.3 41.5 50.9 4.8 9.0 4.1 7.2 0.7 1.3 0.1 0.3 4.3 4.0Student engagement with school 45.4 28.7 43.4 53.4 6.9 8.6 3.2 7.9 0.7 0.7 0.4 0.7 4.3 4.0Teachers’ Performance 44.7 34.4 43.2 46.7 5.9 9.0 4.4 7.2 1.5 2.6 0.3 0.1 4.3 4.0Parental support for the school 43.0 27.9 44.3 52.0 7.9 11.3 3.8 6.8 1.0 1.3 0.0 0.7 4.3 4.0Principals’ Performance 47.3 34.8 37.9 42.6 7.2 10.4 4.7 8.0 2.7 3.6 0.2 0.6 4.2 4.0School facilities (library, gym, textbooks) 42.5 25.5 44.7 59.7 7.0 8.1 4.8 5.1 0.9 1.2 0.1 0.4 4.2 4.0Discipline in the school 48.4 30.2 36.0 44.4 6.8 9.1 6.4 12.2 2.2 3.7 0.2 0.4 4.2 3.9
Transportation 25.4 21.8 39.6 50.8 17.2 13.5 11.9 10.3 3.8 1.5 2.1 2.1 3.7 3.8 Note: To calculate means, Very Satisfied = 5, Satisfied = 4, Neutral = 3, Dissatisfied = 2, and Very Dissatisfied =
1. The characteristics were reordered based on the MPCP mean values.

MPCP Longitudinal Educational Growth Study Baseline Report
50 February 2008
Q23. What overall grade would you give [CHILD]’s current school? MPCP MPS National AverageA 55.3 34.0 19.0B 31.7 40.5 48.0C 9.5 16.9 24.0D 1.9 4.9 5.0F 1.5 3.1 3.0Other/Refused/Don’t Know 0.1 0.6 1.0GPA 3.4 3.0 2.7
Note: National average comes from The 39th Annual Phi Delta Kappa/Gallup Poll (2007). Pg. 40, Table 27. The GPA calculation for the PDK poll is an approximation (n = 1,005)
Q24. How serious are the following problems at [CHILD]’s school? Very Serious Somewhat Serious Not Serious Don’t Know Other/Refused MPCP MPS MPCP MPS MPCP MPS MPCP MPS MPCP MPS
Kids destroying property 6.0 12.1 7.5 11.5 80.7 68.0 5.6 8.0 0.2 0.4Fighting 9.0 19.4 12.3 22.7 75.5 53.2 3.0 4.2 0.2 0.5Racial conflict 5.1 8.2 6.0 7.4 85.6 78.6 3.1 5.4 0.2 0.4Drugs/Alcohol 4.5 8.7 3.0 4.8 89.0 78.5 3.3 7.4 0.2 0.6Teacher absenteeism 3.6 5.6 3.3 7.7 87.2 77.1 5.7 9.3 0.2 0.3Weapons in school 4.3 10.3 2.0 6.3 90.3 77.6 3.3 5.4 0.1 0.4
Q25. During this year, how many times did you (or someone in your household) have contact with the school about each of the following?
Never Once or Twice
3 or 4
Times 5 Times or More
Other/Refused/
Don’t Know MPCP MPS MPCP MPS MPCP MPS MPCP MPS MPCP MPSYour child’s academic performance 17.3 18.7 29.0 26.2 24.5 23.2 28.9 31.3 0.3 0.6Doing volunteer work for the school 36.2 50.7 28.2 22.2 17.5 12.3 17.9 14.1 0.2 0.7Participating in fund raising 33.2 43.7 37.3 32.6 16.6 14.3 12.5 8.8 0.4 0.6Providing information for school records 25.7 36.1 51.1 42.5 12.9 11.3 9.7 8.9 0.6 1.2Your child’s behavior 41.6 35.7 29.7 28.3 13.6 15.7 14.9 19.5 0.2 0.8
Q26. Did you (or someone in your household) do any of the following at [CHILD]’s school this past year? Yes No Other/Refused/Don’t Know MPCP MPS MPCP MPS MPCP MPSVolunteer at your child’s school 54.7 37.9 45.1 61.5 0.2 0.6Attend parent/teacher conferences 94.5 91.8 5.3 7.6 0.2 0.6Take part in activities of a parent/teacher organization 47.4 32.1 52.3 67.0 0.3 0.9Belong to other organizations dealing with school matters 26.7 18.5 73.1 80.7 0.2 0.8

MPCP Longitudinal Educational Growth Study Baseline Report
51February 2008
Q27. How many times in a normal week would you say you participate in the following activities with [CHILD]?
Never
Once or
Twice 3 or 4 Times 5 Times or More
Other/Refused/
Don’t Know MPCP MPS MPCP MPS MPCP MPS MPCP MPS MPCP MPSHelp your child with homework 10.5 7.9 27.3 17.8 21.1 20.9 40.9 52.8 0.2 0.6Read with or to your child 24.9 21.3 29.0 23.0 18.8 19.0 27.1 36.2 0.2 0.5Work on arithmetic or math 21.8 14.3 31.8 25.5 19.4 21.1 26.7 38.2 0.3 0.9
Work on penmanship or writing 43.6 35.0 25.3 20.0 12.4 14.3 18.4 29.9 0.3 0.8Watch educational programs on TV with your child 20.9 20.7 38.8 32.8 20.0 19.5 20.2 26.2 0.1 0.8
Q28. How often do you talk with other parents about matters going on at [CHILD]’s school? MPCP MPSSeldom or Never 45.7 52.3Once or twice a month 27.0 26.2Once or twice a week 18.2 14.4Almost every day 8.7 6.3Other/Refused/Don’t Know 0.4 0.8
Q29. Approximately how much time does [CHILD] spend on assigned homework on an average day (in all subjects)? MPCP MPS0 to 30 minutes 17.7 20.931 to 60 minutes 32.4 36.061 to 90 minutes 15.4 14.3More than 90 minutes 33.2 25.7Other/Refused/Don’t Know 1.3 3.1
Q30. Have you ever moved so that your children could attend a better school? MPCP MPSYes 15.7 14.1No 84.1 85.1Other/Refused/Don’t Know 0.2 0.8

MPCP Longitudinal Educational Growth Study Baseline Report
52 February 2008
Q31. For each of the following statements, please say if you: Strongly agree, Agree, are Neutral, Disagree, or Strongly Disagree.
Strongly
Agree Agree Neutral DisagreeStrongly Disagree
Other/Refused/
Don’t Know Means
MPCP MPS MPCP MPS MPCP MPS MPCP MPS MPCP MPS MPCP MPS MPCP MPSa. I trust the teachers at my child’s school 37.2 27.6 52.3 54.7 6.3 9.7 3.0 5.7 0.9 1.6 0.3 0.7 4.2 4.0b. My child’s school has high expectations for academic achievement 47.3 36.1 43.7 48.5 4.8 6.5 3.2 6.8 0.7 1.3 0.3 0.8 4.4 4.1c. I am well qualified to participate at my child’s school 36.7 30.6 52.7 55.2 6.0 7.2 3.8 5.8 0.3 0.4 0.5 0.8 4.2 4.1d. I know more about my child’s school than most parents 16.1 14.3 41.8 37.9 26.8 23.9 13.8 22.3 0.7 0.7 0.8 0.9 3.6 3.4e. I don’t have a say about what happens in schools 3.3 3.1 8.8 12.1 8.2 8.1 61.1 58.0 17.9 17.7 0.7 1.0 3.8 3.8f. School staff don’t care what I think 1.6 2.2 6.5 8.5 6.7 8.0 64.5 64.4 20.3 15.8 0.4 1.1 4.0 3.8
Note: To calculate the means, the most positive answer received a 5 and the most negative received a 1. For example, in Q32a, strongly agreed = 5 & strongly disagreed = 1. In Q32e, strongly agree = 1 & strongly disagree = 5.
Q32. What is the average grade [CHILD] received in school this past year? MPCP MPSA 30.4 22.5B 45.1 41.8C 19.3 26.6D 2.3 4.4F 0.9 1.6Other/Refused/Don’t Know 2.0 3.1GPA 3.0 2.8

MPCP Longitudinal Educational Growth Study Baseline Report
53February 2008
Q33. How far do you expect [CHILD] to go in school? MPCP MPSFinished some high school 0.3 1.7Graduated from high school 7.6 14.5Go to vocational school after high school(beauty school, auto mechanic, dental hygienist) 1.3 1.9Go to college 35.7 33.5Graduate from college 29.7 33.7Go to graduate school (law, medicine, masters degree) 24.5 13.0Other/Refused/Don’t Know 0.9 1.7
Q34. How would you rate the importance of education in your family compared to other goals? Would you say education is more important, just as important, or less important than:
Education is more important
Education is just as important
Education is less important
Other/Refused/Don’t Know
MPCP MPS MPCP MPS MPCP MPS MPCP MPSHaving a good job 75.1 77.0 23.8 21.8 0.5 0.2 0.6 1.0Having enough money in the family 59.0 61.9 37.5 33.8 2.8 3.4 0.7 0.9Maintaining religious observances/faith 31.7 33.5 56.8 52.4 10.7 12.3 0.8 1.8Maintaining family ethnic traditions 35.5 36.9 57.6 53.8 6.0 8.1 0.9 1.2Having a healthy family 20.4 18.4 62.7 61.8 16.1 18.7 0.8 1.1Having a good place to live 30.2 25.1 63.0 64.8 6.2 9.1 0.6 1.0
Q35. In your opinion, what is the main purpose of education? MPCP MPSPrepare students for the workforce 23.5 30.7Create good citizens 14.4 12.9Promote moral or religious values 5.9 2.6Encourage lifelong learning 54.6 52.5Other/Refused/Don’t Know 1.6 1.3
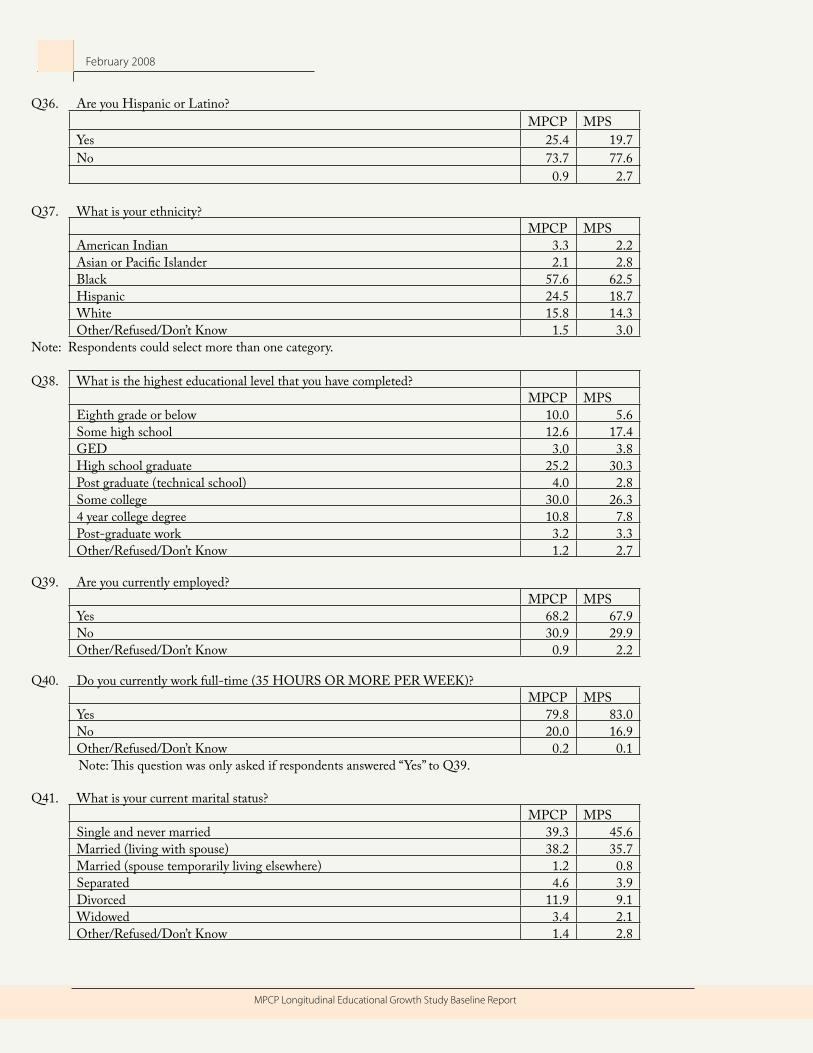
MPCP Longitudinal Educational Growth Study Baseline Report
54 February 2008
Q36. Are you Hispanic or Latino? MPCP MPSYes 25.4 19.7No 73.7 77.6 0.9 2.7
Q37. What is your ethnicity? MPCP MPSAmerican Indian 3.3 2.2Asian or Pacific Islander 2.1 2.8Black 57.6 62.5Hispanic 24.5 18.7White 15.8 14.3Other/Refused/Don’t Know 1.5 3.0
Note: Respondents could select more than one category.
Q38. What is the highest educational level that you have completed? MPCP MPSEighth grade or below 10.0 5.6Some high school 12.6 17.4GED 3.0 3.8High school graduate 25.2 30.3Post graduate (technical school) 4.0 2.8Some college 30.0 26.34 year college degree 10.8 7.8Post-graduate work 3.2 3.3Other/Refused/Don’t Know 1.2 2.7
Q39. Are you currently employed? MPCP MPSYes 68.2 67.9No 30.9 29.9Other/Refused/Don’t Know 0.9 2.2
Q40. Do you currently work full-time (35 HOURS OR MORE PER WEEK)? MPCP MPSYes 79.8 83.0No 20.0 16.9Other/Refused/Don’t Know 0.2 0.1
Note: This question was only asked if respondents answered “Yes” to Q39.
Q41. What is your current marital status? MPCP MPSSingle and never married 39.3 45.6Married (living with spouse) 38.2 35.7Married (spouse temporarily living elsewhere) 1.2 0.8Separated 4.6 3.9Divorced 11.9 9.1Widowed 3.4 2.1Other/Refused/Don’t Know 1.4 2.8

MPCP Longitudinal Educational Growth Study Baseline Report
55February 2008
Q42. Does [CHILD]’s other parent or guardian live in your household? MPCP MPSYes 38.1 36.4No 57.9 57.4Deceased 2.8 3.6Other/Refused/Don’t Know 1.2 2.6
Q43. Including everyone in your household, what was the total income for your household in the last calendar year (before taxes and other deductions)? MPCP MPSLess than $5,000 8.5 9.9Between $5,001 and $10,000 12.3 12.5Between $10,001 and $20,000 23.9 18.0Between $20,001 and $35,000 31.1 23.7Between $35,001 and $50,000 13.0 12.9$50,001 or more 4.7 15.0Other/Refused/Don’t Know 6.5 8.0
Q44. How many children do you have? MPCP MPS1 5.8 6.92 21.0 21.33 28.0 25.74 18.7 18.25 10.4 10.96 or more 13.1 13.2Other/Refused/Don’t Know 3.0 3.8
Q45. What language do you primarily use with your children at home? MPCP MPSEnglish 77.2 83.7Spanish 19.3 11.3Hmong 0.8 1.3Urdu 0.2 0.0Filipino 0.0 0.1French 0.0 0.1Other/Refused/Don’t Know 2.5 3.5
Q46. Does [CHILD] have any physical handicaps? MPCP MPSYes 2.7 4.2No 96.5 93.6Other/Refused/Don’t Know 0.8 2.2

MPCP Longitudinal Educational Growth Study Baseline Report
56 February 2008
Q47. How well do the facilities at [CHILD]’s school attend to [his/her] particular needs? Would you say: MPCP MPSVery well 44.0 51.7Adequately 32.0 28.3Poorly 12.0 8.3Other/Refused/Don’t Know 12.0 11.7
Note: Only respondents who answered “Yes” to Q46 were asked this question.
Q48. Does [CHILD] have any learning disabilities? MPCP MPSYes 8.7 18.2No 90.3 79.6Other/Refused/Don’t Know 1.0 2.2
Q49. How well do the facilities at [CHILD]’s school attend to [his/her] particular needs. Would you say: MPCP MPSVery well 53.1 51.9Adequately 30.9 29.4Poorly 14.8 17.9Other/Refused/Don’t Know 1.2 0.8
Note: Only respondents who answered “Yes” to Q48 were asked this question.
Q50. In the last month, approximately how many days did [CHILD] miss school? MPCP MPSNone 50.8 38.21 to 2 days 30.8 29.63 to 4 days 9.3 12.95 or more days 8.1 16.0Other/Refused/Don’t Know 1.0 3.3
Q51. During this past year, was [CHILD] ever suspended for disciplinary reasons? MPCP MPSYes 19.7 33.5No 79.3 64.1Other/Refused/Don’t Know 1.0 2.4
Q52. What is your religious preference? MPCP MPS7th Day Adventist 1.1 0.4 Apostolic/Pentecostal 7.2 7.2Catholic 30.0 20.5Christian, Non-Denominational 16.8 20.1Church of God in Christ 2.5 2.2Islamic 2.9 1.0Jewish 1.1 0.1Lutheran (ELCA) 2.2 1.7Lutheran (LCMS) 1.7 0.3Lutheran (WELS) 2.4 1.3Baptist 21.2 24.3None 5.9 12.0Other/Refused/Don’t Know 5.0 8.9

MPCP Longitudinal Educational Growth Study Baseline Report
57February 2008
Q53. Do you consider yourself: MPCP MPSAn evangelical 9.7 7.3A fundamentalist 4.1 3.7Neither 83.9 84.1Other/Refused/Don’t Know 2.3 4.9
Note: If the respondent answered “None” to Q52, he/she was not asked Q53.
Q54. How often do you attend religious services? MPCP MPSMore than once a week 20.9 18.0Once a week 44.5 35.7Once a month 18.4 19.0Only during major religious holidays 6.5 9.8Never 5.3 10.4Other/Refused/Don’t Know 4.4 7.1
Note: If the respondent answered “None” to Q52, he/she was not asked Q55.
Q55. How long have you lived at the current address? NUMBER OF MONTHS: MPCP MPS0 to 12 months 22.1 23.013 to 24 months 14.4 14.825 to 48 months 19.7 21.149 to 84 months 17.8 15.0More than 84 months 24.9 23.8Other/Refused/Don’t Know 1.1 2.3
Q56. Do you own your home? MPCP MPSYes 41.0 38.0No 57.9 59.3Other/Refused/Don’t Know 1.1 2.7
Q57. How many years have you lived in Milwaukee? MPCP MPS0 to 3 years 3.4 2.74 to 7 years 8.0 5.68 to 15 years 20.1 17.216 to 25 years 16.0 18.0More than 25 years 50.8 53.4Other/Refused/Don’t Know 1.7 3.1
Q58. Please rate how safe you believe your neighborhood is? MPCP MPSVery safe 20.2 20.7Somewhat safe 50.8 51.0Somewhat unsafe 21.0 17.8Very unsafe 7.0 8.0Other/Refused/Don’t Know 1.0 2.5

MPCP Longitudinal Educational Growth Study Baseline Report
58 February 2008
Q59. Does anyone in your home receive assistance from any of the following government programs?
Yes NoOther/Refused/Don’t Know
MPCP MPS MPCP MPS MPCP MPSFood stamps 36.0 37.4 63.1 60.0 0.9 2.6
Welfare (also known as TANF) 3.5 5.0 95.4 91.9 1.1 3.1
Social Security 16.0 16.8 82.8 80.2 1.2 3.0
Supplemental Security Income (SSI) 14.1 18.1 84.8 78.9 1.1 3.0
Housing assistance from the government 8.0 11.0 91.1 86.0 0.9 3.0
Other 23.1 25.0 75.7 71.8 1.2 3.2

MPCP Longitudinal Educational Growth Study Baseline Report
59February 2008
Appendix E: Student Survey TablesGrades Four to EightNote: Cell values are generally percentages. Percentages may not total 100% because of rounding.
A. Was the student survey completed in 2006 (taken with the test) or 2007 (phone survey)?MPCP MPS
2006 12992007 116 795Total 1415 795
General Questions Strongly Agree Agree Disagree Strongly Disagree Not Sure Refused MeanMPCP MPS MPCP MPS MPCP MPS MPCP MPS MPCP MPS MPCP MPS MPCP MPS
Q1.At school I am expected to do my best all the time. 61.9 46.3 30.9 51.5 2.3 1.3 0.8 0.5 1.9 0.4 2.2 0.1 3.6 3.4
Q2.I have the books and supplies I need to do well in school. 52.2 35.6 38.1 60.8 2.5 2.6 1.0 0.4 2.3 0.5 4.0 0.1 3.5 3.3
Q3.My school prepares me to do well on all kinds of tests. 49.2 34.0 39.4 62.0 3.0 3.4 1.3 0.0 3.2 0.4 3.9 0.3 3.5 3.3
Q4.The adults at my school care about the students. 48.5 35.7 35.7 56.7 3.7 5.3 2.2 1.1 7.8 1.1 2.2 0.0 3.5 3.3
Q5.My school building is a good place for learning. 46.7 27.7 40.8 64.4 4.1 5.3 1.8 1.1 4.6 1.5 2.1 0.0 3.4 3.2
Q6.I understand the learning targets my school expects me to achieve. 44.0 28.7 43.5 67.2 3.0 2.6 1.1 0.4 7.7 1.0 0.6 0.1 3.4 3.3
Q7. The work I do in class makes me think. 45.7 32.5 42.4 61.5 3.9 4.5 1.6 0.6 4.3 0.6 2.2 0.3 3.4 3.3
Q8.The adults at my school help me when I have problems. 46.1 36.2 40.6 58.0 4.4 4.0 1.8 1.1 3.2 0.5 4.0 0.1 3.4 3.3
Q9. I think I do well in school. 41.1 33.6 43.2 61.9 4.0 3.4 1.3 0.5 6.2 0.4 4.1 0.3 3.4 3.3
Q10.My school gives me the things I need to do a good job. 42.5 29.8 42.3 62.4 5.4 5.8 1.7 0.8 4.1 1.3 4.0 0.0 3.4 3.2
Q11.My school puts the money and staff it has to good use. 40.3 25.8 34.8 62.5 5.0 6.5 2.8 1.0 16.4 4.0 0.9 0.1 3.4 3.2
Q12.The adults in my school are good role models. 38.0 25.0 40.3 63.7 7.9 7.6 2.9 1.3 10.3 2.3 0.5 0.3 3.3 3.2
Q13. My teachers give me challenging work. 36.5 24.4 42.2 65.5 8.1 8.3 2.6 0.9 6.4 0.8 4.2 0.1 3.3 3.1
Q14.I usually look forward to coming to school. 34.0 27.4 41.3 61.9 11.2 8.6 6.2 0.9 6.9 1.1 0.4 0.1 3.1 3.2
Q15. My school is friendly 26.5 21.6 44.2 62.0 9.3 12.2 3.9 2.8 13.9 1.4 2.1 0.0 3.1 3.0
Q16.The students and adults in my school respect each other. 30.8 22.5 35.7 57.9 13.7 14.6 5.5 2.9 10.4 2.0 4.0 0.1 3.1 3.0
Q17.The adults in my school listen to my ideas about the school. 26.1 19.6 38.4 61.1 12.4 15.2 6.1 1.9 12.7 2.0 4.2 0.1 3.0 3.0
Q18.Students at my school focus on learning. 16.7 14.5 41.9 56.2 17.5 23.1 4.9 2.8 16.7 3.3 2.3 0.1 2.9 2.9
Q19.People from the neighborhood or the community help out at my school. 20.7 13.0 28.6 47.2 16.1 30.1 11.2 3.0 22.8 6.7 0.6 0.1 2.8 2.8
Q20. I have choices about what I will learn. 19.4 19.6 28.7 56.5 22.7 19.9 11.7 1.8 13.5 2.3 4.0 0.0 2.7 3.0
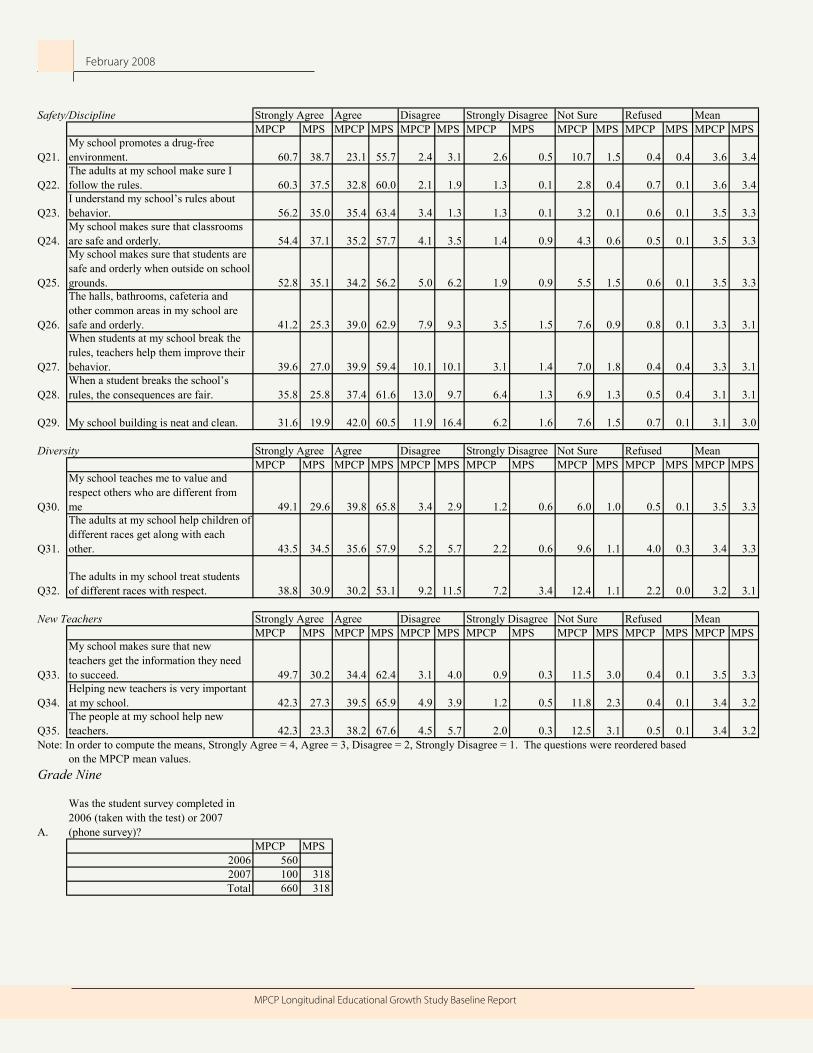
MPCP Longitudinal Educational Growth Study Baseline Report
60 February 2008
Safety/Discipline Strongly Agree Agree Disagree Strongly Disagree Not Sure Refused MeanMPCP MPS MPCP MPS MPCP MPS MPCP MPS MPCP MPS MPCP MPS MPCP MPS
Q21.My school promotes a drug-free environment. 60.7 38.7 23.1 55.7 2.4 3.1 2.6 0.5 10.7 1.5 0.4 0.4 3.6 3.4
Q22.The adults at my school make sure I follow the rules. 60.3 37.5 32.8 60.0 2.1 1.9 1.3 0.1 2.8 0.4 0.7 0.1 3.6 3.4
Q23.I understand my school’s rules about behavior. 56.2 35.0 35.4 63.4 3.4 1.3 1.3 0.1 3.2 0.1 0.6 0.1 3.5 3.3
Q24.My school makes sure that classrooms are safe and orderly. 54.4 37.1 35.2 57.7 4.1 3.5 1.4 0.9 4.3 0.6 0.5 0.1 3.5 3.3
Q25.
My school makes sure that students are safe and orderly when outside on school grounds. 52.8 35.1 34.2 56.2 5.0 6.2 1.9 0.9 5.5 1.5 0.6 0.1 3.5 3.3
Q26.
The halls, bathrooms, cafeteria and other common areas in my school are safe and orderly. 41.2 25.3 39.0 62.9 7.9 9.3 3.5 1.5 7.6 0.9 0.8 0.1 3.3 3.1
Q27.
When students at my school break the rules, teachers help them improve their behavior. 39.6 27.0 39.9 59.4 10.1 10.1 3.1 1.4 7.0 1.8 0.4 0.4 3.3 3.1
Q28.When a student breaks the school’s rules, the consequences are fair. 35.8 25.8 37.4 61.6 13.0 9.7 6.4 1.3 6.9 1.3 0.5 0.4 3.1 3.1
Q29. My school building is neat and clean. 31.6 19.9 42.0 60.5 11.9 16.4 6.2 1.6 7.6 1.5 0.7 0.1 3.1 3.0
Diversity Strongly Agree Agree Disagree Strongly Disagree Not Sure Refused MeanMPCP MPS MPCP MPS MPCP MPS MPCP MPS MPCP MPS MPCP MPS MPCP MPS
Q30.
My school teaches me to value and respect others who are different from me 49.1 29.6 39.8 65.8 3.4 2.9 1.2 0.6 6.0 1.0 0.5 0.1 3.5 3.3
Q31.
The adults at my school help children of different races get along with each other. 43.5 34.5 35.6 57.9 5.2 5.7 2.2 0.6 9.6 1.1 4.0 0.3 3.4 3.3
Q32.The adults in my school treat students of different races with respect. 38.8 30.9 30.2 53.1 9.2 11.5 7.2 3.4 12.4 1.1 2.2 0.0 3.2 3.1
New Teachers Strongly Agree Agree Disagree Strongly Disagree Not Sure Refused MeanMPCP MPS MPCP MPS MPCP MPS MPCP MPS MPCP MPS MPCP MPS MPCP MPS
Q33.
My school makes sure that new teachers get the information they need to succeed. 49.7 30.2 34.4 62.4 3.1 4.0 0.9 0.3 11.5 3.0 0.4 0.1 3.5 3.3
Q34.Helping new teachers is very important at my school. 42.3 27.3 39.5 65.9 4.9 3.9 1.2 0.5 11.8 2.3 0.4 0.1 3.4 3.2
Q35.The people at my school help new teachers. 42.3 23.3 38.2 67.6 4.5 5.7 2.0 0.3 12.5 3.1 0.5 0.1 3.4 3.2
Note: In order to compute the means, Strongly Agree = 4, Agree = 3, Disagree = 2, Strongly Disagree = 1. The questions were reordered based on the MPCP mean values.
Grade Nine
A.
Was the student survey completed in 2006 (taken with the test) or 2007 (phone survey)?
MPCP MPS2006 5602007 100 318Total 660 318

MPCP Longitudinal Educational Growth Study Baseline Report
61February 2008
General Questions Strongly Agree Agree Disagree Strongly Disagree Not Sure Refused MeanMPCP MPS MPCP MPS MPCP MPS MPCP MPS MPCP MPS MPCP MPS MPCP MPS
Q1.My school has high academic expectations of me. 45.8 35.9 41.8 53.1 4.2 7.6 1.1 0.9 5.0 2.5 2.1 0.0 3.4 3.3
Q2.I have the books and supplies I need to do well in school. 43.5 37.1 49.1 59.4 3.3 2.8 0.5 0.3 1.5 0.3 2.1 0.0 3.4 3.3
Q3.The staff at my school cares about the students. 39.9 28.6 46.8 61.0 3.9 7.6 0.9 0.3 6.5 2.5 2.0 0.0 3.4 3.2
Q4.My school offers me help when I have problems. 40.3 29.3 47.6 60.4 5.6 7.6 1.2 0.3 3.2 2.2 2.1 0.3 3.3 3.2
Q5.My school prepares me to do well on assessments. 34.9 24.8 53.6 67.9 3.2 5.4 1.2 0.3 4.9 1.3 2.3 0.3 3.3 3.2
Q6.I understand the learning targets my school expects me to achieve. 34.1 24.2 55.2 68.9 3.5 4.7 0.6 0.6 4.7 0.9 2.0 0.6 3.3 3.2
Q7.My school building has a positive atmosphere for learning. 33.3 18.9 52.4 65.1 6.5 13.2 0.6 0.9 5.3 1.9 1.8 0.0 3.3 3.0
Q8.The teachers and staff in my school act in a professional manner. 33.2 18.9 53.2 66.4 5.9 12.9 1.2 0.3 5.8 1.6 0.8 0.0 3.3 3.1
Q9. My school offers challenging classes. 34.7 28.6 47.6 56.3 7.9 13.5 1.8 0.6 5.9 0.9 2.1 0.0 3.3 3.1
Q10.My school has a friendly and welcoming atmosphere. 29.2 17.3 55.8 68.6 4.9 10.7 0.9 1.9 7.4 1.6 1.8 0.0 3.2 3.0
Q11.My school uses its financial and human resources effectively. 21.5 11.6 48.3 71.7 4.1 6.9 1.1 0.3 24.6 9.1 0.5 0.3 3.2 3.0
Q12. My teachers give me challenging work. 28.5 18.6 56.1 64.2 8.5 15.4 1.2 0.6 4.0 1.3 1.8 0.0 3.2 3.0
Q13.
Businesses and/or community organizations provide support to my school. 20.3 9.4 38.3 58.8 6.4 12.9 1.2 0.3 31.7 18.6 2.1 0.0 3.2 2.9
Q14. My school is good at meeting my needs. 24.9 20.1 53.0 61.3 10.8 15.1 2.0 1.3 7.3 1.9 2.1 0.3 3.1 3.0Q15. I feel that I help decide what I learn. 23.6 16.0 53.3 67.3 12.4 13.8 2.3 0.3 6.1 1.6 2.3 0.9 3.1 3.0
Q16.I have the opportunity to help make decisions about my school. 18.3 11.6 48.3 59.1 15.8 23.0 3.8 2.2 11.5 3.8 2.3 0.3 2.9 2.8
Q17.I usually look forward to coming to school. 21.8 20.8 49.9 65.1 15.8 10.7 5.8 2.2 5.0 1.3 1.8 0.0 2.9 3.1
Q18.I am pleased with my academic progress. 20.8 23.9 49.4 60.7 18.3 11.0 4.7 1.3 4.6 2.8 2.3 0.3 2.9 3.1
Q19.The students and adults in my school respect each other. 19.1 13.5 43.0 54.4 19.9 23.9 5.6 3.5 9.9 4.1 2.6 0.6 2.9 2.8
Q20.Students at my school focus on learning. 8.3 6.6 51.7 53.1 16.7 29.3 4.6 4.1 17.0 6.9 1.8 0.0 2.8 2.7

MPCP Longitudinal Educational Growth Study Baseline Report
62 February 2008
Safety/Discipline Strongly Agree Agree Disagree Strongly Disagree Not Sure Refused MeanMPCP MPS MPCP MPS MPCP MPS MPCP MPS MPCP MPS MPCP MPS MPCP MPS
Q21.My school promotes a drug-free environment. 51.4 31.5 37.1 59.1 2.4 6.3 2.0 1.6 5.3 1.3 1.8 0.3 3.5 3.2
Q22 The staff at my school enforce the rules. 43.0 25.5 46.5 65.4 4.1 7.9 0.8 0.3 3.5 0.9 2.1 0.0 3.4 3.2
Q23.I understand my school’s rules and expectations about student behavior. 42.1 38.4 51.2 58.8 2.4 2.5 0.5 0.0 2.0 0.3 1.8 0.0 3.4 3.4
Q24.My school makes sure that classrooms are safe and orderly. 42.7 28.9 47.1 59.1 4.1 9.4 0.6 0.9 3.8 1.3 1.7 0.3 3.4 3.2
Q25.
My school makes sure that students are safe and orderly when outside on school grounds. 36.1 23.3 45.6 58.8 6.5 14.5 2.1 0.6 7.9 2.8 1.8 0.0 3.3 3.1
Q26.My school building is neat, clean and well maintained. 34.4 13.8 48.3 64.2 10.0 18.6 2.4 1.6 4.4 1.9 0.5 0.0 3.2 2.9
Q27.
The halls, bathrooms, cafeteria and other common areas in my school are safe and orderly. 32.1 19.2 49.2 61.0 9.6 16.0 2.1 1.3 5.2 2.2 1.8 0.3 3.2 3.0
Q28.
When students at my school break the rules, staff members help them improve their behavior. 25.0 14.5 48.8 54.7 13.0 25.2 3.0 2.2 9.6 3.5 0.6 0.0 3.1 2.8
Q29.The staff at my school disciplines students fairly. 23.6 14.2 46.1 62.3 16.2 19.8 5.8 0.9 7.4 2.8 0.9 0.0 3.0 2.9
Diversity Strongly Agree Agree Disagree Strongly Disagree Not Sure Refused MeanMPCP MPS MPCP MPS MPCP MPS MPCP MPS MPCP MPS MPCP MPS MPCP MPS
Q30.My school teaches me to value, respect, and tolerate differences in others. 36.4 19.8 51.1 71.4 4.9 5.4 0.8 1.3 6.4 2.2 0.6 0.0 3.3 3.1
Q31.
My school treats all students with respect regardless of their race or ethnic background. 38.5 35.5 43.3 52.8 7.9 8.8 2.1 0.6 6.2 2.2 2.0 0.0 3.3 3.3
Q32.
The staff at my school promotes understanding among students with different backgrounds. 30.0 25.2 50.6 60.7 5.8 10.4 1.2 0.6 10.3 3.1 2.1 0.0 3.2 3.1
New Teachers Strongly Agree Agree Disagree Strongly Disagree Not Sure Refused MeanMPCP MPS MPCP MPS MPCP MPS MPCP MPS MPCP MPS MPCP MPS MPCP MPS
Q33.
My school makes sure that new teachers get the information they need to increase their chances for success. 30.5 20.8 43.6 61.3 2.7 9.4 1.1 0.3 21.5 8.2 0.6 0.0 3.3 3.1
Q34.Supporting new teachers is a highly valued goal at my school. 22.6 9.4 41.5 63.5 7.0 17.6 1.7 0.0 26.7 9.4 0.6 0.0 3.2 2.9
Q35.The people at my school are supportive of new teachers. 24.4 13.2 44.1 62.9 7.1 17.6 2.9 0.6 21.1 5.7 0.5 0.0 3.1 2.9
Note: In order to compute the means, Strongly Agree = 4, Agree = 3, Disagree = 2, Strongly Disagree = 1. The questions were reordered based on the MPCP mean values.

MPCP Longitudinal Educational Growth Study Baseline Report
63February 2008
MPCP Longitudinal Educational Growth Study Baseline Report
About the AuthorsJohn F. Witte is a Professor in the Department of Political Science and the Robert M. La Follette School of Public Affairs at the University of Wisconsin - Madison. He received his Ph.D. in political science from Yale University. He has been a fellow at the Russell Sage Foundation and at the Center for Advanced Study in the Behavioral Sciences. His latest book from Princeton University Press is The Market Approach to Education: An Analysis of America’s First Voucher Program.
Patrick J. Wolf is Professor of Education Reform and 21st Century Endowed Chair in School Choice at the University of Arkansas in Fayetteville. He also is principal investigator of the School Choice Demonstration Project. Wolf has authored, co-authored, or co-edited three books and nearly 30 articles and book chapters on school choice, special education, and public management. A 1987 summa cum laude graduate of the University of St. Thomas (St. Paul, MN), he received his Ph.D. in Political Science from Harvard University in 1995.
Joshua Cowen is a PhD candidate in political science at the University of Wisconsin-Madison, a graduate fellow in the Interdisciplinary Training Program in Education Sciences at the Wisconsin Center for Education Research, and a Research Fellow at the University of Arkansas Department of Education Reform. He has published research on school vouchers and has studies in progress on charter schools, teacher unionization, and compliance models in a professional development intervention for teachers in a large urban school district. He has recently accepted an offer to join the faculty of the Martin School of Public Policy at the University of Kentucky.
David Fleming is a doctoral candidate in the Department of Political Science, and a graduate research fellow in the Interdisciplinary Training Program in Education Sciences at the University of Wisconsin-Madison. His dissertation project examines the effects of vouchers on recipients’ political participation and attitudes. His research interests include public policy, political behavior and quantitative methods.
Juanita Lucas-McLean is a Senior Study director at Westat located in Rockville, Maryland. She has more than 30 years of experience in survey research, project management, program evaluation and qualitative analysis. Ms. Lucas-McLean has managed data collection for several large-scale national surveys funded by federal agencies including the Department of Education, the Department of Labor, and the Department of Agriculture. She has a B.A. from Syracuse University and a M.S.W. from Howard University.

School Choice Demonstration Project
Department of Education Reform
University of Arkansas
201 Graduate Education Building
Fayetteville, AR 72701
479-575-6345
http://www.uark.edu/ua/der/SCDP/Research.html