mozambique - artisanal fisheries development project ... · 1 completion report of project...
TRANSCRIPT

SCCD: F.S.
AFRICAN DEVELOPMENT FUND ADF/BD/IF/2012/180 30 October 2012 Prepared by: OSAN Original: English
Probable date of Board Presentation Not applicable
FOR INFORMATION
MEMORANDUM
TO : THE BOARD OF DIRECTORS FROM : Cecilia AKINTOMIDE Secretary General SUBJECT : MOZAMBIQUE: ARTISANAL FISHERIES DEVELOPMENT PROJECT PROJECT COMPLETION REPORT *
Please find attached the above-mentioned Report.
Attach: Cc: The President
* Questions on this document should be referred to:
Mr. C. OJUKWU Director ORSB Extension 2042 Mr. A. BEILEH Acting Director OSAN Extension 2037 Mr. K. B. JOHM Manager OSAN.4 Extension 2468 Mr. F. MARTIN Task Manager OSAN.4 Extension 2510

1
COMPLETION REPORT of PROJECT P-MZ-AAF-001
A. PROJECT DATA AND KEY DATES
I. BASIC INFORMATION Project Number Project Name Country (ies)
P-MZ-AAF-001 Artisanal Fisheries Development Project Mozambique
ID Number of all Lending Instrument(s) Department Environmental Classification
ADF Loan 2100150006688 TAF Grant 2100155001708
Agriculture and Agro-Industry
II
Original Commitment Amount Amount Cancelled Amount Disbursed Percent Disbursed
UA Million ADF Loan 14,17 TAF Grant 1,73 Total 15,90
"UA Million" 5,00 0,57 5,57
"UA Million" 7,09 1,16 8,25
% 50% 67% 52%
Borrower
Government of Mozambique
Executing Agency(ies) [List the main Ministries, Project Implementation Units, Agencies and civil society organizations responsible for implementing project activities.]
Sector Ministry: Ministries of Fisheries (MOF) Executing Agency: Institute for Small-scale Fisheries Development (IDPPE), with the support of Fisheries Research Institute (IIP) and Fisheries Development Fund (FFP)
Co-financers and other External Partners [List all other sources and amounts of financing, technical assistance or other resources used in this project]
UA Million UA Million
ADF Loan TAF Grant Total ADF Loan TAF Grant Total
Gov. of Mozambique 1,91 0,10 2,01 0,94 - 0,94 47%
Beneficiaries 0,61 - 0,61 - - - 0%
Total 2,52 0,10 2,62 0,94 - 0,94 36%
II. KEY DATES
Project Concept Note Cleared by Ops. Com. Appraisal Report Cleared Board Approval
14/11/2001
Restructuring(s)
Original Date MM/DD/YY
Actual Date MM/DD/YY
Difference in months
EFFECTIVENESS Loan Grant
4 April 2002 28 March 2002
10 October 2003 10-October 2003
18,5 18,7
MID-TERM REVIEW 3 April 2005 Not done
CLOSING
Loan Grant
31 December 2008 31 December 2006
For ongoing projects enter date of 98% disb.
rate
36,5 48,7
31 December 2011 31 December 2010

2
III. RATINGS SUMMARY
Insert notes from the relevant tables in the different sections of the PCR. For example, please insert the “Overall Output score” in Section D.I. in the “Achievement of Outputs” box below.
CRITERIA SUB-CRITERIA RATING
PROJECT OUTCOME
Achievement of Outputs 1
Achievement of Outcomes 1
Timeliness 1
OVERALL PROJECT OUTCOME
1
BANK PERFORMANCE
Design and Readiness 3
Supervision 2
OVERALL BANK PERFORMANCE ]
3
BORROWER PERFORMANCE
Design and Readiness 2
Implementation 1
OVERALL BORROWER PERFORMANCE
2
IV. RESPONSIBLE BANK STAFF
POSITIONS AT APPROVAL AT COMPLETION
Regional Director N/A Mr. Chiji Ojukwu
Sector Director Mr. G. Giorgis Mr. Abdirahman Beileh
Sector Manager Mr. S. Moussa Mr. Ken B. Johm
Task Manager Mr. W Hara Mr. Felix Marttin
PCR Team Leader Mr. Cesar Tique
PCR Team Members
Mr. Joel Muzima (Economist/Financial Sector - MZFO), Mr. Evaristus Kwame Kuatsinu (Consultant Infrastructure Engineer) , Dr. Amadou Tall( Consultant Fisheries Specialist)

3
B. PROJECT CONTEXT
Summarize the rationale for Bank assistance. State: -what development challenge the project addresses, -the Borrower's overall strategy for addressing it, -Bank activities in this country (ies) and sector over the past year and how they performed, and -ongoing Bank and other externally financed activities that complement, overlap with or relate to this project. Please cite relevant sources. Comment on the strength and coherence of the rationale.
[250 words maximum. Any additional narrative about the project's origins and history, if needed, must
be placed in Annex 6: Project Narrative]
(i) The challenge to reduce the 72% rural poverty level for coastal areas include, (a) an unmanaged fisheries resource, (b) poor access to good markets, which depresses incomes, and (c) low levels of capital and relative high cost of equipment . (ii) Poverty reduction is the overarching objective in the formulation of any development strategy in Mozambique. For the coastal provinces, the priority is support to the artisanal fisheries sector.[Fisheries Master Plan (1996-2005), PARPA I and others), the objectives being improvement of domestic fish supply; increase in foreign exchange earnings; and improving the standard of living of fishing communities. (iii) Overall performance of the four Bank rural development sector projects was satisfactory CPR 1996 and CPR 2005. Average age and disbursement in 2011, was 7.3 years and 32.% respectively CSP 2011-2015 (iv) The main complementary project include the IFAD/OPEC Fund -supported NAFP, and four smaller ones - Fishing and Fish Marketing rehabilitation, Lake Niassa; Artisanal Fishery Development, Palma District; Economic Promotion of Artisanal Fisheries, and Small-scale Off-shore Fishery Capacity Rehabilitation, Inhambane Province. (v) The rationale is coherent. The single strongest factor for the proposed project is the vast amount of untapped fish resource which are currently 86% in the project area. The project design is based on integrated approach and adherence to the GOM policy on poverty reduction; and targets a sector with higher employment opportunities, lower ecological impact, higher versatility shallow draft, using small-scale fishing boats and operating at lower construction costs and less expensive technology.
C. PROJECT OBJECTIVES AND LOGICAL FRAMEWORK
1. State the Project Development Objective(s) (as set out in the appraisal report) The sector goal is to increase incomes of fishers’ and their communities, fish traders and input suppliers thereby contribute to reduction of poverty, enhance food security and marine environment conservation and protection. The project objective is to increase fish production by supporting artisanal fishers in the project area by enabling them to catch, process and market fish more efficiently.
2. Describe the major project components and indicate how each will contribute to achieving the Project Development Objective(s).
The Artisanal Fisheries Development Project (AFDP) project consisted of three components:
(i) Provision of Credit to boost fish production and promote fish marketing: by (a) encouraging the adoption of improved fishing boat and gear technology and methods to ensure more efficient fishing by artisanal fishers, and supply of boats and nets through the operations of boat builders and net makers; and (b) improving marketing facilities for the establishment of ice plants, insulated fish and ice holding facilities around landing sites, ice boxes, a simple fish packaging materials plant, and acquisition of transport facilities - refrigerated trucks and pickups.
(ii) Provision of community infrastructure: Mainly access roads from landing sites to main roads, potable water supply wells with pumps, fish reception and cleaning. This was to improve fish reception, cleaning and processing into salted, dried and smoked products, packaging, adequate conservation (cold storage, insulated boxes), improve the transportation of fish and other inputs, and support local authorities by rebuilding market infrastructure at two important fish markets. The project was to maintain all but the access roads for a year prior to turning them over to the management committees with GOM undertaking to maintain the roads.

4
(iii)Strengthening institutional capacity: Consisting of (a) establishment of a PCU within IDPPE; (b) operational capabilities of implementing institutions (IDPPE, IIP, DPP) including training (long- and short-courses/training), technical assistance for credit management and market studies, transport facilities, and office and other equipment, a new IDPPE provincial office building; and (c) organising and preparing beneficiary communities and relevant authorities to better manage the fish complex, landing sites and water wells provided by the project thereby enhancing sustainability.
3. Provide a brief assessment (up to two sentences) of the project objectives along the following 3 dimensions. Insert a working score, using the scoring scale provided in Appendix 1.
PROJECT OBJECTIVES DIMENSIONS ASSESSMENT WORKING SCORE
RELEVANT a) Relevant to the country's development priorities
The project is relevant to Mozambique's development priorities. The PRS/PARPA (2001-2005) recognised Fisheries as an important sector in the struggle against poverty and the promotion of economic growth, the objective for traditional fishing being improved use of marketable surplus from traditional fishing and raising the quantity and quality of production and income. Follow-on PRSs are built along the above strategies and objectives. For example the PARPA II (2006-2009) strategy is (i) increasing and/or rehabilitating infrastructures; (ii) increasing the supply of domestic fish to the internal market; (iii) encouraging the distribution and marketing of fish and fishery inputs
4
ACHIEVABLE
b) Objectives could in principle be achieved with the project inputs and in the expected timeframe
The objectives of the Project could be achieved in the project time frame and financial resources. However the project got bogged down by weak management capacity, location of PCU in Maputo, and issues of procurement, disbursement, and slow decision cycles.
2
CONSISTENT
c) Consistent with the Bank's country or regional strategy
The proposed project is consistent with the Bank Group strategy for Mozambique geared towards supporting increased economic infrastructure; assistance towards capacity building and improvement of the competitiveness of the private sector through the development of the infrastructures.
4
d) Consistent with the Bank's corporate priorities
The objectives of the project are consistent with the Bank Group’s vision in promoting good governance, private sector development, and support for interventions with strong synergies from previous interventions
4
. Summarize the log. frame. If a log. frame does not exist, complete the table below, indicating the overall project development objective, the major components of the project, the major activities of each component and their expected outputs, outcomes, and indicators for measuring the achievement of outcomes. Add additional rows for components, activities, outputs or outcomes if needed.

5
COMPONENTS ACTIVITIES OUTPUTS EXPECTED OUTCOMES
INDICATORS TO BE MEASURED
1. Credit to boost fish production and marketing
1.1 Provide credit for boats, gears and equipment
1.1) 300 wooden boats with improved sail, 100 wooden boats with motor, 110 new wooden boats & 60 GRP boats
Fish landing raised to 8800 MT/year by PY7
Incremental annual fish landing (in MT/year) by PY7
1.2 Provide credit for transport/marketing, ice plants and cold-rooms
1.2.1) Provide 10 ice plants, 5 trucks and 10 pickups for fish traders
Income of small-scale fishers and traders raised by 50% by PY3; and 100% by PY10
Percentage increase in income of small-scale fishers and traders by PY3; and by PY7
2. Community infrastructure
2.1 Rehabilitate fish markets(Montepuez, Nampula)
2.1) 2 fish markets rehabilitated 25 new fish traders and suppliers engaged in fish business by PY6
No. of new fish traders and suppliers engaged in fish business by PY6
2.2 Construct fish handling infrastructure 2.3 Rehabilitate access roads and wells
2.2) 15 landing sites constructed 2.3) 220km roads rehabilitated 2.4) 20 wells rehabilitated, 40 new wells constructed
3. Institutional Capacity Strengthening
3.1.1 Establish the PCU, Provide equipment and vehicles
3.1.1) PCU established as loan condition
3.1) Efficient and smooth project implementation
Quantity, quality and timeliness of reports and activities
3.1.1 Establish the PCU, Provide equipment and vehicles 3.2.2 Train staff for rural technical assistance 3.2.3 Construct a new IDPPE office at Pemba 3.3.2 Conduct a socio-economic and gender analysis, mobilise and organise beneficiary communities 3.3.3 Demonstrate fishing gears & methods, Train fishers for marine environment protection
3.2.1) TA and members recruited 3.2.2) IIP branch office & DPP established 3.2..3) New regional IDPPE office built 3.3.2) 60 committees formed and trained 3.3.3) 20 000 fishers and traders trained
3.2 Operational capabilities of IDPPE, IIP strengthened and DPP establishment supported 3.3.2 Beneficiaries better able to manage the infrastructure provided by the project, plan and implement community development projects
3.3.2 Percentage of community managed facilities

6
5. 5. For each dimension of the log. frame, provide a brief assessment (up to two sentences) of the extent to which the log. frame achieved the following. Insert a working score, using the scoring scale provided in Appendix 1. If no log. frame exists, score this section as a 1 (one).
LOG. FRAME DIMENSIONS ASSESSMENT WORKING SCORE
LOGICAL
a) Presents a logical causal chain for achieving the project development objectives
The project log frame presented a framework of activities, financial inputs, outcomes, indicators, targets and assumptions/risks with a general logical link to the project development objectives. However outcomes are not well linked to outputs e.g. outcomes such as cost savings resulting from the provision of roads, and time and health benefits from the provision of wells were not included
2
MEASURABLE
b) Expresses objectives and outcomes in a way that is measurable and quantifiable
Although the project objective contained no quantity, the three key outcomes were defined with targets and time frame
3
THOROUGH c) States the risks and key assumptions
The log frame mentioned risks/assumptions which were also discussed in the appraisal report including poor terms of trade and their effect on the investment climate for fishing and fish marketing, shortage of IDPPE technical capacity and the additional work load that extensionists on the project had to undertake, and poor and ineffective road maintenance. Delays in implementation were not mentioned.
2
D. OUTPUTS AND OUTCOMES
I. ACHIEVEMENT OF OUTPUTS In the table below, assess the achievement of actual vs. expected outputs for each major activity. Import the expected outputs from the log. frame in Section C. Score the extent to which the expected outputs were achieved. Weight the scores by the activities' approximate share of project costs. Weighted scores are auto-calculated by the computer. The overall output score will be auto-calculated as the sum of the weighted scores. Override the auto-calculated score, if desired, and provide justification.
MAJOR ACTIVITIES Working Score
Share of Project Costs in percentage (as stated in
Appraisal Report)
Weighted Score
Expected Outputs Actual Outputs
1.1) 300 wooden boats with improved sail, 100 wooden boats with motor, 110 new wooden boats & 60 GRP boats
Project delivered less than 40% of boats: 53 (18%) wooden boats with improved sail; 75 (75%) wooden boats with motor; 85(77%) new wooden boats. Supply was based on demand-driven principles, and targets may have been overestimated; and no GRP boat could be supplied because the only company in the country to produce them stopped business. A revised logframe in 2007 adjusted these targets to 54 new boats with sail, 22 boats with motor and 85 boats to reflect this fact and reallocate funds to community infrastructure whose budget was considered inadequate
1 19,7 0.20
1.2) 10 ice plants, 5 trucks and 10 pickups provided to fish traders
6 (60%) block- ice plants & 6 (60%) pickups supplied i.e. no trucks. Target reduced to 6 ice-plants & 2 pickups and no trucks for same reasons as for Output 1.1 above
2 20.5 0.41

7
2.1) fish markets rehabilitated
Project rehabilitated 3(150%) fish markets 2 in Montepuez and Pemba (CB province) and 1 in Carrapea (Nampula). Envisaged 1 year operation by project not effected. Revised log-frame stuck to target but a third market was later added following strong local government demand. Due to on-going development by private entrepreneur, proposed fish processing centre in Memba was cancelled in 2005
2 4.0 0.08
2.2) 15 landing sites constructed
11 open market facilities/sheds built close to landing sites without cold rooms, standby generator, landing or sanitary facilities. About half do not have potable water source (well) nor ice making machine. They do not comply with internationally accepted/best-practice landing site sanitary standards. The shed is made up of a block of 80 m2 floor space containing an open area with concrete tables, and 2 small rooms - office and store. Non was in operation mainly because modalities were not ready. Revised log-frame stuck to target
2 3.4 0.07
2.3) 220km roads rehabilitated
171 km (78%) rehabilitated. No maintenance undertaken since completion. Revised log-frame reduced target to 190 km
2 11.6 0.23
2.4) 20 wells rehabilitated, 40 new wells constructed
40 (67%) wells (14 new and 26 rehabilitated). Revised log-frame stuck to target but last 20 because procurement delayed and contractor could not raise required bank guarantee.
3 1.4 0.04
3.2.2) IIP branch office & DPP established
Vehicles and equipment supplied and offices operational 4 1.1 0.04
3.2..3) New regional IDPPE office built
Not built. Engineering design done because land could only be secured from Provincial Authorities on the third attempt, in late 2010 leaving little time to construct. Two attempts were thwarted by protracted land disputes. Estimated cost rose from UA 80,000 at appraisal to UA710,000
1 0.5 0.01
3.3.2) 60 committees formed and trained
367 committees formed and trained and functional.
4 2.4 0.10
3.3.3) 20 000 fishers and traders trained
15,078: Trainings in group creation of association (1715), PCR/revolving savings and credit (3160), Co-Management (1552), Best fishing practices, including traditional practices (2460), fishing technology (769), fishing gear use (518), and Naval carpentry (54), and in Business Management (115), Infrastructure committees (235), Trained by Co-Management committees 4500. The high number of trainees is explained by the fact the same participants is counted as many as numbers of modules he attended
4 5.1 0.20

8
OVERALL OUTPUT SCORE [Score is calculated as the sum of weighted scores]
0
Check here to override the calculated score
Provide justification for over-riding the calculated score
Insert the new score or re-enter the calculated score 0
II. ACHIEVEMENT OF OUTCOMES
1. Using available monitoring data, assess the achievement of expected outcomes. Import the expected outcomes from the log. frame in Section C. Score the extent to which the expected outcomes were achieved. The overall outcome score must be calculated as an average of the working scores. Override the calculated score, if desired, and provide justification.
OUTCOMES Working Score Expected Actual
1) Fish landing raised to 8800 MT/year by PY7 24,017 MT recorded in 2011(2.7 times goal) for all boats (about 9000) in the
two Provinces [IDPPE Atlas Artisanal em Moçambique]. Project introduced
only 213 boats (less than 40% of number envisaged and 3% of total fleet)
1
2) Income of small-scale fishers and traders
raised by 50% by PY3; and 100% by PY10
In 2011 fisherman income is MZN 700,000/yr and less than 50% in 2001 2
3) 25 new fish traders and suppliers engaged in
fish business by PY6
357 fish small traders benefitted from loans (US$ 609,791) to increase their
business, although few (less than 10) of them may be considered as new to
the business
1
OVERALL OUTCOME SCORE [Score is calculated as an average of the working scores]
0
Check here to override the calculated score
Provide justification for over-riding the calculated score
Insert the new score or re-enter the calculated score 0
2. Additional outcomes. Comment on the project's additional outcomes not captured in the log. frame, including cross-cutting issues (e.g., gender).
(a) The undergraduate and graduate courses undertaken by senior staff of IDPPE and IIP, the 12 extension officers recruited and trained and the project planning, monitoring and evaluation tools and systems developed under the project have all boosted the operational capabilities of these institutions especially at the provincial levels who now undertake project cycle activities with little supervision from head office. Further capacity will be developed in time with construction of the IDPPE Pemba Provincial office and the market studies which could not be undertaken (methodology for catching deep-water demersals in Northern Nampula, management regimes for sustainable lobster exploitation and maximised export, developing the market for fish products). (b) The establishment and strengthening of associations had the potential to help improve self-governance, providing the basis for fishers to initiate and become actively involved in a wide range of rural development projects. The training activities included best fishing practices (2460), fishing technology (769), fishing gear use (518), Naval carpentry (54), Business Management (115), and PCR/revolving savings and credit (3160). Groups have also been facilitated and trained. It is anticipated that local authorities expedite action on the management agreements with the Infrastructure committees (235) for them to operate the facilities provide under the project. (d) The roads constructed (labour-based) created employment for communities along the route and will reduce travel times and transport costs, reduce post-harvest losses and enhance fishers' incomes (e) Modest gains were made on the gender front with 4% of the credit portfolio representing 8% of clients being for women engaged in fish marketing. It is anticipated that with further efforts women will be empowered to venture take credit for other activities such as fishing gear, and fish processing; gillnet construction, clay pot technology; and gain representation on the Infrastructure Committees. The highest women representation (36%) is in the PCR/Revolving savings and credit groups [Indicadores beneficiarios 2011].

9
3. Risks to sustained achievement of outcomes. State the factors that affect, or could affect, the long-run or sustained achievement of project outcomes. Indicate if any new activity or institutional change is recommended to help sustain outcomes. The analysis should draw upon the sensitivity analysis in Annex 3, where appropriate.
(a) The sound management of the project infrastructures is crucial to the success and sustainability of the project. However, local authorities are yet to decide on modalities for community management of these facilities - the markets and ice making plants are not operational, and roads are not being maintained; (b) The continuation of research activities of IIP and the continued availability of scientific data and information on the status of fish stocks would allow for informed management decisions and measures to conserve fish populations and harvest within their regenerative capacities and should be complemented. The project sensitized fishermen on the need to combat Illegal, Unreported, Unregulated (IUU) fishing through reporting on poachers coming from Tanzania by regular surveillance activities to deter, curb and eventually eliminate IUU fishing and the new IFAD program covering the different landing sites along the coast will secure funds for data collection and also the MSC thereby curbing down IUU fishing; (c) Environmental conservation and management will also contribute to the sustainability of the project outcomes.
E. PROJECT DESIGN AND READINESS FOR IMPLEMENTATION
1. State the extent to which the Bank and the Borrower ensured the project was commensurate with the Borrower’s capacity to implement by designing the project appropriately and by putting in place the necessary implementation arrangements. Consider all major design aspects, such as extent to which project design took into account lessons learned from previous PCRs in the sector or the country (please cite key PCRs); whether the project was informed by robust analytical work (please cite key documents); how well Bank and Borrower assessed the capacity of the implementing agencies and/or Project Implementation Unit; scope of consultations and partnerships; economic rationale of project; and provisions made for technical assistance. -
[200 words maximum. Any additional narrative about implementation should be included at Annex 6:
Project Narrative]
1. Consultations/Partnerships/Analytical Work: The project preparation process took place between 1998 and 2001 and included an FAO Investment Centre project identification and preparation phases and a Bank Appraisal mission. The PAR indicates a participatory design approach. However the 5 year gestation period may have negated relevance of information/consultations undertaken. 2. Lessons learnt/Assessment of Capacity of implementing agencies/Technical Assistance: The design was built mainly on the experiences and lessons drawn from the on-going Nampula Artisanal Fisheries Project financed by IFAD in the Southern part of Nampula province. However no reference was made to recommendations in Bank's CPRs (e.g. for 1996 and 2001) which recognised amongst others the language problem, non-availability of counterpart staff, poor retention of experienced and trained staff and the need for frequent training in procurement and financial management. Consequently the PCU was located away from the project area limiting its general implementation and procurement functions and not enough provision made for its staffing and TA support. 3. Economic Rationale of project: The project was designed to contribute to GOMs policy of poverty reduction from 70% in 1997 to 50% by 2009 [PARPA (2001-2005)] with promotion of artisanal fisheries as the main strategy for the rural poor inhabiting the coast.
2. For each dimension of project design and readiness for implementation, provide a brief assessment (up to two sentences). Insert a working score, using the scoring scale provided in Appendix 1.
10
PROJECT DESIGN AND READINESS
FOR IMPLEMENTATION DIMENSIONS
ASSESSMENT WORKING
SCORE
REALISM
a) Project complexity is matched with country capacity and political commitment.
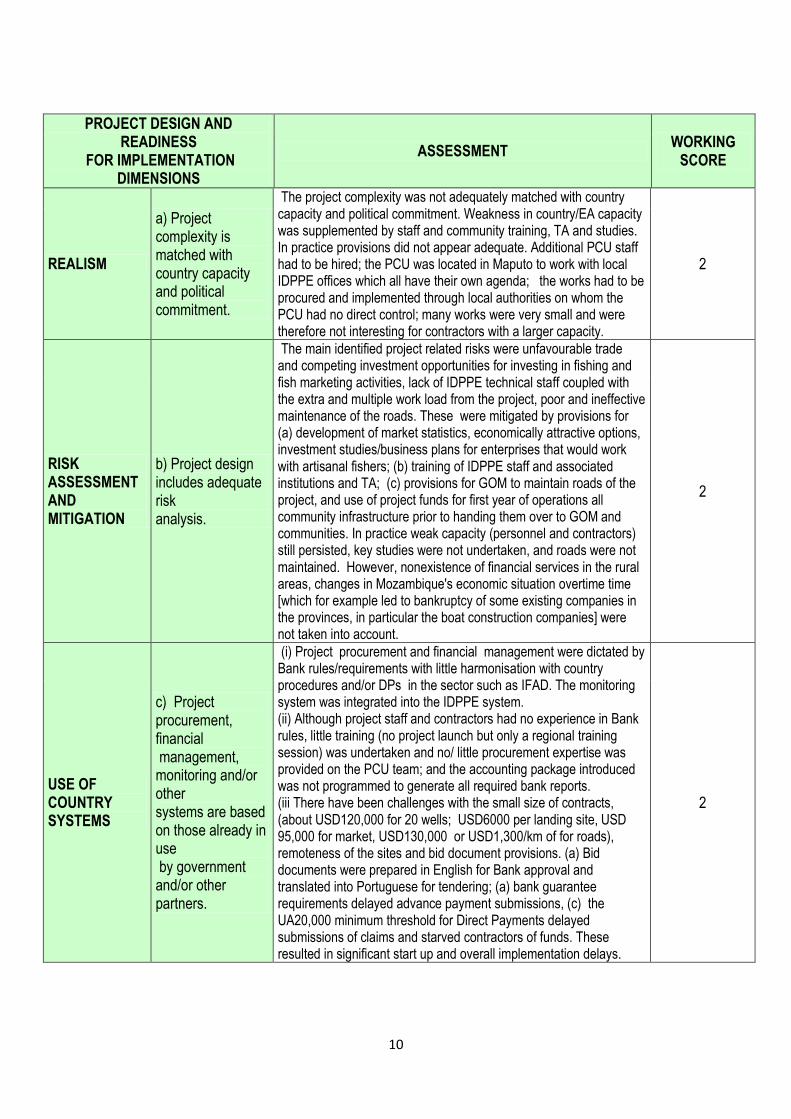
The project complexity was not adequately matched with country capacity and political commitment. Weakness in country/EA capacity was supplemented by staff and community training, TA and studies. In practice provisions did not appear adequate. Additional PCU staff had to be hired; the PCU was located in Maputo to work with local IDPPE offices which all have their own agenda; the works had to be procured and implemented through local authorities on whom the PCU had no direct control; many works were very small and were therefore not interesting for contractors with a larger capacity.
2
RISK ASSESSMENT AND MITIGATION
b) Project design includes adequate risk analysis.
The main identified project related risks were unfavourable trade and competing investment opportunities for investing in fishing and fish marketing activities, lack of IDPPE technical staff coupled with the extra and multiple work load from the project, poor and ineffective maintenance of the roads. These were mitigated by provisions for (a) development of market statistics, economically attractive options, investment studies/business plans for enterprises that would work with artisanal fishers; (b) training of IDPPE staff and associated institutions and TA; (c) provisions for GOM to maintain roads of the project, and use of project funds for first year of operations all community infrastructure prior to handing them over to GOM and communities. In practice weak capacity (personnel and contractors) still persisted, key studies were not undertaken, and roads were not maintained. However, nonexistence of financial services in the rural areas, changes in Mozambique's economic situation overtime time [which for example led to bankruptcy of some existing companies in the provinces, in particular the boat construction companies] were not taken into account.
2
USE OF COUNTRY SYSTEMS
c) Project procurement, financial management, monitoring and/or other systems are based on those already in use by government and/or other partners.
(i) Project procurement and financial management were dictated by Bank rules/requirements with little harmonisation with country procedures and/or DPs in the sector such as IFAD. The monitoring system was integrated into the IDPPE system. (ii) Although project staff and contractors had no experience in Bank rules, little training (no project launch but only a regional training session) was undertaken and no/ little procurement expertise was provided on the PCU team; and the accounting package introduced was not programmed to generate all required bank reports. (iii There have been challenges with the small size of contracts, (about USD120,000 for 20 wells; USD6000 per landing site, USD 95,000 for market, USD130,000 or USD1,300/km of for roads), remoteness of the sites and bid document provisions. (a) Bid documents were prepared in English for Bank approval and translated into Portuguese for tendering; (a) bank guarantee requirements delayed advance payment submissions, (c) the UA20,000 minimum threshold for Direct Payments delayed submissions of claims and starved contractors of funds. These resulted in significant start up and overall implementation delays.
2

11
For the following dimensions, provide separate working scores for Bank performance and Borrower performance:
WORKING SCORE
Bank Borrower
CLARITY
d) Responsibilities for project implementation were clearly defined.
Responsibilities for project implementation were clearly defined. (a) A PCU established in IDPPE for co-ordination and implementation of project activities, monitoring the process of organising beneficiaries into associations and committees, design and implementation of the gender analysis report, gender sensitisation training; assisting borrowers through technical advice and in preparing loan applications), assisting MFIs in the technical appraisal of the loans (b) Provincial IDPPE extension staff to provide Fisheries extension and training (c) Under an MOU with IDPPE, the Fisheries Research Institute (IIP) was to undertake resource assessment and monitoring, and the Provincial Fishery Service Directorate, fishery statistics and regulation. (d) FFP to manage credit funds on behalf of Government and on-lend to MFIs; with the assistance of the PCU, verify that loan requests are for fishery related activities in the Project area, and arrange the release of funds from BOM. Each MFI was to be responsible for preparing eligibility criteria within the target groups, and recovery of the credit amounts from beneficiaries. (e) Project Steering Committee for coordination and oversight of project activities-the MOF Consultative Council for policy support and overall co-ordination at the central level, IDPPE’s Consultative Council to oversee project operations and implementation; and a provincial coordination committee to be established to oversee project activities.
4 4
PROCUREMENT READINESS
e) Necessary implementation documents (e.g. specifications, design, procurement documents) were ready at appraisal.
No detailed designs nor completed bid documents were available at appraisal. Sketch designs for the landing sites and markets are those contained in the Strategic Plan, 2006 - 2015. Detailed designs for all but the last market and landing site (which were done through TA) were undertaken by the PCU Civil Engineering Assistant, and roads by the Provincial Roads Administration's (ANE) consultancy firm. Portuguese versions of Standard Bank Bid documents were used for tender, and English versions for Bank approval. No procurement plans were required at the initial stage of the project, and the MZFO did not exist when the project was establish which made it difficult for project staff to understand the Bank's fiduciary requirements.
2 2

12
MONITORING READINESS
f) Monitoring indicators and monitoring plan were agreed upon before project launch.
The only monitoring indicators before or at project start are those contained in the PAR log-frame. There was no project launch. With project support IDPPE developed the planning framework by Dec-03, and operationalized the M&E system in 2005. Income from small-scale fishers was however not tracked. With TA support the project prepared an ESMP in 2010, which could only partially be implemented. The absence of a Mid-Term review of the project was a major draw-back since necessary adjustments to the changes occurring in the country during project implementation, could not be addressed adequately and in a timely fashion.
2 2
BASELINE DATA
h) Baseline data were available or are were collected during project design.
Available data at or during project design, were those contained in the FAO/IC November/December 1998 identification and December 2000 preparation reports commissioned by the Bank. A baseline report was prepared with TA support in Dec-06, 3 years after effectiveness
3 1
F. IMPLEMENTATION
1. State the major characteristics of project implementation with reference to: adherence to schedules, quality of construction or other work, performance of consultants, effectiveness of Bank supervision, and effectiveness of Borrower oversight. Assess how well the Bank and the Borrower ensured compliance with safeguards.
[200 words maximum. [Any additional narrative about implementation should be included at Annex 6:
Project Narrative.]
(a) The project has not implemented what it had to do to have fishers change their mode of operation - go further off shore, to stocks which would be located by experimental fishing. Overall schedules were also not complied with - the project original loan closing date of 2008 had to be extended to 2011. (b) The quality of the road works in relation to the adopted standard is fair, but that for the fish markets/landing sites is mixed - some of the joints in the roof trusses are not braced adequately. (c) Credit recovery rates by MFIs were generally low (30-40%); GAPI had the biggest share (44%) of the credit portfolio, FFPI, 28% and AMODER 18%. More than 50% of AMODER's portfolio was related to non-fish production and was cancelled. [Aide Memoire, July 2011]. (d) Bank supervision was intense but often not always multi-disciplinary ( different expertise) enough to address all the project management-related issues; both GOM and Bank complied with most of the safeguards; and PSCs (central and provincial) met regularly to discharged their duties. [Aide Memoire, Dec-10]. Cancellation of the project MTR was a major draw-back.
2. Comment on the role of other partners (e.g. donors, NGOs, contractors, etc.). Assess the effectiveness of co-financing arrangements and of donor coordination, if applicable.

13
(a) Co-financiers of the project were GOM and beneficiaries. GOM was to contribute UA 2.01 million (11% of the project total cost) to cover salaries of local project staff, office rentals and utilities for the PCU and operating costs, in addition to taxes and duties amounting to UA2.71 million. Contribution of beneficiaries was estimated to be UA0.61 million (4% of the project total cost) through paying 10% of the cost of the items given on credit. (d) After the establishment of the Mozambican Field Office the Bank start to attend the National Fishery Coordination meeting and attended the Fishery Donor Coordination meetings (b) GOM's counterpart funding contribution (about UA 0.87 million (43% of PAR estimates) was irregular and inadequate; and poverty levels of beneficiaries, made general application of the 10% counterpart fund requirement unworkable. MFIs rather required guarantees in the form of property or the items for which the credit was sought. Lately however, to reduce the risks of non-payment, MFIs require 30% advance on the credit and requiring collateral in the form of vehicles and goods which have some market value, instead of the houses, which may not be easily disposed of. (c) The project signed an MOU with the WWF-supported Quirimbas National Park (QNP) for sustainable management of resources and environmental protection, allowing for harmonized data collection methodologies. (d) After the establishment of the Mozambican Field Office the Bank started to attend the National Fishery Coordination and the Fishery Donor Coordination meetings
3. Harmonization. State whether the Bank made explicit efforts to harmonize instruments, systems and/or approaches with other partners.
The project design is based on an approach which is coherent across the sector, harmonized with key donors (mainly IFAD). However, Bank rules and procedures were applied. There were no formal project coordination/management fora of donors in the sector.
4. For each dimension of project implementation, assess the extent to which the project achieved the following. Provide a brief assessment (up to two sentences) and insert a working score, using the scoring scale provided in Appendix 1.
PROJECT IMPLEMENTATION DIMENSIONS
ASSESSMENT WORKING
SCORE
TIMELINESS
a) Extent of project adherence to the original closing date. If the number on the right is: below 12, "4" is scored between 12.1 to 24, "3" is scored between 24.1 to 36, "2" is scored beyond 36.1, "1" is scored
Difference in months between original closing date and actual closing date or date of 98% disb. rate.
The project is ending having been implemented in 51% more time than planned, but with some community infrastructure not concluded because of contractor's cash flow problems or cancelled; and fish market/landing sites not operational
1
48.7

14
BANK PERFORMANCE
b) Bank complied with:
Environmental Safeguards
The PAR mission included a Bank Environmentalist who classified the project according to the Bank ESA Guidelines, prepared an ESMP summary, and made provisions for a full ESMP to be prepared by the project in collaboration with MICAO and subject to Bank approval [Para 4.7.4 of PAR]. In practice the ESMP was prepared late
2
Fiduciary Requirements
The Bank ensured that its fiduciary rules and procedures were adhered to especially in connection with operations of the various Bank Accounts and auditing. It fielded an audit mission, took measures including suspension of payments (thrice) for delays in submission or queries arising from audit reports. Although there was no project launch, the Bank made arrangements for three key PCU staff to participate in the Bank organized Swaziland National Workshop on Project Implementation, from 20 June to 01 July 2005. Generally however the long delays (in the processing of documents between the project and Bank and payments) also adversely affected fiduciary issues [E.g. . Sep-07 aide memoire on disbursement and Dec-08 on AWPB approval]
0
Project Covenants
The Bank ensured compliance with most of the loan conditions except that it could not enforce one of the conditions precedent to first disbursement (undertaking to maintain the access roads)
3
c) Bank provided quality supervision in the form of skills mix and practicality of solutions
The Bank undertook 2.1 supervision missions per year (13 No. between Jan-05 to May-10) including an audit mission in 2008. PAR specified ate least one per year. However there was no launching nor MTR because, the recruitment process for the TA for preparation of project's MTR report could not be concluded eagerly enough to undertake the MTR mission. PCU has complained of significant delays in and reversals of decisions by the Bank. The skills mix was not always adequate. Missions were composed of experts in the fishery sector (16%), agriculture etc.(33%), finance/procurement (18%), social (16%), engineering(4%) and Manager (13% ) not to mention audit. The missions would have benefited from inclusion of environmental and gender experts.
3
d) Bank provided quality management oversight
Supervision missions from the Bank provided the necessary support and guidance to Project management to effectively implement the project.
3

15
BORROWER PERFORMANCE
e) Borrower complied with:
Environmental Safeguards
The Provincial Directorates for Coordination of Environmental Affairs (MICAO) monitored the implementation of project. Borrower did not comply with the environmental safeguards as described in the PAR - the ESMP was only finalised in 2009, and an MoU between the project and the WWF-supported Quirimbas National Park (QNP) for sustainable management of resources and environmental protection were only concluded in 2009 leaving little time and resources for implementation.
2
Fiduciary Requirements
Fiduciary requirements were complied with but there have been weaknesses with regard to adherence to standards especially in the provinces, requiring auditor's and Bank intervention to redress. 3 of the 7 audit reports on the SA for the Loan and Grant were submitted late and late submission of audit reports and audit queries on the credit account, especially have, lead to suspension of payments (thrice). Recommendations of audit reports have generally been acted on. GOM's counterpart funding contribution was irregular and inadequate. For example only 4% of requirements was met in 2008. In total counterpart contribution is about UA 0.94 million (47% of PAR estimates)
1
Project Covenants
GOM complied with most of loan conditions namely evidence of establishment of the PCU, national and provincial coordination committees, on-lending agreements with FFP and opening of the various special accounts. However it provided no formal undertaking to and did not maintain the access roads. The Other Conditions (agreement with IIP, recruitment of TA, payment of counterpart funds) were also complied with but schedules were not adhered to
2
f) Borrower was responsive to Bank supervision findings and recommendations
The Government generally acted on Bank's supervision mission findings and recommendations although generally not to agreed schedules[as in March 2006 aide memoire for example]
01
g) Borrower collected and used monitoring information for decision making
a) Collection and use of monitoring information for decision making on the project was undertaken but not in an organized fashion or always gender disaggregated. With project support IDPPE developed the planning framework by Dec-03, and operationalized the M&E system in 2005. Income from small-scale fishers was not tracked. (b) The 3 planned market studies were not undertaken. The exploratory study on the fishing ground and appropriate fishing vessels could not be done because no specialist vessel was available for hire and Bank support for purchasing one was not available. Although the PCU indicated that a IIP had undertaken a lobster stock assessment study, no report was made available to the mission.
1

16
G. COMPLETION
1. IS THE PCR DELIVERED ON A TIMELY BASIS, IN COMPLIANCE WITH BANK POLICY?
Date project reached 98% disb. Rate (or closing date if applicable)
Date PCR was sent to [email protected] MM/DD/YY
Difference in months
WORKING SCORE if the difference is 6 months or less, a 4 is scored. If the difference is 6.1 or more, a 1 is scored
31-Dec-11 01-Jun-12 5,1 4
2. Briefly describe the PCR Process. Describe the Borrower’s and co-financers' involvement in producing the document. Highlight any major differences of opinion concerning the assessments made in this PCR. Describe the team composition and confirm whether a site visit was undertaken. Mention any major collaboration from other development partners. State the extent of field office involvement in producing the report. Indicate whether comments from Peer Reviewers were received on time (provide names and positions of Peer Reviewers). [100 words maximum]
Mission worked with PCU staff (Coordinator, Accountant, Financial Analyst, M&E Officer), all Implementing Institutions (FFP, IIP, MFIs), MZFO Disbursement Unit; consulted IFAD task manager for PESPA (Strategic Plan for Artisanal Fisheries Sector 2006-15); visited and interacted with local authorities, project field staff and project beneficiaries of the 2 project provinces. A wrap-up meeting was held and an aide memoire signed. Mission composition: 2 MZFO Officers - the Senior Agriculture and Rural Development Officer/Mission Leader and the Economist/Financial Sector; and two consultants - an Infrastructure Engineer and Fisheries Specialist. Peer reviewers: Mr. W. Soliman, Principal Hydrologist (OSAN.3), Mr. J. Kromer, Principal Natural Resources Management Specialist (OSAN.4), Ms. P. Chileshe, Natural Resources Management Expert (OSAN.4)
H. LESSONS LEARNED
Summarize key lessons for the Bank and the Borrower suggested by the project’s outcomes
[250 words maximum. Any additional narrative about lessons learned, if needed, must be placed in
Annex 6: Project Narrative]
1. Project design should be based on a more in-depth analysis of the socio-cultural and geographical environments, capacity constraints and lessons learned from previous projects in order to minimize future design changes that cause delays, increased costs and jeopardise project outcomes. 2. Adequate provisions need to be made for procurement and disbursement including (a) harmonising Bank rules and regulations with those of other donors and the country, in line with the specificities of the country and the scale and complexity of projects and contractors; (b) regular training in Bank rules, procedures and contract management for the executing agencies and contractors; and (c) recruitment of relevant experts. 3. Projects should have control over all procurement processes, or have someone on the ground who can assist local authorities. Instead there were too many layers between PCU and people on the ground; works were identified and procured by the provincial/local authorities, who did not have the capacity to procure the contractors according to Bank rules. Works contracts need also to be packaged in sizes which are big enough to attract contractors without capacity problems. 4. The credit component should not have become active before the off shore stock was localized, and new techniques identified, only then would it have increased the fishing effort sustainably. 5. Facility users and management committees need to be involved early at design and implementation stages and modalities agreed with them to ensure that the projects are operational and there is adequate mentoring during implementation. The fish markets are not operational.

17
I. PROJECT RATINGS SUMMARY
All working scores and ratings must be found in the relevant section in the PCR. For example, please insert the “Overall Output score” in Section D.I. in the “Achievement of Outputs” box below.
CRITERIA SUB-CRITERIA WORKING
SCORE
PROJECT OUTCOME
Achievement of outputs (insert score from Section D.I.) 1
Achievement of outcomes (insert score from Section D.I.) 1
Timeliness (insert score from Section F.4.) 1
OVERALL PROJECT OUTCOME SCORE (score average) 1
BANK PERFORMANCE
Design and Readiness Project Objectives were relevant to country development priorities. (insert score from Section C.3.)
4
Project Objectives could in principle be achieved with the project inputs and in the expected time frame. (insert score from Section C.3.)
2
Project Objectives were consistent with the Bank’s country or regional strategy (insert score from Section C.3.)
4
Project Objectives were consistent with the Bank’s corporate priorities (insert score from Section C.3.)
4
The log frame presents a logical causal chain for achieving the project development objectives. (insert score from Section C.5.)
2
The log frame expresses objectives and outcomes in a way that is measurable and quantifiable. (insert score from Section C.5.)
3
The log frame states the risks and key assumptions. (insert score from Section C.5.) 2
Project complexity was matched with country capacity and political commitment. (insert score from Section E.2.)
2
Project design includes adequate risk analysis. (insert score from Section E.2.) 2
Project procurement, financial management, monitoring and/or other systems were based on those already in use by government and/or other partners. (insert score from Section E.2.)
2
Responsibilities for project implementation were clearly defined. (insert score from Section E.2.)
4
Necessary implementation documents (e.g. specifications, design, procurement documents) were ready at appraisal. (insert score from Section E.2.)
2
Monitoring indicators and monitoring plan were agreed upon during design. (insert score from Section E.2.)
2
Baseline data was available or were collected during design. (insert score from Section E.2.) 3
PROJECT DESIGN AND READINESS SUB-SCORE (score average) 3
Supervision: Bank complied with:
Environmental Safeguards (insert score from Section F.4.) 2
Fiduciary Requirements (insert score from Section F.4.) 3
Project Covenants (insert score from Section F.4.) 3
Bank provided quality supervision in the form of skills mix provided and practicality of solutions. (insert score from Section F.4.)
3
Bank provided quality management oversight. (insert score from Section F.4.) 3
PCR was delivered on a timely basis (insert score from Section G) 4

18
SUPERVISION SUB-SCORE (score average) 3
OVERALL BANK PERFORMANCE SCORE (score average) 3
BORROWER PERFORMANCE
Design and Readiness
Responsibilities for project implementation are clearly defined. (insert score from Section E.2)
4
Necessary implementation documents (e.g. specifications, design, procurement documents) are ready at appraisal. (insert score from Section E.2)
2
Monitoring indicators and monitoring plan are agreed upon. (insert score from Section E.2) 2
Baseline data are available or are being collected. (insert score from Section E.2) 1
PROJECT DESIGN AND READINESS SCORE (score average) 2
Implementation
Borrower complied with:
Environmental Safeguards (insert score from Section F.4) 2
Fiduciary Requirements (insert score from Section F.4) 1
Project Covenants (insert score from Section F.4) 2
Borrower was responsive to Bank supervision findings and recommendations. (insert score from Section F.4)
1
Borrower collected and used of monitoring information for decision-making. (insert score from Section F.4)
1
IMPLEMENTATION SUB-SCORE (score average) 1
OVERALL BORROWER PERFORMANCE SCORE (score average) 2
J. PROCESSING
STEP SIGNATURE AND COMMENTS DATE
Sector Manager Clearance
Regional Director Clearance
Sector Director Approval
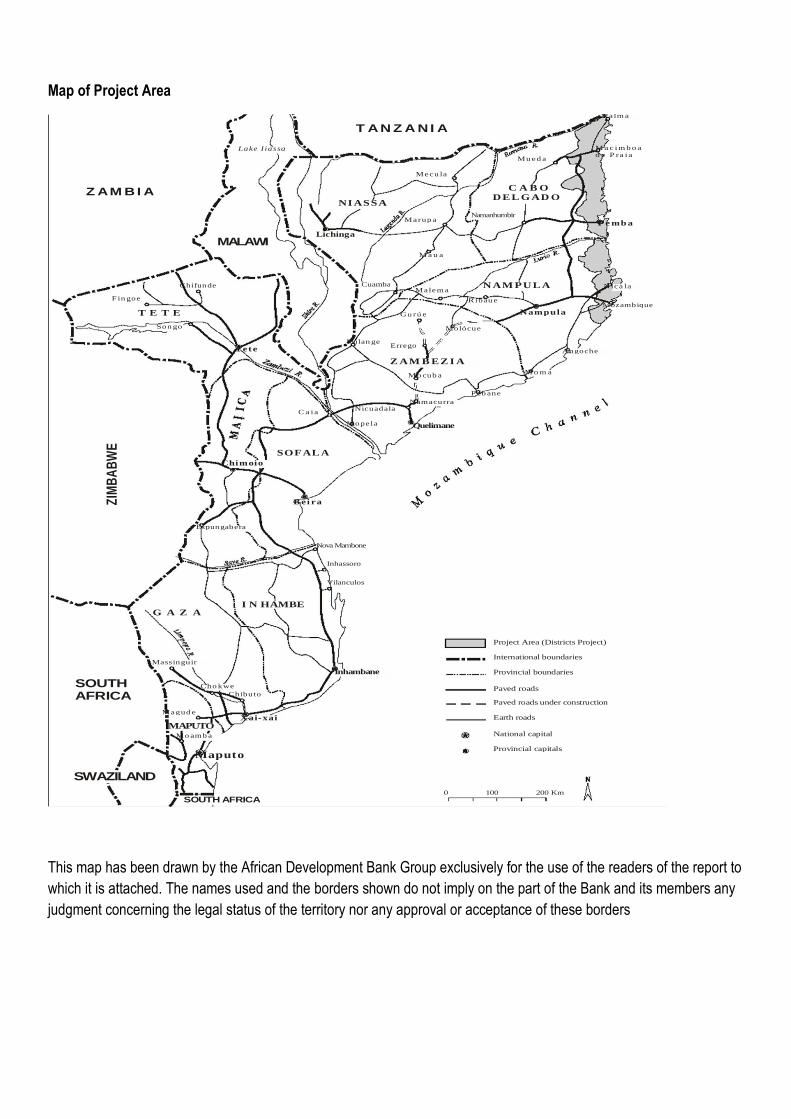
Map of Project Area
SWAZILAND
SOUTH AFRICA
Z A M B I A
ZIM
BA
BW
E
Fin goe
T E T E
Massinguir
G A Z A
Son go
MAPUTO
Magud e
Mo amb a
SOUTH AFRICA
Chifunde
Maputo
Espungabera
Cho kwe
MALAWI
Chimoio
Chibuto
I N HAMBE
Tete
Lake I iassa
Xai-xai
S O F A L A
Bei ra
C a ia
Lichinga
Cuamba
Nova Mambone
Inhassoro
Vilanculos
Inhambane
N I A S S A
Milan ge
Mope la
T A N Z A N I A
Nicuadala
Z A M B E Z I A
Errego
Gu rú e
Marup a
Quelimane
Mo cub a
Namacurra
Malem a
Mecu la
M a u a
0 100 200 Km
Molócue
Namanhumbir
R ibau e
Peb ane
N A M P U L A
C A B O D E L G A D O
Project Area (Districts Project)
International boundaries
Provincial boundaries
Paved roads
Paved roads under construction
Earth roads
National capital
Provincial capitals
Mu ed a
Nampula
M o m a
Angoche
M a c im b o a d e P ra i a
P e mb a
Mozambique
Pa lm a
Nica la
This map has been drawn by the African Development Bank Group exclusively for the use of the readers of the report to
which it is attached. The names used and the borders shown do not imply on the part of the Bank and its members any
judgment concerning the legal status of the territory nor any approval or acceptance of these borders

APPENDIX 1
Scale for Working Scores and Ratings
SCORE EXPLANATION
4 Very Good- Fully achieved with no shortcomings
3 Good- Mostly achieved despite a few shortcomings
2 Fair- Partially achieved. Shortcomings and achievements are roughly balanced
1 Poor- Very limited achievement with extensive shortcomings
NA Non Applicable
Note: The formulas round up or down for decimal points. Only whole numbers are computed.

LIST OF ANNEXES
Mandatory
"1. Project Costs and Financing
a. Project costs by component
b. Financing by sources of funds"
2. Bank Inputs. List the key team members, and their specialties, during preparation and supervision. Provide a consolidated list of
Preparation, Supervision and Completion Missions in chronological order. Provide the date and ratings of the last supervision report.
3. Economic Analysis (ERR) and Financial Analysis, if appropriate Re-estimate the economic rates of return based on costs and benefits at
completion, and compare with apprailsal estimates. Break down by components as appropriate. Analyze the sensitivity of the ERR to key
assumptions. Present a financial analysis for project beneficiary entities 4. Procurement Plan. Please attached the most recent
Procurement Plan 5. List of Supporting Documents
Optional
6. Project Narrative. Key factors not covered in the main template that affected the design and implementation of the project. Such factors,
both positive and negative, could include: climate and weather, political changes, contractual or personnel matters, technical issues,
procurement processes, and interactions with other partners. If any of these factors is significant enough to affect the evaluation ratings, it
should be noted in the template with a reference to this annex.

Annex 1 Project Cost and Financing
Summary of Project Cost Estimates by Component UA * 1 000 000
Component PAR Disburse-ment Unpaid Committed Total Disburse-ment %
Credit for Fish Production & Marketing 6,52 2,60 - 2,60 40%
Community Infrastructure 3,67 1,02 0,72 1,74 28% Capacity Strengthening 6,36 5,88 0,13 6,01 92%
Subtotal 16,55 9,50 0,86 10,36 57% Contingencies 1,96 - - -
Project Total 18,52 9,50 0,86 10,36 51%
Capital Decrease - 5,57 - 5,57
Grand Total (Project Total + Capital Decrease) 18,52 15,07 0,86 15,92
Difference (Receipts Less Justified)1 (0,30) - (300,60)
1/ Receipts from the Special Account Less Amounts Justified by project Source of Financing UA * 1 000 000
Source of Finance PAR Disbures-ment Unpaid Committed Total Disburs-ement % Capital Decrease Grantd Total (Project Total + Capital Decrease)
ADF Loan 14,17 7,27 0,85 8,11 5,00 13,11
TAF Grant 1,73 1,29 0,01 1,30 0,57 1,87
Government 2,01 0,94 - 0,94 47% - 0,94 Beneficiaries 0,61 - - - - -
Total 18,52 9,50 0,86 10,36 51% 5,57 15,92
Project Cost (All Sources) UA * 1 000 000
Loan Grant GOM Project
Disbursed
Committed Undisbursed Total Disbursed
Committed Undisbursed Total Disbursed
Committed Undisbursed Total Disbursed
Committed Undisbursed Grand Total
Component
Credit for Fish Production & Marketing 2,60 -
2,60
- -
-
- - -
2,60
-
2,60
Community Infrastructure 1,02 0,72 1,74 - - - - - - 1,02 0,72 1,74 Capacity Strengthening 3,65 0,12 3,77 1,29 0,01 1,30 0,94 - 0,94 5,88 0,13 6,01
Total Base Costs 7,27 0,85 8,11 1,29 0,01 1,30 0,94 - 0,94 9,50 0,86 10,36
Contingencies
-
- - - - - - -
Project Total 7,27 0,85 8,11 1,29 0,01 1,30 0,94 - 0,94 9,50 0,86 10,36
Capital Decrease 5,00 - 5,00 0,57 - 0,57 - - - 5,57 - 5,57
Total 12,27 0,85 13,11 1,86 0,01 1,87 0,94 - 0,94 15,07 0,86 15,92
Difference (Receipts Less Justified) (0,17) - (0,17) (0,13) - (0,13) - - - (0,30) - (0,30)

Annex 2 Bank Inputs
Mission Member
Start End days Name Position
1 janv-05
2 05-sept-05 17-sept-05 13 Abdirahman Beileh Division Manager, ONAR
Jphn Mensah-Quainoo Head, Procurement
Habib Kamoun Manager, Disbursement Division
Felix Njoku Communication Officer, Com. Unit
Wycliffe Hara Principal Agricultural Economist
Joseph Coompson Principal Agricultural Economist
Kurt Lonsway Senior Irrigation Engineer
Phoebe Mtambo Senior Agronomist
Grace Kyokunda Senior Agricultural economist
Loretta Foran Financial Analyst
Catherine Mwangfa Disbursement Assistant
3 05-mars-06 17-mars-06 13 Phoebe Mtambo Senior Agronomist
S. Babale Financial Analyst
4 30-oct-06 09-nov-06 11 Jean-Louis Kromer Snr Fisheries Officer
Cesar Tique Agriculture and Rural Development Specialist
5 10-sept-07 21-sept-07 12 Jean-Louis Kromer Snr Fisheries Officer
Olagoke Oladapo Agricultural Economist
Cesar Tique Agriculture and Rural Development Specialist
6 16-juin-08 02-juil-08 17 Chiji Ojukwu Manager, OSAN.1
Wycliffe Hara Principal Agricultural Economist
Kurt Lonsway Principal Portfolio Management Officer, OPSM.5
L Sanchez Principal Agro-Industry Specialist
J. Riberio Principal Procurement Specialist
J. L. Kromer Senior Fisheries Specialist
R. Preprah Principal Financial Management Officer
Cesar Tique Agriculture and Rural Development Specialist
Mrs I. Soares Disbursement Assistant
Mrs Yolanda Arcelina Social Expert
7 25-juin-08 12-juil-08 18 Mrs Fola H. Thomas
Rodreick O. Mammah
8 07-déc-08 20-déc-08 14 Cesar Tique Agriculture and Rural Development Specialist
Mrs Yolanda Arcelina Social Expert
Phoebe Mtambo Consultant Agronomist
9 22-mai-09 03-juin-09 13 Ken Johm Manager, OSAN.4
Felix Martin Senior Fisheries Officer
Cesar Tique Agriculture and Rural Development Specialist
Mrs Yolanda Arcelina Social Expert
10 14-déc-09 22-déc-09 9 Felix Martin Senior Fisheries Officer
Henrick Franklin Principal CPO MZFO
Cesar Tique Agriculture and Rural Development Specialist
11 03-mai-10 14-mai-10 12 Felix Martin Senior Fisheries Officer
Henrick Franklin Principal CPO MZFO
Cesar Tique Agriculture and Rural Development Specialist
12 22-nov-10 03-déc-10 12 Timothy Mkandawire Snr Financial Management Specialist
Cesar Tique Agriculture and Rural Development Specialist
Emmanuel Ajani Fisheries Consultant
13 30-juin-11 08-juil-11 9 Cesar Tique Agriculture and Rural Development Specialist
Total 153
Average 11,76923077
Missions per year 2,0

Artisanal Fisheries Development Program: Financial Internal Rate of Return (FIRR) Analysis Base data and assumptions: 1. A handle rate of 12.3% was used to evaluate the project. 2. The financial analysis were carried out through a period of 6 years 3. Project operational costs were treated as investment costs and included: fixed costs (vessel repairs and maintenance, depreciation, interest); variable costs (Gear repair replacement; fuel and lubricants; Ice, Bait, Food provisions; Marketing costs); and shared costs. 4. Total annual revenue was calculated based on three key parameters as follows: mean catch per fishing day (base value of 200 tons) at a price of $50 times the number of fishing days (62 days) per year. 5. The program is considered to be economically viable with positive NPV of MZN 403.9 million economic benefits. However, the financial analysis indicates a negative NPV of MZN -1.347 million. 6. The estimated results indicate that the project was financially feasible both for the Fishing Business Model with Engine (FIRR of 21.9%) and Fishing Business Model without Engine (FIRR of 14.09%) as the internal rates of returns exceeded the cost of capital. The Net Present Values (NPV) was USD 55,293.28 for the Fishing Business Model with Engine, and USD 5,581.26 Fishing Business Model without Engine. Table 1, below depicts the main results.
Table 1: Financial Internal Rate of Return (Base case scenario)
Base Case Fishing Business
Model with Engine Model without Engine
Financial Internal Rate of Return (FIRR) 21,90% 14,09%
Net Present Value (NPV) USD 55,293.28 USD 5,581.26
Revenue-to-Expenditure Ratio (RER) 1,23 1,18
Sensitivity Analysis 7. Sensitivity analyses have been carried out for various scenarios in order to test the robustness of the project financial performance. Three cases were considered,
namely: (1) Variable cost increase by average annual inflation rate of 9.7% over the period 2006-2011 (2) Revenue adjustment to account for annual price variations, as follows: -5% in 2007; 2% in 2008; -7% in 2009; 9% in 2010 and -2% in 2011 (3) Combination of (2) and (3), that is: variable costs increase by 9.7% together with a revenue adjustment to account for annual price variations 8. The results show that the Fishing Business Model with Engine was more robust to both cost variations and revenue adjustment, although the FIRR seemed to drop from 21.9% (base case scenario) to 19.6% and 18.8% as a result of the variable costs increase; and a combination of variable cost increase together with a revenue adjustment, respectively. Meanwhile, revenue adjustments were found to maintain the levels of financial feasibility stable as compared to the base case scenario. Detailed results are presented in Table 2. 9. In contrast, the Fishing Business Model without an Engine was sensitive to variable cost variations; as well as to the combined impact of the former with the annual adjustment of revenues to account for price variations. The FIRR of the base case scenario stood at 14.09% which was slightly above the cost of capital of 12.3%, thus rendering the project feasible at margin. Variable cost variations seemed to lower the FIRR to levels below the cost of capital (11.2%), mostly due to the rising costs of fuel that were registered starting from 2008.
Base Case Fishing Business
Model with Engine Model without Engine
Financial Internal Rate of Return (FIRR) 21,90% 14,09%
Net Present Value (NPV) USD 55,293.28 USD 5,581.26
Revenue-to-Expenditure Ratio (RER) 1,23 1,18
Sensitivity Analysis
Case 1: Variable cost increase by average annual inflation (9.7%)
Financial Internal Rate of Return (FIRR) 19,60% 11,20%
Net Present Value (NPV) USD 43,021.58 (USD 3,433.25)
Revenue-to-Expenditure Ratio (RER) 1,2 1,14
Case 2: Revenue adjustment for annual price variations
Financial Internal Rate of Return (FIRR) 21,11% 13,59%
Net Present Value (NPV) USD 51,411.98 USD 4,058.30
Revenue-to-Expenditure Ratio (RER) 1,22 1,17
Case 3: Simultaneous variable cost increase (9.7%) and annual
revenue adjustment for price variations
Financial Internal Rate of Return (FIRR) 18,80% 10,80%
Net Present Value (NPV) USD 39,140.28 (USD 4,956.21)
Revenue-to-Expenditure Ratio (RER) 1,2 1,14
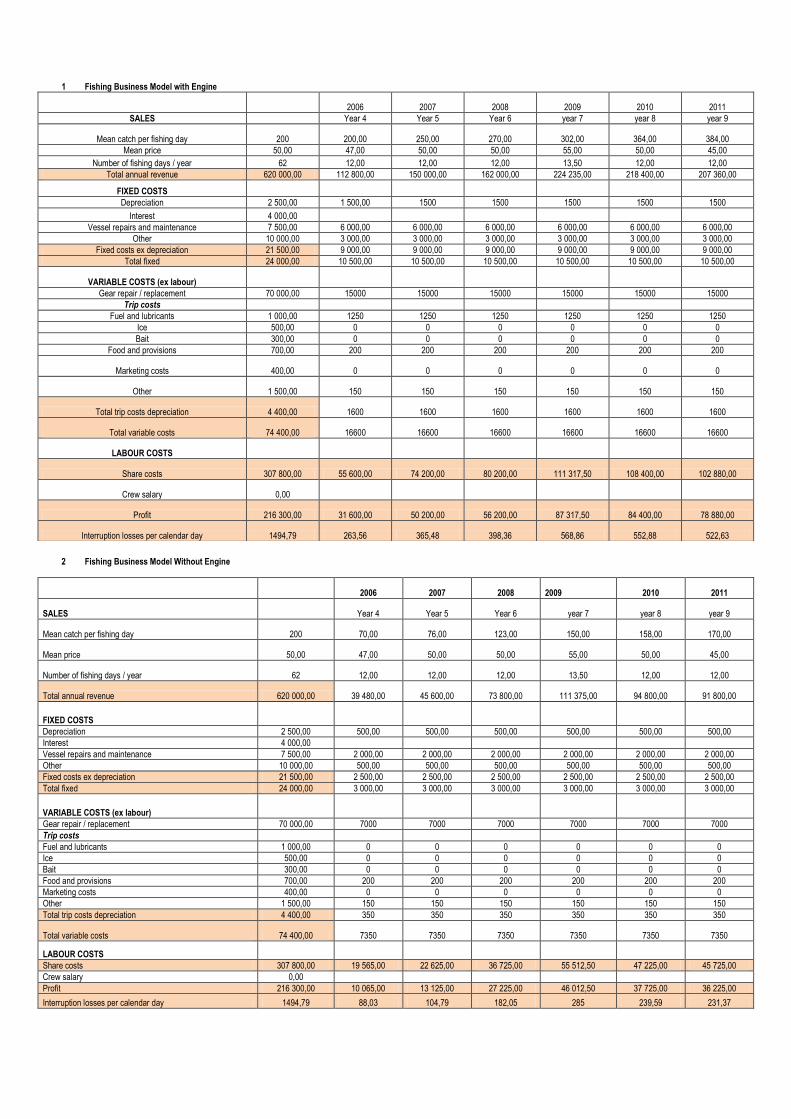
1 Fishing Business Model with Engine
2006 2007 2008 2009 2010 2011
SALES
Year 4 Year 5 Year 6 year 7 year 8 year 9
Mean catch per fishing day 200 200,00 250,00 270,00 302,00 364,00 384,00
Mean price 50,00 47,00 50,00 50,00 55,00 50,00 45,00
Number of fishing days / year 62 12,00 12,00 12,00 13,50 12,00 12,00
Total annual revenue 620 000,00 112 800,00 150 000,00 162 000,00 224 235,00 218 400,00 207 360,00
FIXED COSTS Depreciation 2 500,00 1 500,00 1500 1500 1500 1500 1500
Interest 4 000,00 Vessel repairs and maintenance 7 500,00 6 000,00 6 000,00 6 000,00 6 000,00 6 000,00 6 000,00
Other 10 000,00 3 000,00 3 000,00 3 000,00 3 000,00 3 000,00 3 000,00
Fixed costs ex depreciation 21 500,00 9 000,00 9 000,00 9 000,00 9 000,00 9 000,00 9 000,00
Total fixed 24 000,00 10 500,00 10 500,00 10 500,00 10 500,00 10 500,00 10 500,00
VARIABLE COSTS (ex labour) Gear repair / replacement 70 000,00 15000 15000 15000 15000 15000 15000
Trip costs Fuel and lubricants 1 000,00 1250 1250 1250 1250 1250 1250
Ice 500,00 0 0 0 0 0 0
Bait 300,00 0 0 0 0 0 0
Food and provisions 700,00 200 200 200 200 200 200
Marketing costs 400,00 0 0 0 0 0 0
Other 1 500,00 150 150 150 150 150 150
Total trip costs depreciation 4 400,00 1600 1600 1600 1600 1600 1600
Total variable costs 74 400,00 16600 16600 16600 16600 16600 16600
LABOUR COSTS
Share costs 307 800,00 55 600,00 74 200,00 80 200,00 111 317,50 108 400,00 102 880,00
Crew salary 0,00
Profit 216 300,00 31 600,00 50 200,00 56 200,00 87 317,50 84 400,00 78 880,00
Interruption losses per calendar day 1494,79 263,56 365,48 398,36 568,86 552,88 522,63
2 Fishing Business Model Without Engine
2006 2007 2008 2009 2010 2011
SALES
Year 4 Year 5 Year 6 year 7 year 8 year 9
Mean catch per fishing day 200 70,00 76,00 123,00 150,00 158,00 170,00
Mean price 50,00 47,00 50,00 50,00 55,00 50,00 45,00
Number of fishing days / year 62 12,00 12,00 12,00 13,50 12,00 12,00
Total annual revenue 620 000,00 39 480,00 45 600,00 73 800,00 111 375,00 94 800,00 91 800,00
FIXED COSTS Depreciation 2 500,00 500,00 500,00 500,00 500,00 500,00 500,00
Interest 4 000,00 Vessel repairs and maintenance 7 500,00 2 000,00 2 000,00 2 000,00 2 000,00 2 000,00 2 000,00
Other 10 000,00 500,00 500,00 500,00 500,00 500,00 500,00
Fixed costs ex depreciation 21 500,00 2 500,00 2 500,00 2 500,00 2 500,00 2 500,00 2 500,00
Total fixed 24 000,00 3 000,00 3 000,00 3 000,00 3 000,00 3 000,00 3 000,00
VARIABLE COSTS (ex labour) Gear repair / replacement 70 000,00 7000 7000 7000 7000 7000 7000
Trip costs Fuel and lubricants 1 000,00 0 0 0 0 0 0
Ice 500,00 0 0 0 0 0 0
Bait 300,00 0 0 0 0 0 0
Food and provisions 700,00 200 200 200 200 200 200
Marketing costs 400,00 0 0 0 0 0 0
Other 1 500,00 150 150 150 150 150 150
Total trip costs depreciation 4 400,00 350 350 350 350 350 350
Total variable costs 74 400,00 7350 7350 7350 7350 7350 7350
LABOUR COSTS Share costs 307 800,00 19 565,00 22 625,00 36 725,00 55 512,50 47 225,00 45 725,00
Crew salary 0,00 Profit 216 300,00 10 065,00 13 125,00 27 225,00 46 012,50 37 725,00 36 225,00
Interruption losses per calendar day 1494,79 88,03 104,79 182,05 285 239,59 231,37

3 DISCOUNT RATE
Description 2006 2007 2008 2009 2010 2011
1 year maturity lending interest rate 23,22 22,16 21,85 19,21 21,67 23,68
Average annual inflation rate 13,2 8,2 10,3 3,25 12,7 10,35
Real discount rate 10,02 13,96 11,55 15,96 8,97 13,33
Average discount rate for the Financial model 12,3
Average inflation rate 9,7
Annual Price Variations (Base = 2006) 0,0 -5% 2% -7% 9% -2%
Source: Central Bank of Mozambique (BoM)
4 Fishing Business Model with Engine - Financial Model ANNEX A.1: FINANCIAL MODELLING-BASE CASE
YEAR FIXED VARIABLE SHARED TOTAL
INVESTMENT TOTAL ANNUAL NET
COSTS COSTS COSTS COSTS REVENUE REVENUE
2005 24 000 74 400 82 500 180 900 0 -180 900
2006 10 500 16 600 55 600 82 700 112 800 30 100
2007 10 500 16 600 74 200 101 300 150 000 48 700
2008 10 500 16 600 80 200 107 300 162 000 54 700
2009 10 500 16 600 111 318 138 418 224 235 85 818
2010 10 500 16 600 108 400 135 500 218 400 82 900
2011 10 500 16 600 102 880 129 980 207 360 77 380
Total 87 000 174 000 615 098 876 098 1 074 795 198 698
FIRR
21,9%
NPV
USD 55 293
RER
1,227
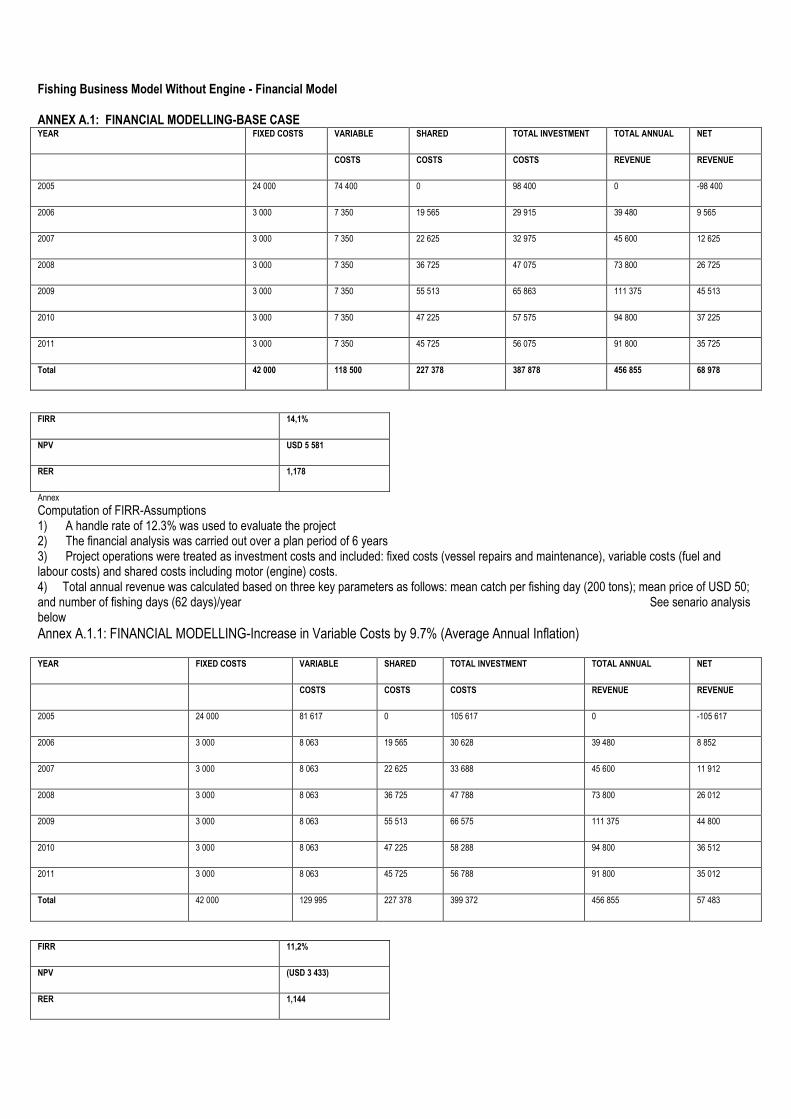
Annex Computation of FIRR-Assumptions 1) A handle rate of 12.3% was used to evaluate the project 2) The financial analysis was carried out over a plan period of 6 years 3) Project operations were treated as investment costs and included: fixed costs (vessel repairs and maintenance), variable costs (fuel and labour costs) and shared costs including motor (engine) costs. 4) Total annual revenue was calculated based on three key parameters as follows: mean catch per fishing day (200 tons); mean price of USD 50; and number of fishing days (62 days)/year See senario analysis below Annex A.1.1: FINANCIAL MODELLING-Increase in Variable Costs by 9.7% (Average Annual Inflation)
YEAR FIXED COSTS VARIABLE SHARED TOTAL
INVESTMENT TOTAL ANNUAL NET
COSTS COSTS COSTS REVENUE REVENUE
2005 24 000 81 617 82 500 188 117 0 -188 117
2006 10 500 18 210 55 600 84 310 112 800 28 490
2007 10 500 18 210 74 200 102 910 150 000 47 090
2008 10 500 18 210 80 200 108 910 162 000 53 090
2009 10 500 18 210 111 318 140 028 224 235 84 207
2010 10 500 18 210 108 400 137 110 218 400 81 290
2011 10 500 18 210 102 880 131 590 207 360 75 770
Total 87 000 190 878 615 098 892 976 1 074 795 181 820
FIRR 19,6% NPV USD 43 022 RER 1,204

Annex A.1.2: FINANCIAL MODELLING-Adjust revenues to account for annual price variations
YEAR FIXED COSTS VARIABLE SHARED TOTAL
INVESTMENT TOTAL ANNUAL NET COSTS COSTS COSTS REVENUE REVENUE
2005 24 000 74 400 82 500 180 900 0 -180 900
2006 10 500 16 600 55 600 82 700 112 800 30 100
2007 10 500 16 600 74 200 101 300 142 500 41 200
2008 10 500 16 600 80 200 107 300 165 402 58 102
2009 10 500 16 600 111 318 138 418 208 426 70 009
2010 10 500 16 600 108 400 135 500 239 039 103 539
2011 10 500 16 600 102 880 129 980 202 487 72 507
Total 87 000 174 000 615 098 876 098 1 070 654 194 557
FIRR
21,1%
NPV
USD 51 412
RER
1,222
Annex A.1.3: FINANCIAL MODELLING-Increase investment costs by 9.7% and adjustment of revenues for annual price variations
YEAR FIXED COSTS VARIABLE SHARED TOTAL
INVESTMENT TOTAL ANNUAL NET
COSTS COSTS COSTS REVENUE REVENUE
2005 24 000 81 617 82 500 188 117 0 -188 117
2006 10 500 18 210 55 600 84 310 112 800 28 490
2007 10 500 18 210 74 200 102 910 142 500 39 590
2008 10 500 18 210 80 200 108 910 165 402 56 492
2009 10 500 18 210 111 318 140 028 208 426 68 399
2010 10 500 18 210 108 400 137 110 239 039 101 929
2011 10 500 18 210 102 880 131 590 202 487 70 897
Total 87 000 190 878 615 098 892 976 1 070 654 177 679
FIRR
18,8%
NPV
USD 39 140
RER
1,199
Fishing Business Model Without Engine - Financial Model ANNEX A.1: FINANCIAL MODELLING-BASE CASE
YEAR FIXED COSTS VARIABLE SHARED TOTAL
INVESTMENT TOTAL ANNUAL NET COSTS COSTS COSTS REVENUE REVENUE
2005 24 000 74 400 0 98 400 0 -98 400
2006 3 000 7 350 19 565 29 915 39 480 9 565
2007 3 000 7 350 22 625 32 975 45 600 12 625
2008 3 000 7 350 36 725 47 075 73 800 26 725
2009 3 000 7 350 55 513 65 863 111 375 45 513
2010 3 000 7 350 47 225 57 575 94 800 37 225
2011 3 000 7 350 45 725 56 075 91 800 35 725
Total 42 000 118 500 227 378 387 878 456 855 68 978
FIRR 14,1% NPV USD 5 581 RER 1,178
Annex
Computation of FIRR-Assumptions 1) A handle rate of 12.3% was used to evaluate the project 2) The financial analysis was carried out over a plan period of 6 years 3) Project operations were treated as investment costs and included: fixed costs (vessel repairs and maintenance), variable costs (fuel and labour costs) and shared costs including motor (engine) costs. 4) Total annual revenue was calculated based on three key parameters as follows: mean catch per fishing day (200 tons); mean price of USD 50; and number of fishing days (62 days)/year See senario analysis below

Annex A.1.1: FINANCIAL MODELLING-Increase in Variable Costs by 9.7% (Average Annual Inflation)
YEAR FIXED COSTS VARIABLE SHARED TOTAL
INVESTMENT TOTAL ANNUAL NET
COSTS COSTS COSTS REVENUE REVENUE
2005 24 000 81 617 0 105 617 0 -105 617
2006 3 000 8 063 19 565 30 628 39 480 8 852
2007 3 000 8 063 22 625 33 688 45 600 11 912
2008 3 000 8 063 36 725 47 788 73 800 26 012
2009 3 000 8 063 55 513 66 575 111 375 44 800
2010 3 000 8 063 47 225 58 288 94 800 36 512
2011 3 000 8 063 45 725 56 788 91 800 35 012
Total 42 000 129 995 227 378 399 372 456 855 57 483
FIRR
11,2%
NPV
(USD 3 433)
RER
1,144
Annex A.1.2: FINANCIAL MODELLING-Adjust revenues to account for annual price variations
YEAR FIXED COSTS VARIABLE SHARED TOTAL INVESTMENT TOTAL ANNUAL NET
COSTS COSTS COSTS REVENUE REVENUE
2005 24 000 74 400 82 500 180 900 0 -180 900
2006 10 500 16 600 55 600 82 700 112 800 30 100
2007 10 500 16 600 74 200 101 300 142 500 41 200
2008 10 500 16 600 80 200 107 300 165 402 58 102
2009 10 500 16 600 111 318 138 418 208 426 70 009
2010 10 500 16 600 108 400 135 500 239 039 103 539
2011 10 500 16 600 102 880 129 980 202 487 72 507
Total 87 000 174 000 615 098 876 098 1 070 654 194 557
FIRR
21,1%
NPV
USD 51 412
RER
1,222
Annex A.1.3: FINANCIAL MODELLING-Increase investment costs by 9.7% and adjustment of revenues for annual price variations YEAR FIXED COSTS VARIABLE SHARED TOTAL INVESTMENT TOTAL ANNUAL NET
COSTS COSTS COSTS REVENUE REVENUE
2005 24 000 81 617 82 500 188 117 0 -188 117
2006 10 500 18 210 55 600 84 310 112 800 28 490
2007 10 500 18 210 74 200 102 910 142 500 39 590
2008 10 500 18 210 80 200 108 910 165 402 56 492
2009 10 500 18 210 111 318 140 028 208 426 68 399
2010 10 500 18 210 108 400 137 110 239 039 101 929
2011 10 500 18 210 102 880 131 590 202 487 70 897
Total 87 000 190 878 615 098 892 976 1 070 654 177 679
FIRR 18,8%
NPV USD 39 140
RER 1,199
Fishing Business Model Without Engine - Financial Model
ANNEX A.1: FINANCIAL MODELLING-BASE CASE YEAR FIXED COSTS VARIABLE SHARED TOTAL INVESTMENT TOTAL ANNUAL NET
COSTS COSTS COSTS REVENUE REVENUE
2005 24 000 74 400 0 98 400 0 -98 400
2006 3 000 7 350 19 565 29 915 39 480 9 565
2007 3 000 7 350 22 625 32 975 45 600 12 625
2008 3 000 7 350 36 725 47 075 73 800 26 725
2009 3 000 7 350 55 513 65 863 111 375 45 513
2010 3 000 7 350 47 225 57 575 94 800 37 225
2011 3 000 7 350 45 725 56 075 91 800 35 725
Total 42 000 118 500 227 378 387 878 456 855 68 978
FIRR 14,1%
NPV USD 5 581
RER 1,178
Annex
Computation of FIRR-Assumptions 1) A handle rate of 12.3% was used to evaluate the project 2) The financial analysis was carried out over a plan period of 6 years 3) Project operations were treated as investment costs and included: fixed costs (vessel repairs and maintenance), variable costs (fuel and labour costs) and shared costs including motor (engine) costs. 4) Total annual revenue was calculated based on three key parameters as follows: mean catch per fishing day (200 tons); mean price of USD 50; and number of fishing days (62 days)/year See senario analysis below
Annex A.1.1: FINANCIAL MODELLING-Increase in Variable Costs by 9.7% (Average Annual Inflation)
YEAR FIXED COSTS VARIABLE SHARED TOTAL INVESTMENT TOTAL ANNUAL NET
COSTS COSTS COSTS REVENUE REVENUE
2005 24 000 81 617 0 105 617 0 -105 617
2006 3 000 8 063 19 565 30 628 39 480 8 852
2007 3 000 8 063 22 625 33 688 45 600 11 912
2008 3 000 8 063 36 725 47 788 73 800 26 012
2009 3 000 8 063 55 513 66 575 111 375 44 800
2010 3 000 8 063 47 225 58 288 94 800 36 512
2011 3 000 8 063 45 725 56 788 91 800 35 012
Total 42 000 129 995 227 378 399 372 456 855 57 483
FIRR 11,2%
NPV (USD 3 433)
RER 1,144

Annex A.1.2: FINANCIAL MODELLING-Adjust revenues to account for annual price variations
YEAR FIXED COSTS VARIABLE SHARED TOTAL INVESTMENT TOTAL ANNUAL NET
COSTS COSTS COSTS REVENUE REVENUE
2005 24 000 81 617 0 105 617 0 -105 617
2006 3 000 8 063 19 565 30 628 39 480 8 852
2007 3 000 8 063 22 625 33 688 43 320 9 632
2008 3 000 8 063 36 725 47 788 75 350 27 562
2009 3 000 8 063 55 513 66 575 103 523 36 948
2010 3 000 8 063 47 225 58 288 103 759 45 471
2011 3 000 8 063 45 725 56 788 89 643 32 855
Total 42 000 129 995 227 378 399 372 455 074 55 702
FIRR 10,8%
NPV (USD 4 956)
RER 1,139
5 Sensitivity Analysis
SUMMARY RESULTS
Base Case Fishing Business
Model with Engine Model without Engine
Financial Internal Rate of Return (FIRR) 21,9% 14,1%
Net Present Value (NPV) USD 55 293 USD 5 581
Revenue-to-Expenditure Ratio (RER) 1,23 1,18
Sensitivity Analysis
Case 1: Variable cost increase by average annual inflation (9.7%)
Financial Internal Rate of Return (FIRR) 19,6% 11,2%
Net Present Value (NPV) USD 43 022 (USD 3 433)
Revenue-to-Expenditure Ratio (RER) 1,20 1,14
Case 2: Revenue adjustment for annual price variations
Financial Internal Rate of Return (FIRR) 21,1% 13,6%
Net Present Value (NPV) USD 51 412 USD 4 058
Revenue-to-Expenditure Ratio (RER) 1,22 1,17
Case 3: Simultaneous variable cost increase (9.7%) and annual
revenua adjustment for price variations
Financial Internal Rate of Return (FIRR) 18,8% 10,8%
Net Present Value (NPV) USD 39 140 (USD 4 956)
Revenue-to-Expenditure Ratio (RER) 1,20 1,14

Annex 4 Procurement Plan
PROCUREMENT PLAN General Fill gray cells only!
Country/Organisation:
Project/Programme:
Loan No:
Implementing Agency, Adress:
Bank's Approval Date of Procurement Plan:
Date of General Procurement Notice:
Period Covered by these Proc. Plans:
WORKS
Prior Review Threshold: Procurement decisions subject to Prior Review by the Bank as stated in the Appraisal Report
Quarter 1 Quarter 2 Quarter 3 Quarter 4 TOTAL YEAR
Planned amount commited in signed contracts during quarter 0 1333287 1207026 1008497 1)
Actual amount commited in signed contracts during quarter 0 1134760 1207026 0
% #DIV/0! 85% 100% 0% #DIV/0!
Planned procurement steps according to Procurement Plan 15 22 11 6 2)
Progress in Implementation of Procurement Plan 2 6 4 0 The delay in beginning the process of procurement for Construction of Offices and expansion of fish landing centers of Palma was due to the delay in approval of the tender specifications and approval of the extension PPANNCD. The delay at the beginning of the works of construction of fish markets of Banguia and improvements in the landing center of Zalala was due to approval the evaluation reports by the Bank.
% 13% 27% 36% 0% #DIV/0!

Prior review Procurement Method Threshold Comments
(UAequiv.)
1. ICB
2.
3. NCB
4.
5. Shopping
6.
3. Procurement Packages with Methods and Time Schedule
Basic Data Bid Documents Bidding Period Bid Evaluation Contract Award Contract
Implementation
Status
Description of Contract Lot
Number
Estimated Amount in UA (000)
Procurement
Method
Pre-or Post
Qualification
Dom/Reg.
Preference (Y/N)
Prior or Post Review
Lumpsum or Bill
of Quantitie
s
Expected
Date Issue of Bid Docs
Expected Bid
closing Date
Plan vs.
Actual
Transmissi
on Bid Docs Date
No-objecti
on Date
Bid Invitati
on Date
Bid Closin
g-Openi
ng
Bid Evalua
tion Report
No-objecti
on Date
Contract Amount in
UA(000)
Contract
Award Date
Contract
Signature
Date
Start Date
End Date
Ongo
Reabiltação Localizada de Estrada - 11Km - Mucojo - Pangane na Provincia de Cabo Delgado Distritos de Macomia
180
000,00 NCB POST N NA
Bill of Quantitie
s
06/01/2010
15/08/2010
Original Plan
7/30/2010
08/10/2010
8/14/2010
8/15/2010
8/20/2010
9/10/2010
183 551,49
10/15/2010
20/10/2010
20/11/2010
20/02/2011
180
000,00 NCB POST N NA
Bill of Quantities
06/01/2010
15/08/2010
Updated Plan
7/30/2010
08/10/2010
8/14/2010
8/15/2010
8/20/2010
10/01/2011
299 277,30
10/05/2011
10/07/2011
10/10/2011
12/30/2011
180
000,00 NCB POST N NA
Bill of Quantities
06/01/2010
15/08/2010
Actual 7/30/2010
10/08/2010
10/30/2010
11/30/2010
01/28/2011
IDPPE Office Building At Pemba
709
219,86 NCB POST N NA
Bill of Quantitie
s
07/25/2010
7/30/2010
Original Plan
7/30/2010
8/10/2010
8/14/2010
8/15/2010
8/20/2010
9/10/2010
709 219,86
10/15/2010
10/20/2010
11/20/2010
11/20/2011
709
219,86 NCB POST N NA
Bill of Quantities
25/07/2010
30/07/2010
Updated Plan
05/04/2011
15/04/2011
30/07/2011
30/08/2011
02/09/2011
10/10/2011
709 219,86
11/10/2011
12/10/2011
15/10/2011
30/07/2012
709
219,86 NCB POST N NA
Bill of Quantities
25/07/2010
30/07/2010
Actual 4/3/20
11 20/05/2011
04/08/2011
05/09/2011
03/10/2011
Total Cost Plan
Actual

Days occurred - Bid Documents Days occurred - Bid Evaluation
Days occurred - Bid Evaluation Days occurred - Contract Award
Transmission Bid Docs Date to No-Objection Date Bid Evaluation Report to No-Objection Date
Bid Closing date to submission of Bid evaluation Report
No-Objection of Evaluation Report to contract Signature Date
#VALEUR! #VALEUR!
#VALEUR! N/A
76 N/A
28 N/A
AVERAGE AVERAGE
AVERAGE AVERAGE
#VALEUR! #VALEUR!
#VALEUR! #DIV/0!
Note 2. (Supplementary information concerning Procurement of Works, such as Pre-qualification or any other Special Procurement Arrangements)
1 Value of Signed Contracts
Average Time occurred between processes
Q1: i) The TARGET Amount is established as the amount planned to be commited in signed contracts in Q1 according to the Procurement Plan. At the end of the quarter this amount may be adjusted as follows: 1) for contracts that were actually during Q1 the definitive amount is used, 2) for contracts with delayed signature the preliminary/planned amount is
used (For example: 3 contracts for a total of UA450,000 were planned to be signed in Q1 as follows: Contract 1: UA100,000, Contract 2:
UA150,000 and Contract 3: UA200,000. In the end, contract 1 was signed for UA80,000, contract 2 for UA160,000 and contract 3 was not signed in time. The adjusted target value will then be: UA440,000). ii) The ACTUAL amount is the amount in signed contracts (in the above
case it would be UA240,000), iii) the % would be ACTUAL/TARGET (in above case UA240,000/440,000 = 55%). Q2: i) Target is established
through same procedure as in Q1. The project is required to adjust the plan at the beggining of the quarter. Q3-4: Same procedure as in Q2.
Year: % completion of commitment target (Adjusted annual target/actual amount)
Responsibility Process Target Average Processing Days % Performance
AfDB
Transmition of Bids to No-objection 14,00 #VALEUR! #VALEUR!
2 Planned procurement steps according to Procurement Plan
Q1-4: # of procurement steps planned to be completed in respective quarter based on Procurement Plan. Year: sum of all procurement steps
in year as established in procurement plan.
Bid evaluation Report to No-Objection 21,00 0,00 0,00
3 Progress in Implementation of Procurement Plan
Q1-4: # of procurement steps planned to be completed in respective quarter based on Procurement Plan that were actually completed within the quarter. Year: # of procurement steps planned to be completed in
year based on Procurement Plan that were actually completed within the quarter
Project Implementation Unit
Bid closing to submission of evaluation report 35,00 #VALEUR! #VALEUR!
No-Objection of Evaluation Report to contract
Signature Date 42,00 0,00 0,00

Annex 5. List of Supporting Documents 1. Project Supervision Mission Aide-Memoires, 2005-2011 2. Project quarterly reports 2004-2011 3. Project Audit reports, 2004-2010 4. Project Appraisal Report and Detailed Cost Tables 5. IDPPE: Atlas da Pesca em Mocambique, 2010 6. Government of Mozambique (GoM): Strategic Plan for the Artisanal Fisheries Sector (PESPA 2006-2015) 7. International Monetary Fund (IMP): Action plan for the reduction of absolute poverty 2006-2009 8. United Nations (UN): Millennium Development Goals (MDGs) in Mozambique 9. World Bank (WB): Poverty Reduction Strategy Papers (PRSP) and progress reports, 2006-2009