mozambique 2019 - unicef
TRANSCRIPT

BUDGET BRIEF: EDUCATIONMOZAMBIQUE 2019

2
KEY MESSAGES
In March 2019, Mozambique was hit by the deadly cyclone Idai which has left over 1.5 million people in need, among which
one million are children. The Government of Mozambique declared a national emergency due to the effects of the cyclone; The
Council of Ministers decided to conduct a Post Disaster Needs Assessment with the support of the World Bank, the European
Union and the United Nations. While the possibility of a revision of the State Budget and of the Economic and Social Plan
is under discussion, the Government has reallocated low priority spending to emergency response, and the international
community has been mobilizing resources to help Mozambique in filling the financial gap caused by the emergency.
In the 2019 State Budget -which is implemented at the time of writing- the Education Sector was allocated MT 56.7 billion,
representing the largest-ever nominal allocation to the sector. In real terms, the 2019 allocation to education is on par with those
of the past three years. In proportional terms, the Education Sector budget is worth 16.6 percent of the entire 2019 State Budget,
or 21.5 percent of the State Budget less financial operations and debt servicing, both denoting a decrease relatively to 2018. As
a share of GDP, the education sector budget is worth 5.9 percent, which is on par with last year’s share.
The Government has shown an increasing commitment to self-fund the Education Sector as internal resources have grown
from a 70 percent share in 2008 to a budgeted 90 percent share in 2019. The internal share would be higher if not for the national
currency’s depreciation that started in 2016 vis-à-vis donor currencies.
The investment-to-recurrent ratio in the Education Sector is budgeted at 12/88 per cent in 2019. The share of investment in the
education budget considerably decreased compared to last year, and even more so relatively to a decade ago. This is due to two
main factors: (i) the decrease in investment funding from donors; (ii) the rapid growth in recurrent spending, particularly in the
salaries & remunerations component.
Through Law 18/2018 on the National Education System the Government has marked an initial step towards reforming pre-
primary education by recognizing it as a subsystem within the Education sector. Despite a remarkable increase over time in
public spending dedicated to Early Childhood Education (ECE), the large pre-primary infrastructure gap and ECE-specific needs
in Mozambique will require large allocations in the budget.
2
Through Law 18/2018 on the National Education System the Government has marked an initial step towards reforming pre-
primary education by recognizing it as a subsystem within the Education sector. Despite a remarkable increase over time in
public spending dedicated to Early Childhood Education (ECE), the large pre-primary infrastructure gap and ECE-specific needs
in Mozambique will require large allocations in the budget.
6
1 Please note: All analysis was carried out with publicly available information. Where limitations were encountered, notes are made in the text. There are some minor discrepancies between the totals presented in past Budget Briefs and those presented in the 2019 edition. As data sources were updated, UNICEF revised its calculations. The viewpoints expressed in this brief are those of thxe author and do not necessarily represent those of UNICEF Mozambique and its partners.

3
KEY RECOMMENDATIONS
In addition to increasing the number of teachers (i.e. salaries & remunerations), there is a greater need for investments to increase sector’s
quality and efficiency by improving teachers’ qualifications, and accountability (internal control – better supervision), as well as by ensuring
better geographical teacher distribution.
The Education Common Fund (FASE) could serve as a platform to support not only the expansion of this sub-sector, but also a more
comprehensive policy and legal framework, as well capacity building of human resources. Although, increases in internal resources
allocations to ECE are also necessary.
The 2019 State Budget and Economic and Social Plan were
approved by Parliament on November 29, 2018; the State Budget was then promulgated by the President on December 14, published as Law 15/2018 on December 29, and entered into force on January 1, 2019. The approved budget is worth MT 340 billion (b), which is consistent with the original budget proposal submitted on September 29, 2018 by the Ministry of Finance and Economy (MEF).
In response to the state of emergency caused by the IDAI
cyclone that hit Mozambique in March, the Government of
Mozambique declared a national emergency, and requested
technical assistance from the World Bank Group, the European
Union and the United Nations to undertake a post-disaster needs
assessment in support of the recovery process. Category four Tropical Cyclone IDAI made landfall over the city of Beira in the Sofala province on March 14, producing strong winds and torrential rains that affected Sofala, Manica, Zambezia, Tete and Inhambane provinces and over 1.5 million people, of which approximately 1 million children2 (See Box #1).
In the face of the devastating impact of the cyclone, the Government of Mozambique declared on March 19 a national emergency, and the Council of Ministers decided on March 27 to conduct a needs assessment with the support of the WB, EU and UN. According to the Post Disaster Needs Assessment, the damage caused by IDAI is estimated to be over USD 1.4 billion, reflecting the cost of replacing infrastructure and physical assets3. At the time of writing, a revision of the State Budget and of the Economic and Social Plan (PES) is under consideration by the Government.
The international community has been mobilizing resources to
help Mozambique address the financing gap due to the national
emergency. The United Nations Flash Appeal for Idai response has a funding requirement of USD 281.7 m to cover the first three months of the response in support of people in need in the affected areas. As part of the UN Flash Appeal, UNICEF has requested USD 102.6 m to meet the humanitarian needs of the populations affected by the cyclone and to support the recovery phase (See Box #2 on UNICEF’s emergency response in the Education Sector).
The World Bank Group approved USD 350 m from its Crisis Response Window (CRW) to re-establish the water supply, rebuild damaged public infrastructure and crops, and support disease prevention, food security, social protection, as well as early warning systems
Effects of Idai CycloneBOX 1
2 Republic of Mozambique, Post Disaster Needs Assessment (PDNA) – Mozambique Tropical Cyclone IDAI, May 2019.
3 Ibid.
Introduction
UNICEF ongoing emergency response in EducationBOX 2
– temporary learning spaces (i.e. school tents) and child friendly spaces in the affected communities;
– learning and teaching materials in schools damaged; – materials to disinfect/clean schools to prevent further
cases of Cholera; – support to the Provincial Directorate of Education for the
relocation and return of displaced families who stayed in schools as temporary accommodation centers.
• 1.5 million people in need
• 1 million children in need
• 237,789 families displaced
• 382,717 students affected
• 9,616 teachers affected
• 4,219 classrooms damaged
• 1,372 schools affected
Source: Republic of Mozambique, Post Disaster Needs Assessment (PDNA) – Mozam-
bique Tropical Cyclone IDAI, May 2019.
Source: Republic of Mozambique, Post Disaster Needs Assessment (PDNA) – Mozam-
bique Tropical Cyclone IDAI, May 2019.

4
The Education Sector is composed of two sub-sectors: “General
Education” administered by MINEDH, and “TVET and Higher
Education” overseen by MCTESTP. The Education Sector, as defined by the National Directorate of Planning and Budget (DNPO), is divided into two categories: General Education and Higher Education. General Education, which is administered by the Ministry of Education and Human Development (MINEDH), includes pre-primary education, primary education (EP1 and EP2), teacher training for primary education, secondary education (ESG1 and ESG2), distance education, school libraries, and general education sector administration. Higher Education, administered by the Ministry of Science, Technology, Higher Education, and Technical Professional Training (MCTESTP), consists of universities, higher-learning institutes, teacher colleges, scholarships, as well as technical vocational education and training (TVET)6. The sector’s institutions operate at the central, provincial, and district levels of government, but not at the municipal level. MINEDH and MCTESTP oversee the sector at the central levels; Provincial Directorates of Education and Human Development (DPEDH) and Provincial Directorates for Science and Technology Higher Education and Technical Professional Training (DPCTESTP) manage the sector at the provincial level; and District Services for Education, Youth, and Technology (SDEJT) at the district level. Nevertheless, it is worth mentioning the above-described sector composition is being modified
by the National Education System (SNE) Law 18/2018 approved on 28 December 2018. According to the SNE Law, the National Education System will comprise of six subsystems, each having specific objectives and targeting different groups of students: (i) Pre-school Education; (ii) General Education; (iii) Adult Education; (iv) Professional Education; (v)Teachers Education and Training; (iv) Higher Education.
Education is one of the social sectors belonging to the priority
area of social and human capital in the Mozambican Government’s
agenda for national development. Education Sector planning and budgeting is guided by the 2012-2019 Education Strategic Plan (PEE)7. The PEE prioritizes (i) access to quality primary education and (ii) greater attention to early childhood development. Beyond the two main priorities, the education strategy also emphasizes post-primary education for economic development; diversification of school curriculum; introduction of technology in teaching; good governance of education resources; and improved management of education institutions and education systems at the district level8. When the PEE was extended from its original implementation term of 2012-2016 to 2012-2019, it was for the specific purpose of “improving primary education performance in the short and medium terms.”. For this purpose, an operational plan (2015-2018) was approved by the sector.
1. How is the Education Sector Defined?
in the impacted communities. 4 The International Monetary Fund (IMF) approved a USD 118.2 m rapid credit facility assistance to address the large budgetary and external financing gaps arising from reconstruction needs5. In fact, while the Government of Mozambique is reallocating lower priority spending to emergency assistance, the room for maneuver is limited; the international community is likely to help cover most of the emergency assistance and reconstruction needs. It is expected that the revised budget will have a larger share
of external funding than that in the current budget, mostly in the form of grants to ensure debt sustainability. The Education Sector budget is likely to undergo significant revisions of both internal allocations and external resources - particularly through FASE common fund- to allow for emergency response (i.e. establishing temporary learning spaces) and reconstruction (rehabilitation of schools, distribution of school materials, etc.) in the affected communities.
2. What Trends Emerge from the Education Budget?The analysis presented in this Budget Brief is based on the Education Sector allocation in the 2019 State Budget, which at the time of writing has been implemented for almost half of the year and is comparable to previous years’ allocations to the sector. However, text boxes throughout the Brief explain sector challenges arisen from the emergency, as well as ongoing changes in the sector’s allocations and activities to meet emergency needs. UNICEF Mozambique will be conducting a separate analysis on the emergency budget at sectoral level in case a State Budget revision is approved.
This report takes into consideration three distinct types of allocations to analyze trends in public spending: (i) “initial allocation” (dotação inicial), which refers to the budget appropriations agreed by Parliament in the budget law; (ii) “updated allocation” (dotação actualizada), which refers to the end-of-the-fiscal-year budget appropriations adjusted for actual revenues, adjusted government priorities, spending rates, etc.; and (iii) “expenditure” (realização), which refers to the amount of the budget that is spent.
6 All institutions belonging to the General Education sub-sector are tracked with the Autonomous Budget Holder Code (UGB) of 50 in budget and expenditure documents, while those belonging to higher education are tracked with the UGB 52.
7 The PEE implementation period was initially 2012-2016; however, in 2016, the implementation period was extended through 2019.
8 MINEDH. Education Strategic Plan (PEE) 2012-2016. Page 35.
4 World Bank Group, Press Release No.2019/074/AFR. World Bank scales up emergency support for Mozambique, Malawi, and Zimbabwe in the Wake of Cyclone Idai, 3 May 2019. Avail-able at http://www.worldbank.org/en/news/press-release/2019/05/03/world-bank-scales-up-emergency-support-for-mozambique-malawi-and-zimbabwe-in-the-wake-of-cyclone-idai
5 IMF Press Release No.13/121, April 19, 2019. Available at https://www.imf.org/en/News/Articles/2019/04/19/pr19121-republic-mozambique-imf-exec-board-approves-rapid-credit-facili-ty-assistance-cyclone-idai

5
The Education Sector was allocated MT 56.7 billion (US$ 930.4
million9) in the 2019 State Budget, representing the largest-ever
nominal allocation to the sector (see Figure #1A&B). The 2019 allocation denotes a 9 percent nominal increase and a 2 percent real-terms increase relative to the 2018 sector’s budget. Compared to 2017 Education expenditure, the 2019 initial allocation to the sector denotes a 17 percent increase in nominal terms and a 3 percent increase in real
terms. Historically, the 2019 initial allocation to education is the largest-ever nominal allocation to the sector, whereas it is on par with that of 2016, 2017 and 2018 in real terms. Between 2008 and 2018, expenditure has varied from the initial allocation by no more than an average MT 1 b or approximately 3 percent of the sector’s total value. Hence, based on the sector’s execution rates – and unlike other social sectors – it is expected that Education expenditure be well aligned with its initial allocation.
2.1 Total Education Sector Budget
9 Author’s calculation based on the average 2019 exchange rate at the time of writing, 1 USD = 60.9 Meticals.
10 Two methodologies can be used to calculate sector’s shares: (i) with the entire State Budget or government expenditure in the denominator or (ii) with the entire State Budget or gov-ernment expenditure less financial operations and debt servicing in the denominator. The Government of Mozambique employs the latter method. Nevertheless, this report also uses the former method as it is more accurate to benchmark with regional and income peer countries.
11 Last available data on Education Sector share of government expenditure and Education Sector share of GDP in LIC and SSA from World Development Indicators is year 2016. The author computed averages for LIC and SSA covering the years 2008 to 2016.
Education Sector budgeting and expenditureFIGURE 1A & B
Source: Author’s calculations from the CGE 2008-2017, REO IV 2018, LOE 2019.
Note: Figures represent entire Education Sector (i.e. General Education and Higher Education). For 2011, the CGE lists total Education Sector spending to be MT 14.7 b, however revised
sector totals for 2011, which include SDEJT district spending, list the total at MT 24.8 b. This revised expenditure total will be used to represent 2011 education spending for the rest
of the report. At the time of writing, the 2018 public expenditures account has yet to be finalized; in this regard, it is possible the expenditure total is slightly larger than shown. While
years 2008-2018 display expenditure figures, 2019 is the initial budget allocation.
The initial allocation to the Education Sector budget is worth 16.6
percent of the entire 2019 State Budget; or 21.5 percent of the State
Budget less financial operations and debt servicing (see Figure
#2A)10. Over the past decade, real growth in government expenditure outpaced real growth in education expenditure. In fact, between 2008 and 2014, the Education sector share of total government spending 21.7 percent in 2008 to 16.4 percent in 2014; later, in 2015 and 2016, the sector’s weight grew to 20.9 and 21.3 percent shares, respectively; it dipped to 17.7 percent in 2017, and 18.3 percent in 2018. Finally, it is budgeted at 16.6 percent in 2019, which will bring it back to 2014 value.
The Education Sector budget represents 5.9 percent of projected
GDP. This is on par with the share of 2018 education expenditure
vis-à-vis GDP (see Figure #2B). Between 2008 and 2015, real growth in education expenditure outpaced real GDP growth, while since 2015 real GDP growth has outpaced real growth in the sector’s spending. In fact,
while between the sector’s share of GDP increased, it has decreased since 2015, and in 2019 it is budgeted the same as last year.
Mozambique spends on education a larger share of its Government
total expenditure and GDP than its regional and income level peers
(see Figure #2A&B). Between 2008 and 2018, education spending in Mozambique averaged a 19.1 percent share of total government expenditure (or 22.6 percent share of government expenditure less financial operations and debt servicing), and a 6.3 percent share of GDP. Education sector spending in Low-income countries (LIC) and Sub-Saharan African countries (SSA) averaged 16.5 percent and 16.7 percent of Government expenditure, respectively. This is approximately 2.5 percentage points less than the Mozambican share. As a share of GDP, sector’s spending in LIC and SSA countries averaged 3.8 percent and 4.1 percent, respectively, both considerably smaller shares than in Mozambique11.
NOMINAL TERMS REAL TERMS
Bill
ion
s o
f M
etic
ais
(10^
9), C
urr
ent
Bill
ion
s o
f M
etic
ais
(10^
9), C
on
stan
t
2008 2009 2010 2011* 2012 2013 2014 2015 2016 2017 2018 2019Budget
0
10
20
30
40
50
60
Initial Allocation, Constant Revised Allocation, Constant Expenditure, Constant
2008 2009 2010 2011 2012 2013 2014 2015 2016 2017 20182019
Budget
Initial Allocation 14.8 16.3 18.3 22.2 26.2 32.2 37.8 44.7 44.3 48.3 52.0 56.7
Revised Allocation 17.0 18.2 22.2 28.3 28.6 32.7 40.1 45.6 49.4 54.2 59.5
Expenditure 15.1 16.1 19.9 24.8 26.8 31.7 37.3 41.8 47.0 51.9 55.5
0
10
20
30
40
50
60
70

6
The 2019 allocation to General Education is on par with 2018
expenditure while that to Higher Education represents an increase
relative to last year’s spending (see Figure #3). In 2019, General Education (i.e. primary and secondary education) is budgeted to receive MT 47.5 b. While this represents a 12 percent increase relative to 2018 initial allocation, it is on par with 2018 expenditure. Higher Education (i.e. tertiary education and TVET) is budgeted to receive MT 9.2 b this year, which is a 4 percent decrease relative to last year’s initial allocation but a 13 percent increase relative to actual expenditure. Nevertheless, 2019 real-terms allocations to the two sub-sectors are on par with those of last year. From a historical perspective, both sub-sectors remarkably expanded between 2008 and today but Higher Education spending increased at a faster pace. In fact, while General Education nominal spending increased from MT 13 b in 2008 to MT 47.5 in 2019 (or by over 250 percent), nominal allocations to Higher Education grew consistently from MT 1.9 b in 2008 to MT 9.2 b today (or by 370 percent). The real term increases in the two sub-sectors were less large but still relevant: 68 percent and 120 percent, respectively.
The ratio of general to higher education is 84 percent to 16 percent
in 2019 Budget, which is on par with the average ratio in the past
decade (see Figure #3). Over the past decade, General Education and Higher Education averaged 85 percent and 15 percent of total Education Sector spending, respectively. The variation in sub-sector shares over time has not been larger than 3 percentage points.
2.2 General Education versus Higher Education Budget
Trends in the weight of the Education Sector relative to total government spending and GDPFIGURE 2A & B
General Education and Higher Education BudgetFIGURE 3
Source: Author’s calculations from the CGE 2008-2017; REO IV 2018; LOE 2019. World Bank, World Development Indicators: Government expenditure on education, total (% of govern-
ment expenditure); Government expenditure on education, total (% of GDP).
Note: Figures represent entire Education Sector (i.e. General Education and Higher Education). LIC and SSA are averages for all Low-Income Countries and Sub-Sahara African Coun-
tries for which data is available. At the time of writing, the 2018 public expenditures account has yet to be finalized; in this regard, it is possible the expenditure total is slightly larger
than shown. The 2019 shares are initial budget allocations while the 2008-2018 shares are expenditure.
Source: Author’s compilation from the CGE 2008-2017; REO IV 2018; LOE 2019.
Note: At the time of writing, the 2018 public expenditures account has yet to be finalized;
in this regard, it is possible the expenditure total is slightly larger than shown. The 2019
shares are initial budget allocations while the 2008-2017 shares are expenditure.
EXPENDITURE IN NOMINAL TERMS
SHARE OF GOVERNMENT EXPENDITURE
SH
AR
E O
F G
OV
ER
NM
EN
T E
XP
EN
DIT
UR
E (
%)
SH
AR
E O
F G
RO
SS
DO
ME
ST
IC P
RO
DU
CT
(%
)B
ILLI
ON
S O
F M
ET
ICA
LS (
10^9
), C
UR
RE
NT
SHARE OF GROSS DOMESTIC PRODUCT
2008
Education Sector share of government expenditure (SSA Average)
Education Sector share of government expenditure (Mozambique)Education Sector share of government expenditure less financial operations & debt servicing (Mozambique)
2009 2010 2011 2012 2013 2014 2015 2016 2017 2018 2019Budget
Education Sector share of government expenditure (LIC Average)
10%
12%
14%
16%
18%
20%
22%
24%
26%
28%
30%
15.08%15.56%
16.6%
21.5%
3.77%
4.00%
5.9%
Education Sector share of GDP (SSA Average)Education Sector share of GDP (LIC Average)Real GDP growth, annual % (Mozambique)Education Sector share of GDP (Mozambique)
2008 2009 2010 2011 2012 2013 2014 2015 2016 2017 2018 2019Budget
0%
1%
2%
3%
4%
5%
6%
7%
8%
9%
10%
2008 2009 2010 2011 2012 2013 2014 2015 2016 2017 2018 2019Budget
General Education, UGB 50 Higher Education, UGB 52 MINED MCTESTP
0
10
20
30
40
50
60

7
The Education Sector in Mozambique is financed with both internal (i.e. domestic) and external (i.e. foreign) resources. Internal resources are collected domestically through taxes, tariffs, duties, and internal credits12. External resources, on the other hand, consist of foreign aid13, donations, and external credits. Two types of external resources fund the Education Sector: (a) “FASE contributions”, which is funding from development partners to the multi-donor Common Fund for Education, and (b) “Bilateral Project Funds”, which are all other grants and credits from partners not channeled through FASE14.
In the Education Sector, resources are budgeted on a five-year basis through the Medium-Term Fiscal Plan (CFMP) per the priorities laid out in the PEE and Operational Plan; then, re-budgeted into single-year sector budget proposals in accordance with the proposed PES. The education budget proposal and education section of the PES proposal are then negotiated with the Council of Ministers and the Ministry of Economy and Finance (MEF) before being submitted to Parliament. Parliament approves Education Sector resources as part of its approval of the State Budget, after which, the sector’s institutions utilize the resources in accordance with its annual Activities Plan (PdA).
3. What is the Source of Education Sector Resources?
12 Internal resources were complemented until 2015 by General Budget Support (GBS), which was un-earmarked, yet conditioned subsidies to the State Budget provided by a group of development partners.
13 Excluding General Budget Support
14 See 2018 Budget Brief for more details on how FASE contributions and Bilateral Project Funds are managed
General Budget Support, which was a consistent source of
financing for the Education Sector until 2016, remains suspended in
2019. GBS contributions to the State Budget prior to 2016 -when GBS was suspended in response to the country’s financial crisis- were greater than MT 10 b. This suspension has continued into 2019 and the gap in budget resources due to the GBS suspension has been partially filled by government through increased borrowing.
The 2019 Education Sector budget is funded 90 percent through
internal resources and 10 percent through external resources, which
signals a remarkable self-reliance in the Education Sector (see
Figure #4A&B). The share of domestic funding to Education increased at a constant pace over the years, from 70 percent in 2008 to 91 percent
in 2015. Then, due to increasing external donor funding at the subnational level, the internal to external resources ratio decreased to 87 percent internal to 13 percent external. Nevertheless, 2018 sector’s expenditure was 90 percent internally-financed. The 90 percent internal to 10 percent external ratio is confirmed in 2019 budget. The internal share would be higher if not for the national currency’s depreciation that started in 2016 vis-à-vis donor currencies. In fact, while in nominal terms external contributions to the sector increased by approximately 20 percent between 2008 and 2019, in real terms they decreased by 44 percent over the same period. Although donors have progressively contributed less in their own currency, it has been more in MT terms due to depreciation of the Mozambican currency (i.e. a US$ 1 donation in 2008 was worth approximately MT 24, whereas it is worth approximately MT 61 in 2019).
3.1 Internally- versus Externally-sourced Resources
Provision of internal versus external resourcesFIGURE 4A & B
Source: Author’s calculations from the CGE 2008-2017; REO IV 2018; LOE 2019: Quadro “Equilibrio Orçamental”.Note: Shares were calculated out of the entire State Budget, including financial operations and debt servicing. The education portion represents the entire Education Sector (i.e. General
Education and Higher Education).
NOMINAL TERMS PROPORTIONAL TERMS
SH
AR
E O
F TO
TAL
ED
UC
AT
ION
RE
SO
UR
CE
S, %
BIL
LIO
NS
OF
ME
TIC
AIS
(10
^9),
CU
RR
EN
T
2008 2009 2010 2011 2012 2013 2014 2015 2016 2017 2018 2019Budget
Internal Resources, Current External Resources, Current
0
10
20
30
40
50
60
Internal Resources (%) External Resources (%)
2008 2009 2010 2011 2012 2013 2014 2015 2016 2017 2018 2019Budget
0%
10%
20%
30%
40%
50%
60%
70%
80%
90%
100%

8
15 UNICEF, as FASE partner has access to these reports. 16 In Mozambique recurrent spending is exclusively financed through internal resources, whereas investment is both funded internally and externally. It must be noted that in Mozambi-can budget and expenditure documents all external funding is recorded in the budget as “external investment”, when in fact, it might have a portion dedicated to recurrent functions.
FASE commitments for 2019 are worth MT 7.1 m (see Figure #5).
Over the past decade, FASE commitments averaged MT 4.8 m, while execution averaged MT 3.6 m. Donors commitments of the Education Sector through FASE consistently increased over the past three years, culminating in the 2019 Budget. In fact, FASE is expected to contribute MT 7.1 m to Education, which represents a 32 percent increase relative to 2018 commitment, and over 90 percent increase relative to 2018 execution. It is important to mention that donors’ disbursements under FASE rarely matched commitments in the past decade. This hampers the ability of the Education Sector to effectively plan when not all resources are received.
3.2 Education Sector Support Fund (FASE)
Public spending is classified in official documents (i.e. State Budget Law, Expenditure Reports, etc.) into two different categories: Recurrent and Investment. Recurrent expenditure includes spending on salaries/remunerations, goods and services, operating costs, transfers, and financial operations. Investment (i.e. capital spending) spending is aimed at improving the Sector’s longer-term productivity and efficiency (i.e. construction of schools, libraries, additional classrooms, etc.)16.
The investment-to-recurrent ratio in 2019 Education budget is 12%
: 88%, which is considerably smaller than a decade ago, despite
nominal growth of investment spending (see Figure #6A&B). The Education sector is budgeted to receive MT 49.7 b for recurrent spending and MT 7 b for investment spending, in nominal terms. Over the past decade, recurrent spending has increased by over 400 percent
in nominal terms and over 130 percent in real terms. Conversely, investment spending has increased by 78 percent in nominal terms but decreased by 17 percent in real terms. In proportional terms, 88 percent of the sector’s resources are dedicated to recurrent purposes, while only 12 percent are for investment purposes. In 2008, recurrent was worth 65 percent of resources, while investment was worth 35 percent. Additionally, donors have been increasingly responsible for the Education sector’s investments. This is confirmed in 2019, as 83 percent of budgeted investment is financed externally, while just 7 percent domestically. In short, the proportional share of investment has decreased despite nominal growth for two main reasons: (i) the real value of investment funding from donors decreased and (ii) the share set aside for recurrent purposes is growing much faster than the share set aside for investment.
4.1 Recurrent versus Investment Spending
The Ministry of Economy and Finance releases initial funds (dotação inicial) via the CUT to each autonomous budget-holding education institution and subsequently updates the allocation based on budget execution rates and available resources (dotação actualizada). The institutions track spending (execução) through the e-SISTAFE (Government integrated financial management information system), which sources quarterly budget execution reports (REOs) and the
annual General State Account (CGE). The Education Sector also produces quarterly FASE financial reports or unaudited Intermediary Financial Reports (IFRs), which provide details on FASE resources. 15
In this report, the 2019 education budget will be analyzed from the following three perspectives: (i) recurrent vs. investment spending (ii) by education institution; (iii) by functional (i.e. programmatic) area.
4. How are Education Sector Resources Spent?
FASE commitments and disbursementsFIGURE 5
Source: Author’s calculations from the CGE 2008-201; REO IV 2018; LOE 2019 and
MINEDH’s PdA 2019 Revised Version.
BIL
LIO
NS
OF
ME
TIC
ALS
(10
^9),
CU
RR
EN
T
2008 2009 2010 2011 2012 2013 2014 2015 2016 2017 2018
FASE disbursement FASE commitment
0.0
1.0
2.0
3.0
4.0
5.0
6.0
7.0
8.0
9.0
2019Budget
© Adobestock/ davideb89

9
4.1.1 Investment The procurement and distribution of school desks is the largest
investment in the 2019 education budget (see Table #1). The Government of Mozambique has planned to procure and distribute 224,775 school desks in 2019, which corresponds to an investment of MT 1.3 b, fully internally financed. The distribution of school textbooks is the second largest investment program planned for 2019, and it is almost entirely funded by donors.
4.1.2 RecurrentThe largest share of recurrent spending as well as total education
spending has been dedicated to salaries and remunerations (see
Figure #7). Over the past four years, salaries and remunerations were worth an average of 79 percent of the sector’s total spending. While it is typical of education systems to have large recurrent expenditure, the concern for Mozambique is that recurrent has steadily increased, particularly the salaries & remuneration component that went from a 75 percent share in 2015 to a 81 percent share both in 2018 and 2019. This has been crowding out other relevant public investments in education necessary to improve sector’s quality and efficiency. For instance, in addition to increasing the number of teachers (i.e. salaries & remunerations), there is a greater need for investments aiming at improved teachers’ qualifications, better geographical distribution, as well as improved teachers’ accountability.
The number of new teachers hired in 2019 is larger than last year but below the average for previous years. While in recent years an average of 8,400 new teachers were hired every year, according to the 2019 Plan of Activities for the Education Sector, 6,413 new teachers will be hired this year17. Although below the sector’s average, this represents a 23 percent increase relative to last year’s new hires.
17 It must be noted that most of the teachers hired in 2019 and 2018 are for primary education.
Largest Investments in the Education Sector
Activity Internal Investment
External Investment
Investment Total
Procurement and distribution of school desks
1 304 - 1 304
Distribution of school books 3 1 118 1 121
Construction of classrooms 270 444 715
Pre-school program - pilot project - 253 253
Rehabilitation of technical schools - 179 179
Source: Author’s compilation from ‘Social & Economic Sectors in 2019’ file provided by
MoEF.
Resource shares by economic classification category FIGURE 7
Source: Author’s compilation from MINEDH, PdA 2018 and PdA 2019.
Note: Shares are based on solely the “General Education” segment of the Education
Sector budget. All shares presented for 2015-2019 represent budgeted shares and not
expenditure.
Recurrent versus investment resourcesFIGURE 6A & B
Source: Author’s calculations from the CGE 2008-2017, REO IV 2018, LOE 2019.
Note: Figures represent entire Education Sector (i.e. General Education and Higher
Education.
Largest Education Sector investmentsTABLE 1
NOMINAL TERMS PROPORTIONAL TERMS
BIL
LIO
NS
OF
ME
TIC
AIS
(10
^9),
CU
RR
EN
T
SH
AR
E O
F TO
TAL
ED
UC
AT
ION
RE
SO
UR
CE
S, %
SH
AR
E O
F “G
EN
ER
AL
ED
UC
AT
ION
” R
ES
OU
RC
ES
BY
E
CO
NO
MIC
EX
PE
ND
ITU
RE
CLA
SS
IFIE
R, (
%)
2008 2009 2010 2011 2012 2013 2014 2015 2016 2017 2018 2019Budget
Recurrent (Internal), Current
Investment (External), Current
Investment % (Internal), Current
Investment %
0
10
20
30
40
50
60
0% 0%
5% 5%
10%10%
15%15%
20%20%
25%
25%
35%
35%
40%
40%
30%
30%
45%
45%
45%
Investment (Internal), % Investment (External), %Recurrent (Internal), %
2008 2009 2010 2011 2012 2013 2014 2015 2016 2017 2018 2019Budget
Other Expenditureswith InvestmentEquipment
Construction
Transfers
Services
Goods
Other Expenditureson PersonnelSalaries & Remunerations
#ofnewteachers
2015 2016 2017 2018 2019Budget
0%
10%
20%
30%
40%
50%
60%
70%
80%
90%
100%
-
1 000
2 000
3 000
4 000
5 000
6 000
7 000
8 000
9 000
10 000

10
The share of General Education funding going to education
district services (SDEJTs) has increased again in 2019 budget
(see Figure #8). The share resources dedicated to SDEJTs, which represents the Ministry at the district level, has increased at a steady pace from 44 percent in 2015 to a budgeted 70 percent this year. Conversely, DPEDHs share decreased from 24 percent in 2015 to 13 percent in 2019 and the share of resources allocated to MINEDH halved from 12 percent to 6 percent. The allocations to other central-level general education institutions (e.g. Language Institute, Distance Education, etc.) collectively decreased over the same period of time. These trends show that decentralization happened from both the central and provincial levels to the district level.
The large decrease in MINEDH’s funding has two main reasons: (i) the deconcentration of other Education Sector institutions from MINEDH’s own budget and (ii) the decrease in external donor funding to the sector, particularly at the central level, which is habitually channeled through the Ministry. This second reason does not necessarily imply that donors have decreased sector funding equal to the decrease in external funding to MINEDH; rather, post disclosure of hidden loans in 2016, donors have recently been relying on alternative funding modalities that are not inscribed on MINEDH’s budget and not channeled through the single treasury account (CUT)18.
4.2 Resource Use by Education Institution
Over 60 percent of education resources budgeted in 2019 are
dedicated to primary and pre-primary education (see Figure
#9). While over the past five years, Primary Education (including pre-primary) received, on average, one-half of the total resources dedicated to General Education, it is budgeted to receive approximately 63 percent of the sector’s resources this year. More specifically, 53 percent will be dedicated to Primary Education, and 11 percent to pre-primary education. It is worthwhile noting that this is the first year that pre-primary education receives such a large share of general education budget. (See Box 3 on ECE spending). Administration and Institutional Development also saw an increase in allocation from a 16 percent share to 22 percent share. On the other hand, the share of education spending dedicated to Secondary Education dropped from 29 percent last year to just 12 percent in 2019 budget; and vocational training spending decreased from a 3 percent share to 1 percent.
(Boxes 4 and 5 describe emergency preparedness activities planned in the Education Program of Activities (PdA) approved before IDAI, and the revision to respond to the emergency, respectively.)
4.3 Resource Use by Functional Area
18 See 2018 Education Budget Brief.
Resource shares by institutionFIGURE 8
Resource shares by functional areaFIGURE 9
Source: Author’s calculations from, CGE 2015-2017, 2018 REO IV, and LOE 2019.
Note: Shares are based on solely the “General Education” segment of the Education
Sector budget.
Source: MINEDH, PdA 2015 - 2019
Note: Shares are based on solely the “General Education” segment of the Education Sector budget. All shares presented for 2015-2019 represent budgeted shares and not expenditure.
SH
AR
E O
F “G
EN
ER
AL
ED
UC
AT
ION
” R
ES
OU
RC
ES
B
Y IN
ST
ITU
TIO
NA
L C
LAS
SIF
IER
, (%
)
SH
AR
E O
F “G
EN
ER
AL
ED
UC
AT
ION
” R
ES
OU
RC
ES
B
Y F
UN
CT
ION
AL
CLA
SS
IFIE
R, (
%)
2015 2016 2017 2018 2019Budget
District Services for Education, Youth, and Technology (SDEJT)
Provincial Director-ates of Education and Human Development (DPEDH)
Ministry ofEducation andHuman Development (MINEDH)
Eduardo Mondlane University
ProvincialPedagogicaUniversities
Other Education Institutions
0%
20%
40%
60%
80%
100%
2015 2016 2017 2018 2019Budget
0%
20%
40%
60%
80%
100%
Culture
Adult Literacy and Education
Vocational Education
Secondary Education
Administrational and Institutional Development
(Pre-) Primary Education
© Adobestock/ kriss75
11
Early Childhood Education FundingBOX 3
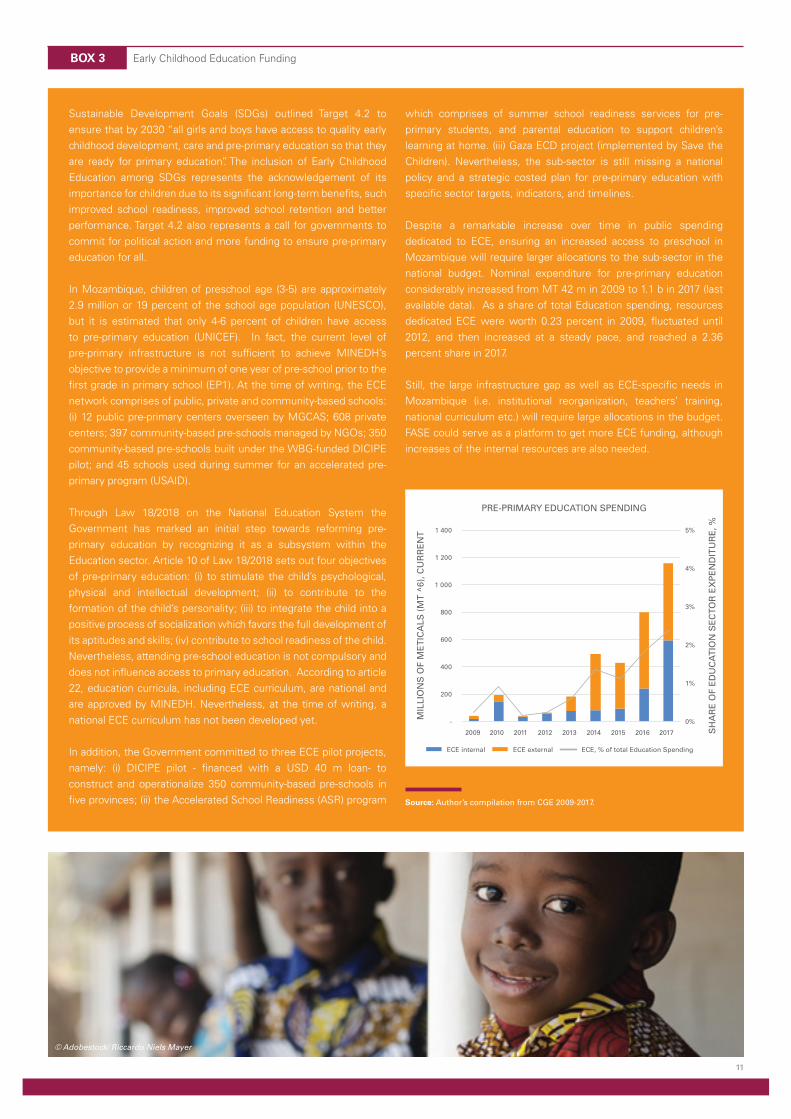
Sustainable Development Goals (SDGs) outlined Target 4.2 to ensure that by 2030 “all girls and boys have access to quality early childhood development, care and pre-primary education so that they are ready for primary education”. The inclusion of Early Childhood Education among SDGs represents the acknowledgement of its importance for children due to its significant long-term benefits, such improved school readiness, improved school retention and better performance. Target 4.2 also represents a call for governments to commit for political action and more funding to ensure pre-primary education for all.
In Mozambique, children of preschool age (3-5) are approximately 2.9 million or 19 percent of the school age population (UNESCO), but it is estimated that only 4-6 percent of children have access to pre-primary education (UNICEF). In fact, the current level of pre-primary infrastructure is not sufficient to achieve MINEDH’s objective to provide a minimum of one year of pre-school prior to the first grade in primary school (EP1). At the time of writing, the ECE network comprises of public, private and community-based schools: (i) 12 public pre-primary centers overseen by MGCAS; 608 private centers; 397 community-based pre-schools managed by NGOs; 350 community-based pre-schools built under the WBG-funded DICIPE pilot; and 45 schools used during summer for an accelerated pre-primary program (USAID).
Through Law 18/2018 on the National Education System the Government has marked an initial step towards reforming pre-primary education by recognizing it as a subsystem within the Education sector. Article 10 of Law 18/2018 sets out four objectives of pre-primary education: (i) to stimulate the child’s psychological, physical and intellectual development; (ii) to contribute to the formation of the child’s personality; (iii) to integrate the child into a positive process of socialization which favors the full development of its aptitudes and skills; (iv) contribute to school readiness of the child. Nevertheless, attending pre-school education is not compulsory and does not influence access to primary education. According to article 22, education curricula, including ECE curriculum, are national and are approved by MINEDH. Nevertheless, at the time of writing, a national ECE curriculum has not been developed yet.
In addition, the Government committed to three ECE pilot projects, namely: (i) DICIPE pilot - financed with a USD 40 m loan- to construct and operationalize 350 community-based pre-schools in five provinces; (ii) the Accelerated School Readiness (ASR) program
which comprises of summer school readiness services for pre-primary students, and parental education to support children’s learning at home. (iii) Gaza ECD project (implemented by Save the Children). Nevertheless, the sub-sector is still missing a national policy and a strategic costed plan for pre-primary education with specific sector targets, indicators, and timelines.
Despite a remarkable increase over time in public spending dedicated to ECE, ensuring an increased access to preschool in Mozambique will require larger allocations to the sub-sector in the national budget. Nominal expenditure for pre-primary education considerably increased from MT 42 m in 2009 to 1.1 b in 2017 (last available data). As a share of total Education spending, resources dedicated ECE were worth 0.23 percent in 2009, fluctuated until 2012, and then increased at a steady pace, and reached a 2.36 percent share in 2017.
Still, the large infrastructure gap as well as ECE-specific needs in Mozambique (i.e. institutional reorganization, teachers’ training, national curriculum etc.) will require large allocations in the budget. FASE could serve as a platform to get more ECE funding, although increases of the internal resources are also needed.
Source: Author’s compilation from CGE 2009-2017.
MIL
LIO
NS
OF
ME
TIC
ALS
(M
T ^
6), C
UR
RE
NT
PRE-PRIMARY EDUCATION SPENDING
SH
AR
E O
F E
DU
CA
TIO
N S
EC
TOR
EX
PE
ND
ITU
RE
, %
20132012201120102009 2014 2015 2016 2017
ECE, % of total Education SpendingECE externalECE internal
0%
1%
2%
3%
4%
5%
-
200
400
600
800
1 000
1 200
1 400
© Adobestock/ Riccardo Niels Mayer

12
Revision of the Education Program of Activities after IDAI Cyclone
BOX 5
The Program of Activities was revised by MINEDH in response to IDAI cyclone and floods. Major changes at the central level were as follows: (a) Education lower priority activities for approximately MT 500 m were cancelled; (b) sector´s activities worth about MT 100 m were adjusted; (c) new activities worth MT 1.8 b were approved, of which approximately MT 900 m (or USD 15 m) to address first emergency needs in the affected areas. Emergency response allocations are for the procurement and distribution of school materials and textbooks, teachers’ kits, hygiene kits, school desks, tents for classrooms, emergency toolkits for pupils and teachers, post-emergency psychosocial support, etc. Provincial allocations are still being modified at the time of writing. Major changes are expected in the mostly affected provinces Manica, Sofala, Tete and Zambezia.
Source: MINEDH, 2019 PdA, revised version.
Emergency Preparedness Activities for Education initially planned for 2019 (before IDAI)
BOX 4
The first version of the 2019 Education Program of Activities by MINEDH included approximately MT 550 m for emergency preparedness and response activities, at the central level. These included, among others: (i) construction and rehabilitation of classrooms in areas affected by emergencies; (ii) technical assistance for post-emergency rehabilitation; (iii) design and procurement of informational materials on environmental & social safeguards in the emergency pilot project; (iv) natural disaster risk management at the school level through the provision of emergency school kits and pre-positioning of mobile units; (v) support to higher risk-SDEJTs (i.e. Sofala, Manica, Tete, Cabo Delgado and Niassa) in the divulgation and implementation of the emergency school manuals.
Source: MINEDH, 2019 PdA, first version.
The Education Sector has executed 93 percent of the last year’s
budget, which is on par with the sector’s average execution (see
Figure #10). Over the past decade, the Education Sector executed on average 92 percent of its budget. This is higher than the average execution rates of other social sectors, as well as that of the overall State Budget. High execution of the Education Sector budgets is partly related to the predominance of salaries & remunerations (see Paragraph 4.1.2) which are relatively easier to spend. Also, the
sector’s aggregate execution would be even higher if external funding were better executed. In fact, while internal funding was executed at an average 95 percent, external funding was executed at an average 71 percent between 2008 and 2018. In 2018, external investment had a particularly low execution rate of just 64 percent, mostly due to very low execution of external funding directed to University of Lurio (17 percent execution rate), MINEDH (49 percent), and MCTESP (58 percent).
5. How Well Has the Education Sector Executed its Past budgets?
Budget execution by spending categoryFIGURE10
Source: Author’s calculations from the CGE 2008-2017 and REO IV 2018.
Note: Figure represents entire Education Sector (i.e. General Education and Higher Education). At the time of writing, the 2018 public expenditures account has yet to be finalized; in this
regard, it is possible the execution rate is slightly larger than shown.
100%
92%
71%
100%
95%
77%
97%
99%
73%
98%
97%
63%
99%
97%
73%
97%
100%
93%
99%
99%
67%
100%
99%
51%
100%
85%
73%
99%
71%
84%
99%
78%
64%
SH
AR
E O
F IN
ITIA
L B
UD
GE
T E
XE
CU
TE
D B
Y
EN
D O
F FI
SC
AL
YE
AR
(%
)
Recurrent Internal Investment External Investment Aggregate Budget Execution
201320122011201020092008 2014 2015 2016 2017 20180%
10%
20%
30%
40%
50%
60%
70%
80%
90%
100%
93%96%95%
92%93%
97%94%
88%90%
91%89%

13
6. How Has the Education Sector Performed?
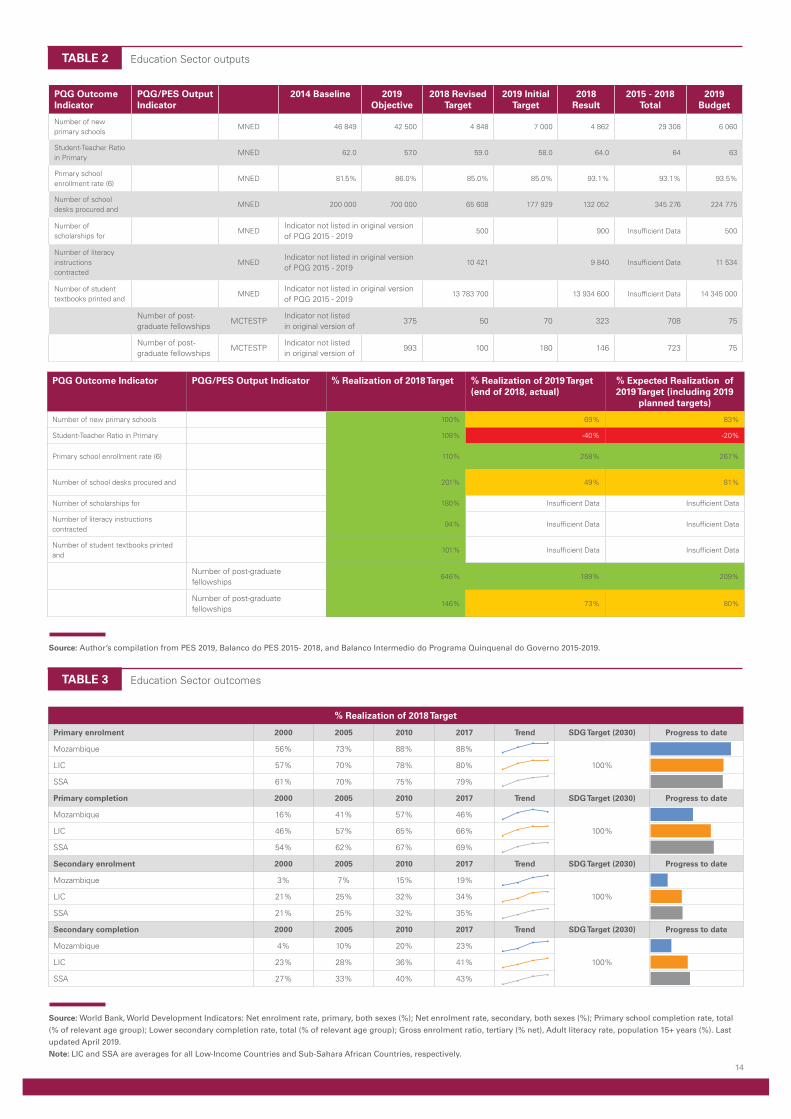
The Education targets set in the 2018 Economic and Social Plan
were fully met. Nevertheless, given the PES targets planned for
2019, some PQG milestones may remain unachieved at the end
this year (see Table #2). The most concerning indicator is student-teacher ratio in primary school. In fact, while the PQG had set a target of bringing the ratio down to 57, in 2019 from baseline of 62, in 2014, this ratio has worsened over the years and reached 64, in 2018. This means that the number of students enrolled in primary school has outpaced the increases in teacher hires19. This is of concern because while there is no substantial reduction in the salary cost, the quality
of inputs to education is worsening. In fact, in EP1 the increase in the number of students per group (turmas) is lower than the increase in the number of teachers teaching 2 shifts (turnos). This leads to less time to prepare class materials and lessons, but an increase in the salaries of teachers who teach an additional shift. MINEDH data shows a decrease of teachers with one shift between 2017 and 2018, and an increase of teachers covering 1.5 or 2 shifts. Other two main PES targets require prioritization in order to substantially meet the related 2019 PGQ objectives: (i) primary school teacher hires; (ii) school desk procurement.
6.1 Education Outputs
Increased education spending has helped improve primary school
enrolment but not learning and completion. Government spending directed towards primary school education in Mozambique has been getting more students to the classrooms relatively to Mozambique’s regional and income level peers; however, the same spending has done little to retain students in school at levels that are comparable to its peers20. In fact, while Mozambique has achieved a higher primary school enrolment rate and has improved at a faster pace than in LIC and SSA, it is well behind its peers on completion rates and far from reaching universal primary completion. Even more concerning is the worsening of primary completion rate in recent years coupled with low learning outcomes, which suggests that low sector efficiency is hindering performance. According to the second national evaluation of 3rd-graders21, only 4.6 percent of 3rd grade pupils achieved level III of alphabet knowledge, considered the necessary level for pupils in this group. For secondary education, both enrolment and completion rates improved over time at a faster pace than those of LIC and SSA but have not reached those levels yet.
Absenteeism and low teacher capacity are major obstacles to the
achievement of education outcomes in Mozambique. The World Bank’s Mozambique Service Delivery Indicators for Education (2015) reported that on unannounced school visits, an average 56 percent of students were not present; 45 percent of school teachers were not present in the classroom; and 44 percent of school directors were not at the school. When testing teachers on the school curriculum they were responsible to teach, the study found that only 1 percent of teachers scored above 80 percent, and the average score was just 29 percent. In comparison to other six countries where the SDI study was conducted, Mozambican students have reported lower average scores in language, math, non-verbal reasoning skills given high level of sector’s spending.
6.2 Education Outcomes
19 In the Balanco da PES it is explained that the student-teacher ratio increased as a consequence of the extraordinary increase of 6.9 percent of enrollments in primary school.20 Empirical evidence from around the world shows that there is a positive correlation between increased spending and improved enrolment rates, especially at lower levels of spending and under the assumption that resources are spent effectively. 21 MINEDH - INDE, Relatório da Segunda Avaliação Nacional da 3a Classe, 2016.
© Adobestock/ Adam Ján Fige
14
% Realization of 2018 Target
Primary enrolment 2000 2005 2010 2017 Trend SDG Target (2030) Progress to date
Mozambique 56% 73% 88% 88%
100%LIC 57% 70% 78% 80%
SSA 61% 70% 75% 79%
Primary completion 2000 2005 2010 2017 Trend SDG Target (2030) Progress to date
Mozambique 16% 41% 57% 46%
100%LIC 46% 57% 65% 66%
SSA 54% 62% 67% 69%
Secondary enrolment 2000 2005 2010 2017 Trend SDG Target (2030) Progress to date
Mozambique 3% 7% 15% 19%
100%LIC 21% 25% 32% 34%
SSA 21% 25% 32% 35%
Secondary completion 2000 2005 2010 2017 Trend SDG Target (2030) Progress to date
Mozambique 4% 10% 20% 23%
100%LIC 23% 28% 36% 41%
SSA 27% 33% 40% 43%
PQG Outcome Indicator PQG/PES Output Indicator % Realization of 2018 Target % Realization of 2019 Target (end of 2018, actual)
% Expected Realization of 2019 Target (including 2019
planned targets)
Number of new primary schools 100% 69% 83%
Student-Teacher Ratio in Primary 108% -40% -20%
Primary school enrollment rate (6) 110% 258% 267%
Number of school desks procured and 201% 49% 81%
Number of scholarships for 180% Insufficient Data Insufficient Data
Number of literacy instructions contracted
94% Insufficient Data Insufficient Data
Number of student textbooks printed and
101% Insufficient Data Insufficient Data
Number of post-graduate fellowships
646% 189% 209%
Number of post-graduate fellowships
146% 73% 80%
Source: Author’s compilation from PES 2019, Balanco do PES 2015- 2018, and Balanco Intermedio do Programa Quinquenal do Governo 2015-2019.
Source: World Bank, World Development Indicators: Net enrolment rate, primary, both sexes (%); Net enrolment rate, secondary, both sexes (%); Primary school completion rate, total
(% of relevant age group); Lower secondary completion rate, total (% of relevant age group); Gross enrolment ratio, tertiary (% net), Adult literacy rate, population 15+ years (%). Last
updated April 2019.
Note: LIC and SSA are averages for all Low-Income Countries and Sub-Sahara African Countries, respectively.
Education Sector outputsTABLE 2
Education Sector outcomesTABLE 3
PQG Outcome Indicator
PQG/PES Output Indicator
2014 Baseline 2019 Objective
2018 Revised Target
2019 Initial Target
2018 Result
2015 - 2018 Total
2019 Budget
Number of new primary schools
MNED 46 849 42 500 4 848 7 000 4 862 29 308 6 060
Student-Teacher Ratio in Primary
MNED 62.0 57.0 59.0 58.0 64.0 64 63
Primary school enrollment rate (6)
MNED 81.5% 86.0% 85.0% 85.0% 93.1% 93.1% 93.5%
Number of school desks procured and
MNED 200 000 700 000 65 608 177 929 132 052 345 276 224 775
Number of scholarships for
MNEDIndicator not listed in original version of PQG 2015 - 2019
500 900 Insufficient Data 500
Number of literacy instructions contracted
MNEDIndicator not listed in original version of PQG 2015 - 2019
10 421 9 840 Insufficient Data 11 534
Number of student textbooks printed and
MNEDIndicator not listed in original version of PQG 2015 - 2019
13 783 700 13 934 600 Insufficient Data 14 345 000
Number of post-graduate fellowships
MCTESTPIndicator not listed in original version of
375 50 70 323 708 75
Number of post-graduate fellowships
MCTESTPIndicator not listed in original version of
993 100 180 146 723 75

- Initial Allocation (Dotação Inicial): The first allocation of funds, approved by Parliament- Revised Initial Allocation (Dotação Rectificativa): A revised allocation of funds, approved by Parliament - Updated Allocation (Dotação Actualizada): The total funds that arrive at the disposal of a given education institution- Expenditure (Despesa Realizada): Allocated funds spent on education investment and recurrent costs- Budget Execution (Execução do Orçamento): Percentage of allocated funds spent out of the total allocation- Nominal Values; Current: Numbers not corrected for the effect of inflation- Real Values; Constant: Numbers corrected for inflation
GLOSSARY OF BUDGET TERMS:
ACRONYMS:
- b: Billion- CGE: General State Account (Final Government Expenditure Report)- CUT: Single Treasury Account- DPCT: Provincial Delegation for Science and Technology- DPEDH: Provincial Directorate of Education and Human Development- GBS: General Budget Support- GDP: Gross Domestic Product- LIC: Low Income Country- LOE: State Budget Law- MCTESTP: Ministry of Science, Technology, Higher Education, and Technical Professional Training- MINEDH: Ministry of Education and Human Development- m: Million- MEF: Ministry of Economy and Finance
- MT: Mozambican Metical (Local Currency)- OE: State Budget- PdA Activities Plan- PEE: Education Strategic Plan- PES: Economic and Social Plan- PPP: Purchasing Power Parity- PQG: Government Five-Year Plan - FASE: Education Common Fund- REO: State Budget Execution Report (Government Expenditure Update Report)- SDEJT: District Services for Education, Youth, and Technology- SSA: Sub-Sahara Africa- TVET: Technical Vocational Education and Training- UEM: Eduardo Mondlane University- US$: United States Dollar (Currency)- UGB: Autonomous Budget Holder Code
Fó
© Adobestock/ Riccardo Niels Mayer