movr - data.wurfl.iodata.wurfl.io/movr/pdf/2016_q1/movr_2016_q1.pdf · – movr focuses on mobile...
TRANSCRIPT

The first step in a great mobile experience
MOVRMobile Overview ReportJanuary – March 2016
The first step in a great mobile experience

2

3

MOVR
39% 38%
61% 62%
2015Q1 2016Q1
• Purpose of Report
– ScientiaMobile has published MOVR to provide the mobile Web community with timely information on mobile Web device usage.
– We hope to stimulate interest in mobile device trends, device capabilities, and tools for analyzing and managing device fragmentation.
• Sources of Data and Filtering
– The information in this report is based on a representative sample of a larger data set. The sample size is over 26.7 billion requests from April 2014 to end of March 2016.
– MOVR focuses on mobile devices, consisting of smartphones, tablets, and feature phones.
– While the data set includes desktops, laptops, smart TVs, game consoles, apps, and robots, we have excluded them, unless otherwise noted.
– We have used an Equivalent Weighted Sites (EWS) methodology that indexes the traffic at each site and assigns an equal weight to each site.
– Samples sizes for Africa and Oceania are small enough that we have a low level of confidence that these figures are representative. However, the source data from these continents continues to grow. Over time, we will improve the quality of these figures. In the meantime, we feel that more information is better than less for people looking for insights in these continents.
– To download the data files supporting MOVR, or subscribe to future publications of MOVR, please visit us at www.scientiamobile.com/movr
4
Report Specifications
Excluded• Desktops and laptops• Smart TV• Game Consoles• Apps• Robots
Included• Smartphones• Tablets• Feature
Phones
Definitions
• What is a “hit”? Each time a user visits a Web page and a UA is generated and tested by WURFL (through a number of mechanisms), a “hit” is recorded in the ScientiaMobile dataset. All data reported in MOVR reflects hits, not the count of physical devices generating the hit.
• What is a smartphone? A smartphone must meet several criteria, including that it should be a wireless device, have a touch screen with horizontal resolution greater than or equal to 320px, and not be considered a tablet.
• What is a tablet? Criteria for a tablet include: a wireless device, larger than 6” screen, and running a mobile or tablet OS. One exception is that a full version of Windows running on a tablet is considered to be a laptop.

MOVR
• What is a feature phone? It is a wireless device that falls into one of the three categories: classic feature phones, modern feature phones, and old smartphones
– Classic feature phone: Typically a bar, slide or clamshell form factor with limited possibilities to install apps and a proprietary OS. Other criteria include a physical keyboard and a low price range. Examples are Nokia Series 30 and 40 or Motorola Razr devices.
– Modern feature phone: These phones also have a low price range. They are “smartphone-like”, but targeted at the classic feature phone market. They may have a smartphone OS. They borrow features from classic feature phones, such as size or screen size. Examples are Nokia Asha series or Samsung Galaxy Pocket.
– Old smartphones: These smartphones are older than 3 years and were high-end devices when launched. Classic Blackberry devices and Symbian-based devices fall in this category. Likewise, more recent devices with a touch screen, but with older hardware or older versions of Android, iOS or Windows Phone also fall in this category.
• What is MNO Traffic? Traffic originating from Mobile Network Operators (MNO). It is defined, in our research method, as the connection type provided by the browser navigator.connectionAPI.
5
Definitions (continued) About WURFL
• ScientiaMobile uses its WURFL products to collect and analyze the device intelligence contained in the MOVR report. WURFL is a Device Detection Repository (DDR) that integrates an API and XML to provide an always-updated source for detecting devices and their capabilities. For more than 10 years, WURFL has been the industry standard for device detection. Today, ScientiaMobile offers a number of WURFL products to match a range of needs, from small developers to large enterprises.
• WURFL OnSite and WURFL InFuze provide businesses with high performance server-side device detection solutions.
• WURFL.js and WURFL.js Business Edition provide front-end developers with access to the power of device detection through JavaScript snippets.
• WURFL InSight provides business intelligence analysts with a table-based device detection tool that will integrate easily with data analysis tools.
• ImageEngine combines mobile device detection, with image resizing and file optimization, with CDN-type delivery. It provides significantly faster downloads, especially on mobile devices.

MOVR
• We have shortened this quarterly report because you can now get up-to-date reports directly from our MOVR Visualization Tool.
• Sign up for an account for full access to MOVR Visualization Tool.
• Run interactive reports on up-to-date MOVR information.
• Export to high-quality PNG images.
• Share URL of reports you have generated.
• Export data as CSV.
• Still subscribe to MOVR quarterly reports for special reports.
6
Visit the MOVR Visualization Tool
Click Here For Our
MOVR Visualization Tool
MOVR
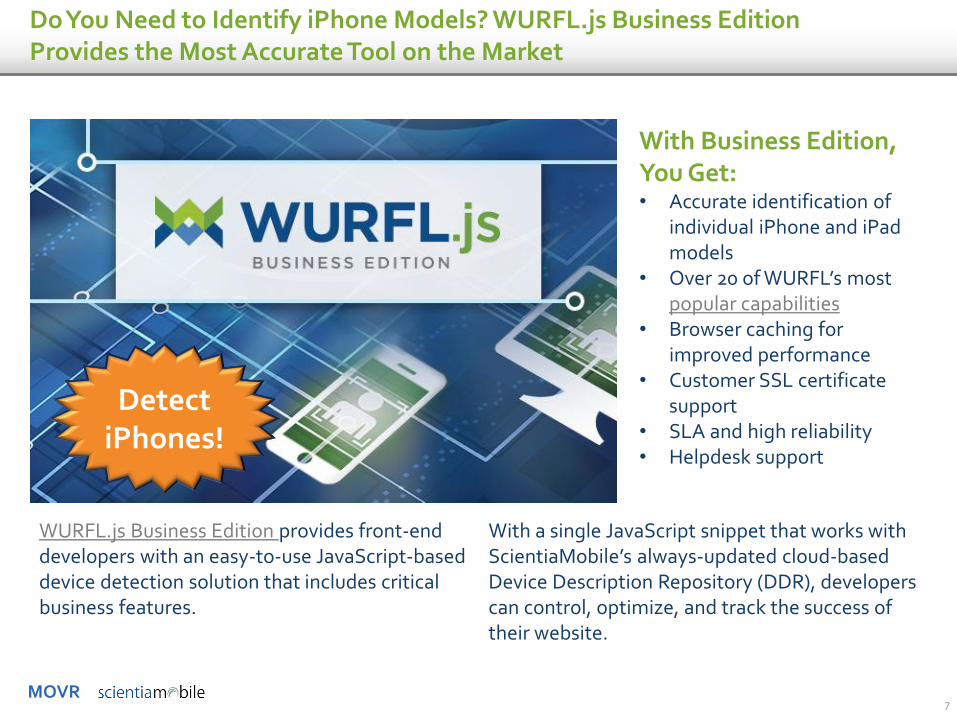
WURFL.js Business Edition provides front-end developers with an easy-to-use JavaScript-based device detection solution that includes critical business features.
7
Do You Need to Identify iPhone Models? WURFL.js Business Edition Provides the Most Accurate Tool on the Market
With a single JavaScript snippet that works with ScientiaMobile’s always-updated cloud-based Device Description Repository (DDR), developers can control, optimize, and track the success of their website.
With Business Edition, You Get:• Accurate identification of
individual iPhone and iPad models
• Over 20 of WURFL’s most popular capabilities
• Browser caching for improved performance
• Customer SSL certificate support
• SLA and high reliability• Helpdesk support
Detect iPhones!

MOVR8
Image Engine: A Mobile Image Resizing and Delivery Service
Achieve 60% Payload Reduction and Load Time ImprovementStart a Trial of ImageEngine Lite today
http://www.scientiamobile.com/page/imageengine

MOVR9
How Much Are Over-Sized Images Slowing Down the Web?
• Web performance (#webperf) is a subject of much attention, generating solutions ranging from CDNs to HTTP2, to sequencing technology.
• However, one fundamental question that is often overlooked is “are we forcing delivery of images that are larger than they need to be for the desktop or mobile devices?”
• For the median size page with an original payload of 470kb, we found that resizing and reformatting image for desktops reduced the image payload to 339kb – or a 28% savings on average.
• Furthermore, when resizing for mobile smartphones, we achieved an image payload that was 179kb, or a 62% savings.
• With the emerging responsive image specification and the massive amount of work that is entailed to resize hundreds images for breakpoints on different devices, one must wonder – what are the potential gains in web performance?
• Similar to our “Mobilegeddon” analysis, we surveyed the top 5,000 web sites with a tool that evaluated potential savings by resizing images based on device size and using an optimized file format (e.g. converting to WEBP) with no perceptible impact on user experience.
Image Savings on Median of Top 5,000 Pages
470
339
179
0
50
100
150
200
250
300
350
400
450
500
Original OptimizedDesktop
Optimized MobileIm
age
Pay
load
(kb
)
62% Savings on Mobile Devices

MOVR10
How Much Are Over-Sized Images Slowing Down the Web?
• Looking at all the top 5,000sites, we plotted trend lines and found that resizing and reformatting images for desktops reduced the image payload to.72 of the original size – or a 28% savings.
Payload Savings From Image Resizing, Optimization –Top 5,000 Sites
• Furthermore, when resizing for mobile smartphones, we achieved an image payload that was .65 of the original, or a 35% savings.

MOVR11
How Many Viewport Dimensions Are There?
32
14
34 4
32
1413
2224
320 360 375 412 414 600 601 768 1024 1280
Co
un
t o
f D
isti
nct
Inn
er
He
igh
ts o
f Vie
wp
ort
Inner Width of Viewport
Variation in Inner Height of Viewport by Inner WidthThese 162 width x height combinations cover of 90% mobile device traffic
• Thousands of combinations of viewport dimensions can complicate determining breakpoints for developers.
• Several widths are common, but they have many heights associated with them.
• The top 10 widths have 162 heights associated with them. • These 162 dimension combinations over 90% of mobile
device traffic.

MOVR12
Mobilegeddon Revisited – Mobile-Friendly Approaches
Combinations of Approaches For Mobile-FriendlinessMobile-Friendliness of Top 10,000 Sites
• In early 2015, Google changed their algorithms reflect the mobile friendliness of a website. The press dubbed this event “Mobilegeddon.” Now, a year later, we reran our survey of the top 10,000 websites.
• In 2016 Q1, 79% of sites are “mobile friendly”. This is a 7% increase over the last year.
• People think Responsive Web Design (RWD) is synonymous with “mobile friendly.” However, less than 20% of mobile-friendly sites are using just RWD without javascript.
• The web-performance movement (#webperf) is recognizing how RWD code can unnecessarily slow site performance.
• To solve this, many sites combine server-side Device Detection – found in Adaptive and mDot – with RWD to reduce front-end payload, reduce JavaScript code, and improve speed.
Source: ScientiaMobile research of top 10,000 web sites
72%
79%
2015 Q1 2016 Q1
Now 79% of Top 10,000 Sites are Ready for
Mobile Friendly SEO Algorithms
Of These Mobile-Friendly Sites, 54%
Use Server-Side Detection in Adaptive or mDot Approaches
RWD – No JavaScript
RWD –With
JavaScript
Adaptive mDot

MOVR13
Stock Browsers, 3rd Party Browsers, and App Webviews
• Looking at browsers on Android 5+, 65% of hits come from the stock browsers on the phone.
• Non-stock browsers make up 1% of traffic.• App Webviews (browser sessions from browsers
embedded in the App) make up an increasing proportion of traffic.
• However, almost all these App Webviews are generated by Facebook. On its own, Facebook generates 32% of traffic on Android and 33% on iOS devices.
65%
32%
Android 5+ Stock, Non-Stock, and AppWebview Browsers
StockBrowsers
Non-StockBrowsers
FacebookAppWebview
Other AppWebviews
62%
33%
5%
iOS Stock Browsers and App Webviews
Mobile Safari
Other AppWebviews

MOVR14
Age of iPhones and iPads and Their Chips
• The purchase cycle for iPhones is considerably faster than iPads. iPhones are 1.9 years old, compared to iPads at over 3 years.
• For developers, they need to keep this in mind as it relates to the speed of chips.
• Only 18% of iPhones are operating on the older A5 & A5X. • iPads have their largest group (32%) using the older A5 &
A5X chips.
1.93
3.14
iPhone iPad
Apple Device Age (Years)
1%
18%
62%
18%
0%
0%
A4
A5 &A5X
A6 &A6X
A7
A8 &A8X
A9 &A9X
% of iPhones Used
iPhone Chips
0%
32%
30%
0%
22%
16%
A4
A5 &A5X
A6 &A6X
A7
A8 &A8X
A9 &A9X
% of iPhones Used
iPad Chips

MOVR15
Smartphone Physical Screen Size Trend
• Screen sizes of smartphones have increased dramatically in the last year, particularly in the 4.5-5 and 5-5.5 inch ranges.
• The largest change was in the 5.5-5 inch range, growing by 13 percentage points.
• Conversely, the 4-4.5 inch size has decreased by 14% points.
• Tablet sizes have stayed relatively constant.
12% 5%
33%
19%
25%
31%
23%
36%
6% 8%
1% 1%
2015Q1 2016Q1
% o
f S
ma
rtp
ho
ne
Tra
ffic
Smartphone Diagonal Screen Size Trend - Global
6~6.5" inch5.5~6" inch
5~5.5" inch
4.5~5" inch
4~4.5" inch
3~4" inch
MOVR
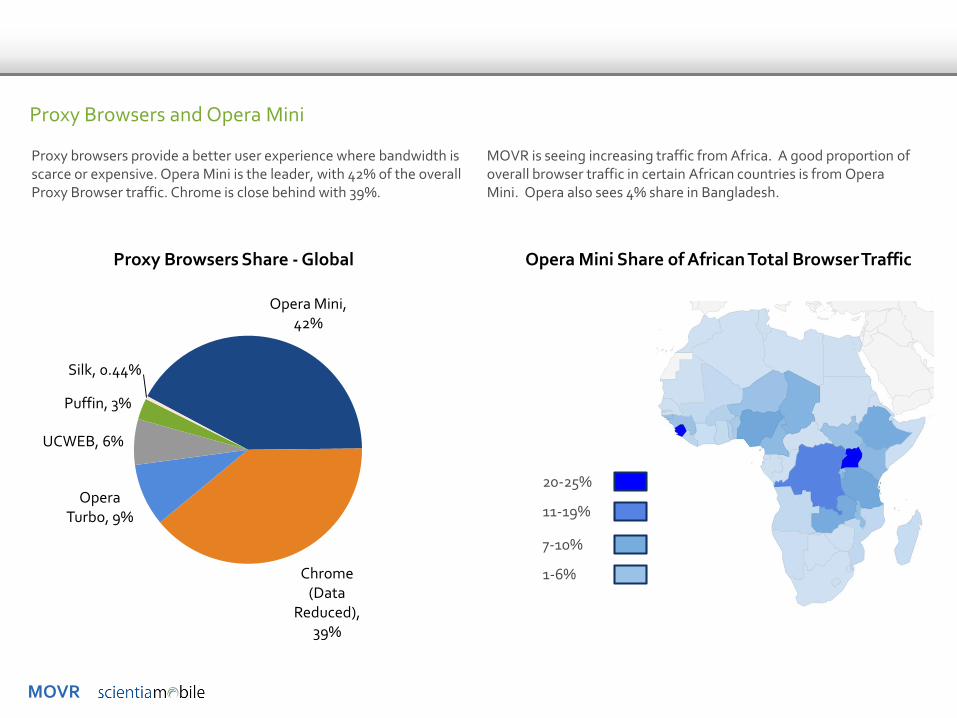
Proxy Browsers and Opera Mini
Opera Mini, 42%
Chrome (Data
Reduced), 39%
Opera Turbo, 9%
UCWEB, 6%
Puffin, 3%
Silk, 0.44%
Opera Mini Share of African Total Browser TrafficProxy Browsers Share - Global
Proxy browsers provide a better user experience where bandwidth is scarce or expensive. Opera Mini is the leader, with 42% of the overall Proxy Browser traffic. Chrome is close behind with 39%.
MOVR is seeing increasing traffic from Africa. A good proportion of overall browser traffic in certain African countries is from Opera Mini. Opera also sees 4% share in Bangladesh.
20-25%
11-19%
7-10%
1-6%

Continent Comparisons
We have significantly reduced the content in this section because you can now access real-time reports via MOVR Visualization

MOVR
Top Smartphones Africa Asia Europe North America Oceania South America
Apple iPhone 5 1.1% 3% 2% 3% 5% 2%
Apple iPhone 5C 0.2% 0.5% 3% 4% 3% 2%
Apple iPhone 5S 2% 5% 6% 8% 8% 4%
Apple iPhone 6 3% 8% 9% 16% 20% 5%
Apple iPhone 6 Plus 0.9% 4% 1.4% 7% 6% 1.1%
Apple iPhone 6S 0.9% 3% 4% 6% 9% 1.2%
Apple iPhone 6S Plus 0.3% 2% 0.6% 3% 3% 0.3%
BlackBerry Z10 2% 0.1% 0.1% 0.1% 0.1% 0.1%
LG G3 0.3% 1.9% 0.8% 1.2% 0.3% 0.8%
Motorola Moto G 0.1% 0.1% 0.2% 0.5% 0.1% 5%
Motorola Moto G (2nd Gen) 0.0% 0.1% 0.1% 0.2% 0.2% 4%
Motorola MotoG3 0.0% 0.1% 0.1% 0.2% 0.0% 2%
Samsung Galaxy Grand Neo 3% 0.8% 0.9% 0.1% 0.0% 1.0%
Samsung Galaxy Grand Prime 1% 1.2% 1.3% 1.3% 0.1% 5%
Samsung Galaxy J1 2% 0.6% 0.4% 0.1% 0.6% 1.0%
Samsung Galaxy J5 1% 0.9% 0.9% 0.1% 0.3% 2%
Samsung Galaxy Note 3 2% 3% 0.8% 1.0% 1.2% 0.4%
Samsung Galaxy Note 4 2% 2% 0.9% 2% 2% 0.4%
Samsung Galaxy S4 3% 3% 3% 3% 3% 2%
Samsung Galaxy S4 Mini 2% 1.2% 2% 0.3% 0.5% 2%
Samsung Galaxy S5 4% 2% 5% 6% 9% 2%
Samsung Galaxy S6 2% 1.2% 3% 3% 4% 1%
Samsung Galaxy S6 Edge 1% 0.8% 2% 1.2% 2% 1%
Vodafone Smart Kicka 2% 0.0% 0.0% 0.0% 0.1% 0.0%
Others 66% 55% 52% 32% 23% 54%
18
Top Smartphones
• New to the list this quarter are: Apple iPhone 6S Plus and the Vodafone Smart Kicka.
• Dropping off the list are the iPhone 4s, the Moto E, Samsung Galaxy Grand Quattro, Samsung Note II, and Samsung Galaxy S III.
• The Blackberry Z10 is the only non- iOS or Android phone left on this list.
MOVR
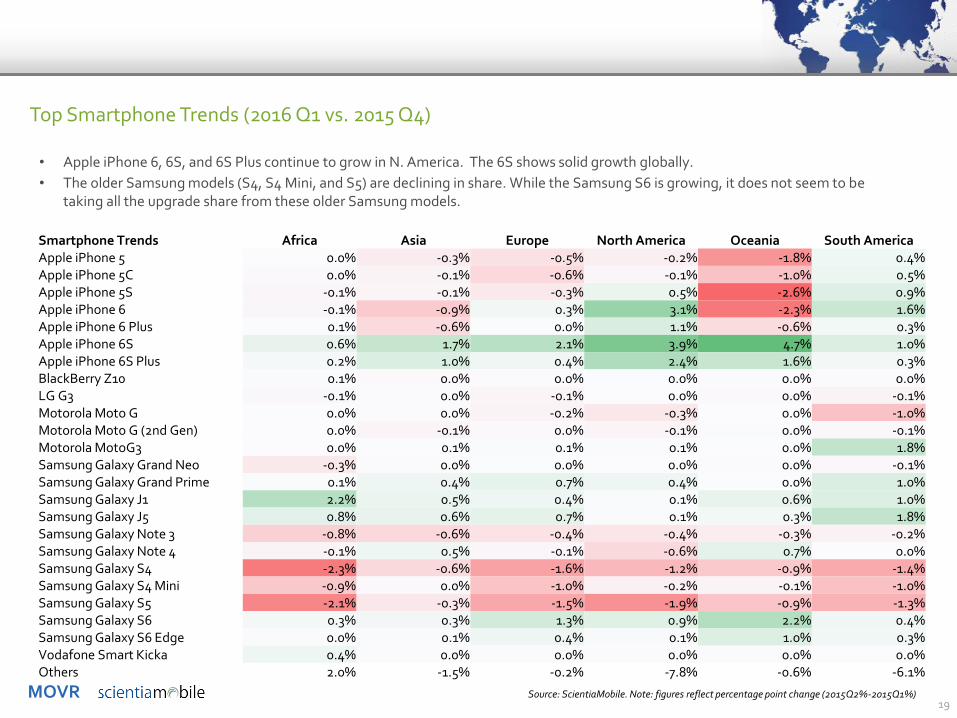
Smartphone Trends Africa Asia Europe North America Oceania South AmericaApple iPhone 5 0.0% -0.3% -0.5% -0.2% -1.8% 0.4%Apple iPhone 5C 0.0% -0.1% -0.6% -0.1% -1.0% 0.5%Apple iPhone 5S -0.1% -0.1% -0.3% 0.5% -2.6% 0.9%Apple iPhone 6 -0.1% -0.9% 0.3% 3.1% -2.3% 1.6%Apple iPhone 6 Plus 0.1% -0.6% 0.0% 1.1% -0.6% 0.3%Apple iPhone 6S 0.6% 1.7% 2.1% 3.9% 4.7% 1.0%Apple iPhone 6S Plus 0.2% 1.0% 0.4% 2.4% 1.6% 0.3%BlackBerry Z10 0.1% 0.0% 0.0% 0.0% 0.0% 0.0%LG G3 -0.1% 0.0% -0.1% 0.0% 0.0% -0.1%Motorola Moto G 0.0% 0.0% -0.2% -0.3% 0.0% -1.0%Motorola Moto G (2nd Gen) 0.0% -0.1% 0.0% -0.1% 0.0% -0.1%Motorola MotoG3 0.0% 0.1% 0.1% 0.1% 0.0% 1.8%Samsung Galaxy Grand Neo -0.3% 0.0% 0.0% 0.0% 0.0% -0.1%Samsung Galaxy Grand Prime 0.1% 0.4% 0.7% 0.4% 0.0% 1.0%Samsung Galaxy J1 2.2% 0.5% 0.4% 0.1% 0.6% 1.0%Samsung Galaxy J5 0.8% 0.6% 0.7% 0.1% 0.3% 1.8%Samsung Galaxy Note 3 -0.8% -0.6% -0.4% -0.4% -0.3% -0.2%Samsung Galaxy Note 4 -0.1% 0.5% -0.1% -0.6% 0.7% 0.0%Samsung Galaxy S4 -2.3% -0.6% -1.6% -1.2% -0.9% -1.4%Samsung Galaxy S4 Mini -0.9% 0.0% -1.0% -0.2% -0.1% -1.0%Samsung Galaxy S5 -2.1% -0.3% -1.5% -1.9% -0.9% -1.3%Samsung Galaxy S6 0.3% 0.3% 1.3% 0.9% 2.2% 0.4%Samsung Galaxy S6 Edge 0.0% 0.1% 0.4% 0.1% 1.0% 0.3%Vodafone Smart Kicka 0.4% 0.0% 0.0% 0.0% 0.0% 0.0%Others 2.0% -1.5% -0.2% -7.8% -0.6% -6.1%
19
Top Smartphone Trends (2016 Q1 vs. 2015 Q4)
Source: ScientiaMobile. Note: figures reflect percentage point change (2015Q2%-2015Q1%)
• Apple iPhone 6, 6S, and 6S Plus continue to grow in N. America. The 6S shows solid growth globally.
• The older Samsung models (S4, S4 Mini, and S5) are declining in share. While the Samsung S6 is growing, it does not seem to be taking all the upgrade share from these older Samsung models.

MOVR
Top Tablets Africa Asia Europe North America Oceania South America
Apple iPad 2 6% 7% 9% 14% 14% 8%
Apple iPad 3 5% 6% 5% 6% 8% 5%
Apple iPad 4 6% 7% 9% 11% 15% 7%
Apple iPad Air 6% 9% 13% 15% 16% 8%
Apple iPad Air 2 3% 7% 7% 10% 10% 4%
Apple iPad Mini 5% 12% 8% 10% 11% 9%
Apple iPad Mini 3 1% 2% 1% 1% 1% 1%
Apple iPad Mini Retina 2% 7% 5% 6% 6% 4%
Samsung Galaxy Tab 2 10.1 1.6% 1.7% 1.8% 0.5% 0.8% 1.6%
Samsung Galaxy Tab 3 10.1 3G 3% 0.5% 1.9% 0.5% 0.9% 0.6%
Samsung Galaxy Tab 3 7.0 0.6% 1.2% 1.0% 0.9% 0.2% 3.2%
Samsung Galaxy Tab 3 Lite 1.0% 1.4% 1.1% 0.4% 0.3% 6%
Samsung Galaxy Tab 3V 3G 2% 2% 0.1% 0.0% 0.0% 1.5%
Samsung Galaxy Tab 4 10.1 5% 2% 3% 1% 2% 2%
Samsung Galaxy Tab 4 7.0 5% 3% 0.9% 1.2% 0.1% 3%
Samsung Galaxy Tab A 0.0% 0.8% 0.0% 0.6% 1.5% 0.3%
Vodafone Smart Tab 3G 12% 0.0% 0.0% 0.0% 0.0% 0.0%
Others 37% 32% 33% 23% 14% 34%
20
Top Tablets
• The iPad 4 , Air and Mini hold strong positions in Asia, Europe, and N. America. They are starting to overtake the older iPad 2 share in many markets.
• Several older Samsung tablets (Note 8.0, Tab, Tab 2 7.0) have dropped off this list. Remaining Samsung models have less than 3%in most markets.

MOVR
Tablet Trends Africa Asia Europe North America Oceania South America
Apple iPad 2 0.1% -2.0% -1.2% -1.7% -2.9% -1.6%
Apple iPad 3 0.4% -0.7% 0.0% 0.0% -0.7% -0.8%
Apple iPad 4 0.7% -0.4% 0.3% 0.7% -0.8% -0.5%
Apple iPad Air 1.0% -0.2% 1.7% 2.4% 0.7% 0.2%
Apple iPad Air 2 1.0% 1.2% 2.1% 3.4% 2.3% 0.1%
Apple iPad Mini -0.1% -2.1% -0.5% -0.5% -1.6% 0.7%
Apple iPad Mini 3 0.1% 0.0% 0.1% 0.2% 0.0% 0.1%
Apple iPad Mini Retina 0.4% 0.3% 1.0% 1.7% 0.7% 0.2%
Samsung Galaxy Tab 2 10.1 -0.3% 0.9% -0.7% -0.4% -0.2% -1.0%
Samsung Galaxy Tab 3 10.1 3G -0.8% -0.2% -1.3% -0.3% -0.1% -0.1%
Samsung Galaxy Tab 3 7.0 -1.3% -0.3% -0.2% -0.7% 0.0% 0.4%
Samsung Galaxy Tab 3 Lite -1.9% -0.3% -0.1% -0.1% -0.1% 0.2%
Samsung Galaxy Tab 3V 3G -1.3% 1.0% 0.0% 0.0% 0.0% 0.9%
Samsung Galaxy Tab 4 10.1 -1.3% 0.8% -1.3% -0.9% -0.3% 0.1%
Samsung Galaxy Tab 4 7.0 2.2% 1.1% 0.1% -0.4% 0.0% -0.1%
Samsung Galaxy Tab A 0.0% 0.4% 0.0% 0.4% 1.1% 0.3%
Vodafone Smart Tab 3G 1.7% 0.0% 0.0% 0.0% 0.0% 0.0%
Others -0.6% 0.4% -0.2% -3.8% 1.9% 0.9%
21
Top Tablet Trends (2016 Q1 vs. 2015 Q4)
Source: ScientiaMobile. Note: figures reflect percentage point change (2015Q2%-2015Q1%)
• The iPad2, the most popular tablet in the world, is starting to drop significant share (-2% for two quarters in a row). However most of this loss is being recovered by the newer iPad Air 2.
• Samsung’s newer models (Tab 4 10.1 and 7.0) are gaining relatively modest share of ~1% in Asia and negative in Europe and N. America.

MOVR
Global Smartphone OS Release
• Among Android, release 4.4 was the most popular version with 16% averaging across all of 2016 Q1, but this is dropping. By May of 2016, release 5.1 has become the most popular (see trend research on following pages).
• Apple is the second largest OS with 37%. iOS 9.2 is the most popular version, with 25% during Q1, but was quickly eclipsed by 9.3 at the end of the quarter.
22
65%60%
2%3%
32%37%
0%
10%
20%
30%
40%
50%
60%
70%
80%
90%
100%
2015Q4 2016Q1
Smartphone OS Family Trend -Global
iOS
Windows
Android
Smartphone OS Share –Global 2016 Q1
Android 4.1, 2.8%
Android 4.2, 4.1%
Android 4.3, 2.3%
Android 4.4, 16.8%
Android 5.0, 14.9%
Android 5.1, 15.5%
Android 6.0, 2.0%Android legacy,
1.5%
Windows Phone OS, 2.8%
iOS 7.1, 1.7%
iOS 8.0, 0.3%
iOS 8.1, 1.1%iOS 8.2, 0.3%
iOS 8.3, 1.1%
iOS 8.4, 1.7%
iOS 9.0, 0.7%
iOS 9.1, 2.2%
iOS 9.2, 25.2%
iOS 9.3, 1.7%
iOS legacy, 0.7%
others, 0.4%

MOVR23
Android Smartphone Operating System Trends
0%
10%
20%
30%
40%
50%
60%
70%
80%
90%
100%
1/1/2016 2/1/2016 3/1/2016 4/1/2016 5/1/2016
6
5.1
5
4.4
4.3
4.2
4.1
4
legacy
• Android 6 has picked up significant share over the month of May, ending at 14%.
• Android 5.1 finished May as the most popular version at 26%. However, version 5.1 had dropped slightly (-2%) over the quarter as Android 6 gained share.
• Android 4.4 was the second most popular release, dropping 3% over the quarter.
• Release 5.0 was the third most popular – at ending at 22%. It dropped 5% over the quarter.
% o
f An
dro
id S
mar
tph
on
e Tr
affi
c
14%
26%
22%
24%
3%
5%
3%
1%
1%

MOVR24
iOS Smartphone Operating System Trends
0%
10%
20%
30%
40%
50%
60%
70%
80%
90%
100%
1/1/2016 2/1/2016 3/1/2016 4/1/2016 5/1/2016
9.3
9.2
9.1
9
8.4
8.3
8.2
8.1
8
legacy
• iOS 9.3 quickly became the most popular release, ending May at 65%.
• Most of release 9.3 share came from the preceding 9.2 that ended at 14%.
• All of the Legacy and 8.x versions totaled 16% by the end of May.
% o
f iO
S S
mar
tph
on
e Tr
affi
c
65%
14%
3%
2%
3%
3%
1%
2%
1%
6%

Spotlight: United States
25
MOVR26
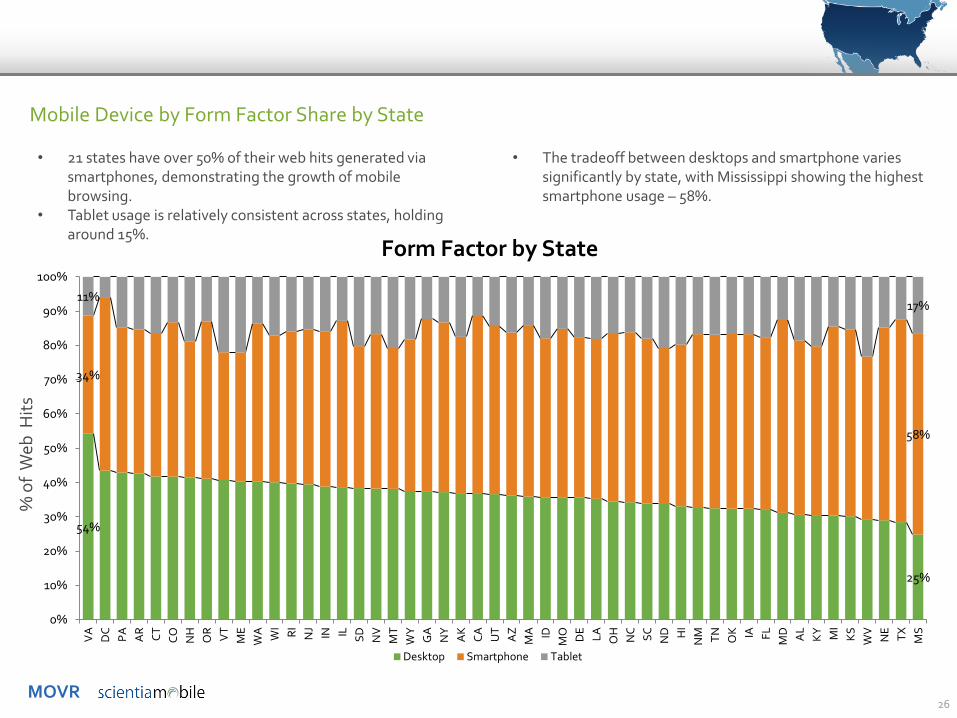
Mobile Device by Form Factor Share by State
54%
25%
34%
58%
11%17%
0%
10%
20%
30%
40%
50%
60%
70%
80%
90%
100%
VA
DC
PA
AR
CT
CO
NH
OR
VT
ME
WA WI
RI
NJ
IN IL SD
NV
MT
WY
GA
NY
AK
CA
UT
AZ
MA ID
MO DE
LA
OH
NC
SC
ND H
I
NM TN
OK IA FL
MD AL
KY MI
KS
WV
NE
TX
MS
Form Factor by State
Desktop Smartphone Tablet
• 21 states have over 50% of their web hits generated via smartphones, demonstrating the growth of mobile browsing.
• Tablet usage is relatively consistent across states, holding around 15%.
% o
f W
eb H
its
• The tradeoff between desktops and smartphone varies significantly by state, with Mississippi showing the highest smartphone usage – 58%.

MOVR27
Smartphone Manufacturer by State
• Samsung is the second most popular manufacturer, peaking at 34%.
• The remaining manufacturers have a combined share of approximately 15% in most states.
70%
49%
21%
34%
0%
10%
20%
30%
40%
50%
60%
70%
80%
90%
100%
AK
CT HI
NJ
MS
VT
LA
NY
MA
VA
DE
NH
NV
CA
KY
DC
AR FL
ND
WV
MD
ME
OR
OK RI
SC
UT
AL
PA
AZ IN SD
NC
CO
TN TX
GA
MO
OH
MT IL KS
WI
NE
WA
WY
NM ID M
I
IA
Smartphone Manufacturer by State
Others
Motorola
LG
HTC
Samsung
Apple
% o
f Sm
artp
ho
ne
Traf
fic
• Apple has over 50% of traffic in 49 out of 50 states.
• Alaska is the state most likely to use Apple iPhones (70% of share), whereas Iowa is the least likely (49%).

MOVR28
Smartphone Age Relative to Income
• Income impacts that replacement cycle of smartphones. • Lower income states have smartphones that are older,
close to 2 years old.
• Conversely, residents of higher income states replace their smartphones around 1.8 years (21 months).

MOVR
• ScientiaMobile provides the industry’s most accurate and flexible device detection solution, helping customers deliver great web experiences and manage the increasingly fragmented mobile device ecosystem. ScientiaMobile sells WURFL, a constantly-updated repository that catalogues thousands of devices and their capabilities and provides access to them via range of API languages. The WURFL framework enables many organizations, including Fortune 500 companies, to effectively design and analyze web experiences for an ever-growing range of smartphones, tablets, smart TVs and game consoles.
• For more information about ScientiaMobile and its commercial products, please visit us at: www.scientiamobile.com
• WURFL.io offers a number of free tools for device detection and image tailoring.
• To subscribe to MOVR, please visit us at www.scientiamobile.com/page/movr-mobile-overview-report
• To speak to us about our products and licenses, please complete this form at www.scientiamobile.com/license
• MOVR is the Copyright of ScientiaMobile, Inc and is made available under the terms of the Creative Commons Attribution-NonCommercial-NoDerivatives 4.0 International License.
29
About ScientiaMobile
Disclaimer
• While ScientiaMobile, Inc. has used reasonable efforts accurately to prepare this report and the other data and information here (together the "Report") from data it and its affiliates have collected, this Report is made available to the public on an "AS IS" basis without warranty of any kind. SCIENTIAMOBILE, INC. AND ITS AFFILIATES MAKE NO REPRESENTATION AND DISCLAIM ALL EXPRESS, IMPLIED AND STATUTORY WARRANTIES OF ANY KIND TO ANY RECIPIENT OF THIS REPORT OR ANY OTHER THIRD PARTY, INCLUDING ANY WARRANTIES OF ACCURACY, TIMELINESS, COMPLETENESS, MERCHANTABILITY AND FITNESS FOR A PARTICULAR PURPOSE. The Report is limited to data collected from certain services offered by ScientiaMobile, Inc. and its affiliates -- a self-selected sample pool that may not reflect the greater internet user community – and consequently no conclusion should be drawn from this Report regarding the internet user base as a whole. The entire risk as to the quality (or lack thereof), completeness and your use of this Report is with you, the user of the Report. In no event will ScientiaMobile, Inc. or its affiliates be liable for any direct, indirect, incidental, special, consequential, or other damages, including loss of profit, arising out of the use of this Report, even if advised of the possibility of such damages.
• Any excerpts to, or use of this Report to reach new conclusions and/or analysis, should indicate ScientiaMobile, Inc. as its source, but derived conclusions and analyses generated from these Reports should be clearly attributed solely to their author.