moving to the final chapter of the aids epidemic
TRANSCRIPT

Moving to the final chapter of the AIDS epidemic

The agreed target are about to expire…
2003 2004 2005 2006 2007 2008 2009 2010 2011 2012 2013 2014 20150
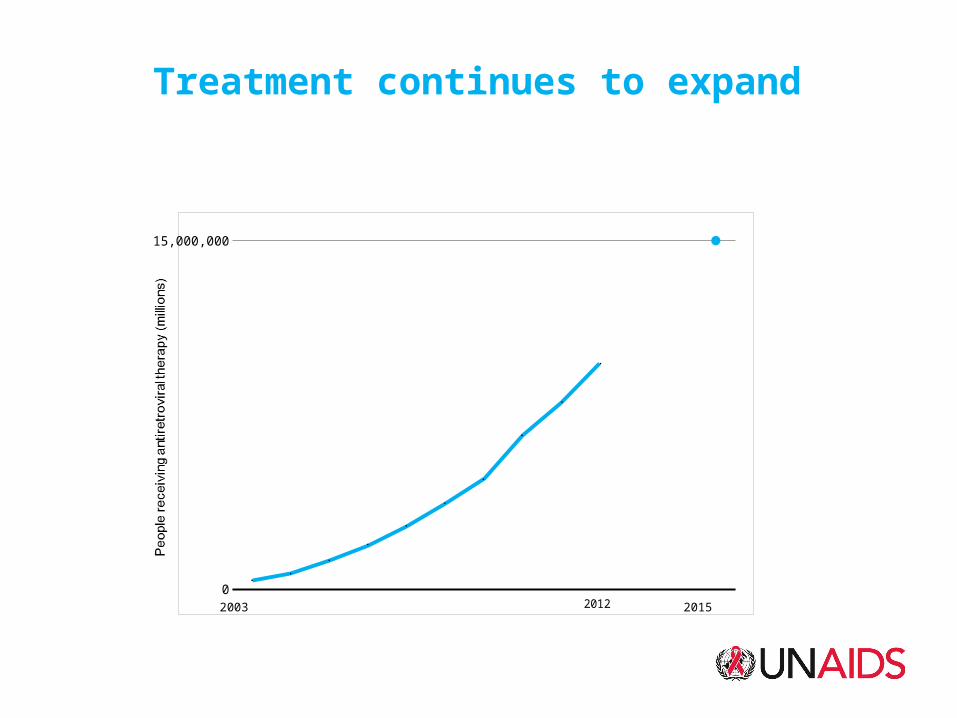
15,000,000
2012 20152003
Treatment continues to expand

2003 2004 2005 2006 2007 2008 2009 2010 2011 2012 2013 2014 20150
15,000,000
2012 20152003
Treatment continues to expand

UNAIDS PCB calls for new targets
• Targets drive progress• New scientific evidence• Post 2015• Accountability• A winnable challenge

The choices
Status quo
Continue the current pace
WHO 2013 guidelines
Rapid scale-up to universal access

The treatment target

The new treatment paradigm
Single target → Cascade targetDeath → Death and transmission
Number → EquityIncremental funding→ Frontload Investments
90% 81%73%

90% of HIV+
people tested is possible

Source: Demographic and Health Surveys
Burkina Faso 2010
Burundi 2010
Cameroon 2011
Zimbabwe 2010-11
Ethiopia 2011
Uganda 2011
Malawi 2010
Rwanda 2010
0
10
20
30
40
50
60
70
80
90
100
Men
Women
HIV+ population tested at least once

Access To Virologic HIV Testing(Early Infant Diagnosis) 2012
Sout
h Af
rica
Swaz
iland
Nam
ibia
Leso
tho
Zam
bia
Keny
a
Bots
wan
a
Moz
ambi
que
Cam
eroo
n
Zim
babw
e
Tanz
ania
Cote
d'Iv
oire
Ethi
opia
Gha
na
Uga
nda
Buru
ndi
Ango
la
DRC
Mal
awi
Nig
eria
Chad
0
10
20
30
40
50
60
70
80
9085
81
7469
61
39 38 37 35 34
28 27
19 18 17
117 6 4 4 4
*Lesotho data represents 2011 coverage dataSource: UNAIDS, UNICEF and WHO, 2013 Global AIDS Response Progress Reporting, and UNAIDS modeling2012 HIV and AIDS estimates.

90% of eligible people
on treatmentis possible

high coverage in several countries
72%Brazil
Brazil UNGASS Country Progress Report (2012)
71%Botswana
UNAIDS Situation Room

90% virally suppressed
is possible

Proportion (95% CI) of patients with undetectable VL in a nationally representative sample of HIV-infected adults on ART in Rwanda
Source: Basinga P et al. (2013) PLoS
Site
S
Site
T
Tota
l
100.00%
80.00%
60.00%
40.00%
20.00%
Site
A
Site
B
Site
C
Site
D
Site
E
Site
F
Site
G
Site
H
Site
I
Site
J
Site
K
Site
L
Site
M
Site
N
Site
O
Site
P
Site
Q
Site
R
83%

Preparedness is key

Challenges ahead: 1- Societal
• Lack of knowledge of HIV status• Punitive policies and laws• Stigma and discrimination

Challenges ahead: 2- delivery systems
Source: Location, Location: Connecting people faster to HIV services, UNAIDS; Geneva, 2013
Relative likelihood of HIV-positive adults (15-49 years) accessing antiretroviral therapy due to the distance from their nearest primary healthcare facility.

Uptake of pediatric HIV services after introduction of family-based approach
Luyirika et al. PLoS ONE, 2013

Challenges ahead: 3- diverse facility level costs
*Republic of South Africa: costs include updated antiretroviral prices, which were renegotiated by the RSA government in early 2010 and are 53% lower than those observed during the costing period.
US
$
Average
Maximum
Minimum
US$136US$186
US$232US$278
US$682
Malawi Ethiopia Rwanda Zambia RSA$0
$100
$200
$300
$400
$500
$600
$700
$800
$900
South Africa*

Challenges ahead: 4- treatment cascade
Sources: 1. UNAIDS 2012 estimates; 2. Demographic and Health Surveys, 2007–2011(www.measuredhs.com); 3. Kranzer, K., van Schaik, N., et al. (2011), PLoS ONE;4. GARPR 2012; 5. Barth R E, van der Loeff MR, et al. (2010), Lancet Infect Disease.
Notes: No systematic data are available for the proportion of people living with HIV who are linked to care, although this is a vital step to ensuring viral suppression in the community .

Challenges ahead: 5- Financing
MalawiLesotho
ZimbabweMozambique
BurundiUganda
Central African Rep.Tanzania
ZambiaSwaziland
KenyaLiberia
TogoRwanda
Sierra LeoneCameroon
ChadGuinea-Bissau
Côte d’IvoireBotswana
HaitiGuinea
NamibiaDjiboutiNigeria
South AfricaBurkina Faso
NigerBenin
EritreaGhana
MaliCambodia
BelizeMyanmarSenegal
AR
T c
osts
as
a pe
rcen
tage
of
GD
P
0 1 2 3 4 5 6 7 8%
2% – 5%
5% – 8%
0.1% – 1%
1% – 2%
Source: Williams arXiv 2012: http://arxiv.org/abs/1206.6774