moving to accountable care through the aca & · pdf filemoving to accountable care through...
TRANSCRIPT

Moving to Accountable Care through the ACA & MACRA
Jim Whitfill, MDPresident Lumetis, LLC
Clinical Associate Professor, Departments of Internal Medicine and Biomedical Informatics University of Arizona College of Medicine-Phoenix

2
Introduction
• Macro trends have come together to drive legislation that incorporates cost and quality as variables in reimbursement from CMS
• MACRA legislation brings relief from the SGR fee schedule cuts but brings performance standards to fee for service Medicare payments
• Advanced payment models interact with MACRA and can offer an alternative for very specific groups of physicians

3
Macro Factors Influencing US Healthcare System

4
Federal Costs Rising

5
Employer and Employee Costs Rising
Source: Kaiser/HRET Survey of Employer-Sponsored Health Benefits

6
Healthcare Costs in the Elderly Drive US Costs
http://blogs-images.forbes.com/danmunro/files/2014/04/hccostsbyage.pngHagist; Kotlikoff. Working Paper 11833 National Bureau of Economic Research Dec 2005Fischbeck, Paul. "US-Europe Comparisons of Health Risk for Specific Gender-Age Groups.” Carnegie Mellon University: September 2009

7
Cms.gov 1/2015

8
CMS Pushing for Cost and Quality Transparency to Get More Care for Same or Fewer Dollars
Alternate Payment Methods (ACO/BPI)
Managed Medicare/MA
Fee for Service/MIPS
• Choice• Quality • Cost

9
Where Did MACRA Come From?
(US physicians missed this cut by hours)

10
Incremental Approach Towards Quality with Medicare in the 2000s
• Tax Relief and Health Care Act of 2006 began what is Physician Quality Reporting System (PQRS)
• Health Information Technology for Economic and Clinical Health Act (HITECH) of 2009 added Meaningful Use adoption of EHR technology
• Affordable Care Act (ACA) of 2010 created the Value Based Modifier to add differential payments to physicians based on cost and quality

11
2014: The Boiling Point
• Federal macro costs out of control
• Overlapping quality programs and threats of annual fee schedule cuts from SGR top target for AMA
• Strong desire at CMS to align cost and quality with payment
11

12
Medicare Access & CHIP Reauthorization Act of 2015 (passed April 2015)
• Repeals the SGR Formula
• Ties Part B Fee Schedule to cuts or increases based on cost & quality
• Combines three quality reporting systems into one (with 3 parts…)
• Incentivizes providers into Advanced Alternative Payment Models (AAPMs)

MIPS brings threats of fee schedule cuts and incentives based on MIPS scores
• All providers are required to participate in MIPS in 2017, proposed rule
• First reporting period 1/1/2017 to 12/31/2017
• Payments adjusted in 2019 based on performance in the 2017 period
• MIPS is budget neutral so any incentives are paid for via cuts to other providers
• However there is a budget exempt $500 million dollars for “exceptional” performance in the first 5 years
May 3, 2016
The Advisory Board Health Care Cheat Sheet SeriesMACRA: Educational Briefing for IR Professionals, April 2016

14
CMS Estimates of MACRA Impacts
• Solo Providers: 87% will suffer falling reimbursement rates
• 2-9 Providers: 70% will experience falling reimbursement rates
• 25-99 Providers: 55% will experience a rise in reimbursement
• >100 Providers: 81% projected to see a rise in reimbursement
https://www.federalregister.gov/articles/2016/05/09/2016-10032/medicare-program-merit-based-incentive-payment-system-mips-and-alternative-payment-model-apm

15
Proposed Timeline

16
MIPS Score: First Year
Quality Category50% of score in year 1; replaces the Physician Quality Reporting System
Advancing Care Information Category*25% of score in year 1; formerly Meaningful Use
Clinical Practice Improvement Activities Category15% of score in year 1
Cost Category*10% of score in year 1; replaces the Value Modifier Program, also known as Resource Use) *For clinicians who do not meet these
category requirements, CMS proposes reweighting the score to 0 and recalculating the other categories.
https://www.cms.gov/Medicare/Quality-Initiatives-Patient-Assessment-Instruments/Value-Based-Programs/MACRA-MIPS-and-APMs/MIPS-Scoring-Methodology-slide-deck.pdf

Quality Metric Consolidation: MIPS: Quality
MIPS Quality Score (80-90 points)• Clinicians choose either 6 measures to
report:– 1 must be a crosscutting measure;– 1 must be an outcome or other “high
quality” measure
• OR may choose to report a specialty measure set
• MIPS will also calculate either 2 or 3 populations measures based on claims data, no additional reporting is needed.
– For individuals & groups of 2-9, MIPS calculates 2 population measures.
– For groups of 10+, MIPS calculates 3 population measures.
PQRS
6-9 Measures out of 284
Claims, and registries used for submission
Value Based Modifier (3)
Hospital admissions for ACSC
30 day all cause readmissions

18
Advancing Care Information (ACI) (max 100 points)
BASE SCORE: 50 points, 6 measures
PERFORMANCE SCORE: up to 80 points
• Max combined score = 100• Clinicians must use certified
EHR technology• No longer all-or-nothing
reporting• If the measures are not
applicable for a clinician, CMS may reweight the whole category to zero and adjust the weighting of the remaining categories

19
Clinical Practice Improvement Activities
Max Total Points: 60There are 90+ activities in the following categories:• Weighted: some are 20
points, others are 10• “Clinicians who are not
patient-facing (for example, pathologists or radiologists) will only need to report on one activity.”
• Clinicians will receive credit toward scores for participating in APMs (50%) and Patient-Centered Medical Homes (100%)
20
Resource Use/Cost
• MIPS calculates cost category scores based on Medicare claims, no additional reporting is required
• Uses 40+ “episode-specific measures to account for differences among specialties”
• Must see a sufficient # of patients, generally a min 20-patient sample is required
• If the clinician does not have enough patient volume, CMS may reweight the whole category to zero and adjust the weighting of the remaining categories
• Excluded for APM participants
• Reported in 2017 but does not count towards MIPS in year 1

21
MIPS Participant Exemptions
Are newly enrolled in Medicare;
Have < $30,000 in Medicare charges AND have < 100 Medicare patients;
Are significantly participating in an AAPM.

22
Medicare Shared Savings Program
– Track 1-Upside Risk only (2012 -)
∙ Retrospective attribution
∙ Max sharing rate 50%
∙ Payment limit 10%
∙ MSR: 2-4%
– Track 2- Upside and Downside Risk (2012-)
∙ Retrospective attribution
∙ Max sharing rate 60%
∙ Payment limit 15%
∙ Lower MSR and now with choice in MSR/MLR levels
∙ Loss limit 5%|7.5%|10%
– Track 3 (2015- ) Upside and Downside Risk
∙ Prospective Attribution
∙ Max sharing rate 75%
∙ Payment limit 20%
∙ More waivers
∙ Loss limit 15%
Sharing Rate: % of total savings to the MSSPMSR: Minimum Savings Rate. Threshold to receive $$MLR: Maximum Loss Rate: Threshold to pay $$Payment Limit: Maximum limit on savings $$Loss Limit: Maximum limit of $$ paid for losses

ACO Start DateOwnership/Structure
Service AreaPCP's
Attributed members/
#Beneficiaries
Banner Health Network* 1/1/2012BH, BPHO, BMG, AIP
Maricopa and Pinal Counties200 63,000
Arizona Care Network 1/1/2012Dignity Abrazo
Arizona331 29,000
Yavapai Accountable Care 1/1/2012Independent Physicians
Yavapai and Coconino CountiesNR 5,000
Commonwealth PCACO 1/1/2012Independent PCP's
Arizona, New Mexico100 16,000
Arizona Connected Care 4/1/2012Community Providers, TMC
Southern Arizona195 5,600
JC Lincoln ACO 7/1/2012JC Lincoln Health
Phoenix Metro140 14,800
Premier 1/1/2014Independent Physicians
Lakewood CANR 5,000
Scottsdale Health Partners 1/1/2014SHC & SPO
Maricopa Counties100 18,000
ASPA-Connected Care 1/1/2015Independent Physicians
Arizona, New Mexico30 5887
North Central AZ
Accountable Care1/1/2015
YRMC, NAH, Affil iates
Yavapai & Coconino Counties 54 10,800
Abacus ACO 1/1/2016Independent Physicians Southern
ArizonaNR NR
Optum ACO** 1/1/2016Optum Medical Network
Maricopa County203 37,000
*Pioneer Model ** Next Generation Model All others MSSP Model
Arizona Medicare ACO’s

24
CMS “Fast Facts” About ACOs (Jan 2017)• PROGRAM SIZE
– 480 Shared Savings Program ACOs
– 9 million assigned beneficiaries in 50 states plus Washington, DC and Puerto Rico
• PAYMENT CHARACTERISTICS
– Track 1 (one-sided) 438 ACOs (91%)
– Track 2 (two-sided) 6 ACOs (1%)
– Track 3 (two-sided/prospective) 36 ACOs (8%)
– Advance Payment (CMMI Initiative) 45 ACOs ( 9%)
https://www.cms.gov/Medicare/Medicare-Fee-for-Service-Payment/sharedsavingsprogram/Downloads/All-Starts-MSSP-ACO.pdf

25
MSSP Results to Date
2012 2013 2014 2015
Earned Shared Savings 29 55 92 120
Achieved Savings below MSR 25 60 89 83
Increased Spending 60 88 223 230Increased Spending and Owed Money 0 1 0 0
Total # MSSP 114 204 404 433

26
New Payment Mechanism in Next Gen Model
• Goals of payment mechanisms:
– Offer ACOs the opportunity for stable and predictable cash flow
– Facilitate investment in infrastructure and care coordination.
• Alternative payment flows do not affect beneficiary out-of-pocket expenses or net CMS expenditures.

27
Interactions between MIPS and Track 1 MSSP
• No MSSP providers need to report additional quality measures outside MSSP reporting
• MSSP TINs will still need to report ACI measures
• MSSP providers will receive 100% credit in the CPIA category in 2017
• MSSP not scored on cost under MIPS

28
APM Scoring Standard

29
APM Scoring Standard

MACRA Timeline
2015& Earlier
2016 2017 2018 2019 2020 2021 2022 2023 2024 20252026
& Beyond
+0.5% +0.5% +0.5% +0.5%
0 0 0 0 0 0
PQRS
MU
Value Modifier(+/-)4%
(+/-)5%
(+/-)7%
(+/-)9%
(+/-)9%
(+/-)9%
(+/-)9%
+0.25%
+0.75%
Physician Payment Updates
MIPS Payment Adjustment
APM Bonus +5% annual bonus
TRA
CK
1TR
AC
K 2
Qualifying participants in an APM are exempt from MIPS

31
Qualifying Advanced APMs for 2017• Advanced Alternative Payment Models vs Alternative Payment
Models : only the former will count for incentives and MIPS exemption
• Comprehensive ESRD Care (CEC) - Two-Sided Risk• Comprehensive Primary Care Plus (CPC+)• Next Generation ACO Model• Shared Savings Program - Track 2• Shared Savings Program - Track 3• Oncology Care Model (OCM) - Two-Sided Risk• Comprehensive Care for Joint Replacement (CJR) Payment
Model (Track 1- CEHRT)• Vermont Medicare ACO Initiative (as part of the Vermont All-
Payer ACO Model)

32
AAPM Incentive Payments

33
Advanced APM Requirements Can Be Financial or Patient Volume Based
• In 2019-2020: requirements are for Medicare payments and patients only.• In 2021: non-Medicare payers and patients may count towards
participation requirements

Qualifying APM
% of Claims Volume* Needed Through APM
0%
10%
20%
30%
40%
50%
60%
70%
80%
2019 2020 2021 2022 2023 2024+
Medicare Only Option
APM %
0%
10%
20%
30%
40%
50%
60%
70%
80%
2019 2020 2021 2022 2023 2024+
All-Payer Option
Medicare APM% Total APM%
* Alternatively, patient count thresholds would also be measured

35
CMS Expects Most Providers to Be Subject To MIPS


37
38
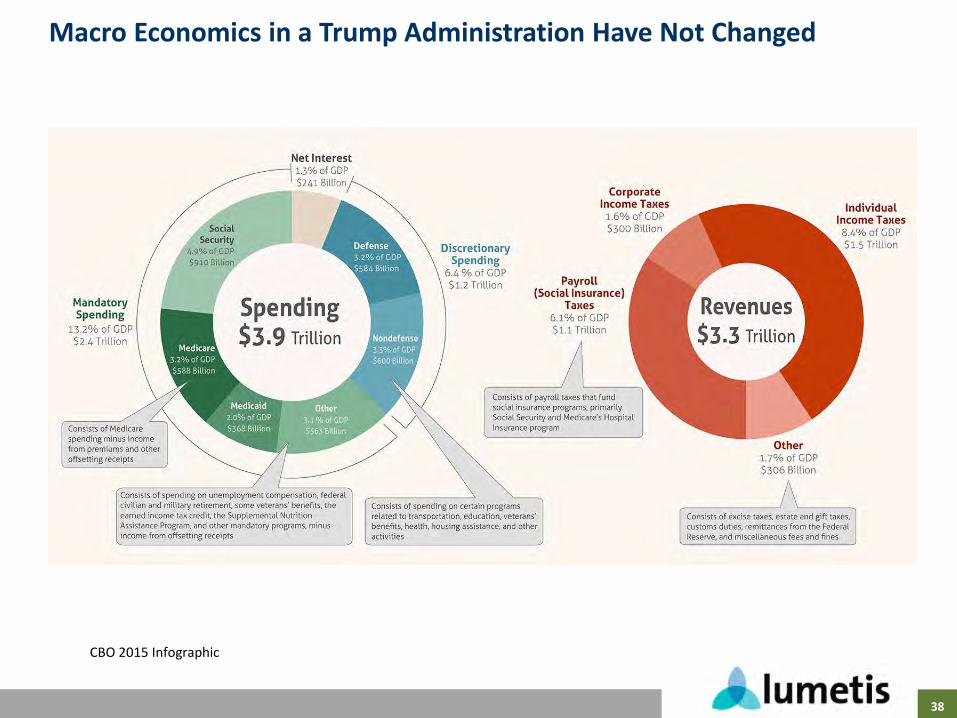
Macro Economics in a Trump Administration Have Not Changed
CBO 2015 Infographic

39
Unravelling the ACA: A Three Front War
• Executive Orders
- Broad guidance to reduce regulation and increase discretion to blunt effects from the ACA
- Could eliminate mandate (IRS already not flagging returns)
- Could expand Medicaid waivers
- Opens door for intrastate insurance markets
- Could undo some ACA taxes
• Reconciliation
- Simple majority in Senate
- Limited to spending and tax changes
- Taxes and subsidies could be repealed
- Byrd rule prevents use if no impact on budget
• New Legislation
- Need 60 votes in the Senate to proceed

Obamacare
• Penalties (tax) for not having insurance
• Subsidies to Insurers for premium and co-pay support
• Expand Medicaid with 90-100% Federal funding
• Mandatory coverage of many conditions
• No lifetime limits and no preexisting conditions
Trumpcare
• Premiums increase without continuous coverage
• HSAs and tax credits for individuals
• Reform Medicaid to be a defined contribution program
• Relax coverage requirements to allow more access *
• Use high risk pools to insure the most costly patients *
https://www.nytimes.com/2017/02/16/us/politics/affordable-care-act-congress.html?_r=0

41
Employer Provided Insurance, Medicare, & Medicaid Likely to Follow Patterns from Employer Provided Retirement Plans

42
High Risk Pools: State level 1976-2013
• Estimated need for HRP in 2011: 4 Million
• First pools offered by MN and CT in 1976
• 35 states had risk pools in 2012 pre ACA and covered 212,000 people
– Medically eligible
– HIPAA eligible (covers those who had but lost group benefits)
– HCTC eligible
– Medicare Eligible
• Pools vary but always have
– Elevated premiums at 150-200% of market
– Pre-exisiting condition exclusions for 6-12 months
– Lifetime limits of 1-2$ million (some as low as $3,000 per year)
– Deductibles generally $1000-$2500
• All pools lost money
– 2011 $1.2 Billion/$5500 per enrollee
– Paid by state via assessments on non-group private insurance and other state sources
J Gen Intern Med. 2011 Jan; 26(1): 91–94http://kff.org/health-reform/issue-brief/high-risk-pools-for-uninsurable-individuals/


44
Selling Health Insurance Across State Lines
• RI, WY, GA, KT, ME each have laws to allow selling insurance across state lines
– AZ legislature passed a bill in 2012 but it was vetoed
• No state has had success in attracting out of state insurers
– National bills have not been endorsed by insurance lobbying groups when entered in Congress
• Large employers already self insured and not subject to state regulation
• Barrier to entry: regulatory vs network development
http://www.rwjf.org/content/dam/farm/reports/issue_briefs/2012/rwjf401409

48