moving forward with complementary feeding: indicators...
TRANSCRIPT

FCND DP No. 146
FCND DISCUSSION PAPER NO. 146
Food Consumption and Nutrition Division
International Food Policy Research Institute 2033 K Street, N.W.
Washington, D.C. 20006 U.S.A. (202) 862�5600
Fax: (202) 467�4439
April 2003 FCND Discussion Papers contain preliminary material and research results, and are circulated prior to a full peer review in order to stimulate discussion and critical comment. It is expected that most Discussion Papers will eventually be published in some other form, and that their content may also be revised.
MOVING FORWARD WITH COMPLEMENTARY FEEDING:
INDICATORS AND RESEARCH PRIORITIES
Marie T. Ruel, Kenneth H. Brown, and Laura E. Caulfield
ii
Abstract
For a number of reasons, progress in improving child feeding practices in the
developing world has been remarkably slow. First, complementary feeding practices
encompass a number of interrelated behaviors that need to be addressed simultaneously.
Child feeding practices are also age-specific within narrow age ranges, which add to the
complexity of developing recommendations and measuring responses. Finally, the lack of
clear international recommendations for some aspects of complementary feeding has
prevented the development of universal indicators to define optimal feeding. Without
appropriate measurement tools, the design and evaluation of programs to improve
complementary feeding practices cannot move forward.
The present paper is the first systematic attempt at filling this gap. It puts forth a
framework for the development of indicators of complementary feeding practices and
proposes a series of possible indicators to measure some of the most critical aspects of
infant and young child feeding. The emphasis is on simple indicators for use in large
surveys or in program contexts.
Indicators for the following aspects of complementary feeding of 6-23-month-old
children are discussed: (1) breastfeeding; (2) energy from complementary foods;
(3) nutrient density of complementary foods; and (4) safe preparation and storage of
complementary foods. Finally, possible approaches to validate the proposed indicators
are discussed and research priorities are highlighted.

iii
Contents
Acknowledgments............................................................................................................... v 1. Introduction..................................................................................................................... 1
Definition and Importance of Complementary Feeding ................................................. 1 Need for Programs to Promote Improved CF Practices ................................................. 2 Need for Child Feeding Assessment Tools in Program Development
and Evaluation ........................................................................................................... 2 2. Objectives and Organization of the Report..................................................................... 3 3. Indicators: Characteristics and Performance Criteria ..................................................... 4
Definition of Indicators................................................................................................... 4 Purposes of Indicators of Complementary Feeding........................................................ 5 Performance Criteria of Indicators ................................................................................. 6 Application of Indicators .............................................................................................. 10 Measurement Approaches (Observation Versus Recall) .............................................. 14 Validation of Indicators ................................................................................................ 16
4. Review of Recommended Complementary Feeding Practices (Universal
Recommendations) ....................................................................................................... 17
Duration of Exclusive Breastfeeding and Continued Breastfeeding ............................ 17 Energy Required From Complementary Foods ............................................................ 18 Nutrient Density............................................................................................................ 19 Appropriate Consistency for Age (Special Foods Versus Family Foods).................... 20 Safe Preparation and Storage of Complementary Foods .............................................. 21 Care During Feeding..................................................................................................... 21
5. Possible Indicators of Adequacy of Recommended Practices...................................... 24
Breastfeeding ................................................................................................................ 32 Energy Intake, Energy Density, Frequency of Feeding, and Amount of Energy
Served/Consumed per Meal..................................................................................... 34 Nutrient Density�Dietary Quality............................................................................... 39 Appropriate Consistency of Main Complementary Foods for Age of the Child.......... 43 Safe Preparation and Storage of Complementary Foods .............................................. 43 Care During Feeding..................................................................................................... 45
iv
6. Research and Indicator Validation Priorities ................................................................ 49
Continued Breastfeeding............................................................................................... 49 Energy Intake From Complementary Foods................................................................. 50 Nutrient Density of Complementary Foods.................................................................. 52 Safe Preparation and Storage of Complementary Foods .............................................. 53 Care During Feeding (Feeding Behaviors and Psychosocial Care).............................. 54 Concluding Remarks..................................................................................................... 54
References......................................................................................................................... 56
Tables 1 Performance criteria for evaluation indicators...............................................................7
2 Recommended total daily nutrient intakes and nutrient densities (per 100 kcal) of complementary foods, by age group........................................................................20
3 Suggested indicators for measuring complementary feeding practices among children ages 6-24 months ...........................................................................................25
Boxes 1 Potential indicators to assess breastfeeding among children ages 6-23 months..........34
2 Potential indicators of group- or community-level energy density of main complementary foods.............................................................................................37
3 Potential indicators to assess frequency of feeding complementary foods among children ages 6-23 months .........................................................................39
4 Potential indicators to assess nutrient adequacy of complementary foods and supplements among children ages 6-23 months ....................................................42
5 Potential indicators to assess hygiene during preparation and storage of complementary foods.............................................................................................45
6 Potential indicators to assess feeding behaviors or style .............................................47
7 Potential indicators for psychosocial care during feeding ...........................................48

v
Acknowledgments
WHO�s Department of Child and Adolescent Health (CAH) commissioned the
development of this paper, as an initial step towards the identification of a global set of
indicators for assessing complementary feeding. Participants in the informal technical
meeting to review and develop indicators for complementary feeding, convened by WHO
on the premises of the Pan American Health Organization in Washington from 3 to 5
December 2002, provided valuable comments that have been incorporated in the current
version.
Marie T. Ruel International Food Policy Research Institute Kenneth H. Brown University of California-Davis Laura E. Caulfield Johns Hopkins University

1
1. Introduction
Childhood malnutrition remains a major health problem in resource-poor
communities, leading to excessive rates of morbidity and mortality, stunted growth, and
impaired neurobehavioral development. Approximately one-third of children less than
five years of age in developing countries have low height-for-age (<�2 SD with respect to
reference data) (ACC/SCN 2000), and even larger proportions are deficient in one or
more micronutrients. Causes of childhood malnutrition include intrauterine growth
retardation (caused in large part by maternal undernutrition before and during
pregnancy), poor child-feeding practices, and high rates of infections, all of which are
conditioned by underlying poverty. Thus, integrated interventions addressing these
multiple problems simultaneously are needed to reduce malnutrition and its associated
complications.
Development of successful interventions to improve child-feeding practices, in
particular, requires appropriate instruments to assess current feeding practices and
monitor the impact of programs designed to improve them. During the past decade,
simple, programmatically relevant indicators of breastfeeding practices have been
developed to guide the planning, implementation, and evaluation of programs aimed at
improving this component of child feeding. However, similar indicators to assess
complementary feeding practices are still lacking. In response to this need, this paper puts
forth a conceptual framework that could be applied to develop useful indicators for
assessing complementary feeding. It then presents a series of possible indicators in
relation to critical aspects of appropriate complementary feeding. Finally, it presents
possible approaches to validate these indicators.
Definition and Importance of Complementary Feeding
In 1998, the World Health Organization (WHO) and UNICEF jointly published a
document, Complementary Feeding of Young Children in Developing Countries: A
Review of Current Scientific Knowledge� (Brown et al. 1998). This publication was
2
followed by a recent document titled: �Guiding principles for complementary feeding of
the breastfed child� (PAHO/WHO 2003), which defines complementary feeding as �the
process starting when breast milk alone is no longer sufficient to meet the nutritional
requirements of infants, and therefore other foods and liquids are needed, along with
breast milk� (p. 2). Any non-breast milk foods or nutritive liquids that are given to young
children during this period are defined as complementary foods. These foods may be
prepared specifically for children, or they may consist of family foods that are served
both to children and to other household members.
Need for Programs to Promote Improved CF Practices
Limited data from many parts of the world indicate that complementary feeding
practices are suboptimal from several perspectives. For example, in some cases
complementary foods are introduced earlier than is desirable; in other cases their
introduction is inappropriately delayed. The frequency and amounts of these foods that
are offered may be less than required for normal growth, or their consistency or energy
density may by inappropriate in relation to the child�s needs. Information on the
prevalence of specific micronutrient deficiencies further suggests that either the nutrient
content of these foods is inadequate or nutrient absorption is impaired by other
components of these foods. Frequent microbial contamination of complementary foods
and the associated high rates of diarrheal disease also indicate a need for improved food
safety. Finally, responsive feeding, maternal encouragement to eat, and other
psychosocial aspects of care during feeding are likely to be important for ensuring
adequate food and nutrient intake of the child.
Need for Child Feeding Assessment Tools in Program Development and Evaluation
Efforts to measure and quantify feeding practices have been hampered by
methodological problems. Simple, valid, and reliable tools are lacking to measure child

3
feeding in the context of program development, for designing and targeting interventions,
and for monitoring and evaluating progress.
The problem of measurement arises primarily because child feeding practices
encompass a series of interrelated behaviors that are difficult to summarize into one or a
few variables. Unlike exclusive breastfeeding, which can be summarized into one
variable, measuring the quality of complementary feeding implies measurement of a
variety of practices simultaneously. Child feeding practices are also age-specific within
narrow ranges, which adds to the complexity of measurement. Finally, clear, international
recommendations on some aspects of complementary feeding do not exist, which
complicates the development of universal indicators and the selection of cutoff points to
define optimal feeding.
2. Objectives and Organization of the Report
The main objectives of this report are to
! review and discuss possible indicators of adequate/optimal complementary
feeding practices,
! describe steps in validating and assessing the utility of these potential indicators
for various purposes.
The focus is on complementary feeding practices as they relate to children ages 6
to 23 months. Indicators of breastfeeding practices during the first six months of life have
already been developed and are not reviewed here (WHO 1991).
The report is organized as follows. Section 3 presents a review of some general
aspects of indicators and defines a list of criteria commonly used to assess their
performance for different purposes. Section 4 briefly summarizes current complementary
feeding recommendations and Section 5 presents a list of potential indicators of
complementary feeding, emphasizing their strengths and limitations. Section 6 discusses

4
research needs and briefly describes potential approaches for validation of key indicators
of complementary feeding.
3. Indicators: Characteristics and Performance Criteria
This section reviews several conceptual issues related to the development and
selection of indicators for various purposes and describes criteria used to assess their
performance. The issues reviewed are not unique to the area of complementary feeding,
and the reader is referred to background materials for more information on these concepts
in other contexts (Habicht and Pelletier 1990;WHO 1995).
Definition of Indicators
Indicators are data collected through measurement, observation, or interview that
describe an underlying phenomenon. In many cases, the underlying phenomenon is
unobservable�because it is not open to direct estimation, or it is too complex to estimate
in a simple fashion. Such is the case with complementary feeding, which encompasses a
variety of practices that are not easy to summarize. In this case indicators are required to
characterize the usual dietary intake of the young child in order to evaluate its adequacy
for maintaining health and supporting optimal growth and development.
Although methods to quantify amounts and nutrient composition of
complementary foods exist, they are usually time- and resource-intensive, and they are
subject to a variety of errors due to recall (when measurements are based on interviews)
and to normal day-to-day variability in children�s intake. For these reasons, researchers
have focused on the development of indicators to capture behavioral practices that are
believed to support adequate feeding of the infant and young child. These indicators are
then used as �proxies� for adequate energy and nutrient content of the diet. This approach
is well-developed for assessing infant feeding during the first six months of life, where,
for example, a number of �proxy� practices are used to determine whether (a) the baby is
put to the breast within the first hour following birth, (b) the baby is exclusively breastfed

5
and not given water or other prelacteal feeds, (c) the baby is fed on demand day and
night, and (d) the baby is fed from both breasts.
This report reviews current knowledge and progress in developing similar types
of indicators to capture the quality of feeding for the older infant and young child, i.e., 6�
23 months of age, and proposes approaches to pursue the development of such indicators
and areas for research.
Purposes of Indicators of Complementary Feeding
Indicators of complementary feeding are needed for the following purposes:
! For assessment: to describe current practices, collect baseline information, and/or
make comparisons between programs, countries, regions, risk groups, etc.
! For screening and targeting: to identify vulnerable individuals, communities, or
regions; make decisions about resource allocation; and target interventions to at-
risk individuals and groups.
! For monitoring and evaluation: to monitor progress and demonstrate the impact
of interventions designed to improve child feeding practices.
Complementary feeding indicators may also be useful for communication and
advocacy purposes; for research to examine, for example, the associations between
practices and outcomes; or to understand the constraints against or factors that might
facilitate adoption of recommended practices.
For screening, targeting, or program monitoring and evaluation, indicators should
be predictive of an individual�s or a group�s risk of short- or long-term outcomes, and
should predict the likelihood that the individual or group will benefit from the
intervention designed to change the underlying phenomenon captured by the indicator. It
is thus important that indicators used for evaluation purposes be sensitive enough to
reflect changes in this underlying phenomenon.
6
Performance Criteria of Indicators
Validity, Reliability, Random Error, and Systematic Bias
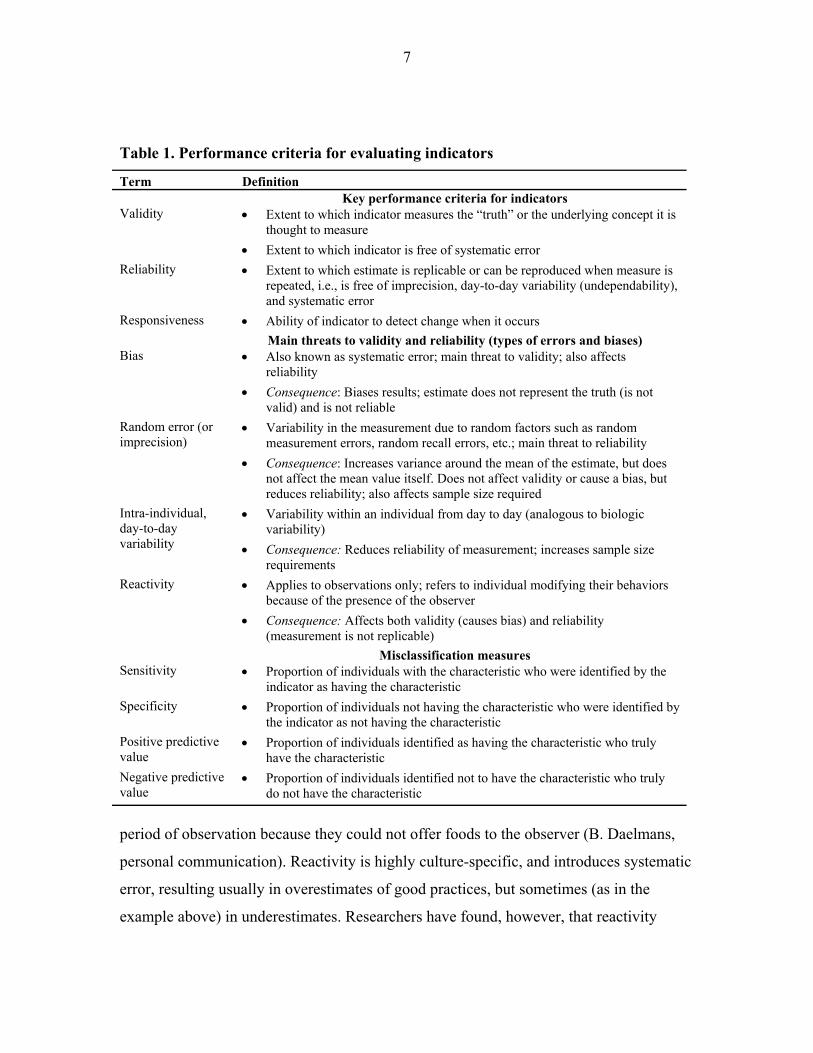
Indicators are usually evaluated with respect to two performance criteria: validity
and reliability (Windsor et al. 1994). Validity addresses whether an indicator is really
measuring what is intended, or whether it reflects the �truth� (or is accurate). Reliability
refers to whether the results are �replicable,� i.e., repeated measurements provide the
same results. Other synonyms for reliability include reproducibility and repeatability.
Table 1 lists key characteristics of indicators, common types of errors, and biases that
may affect the validity and reliability of indicators (Kleinbaum, Kupper, and Morgenstern
1982; Rothman 1986).
Bias or systematic error is the main threat to validity because it results in an
estimate that does not represent the truth. The most common type of bias occurs when
practices are measured through interview techniques; this recall bias can result from
systematic or voluntary misreporting of practices. Systematic falsification of responses
tends to occur when interviewees are aware of what the �right� (or expected) answer is.
This is a common problem in evaluations of education and behavior-change interventions
because study participants may feel pressured to over-report the practices they have been
taught during the intervention, even if they have not adopted them. Hygiene practices
have been shown to be particularly subject to this type of recall bias, because most
populations have at least a minimum knowledge and understanding of good hygiene, and
thus they tend to over-report better practices (Curtis et al. 1993; Stanton et al. 1987).
A similar problem, which occurs when practices are measured through
observation as opposed to recall methods, is reactivity. Reactivity refers to a situation
where the individuals being observed modify their practices because of the presence of
the observer. As described for recall methods, reactivity may result in an overestimate of
the prevalence of good practices if individuals make a conscious effort to improve their
practices in the presence of the observer. Reactivity may also lead to biases. For example,
in the case of a study in the Philippines, caregivers stopped feeding their child during the
7
Table 1. Performance criteria for evaluating indicators
Term Definition Key performance criteria for indicators Validity • Extent to which indicator measures the �truth� or the underlying concept it is
thought to measure • Extent to which indicator is free of systematic error
Reliability • Extent to which estimate is replicable or can be reproduced when measure is repeated, i.e., is free of imprecision, day-to-day variability (undependability), and systematic error
Responsiveness • Ability of indicator to detect change when it occurs Main threats to validity and reliability (types of errors and biases) Bias • Also known as systematic error; main threat to validity; also affects
reliability • Consequence: Biases results; estimate does not represent the truth (is not
valid) and is not reliable Random error (or imprecision)
• Variability in the measurement due to random factors such as random measurement errors, random recall errors, etc.; main threat to reliability
• Consequence: Increases variance around the mean of the estimate, but does not affect the mean value itself. Does not affect validity or cause a bias, but reduces reliability; also affects sample size required
Intra-individual, day-to-day variability
• Variability within an individual from day to day (analogous to biologic variability)
• Consequence: Reduces reliability of measurement; increases sample size requirements
Reactivity • Applies to observations only; refers to individual modifying their behaviors because of the presence of the observer
• Consequence: Affects both validity (causes bias) and reliability (measurement is not replicable)
Misclassification measures Sensitivity • Proportion of individuals with the characteristic who were identified by the
indicator as having the characteristic Specificity • Proportion of individuals not having the characteristic who were identified by
the indicator as not having the characteristic Positive predictive value
• Proportion of individuals identified as having the characteristic who truly have the characteristic
Negative predictive value
• Proportion of individuals identified not to have the characteristic who truly do not have the characteristic
period of observation because they could not offer foods to the observer (B. Daelmans,
personal communication). Reactivity is highly culture-specific, and introduces systematic
error, resulting usually in overestimates of good practices, but sometimes (as in the
example above) in underestimates. Researchers have found, however, that reactivity

8
decreases rapidly after the first day of observation, and recommendations have been
made to repeat the observations on one or more days and to discard the first day of
observation (Gittelsohn et al. 1997). The present report focuses mainly on interview and
recall methods, and thus the issue of reactivity will not be discussed further.
Random error results from a variety of �random� sources of error, as its name
implies. Random error does not result in biased estimates, but it reduces the reliability of
the measurement (i.e., the measurement has low replicability). There are two main
sources of unreliability: (1) imprecision (random error in measurement, which can result
both from intra-observer and inter-observer measurement error), and (2) undependability
(random, nonnutritional factors that affect the measurement. The main source of
undependability is normal day-to-day variability.) (Habicht, Yarbrough, and Martorell
1979).
When recall methods are used, random error may be due to poor memory or
difficulties with the interview process and to other factors that may affect the ability of
the interviewee to respond to the questions. In the measurement of feeding practices, the
main source of unreliability is likely to be normal day-to-day variability. It is well
recognized that individual food and nutrient intakes vary substantially from day to day,
even in resource-poor settings (Piwoz et al. 1994; Nelson et al. 1989; Willett 1998b).
Caregiver feeding practices also vary from day to day, in response to child illness,
perceived appetite and growth, and a variety of caregiver factors such as time, resources,
employment patterns, and beliefs.
Although day-to-day variability does not bias estimates, it is important to try to
minimize it in order to increase reliability of the estimates (and reduce variability). There
are two main approaches to minimizing day-to-day variability. First, if factors that
increase the variability (instability) can be identified, data can be collected after
stratifying on these factors. This will reduce the instability of the indicator. Second,
repeating the measurements on multiple days (on each subject or a subsample) is another
approach commonly used to increase the reliability of the indicator. This is typically done

9
in dietary surveys, in which data from multiple (independent) days of dietary intake are
collected and averaged to capture the usual (mean) intake.
An alternative to this approach, which is often used when assessing behaviors, is
to ask respondents to characterize their typical behavior or practice. For example, instead
of asking the caregiver, �Who fed the child yesterday?,� the question could be
reformulated to ask, �Who usually feeds the child?� With regard to the collection of
dietary data, food frequency questionnaires have been developed for this purpose.
Typically, food frequency questionnaires aim to summarize frequency of intake of
specific foods over a certain period of time. When evaluating such questionnaires,
reliability is typically judged by assessing the reproducibility of the intake estimates from
repeated administration of the questionnaire, and validity is assessed by comparing the
intake estimates with usual nutrient intakes as measured during multiple days, using
quantitative dietary recalls or records.
Sensitivity and Specificity
Other performance criteria used to assess and select indicators are sensitivity and
specificity, which can be assessed only when a reference indicator (often referred to as a
�gold standard�) of the phenomenon of interest is available. The reference standard
provides the �truth� against which the performance of an alternative indicator can be
compared. This is the principle underlying the use of repeated recalls of dietary intakes as
the reference standard of usual dietary intake on which the validity of a food frequency
questionnaire can be judged.
Assessment of the sensitivity and specificity of an indicator allows an estimation
of the level of misclassification that results from using the indicator. Perfect sensitivity
implies that individuals with inadequate diets were so classified by the alternative
indicator; perfect specificity implies that individuals with adequate diets were so
classified by the indicator. Clearly, the higher the sensitivity and specificity, the less
misclassification error present and the better the indicator; however, it is also true that

10
some errors may be more costly than others, considering the cost of missing individuals
at risk or providing unnecessary services to those not at risk. It is the task of program
planners and policymakers to decide how much and what type of misclassification error
they are willing to tolerate in a given situation.
Application of Indicators
Several issues need to be considered when designing and using indicators of
complementary feeding practices. Five such concerns are briefly described below.
Universal Versus Context-Specific
Although, generally speaking, the concept of optimal feeding practices can be
applied universally, indicators to assess current status of infant feeding practices or
progress toward improved behaviors may need to be operationalized locally, depending
on specific contextual factors. By contrast with most breastfeeding indicators, which are
universal in their formulation, many indicators of complementary feeding will need to be
developed locally, because they depend on the specific practices of the target population
or on locally available foods. For example, although cereal-based porridges are a main
complementary food in many cultures, the ingredients and the method of preparation (i.e.,
whether fermentation or germination is used) need to be known, as well as the usual
consistency of the porridge, before designing locally relevant indicators of
complementary feeding practices. Another example is the use of fortified complementary
foods. Although one potential way to assess the quality of young children�s diet is to ask
about intake of fortified processed complementary foods, the specific question asked
must be adapted to the context where it is used. For example, in Guatemala, the question
would be whether the child consumes the locally produced complementary foods
Incaparina or Bienestarina, whereas in Ghana the question would refer to the use of
Weanimix. Similarly, if the main source of energy of young children is a traditional
porridge, information on the ingredients and preparation will be required.
11
Population Versus Individual
Indicators can be used to make inferences about individuals or groups of
individuals. This distinction is important, because the level of precision (lack of random
error) required to make inferences at the individual level is much greater than it is for
making inferences at the population level. When making inferences about groups (or at
the population level), it is still possible to derive unbiased estimates of the underlying
phenomena of interest as it pertains to a group, even if individual values in the
distribution are measured with error or are inherently unstable. For most evaluation
purposes, the ability to make inferences at the population level will suffice. However,
often a secondary use of such data is for etiological research in which the association
between, for example, individual child feeding patterns and growth, is of interest. For
examining individual-level associations such as these, more precise estimates are
required, and thus methods to reduce random error in measurement of feeding practices
need to be carefully applied.
Need For Age-Specific Indicators
As described earlier, optimal feeding of the infant and young child changes
rapidly during the first two years of life; thus, indicators must be flexible enough to
capture feeding practices at each stage. The key recommendation for the first six months
is exclusive breastfeeding. After six months, however, it is expected that the infant will
start receiving complementary foods, which will be introduced gradually into the diet. By
the age of nine months, it is expected that the child will be receiving a variety of
complementary foods, including animal products and micronutrient-rich foods. As the
contribution of complementary foods to the child�s energy and nutrient intake increases,
the optimal frequency of feeding, as well as the quantity and variety of foods, are
expected to increase. Clearly, indicators will not only have to be context-specific but also
age-specific within each contextual setting.

12
Assessment of Current Versus Past Behaviors
In selecting a timeframe for recording information on feeding practices, one has
to consider both accuracy and representativeness of the information. For instance, the 24-
hour recall method, the most widely used time period for collecting dietary information,
may be less prone to memory errors than longer periods; on the other hand, it is likely to
be less representative of usual practices or intakes. This is true for dietary assessment
methods used with both children and adults. An additional complexity of measuring
young infants� dietary patterns, however, is that feeding practices tend to vary widely
within short periods of time. Studies that compared 24-hour with 7-day recall of feeding
practices (Arimond and Ruel 2003) or monthly reports of usual practices (Piwoz et al.
1995) or longitudinal methods (Zohoori, Popkin, and Fernandez 1993; Aarts et al. 2000)
show wide discrepancies between measurement approaches. As expected, the one-day
recall consistently overestimates exclusive breastfeeding rates. The main explanation for
these discrepancies is that the movement from exclusive breastfeeding to mixed feeding
and to the family diet does not follow a unidirectional, consistent pathway. Both maternal
and child factors influence child feeding decisions, and these decisions are reversible
within short periods of time (Marquis et al. 1998). Thus, the length of the recall period
affects the estimated prevalence of feeding practices because of the true fluidity of these
practices during early infancy and the rapid changes occurring when caregivers move in
and out of certain practices. Consistency in the length of the recall period is therefore
important if comparisons are to be made between programs, regions, or countries. The
same issues apply to complementary feeding practices, but research findings currently
available relate to breastfeeding.
In addition to the true variability in feeding practices, memory and recall errors
may also affect prevalence estimates assessed from different lengths of recall. A study in
Southern Brazil showed that the magnitude of misclassification of breastfeeding duration
increased with time (Huttly et al. 1990). Compared with responses given when their
infant was 11 months, 24 percent and 30 percent of mothers misclassified the duration of
13
breastfeeding when interviewed after the child completed 23 and 47 months, respectively.
A systematic bias toward reporting longer durations of breastfeeding was observed
among wealthier and more educated mothers.
Thus, the length of recall for reporting infant and child feeding practices should
be standardized to ensure comparability between assessments. Estimates of early infant
feeding practices derived from interviews involving widely different lengths of recalls
between mothers of children of different ages (for example, all children under three or
five years of age) should be avoided because recall periods longer than 12 months or so
are unlikely to provide accurate estimates.
Single Indicators Versus Composite Indices
One of the goals of utilizing indicators is to communicate with policymakers and
program planners regarding program impact and progress toward achieving policy goals.
Given the multiplicity of indicators involved in the assessment of infant feeding
practices, and the need for age-specific indicators, it is often difficult to summarize the
information on infant and child feeding practices in an appealing and meaningful way.
Composite child feeding indices have the potential to address some of these constraints
and to provide useful information, particularly for advocacy and communication. In
particular, indices can be made age-specific and they can include various dimensions of
feeding practices (Ruel and Menon 2002). Composite indices can also be useful to detect
associations between practices and outcomes when some cluster of optimal practices�
rather than any single practice�is necessary to achieve benefits of detectable magnitude
(Arimond and Ruel 2001). For example, appropriate timing of introduction of
complementary foods is not sufficient to ensure that the child meets his or her daily
nutrient requirements. As will be described in Section 4, complementary foods must have
the right energy and nutrient density and be provided with sufficient frequency to respond
to children�s needs at different ages. Thus, some cluster of key practices (rather than any
14
individual practice) may be necessary for positive child outcomes, and these practices
may be better reflected by summary scales or indices than individually.
Indices can also be useful to capture the underlying concept of �optimal feeding
practices,� which is of key importance for programmatic and policy initiatives. To be
used for this purpose, however, indices have to be derived from existing
recommendations for optimal feeding practices. As will be highlighted in the following
section, specific, operational recommendations applicable to all contexts do not currently
exist for many of the dimensions of infant and child feeding. Moreover, even for those
dimensions for which recommendations do exist (e.g., the recommended amount of
specific micronutrients that should come from complementary foods at different ages),
the lack of simple tools to measure them requires the use of imperfect proxy measures.
To continue with this example, it may be possible to use dietary diversity (number of
foods or food groups consumed) as a proxy for micronutrient content of the diet.
However, in the absence of context-specific validation studies, it is impossible to
determine what would be the �optimal� dietary diversity that would allow children of
different ages to meet their micronutrient requirements.
The present report focuses on identifying a set of individual indicators of
complementary feeding practices. For additional discussion on the potential use of
composite indices, see Ruel and Menon (2002); Arimond and Ruel (2001); (Arimond and
Ruel 2003).
Measurement Approaches (Observation Versus Recall)
Information on child feeding practices can be collected by recall or by
observation. The issue of the length of recall and the errors associated with recall
methods when measuring dietary patterns or complex behaviors such as child feeding
practices were highlighted previously. Scientists have long been uncomfortable with the
degree of error inherent in such self-reported measures and have turned to observational
methods for the measurement of specific practices thought to be particularly prone to
15
recall biases. As indicated earlier, recall methods are strongly discouraged for the
measurement of hygiene practices because of the well-documented problem of systematic
over-reporting of good practices. Structured observations have therefore become the
method of choice for measuring hygiene practices. Observational methods, however, tend
to be time and resource-intensive and subject to reactivity (people modifying their
behavior because of the presence of an observer). Spot-check observations, a faster and
less intrusive alternative to structured observations, have recently gained popularity for
the measurement of hygiene practices (Ruel and Arimond 2002). This method, which
consists of observing a list of predetermined conditions at one point in time during a
home visit, seems to be less reactive, although it is equally subject to day-to-day
variability. To our knowledge, spot check observations have not yet been developed for
measuring other aspects of childcare and feeding practices. They are also likely to be of
limited usefulness for the measurement of hygiene during food preparation and feeding,
because they are designed to measure the consequences of behaviors (such as caregivers�
hands clean/dirty; compound swept/unswept), rather than the behaviors themselves
(caregiver washing her hands or sweeping the floor).
Child feeding practices are typically assessed by report or recall, and the
limitations of the methods for this purpose were summarized in earlier. Validation studies
are required to better document the strengths and limitations of these methods for
measuring feeding practices and approaches to minimize recall biases and errors have to
be pursued.
Experience with the measurement of psychosocial aspects of child feeding, such
as maternal encouragement to eat and other aspects of caregiver-child interaction during
feeding, is limited. Most studies to date have used structured observations to describe
these complex interactions. Scales have been developed but most have not been validated
(Bentley et al. 1991b; Engle and Zeitlin 1996; Gittelsohn et al. 1998; Guldan et al. 1993).
Experience with survey approaches is extremely scarce, and it is probable that many
aspects of psychosocial care will never be amenable to survey approaches (Arimond and
Ruel 2001).
16
Validation of Indicators
As described above, to be useful, an indicator must be valid, i.e., it must measure
the underlying construct it was designed to measure. For example, if the purpose of the
indicator were to describe feeding frequency (or the number of times a sample of
caregivers fed their child complementary foods yesterday), a valid indicator would�
when compared to some measure of truth such as observation of feeding frequency over
the previous 24 hours�correctly classify each caregiver/child pair in the right feeding-
frequency category. In the absence of perfection, some caregivers would be misclassified,
and thus the question of validity becomes one of �tolerable misclassification.� In other
words, the indicator is considered valid if it results in a tolerable level of misclassification
for its intended use in a particular context.
Validation in Relation to Recommended Practices (e.g., RDA, Ideal Feeding Behavior)
In addition to considering the validity of indicators for measuring specific
behavioral variables, a broader validity question that arises with complementary feeding
is whether the set of optimal feeding practices measured can accurately predict nutrient
adequacy. In other words, does the set of optimal practices adequately reflect nutrient
adequacy or guarantee that an individual meets his or her estimated daily requirements?
In Relation to Health Outcome (e.g., Growth, Cognitive Development, Morbidity, Mortality)
In the last few decades, it has been important to examine the �functional validity�
of nutritional indicators by assessing the degree to which variation in the indicator
reflects underlying differences in the performance, health, and survival of the target
population. For example, do children fed according to recommendations, as measured by
a series of indicators, grow better? Are their developmental outcomes �better� than
children who are not optimally fed? Such analyses have proven useful for motivating

17
concern for change among policymakers, but they do not assess the validity of the
indicator itself and are therefore not recommended for this purpose.
4. Review of Recommended Complementary Feeding Practices (Universal Recommendations)
The WHO/UNICEF document on complementary feeding that was published in
1998 used a simple, consistent conceptual framework to establish energy and nutrient
requirements from complementary foods (Brown, Dewey, and Allen 1998). These
requirements were based on the difference between young children�s estimated total
energy and nutrient requirements and the amounts of energy and nutrients transferred in
breast milk to children of different ages. Guidelines published in that document have
been updated recently, based on newly available information on children�s total energy
and nutrient requirements. The current recommendations are reviewed briefly in the
following sections, for each of three age groups: 6�8, 9�11, and 12�23 months. These
recommendations address each of the following key aspects of complementary feeding:
(1) the age of introduction of complementary foods and optimal duration of
breastfeeding, (2) the energy required from complementary foods (and related
recommendations concerning feeding frequency, food amounts, and energy density of
these foods), (3) the amounts of nutrients required from complementary foods, (4) the
appropriate consistency of these foods, (5) safe storage and preparation of
complementary foods, and (6) care during feeding.
Duration of Exclusive Breastfeeding and Continued Breastfeeding
The latest expert consultation on duration of exclusive breastfeeding (WHO 2002)
recommends exclusive breastfeeding for six months, with introduction of complementary
foods and continued breastfeeding thereafter. Maintenance of frequent, on-demand
breastfeeding until two years or beyond is also recommended.

18
Energy Required From Complementary Foods
New information is available on the total daily energy expenditure and body
composition of healthy children, based on longitudinal observations carried out in the
United States. These data have been adapted recently by a WHO/FAO/UNU expert
committee to establish revised estimates of young children�s total daily energy
requirements. Based on this new information, estimates of the amount of energy required
from complementary foods have been recalculated for children of different ages who
consume average amounts of breast milk. In particular, the recommended levels of
energy intake from complementary foods for infants with average breast milk intake in
developing countries are about 200 kcal/d for infants 6�8 months of age, 300 kcal/d for
infants 9�11 months of age, and 550 kcal/d for children 12�23 months of age (Dewey and
Brown 2003). These recommendations assume good maternal nutritional status and
adequate breast milk volume and composition.
Because of the difficulty in communicating specific amounts of food energy,
practical recommendations for complementary feeding are generally stated in terms of
the desirable feeding frequency, amount of food to be offered per feeding episode, and
mean energy density of these foods. The latter is often expressed in terms of the types of
foods (e.g., thick porridge) that might have the recommended level of energy density.
Based on the revised estimates of energy needs from complementary foods described
above, recommendations on the desired feeding frequency were also modified in relation
to different possible levels of energy density of these foods (and vice versa). To develop
feeding guidelines for the general population, information on children with low energy
intake from breast milk was used, as these provide the most conservative assumptions
regarding the minimum desirable number of meals or energy density of complementary
foods needed to ensure adequate total energy intake. Based on these estimates, revised
recommendations have been formulated (PAHO/WHO 2003). For the average healthy
breastfed infant and young child with average energy density from complementary foods
of at least 0.8 kcal/g, it is recommended that meals of complementary foods be fed 2�3
19
times per day at 6�8 months of age, 3�4 times per day at 9�11 months of age, and 3�4
times per day at 12�23 months of age.
Recommendations also state that older infants and young children should be
provided additional �nutritious snacks1 (such as a piece of fruit or bread or chapatti with
nut paste) offered 1�2 times per day, as desired�; and that �if energy density or amount of
food per meal is low, or the child is no longer breastfed, more frequent meals may be
required� (PAHO/WHO 2003).
Note that previous recommendations for children 12�23 months of age were to
feed complementary foods 4�5 times per day. It is currently believed, however, that high
meal frequency may lead to excessive displacement of breast milk; for this reason, the
revised recommendation limits the number of feedings to a maximum of four, even
among children in their second year of life. It is thus important to confirm that energy
density of the diet is 0.8 kcal/g or higher in this age group to ensure that they receive
sufficient energy from complementary foods.
Nutrient Density
It is equally important to ensure that children meet their micronutrient
requirements from a combination of complementary foods and breast milk. As indicated
above, nutrient requirements from complementary foods have been estimated as the
difference between young children�s estimated total nutrient needs and the amounts
transferred in breast milk to children of different ages (Brown, Dewey, and Allen 1998).
The recommended nutrient intakes from complementary foods have been further
expressed as nutrient densities, by dividing the amounts required from complementary
foods by the amount of energy needed from these foods at each age. These recommended
nutrient densities have also been updated recently, using newly available information on
estimated energy and nutrient requirements of young children (Dewey and Brown 2003).
1 Snacks are defined as foods eaten between meals�usually self-fed, convenient, and easy to prepare (PAHO/WHO 2003).

20
A summary of the recommended total daily nutrient intakes and nutrient densities of
complementary foods is presented by age group in Table 2.
Table 2. Recommended total daily nutrient intakes and nutrient densities (per 100 kcal) of complementary foods, by age groupa (Dewey and Brown 2003)
Recommended nutrient intake per day, by age
group (months)
Recommended nutrient density of complementary foods per 100
kcal, by age group (months) Nutrient 6�8 9�11 12�23 6�8 9�11 12�23 Vitamin A (µg RE/d or per 100 kcal) 400 400 400 31 30 23 Folate (µg/d or per 100 kcal) 80 80 160 11 9 21 Niacin (mg/d or per 100 kcal) 4 4 6 1.5 1.0 0.9 Pantothenic acid (mg/d or per 100 kcal) 1.8 1.8 2.0 0.29 0.23 0.18 Riboflavin (mg/d or per 100 kcal) 0.4 0.4 0.5 0.08 0.06 0.06 Thiamin (mg/d or per 100 kcal) 0.3 0.3 0.5 0.08 0.06 0.07 Vitamin B6 (mg/d or per 100 kcal) 0.3 0.3 0.5 0.12 0.06 0.08 Vitamin B12 (ng/d or per 100 kcal) 0.5 0.5 0.9 0.08 0.03 0.07 Vitamin C (mg/d or per 100 kcal) 30 30 30 1.5 1.7 1.5 Vitamin D (µg/d or per 100 kcal) 5 5 5 2.3 1.5 0.9 Vitamin K (µg/d or per 100 kcal) 10 10 15 4.2 2.8 2.5 Calcium (mg/d or per 100 kcal) 400 400 500 105 74 63 Iodine (µg/d or per 100 kcal) 90 90 90 7.9 7.2 5.4 Iron (mg/d or per 100 kcal) 9.3 9.3 5.8 4.5 3.0 1.0 Magnesium (mg/d or per 100 kcal) 54 54 60 15 11 7 Selenium (µg/d or per 100 kcal) 10 10 17 0 0 1.1 Zinc (mg/d or per 100 kcal) 4.1 4.1 4.1 1.6 1.1 0.6 a Estimates assume average breast milk intake.
Appropriate Consistency for Age (Special Foods Versus Family Foods)
Children�s ability to chew and swallow different physical forms of food,
especially foods of thick or solid consistency, varies with age. In general, infants 6�11
months of age need soft, mashed (low viscosity) foods, whereas older children can cope
with the same solid foods consumed by other members of the family. By approximately
eight months of age, children can also start eating some �finger foods� (foods that the
child can eat alone).

21
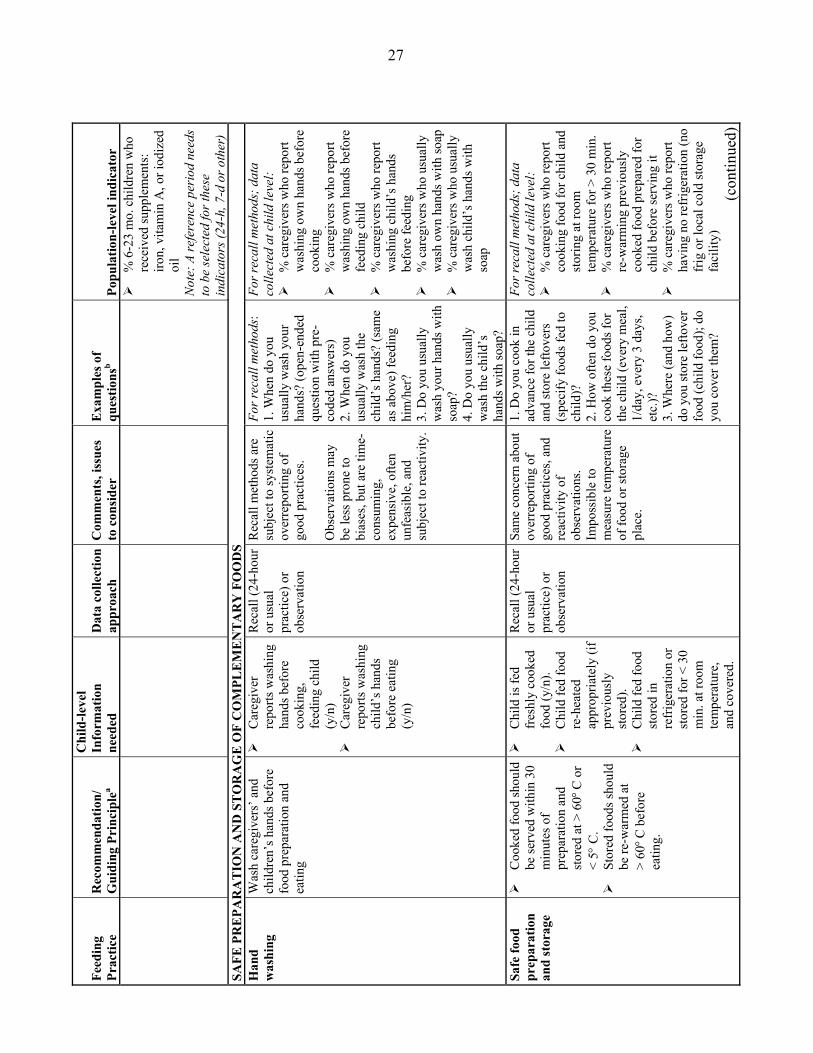
Safe Preparation and Storage of Complementary Foods
To interrupt transmission of potential pathogens through food or infant feeding, a number
of specific behaviors are recommended. First, the individuals preparing and serving food
(including the child) should wash hands thoroughly before food preparation and handling.
Secondly, food should be served immediately after preparation and stored safely. Third,
clean utensils should be used to prepare and serve food. Fourth clean cups and bowls
should be used when feeding children. And finally, feeding bottles should be avoided
because they are difficult to keep clean (PAHO/WHO 2003). Additional food safety tips
are provided by WHO in Five keys to safer food (WHO 2001), as follows:
1. Keep clean: wash hands and maintain kitchen area and utensils clean.
2. Separate raw and cooked: keep raw meat in particular separate from other foods
consumed raw.
3. Cook thoroughly: (especially meat, eggs, seafood); cook foods to a temperature of
70°C; reheat cooked food thoroughly.
4. Keep food at safe temperatures: do not leave cooled food at room temperature for
more than two hours; store food at temperatures above 60°C or below 5°C; do not
store food too long, even refrigerated; do not thaw frozen food at room
temperature.
5. Use safe water and raw materials: use safe water or treat it; select fresh foods;
choose foods processed for safety (e.g., pasteurized milk); wash fruits and
vegetables.
Care During Feeding
Increasingly it is recognized that, in addition to the dietary aspects of feeding,
caregiver-child interactions during feeding may critically influence nutrient intakes.
Although such interactions are repeated, complex, and variable, feeding behaviors often
occur together in ways that can be conceptualized as a caregiver �feeding style.�

22
In the literature, three feeding styles have been conceptualized: controlling,
laissez-faire, and responsive (Birch and Fisher 1995; Bentley 1999). In a controlling style
of feeding, the caregiver seeks to control when and how much the child eats; this may
result in either forced feeding or dietary restriction. It has been theorized that children
learning to eat in an environment characterized by a controlling style of feeding do not
learn to recognize their appetite cues and self-regulate their energy intake, and that
ultimately such children are at risk of becoming overweight (Birch and Fisher 2000;
Black et al. 2001).
At the other end of the spectrum is the laissez-faire style of feeding, in which the
caregiver provides little physical help or verbal encouragement to eat, even to children
less than one year of age. In general, this style of feeding does not reflect neglect, but
rather stems from parental and cultural beliefs that support minimal caretaker-child
interaction during feeding, including beliefs that the child should determine when and
how much to eat, that a child knows his or her own limits, or that learning to self feed
builds resilience (Dettwyler 1989a; Zeitlin 1996; Engle and Zeitlin 1996; Bentley 1999).
Laissez-faire or passive styles of feeding have been documented in diverse cultural
settings in developing countries and have been hypothesized to contribute substantially to
growth faltering in children 6�24 months of age, especially when combined with an
environment in which children are frequently ill, with its associated anorexia (Dettwyler
1989b; Bentley et al. 1991b).
The third style of feeding, termed �responsive,� includes such behaviors as
physically helping the young child to eat, verbal encouragement and prompting, role
playing, persistence and patience, offering additional spoonfuls or bites, monitoring of
child cues of appetite and satiation, and a variety of other strategies that improve dietary
intakes.
An accumulating body of evidence links laissez-faire feeding to lower dietary
intakes and anthropometric status, and controlling feeding to excess energy intake and
overweight, leading to the argument that responsive feeding represents an optimal style to
support the short- and long-term growth and development of young children (Bentley et
23
al. 1991b; Engle and Zeitlin 1996; Klesges et al. 1991; Birch and Fisher 2000). For this
reason, it is recommended that responsive feeding should be practiced.
Responsive feeding fits well within the principles of psychosocial care (Engle,
Bentley, and Pelto 2000; Pelto, Levitt, and Thairu 2002). Three principles of
psychosocial care apply to optimal feeding: (a) perceive and interpret accurately the
child�s signals regarding hunger and satiety; (b) respond adequately and promptly; (c) use
�scaffolding� in interactions. �Scaffolding� describes a learning process in which a
caregiver observes and builds on a child�s abilities and skills, responds to various cues
from the child, provides support when necessary, and gradually releases responsibility for
the accomplishment of the task, in this case, eating.
As stated in a recent document describing �Guiding Principles for Breastfeeding
and Complementary Feeding� (PAHO/WHO 2003), optimal caregiver-child interactions
during feeding should include: (a) feeding infants and assisting older children when they
feed themselves, being responsive to their hunger and satiety cues; (b) feeding slowly and
patiently, and encouraging children to eat, but without forcing them; (c) experimenting
with different food combinations, tastes, textures and methods of encouragement when
children refuse to eat; (d) minimizing distractions during meals; (e) talking to children
during feeding, with eye to eye contact, recognizing that feeding times are periods of
learning and love.
It should be recognized that successful programs to improve the feeding of infants
and young children have long recognized the need to educate and motivate caregivers on
feeding behaviors in order to accomplish feeding goals (Bentley, Black, and Hurtado
1996; Caulfield, Huffman, and Piwoz 1999). Although there is some consensus on how
children should be fed and the key feeding behaviors or strategies that support the
paradigm of responsive feeding and the importance of psychosocial care, there is a
paucity of research demonstrating that such behaviors can be changed, or documenting
that such changes influence the dietary intakes or health and nutrition outcomes or young
children. More research in this area is urgently needed.

24
5. Possible Indicators of Adequacy of Recommended Practices
In this section, we present a series of possible indicators of adequate
complementary feeding practices in relation to the key aspects of complementary feeding
discussed above. In each case, we first discuss ideal indicators and measurement
approaches, that is, those that presumably provide accurate and valid information on the
particular aspect of complementary feeding, although the intensity of data collection may
render them impractical for large-scale programmatic use. We then propose alternative
proxy indicators that might be applied to approximate the same information, but are
easier to collect and therefore potentially more feasible for routine use. These alternative
indicators, however, may be less precise (have more random error), and their
performance may need to be evaluated in different contexts and for different purposes.
Table 3 summarizes proposed population indicators for the different aspects of
child feeding discussed in this report for breastfed, 6- to 23-month-old children.
Emphasis is placed throughout this report on defining population-level, as opposed to
individual-level, indicators. As indicated earlier, these levels refer to those at which
inferences can be made, as opposed to the level at which data are collected. For instance,
many of the population-level indicators proposed in Table 3, require data collection at the
individual level. However, in most cases, they should not be used to make inferences at
the child level, but rather, should be used for group- or population-level inferences only.
Table 3 also summarizes current age-specific recommendations for each practice
reviewed, based on the �Guiding Principles�(PAHO/WHO 2003), identifies the
individual-level type of information required to derive the indicators, proposes data
collection approaches, and provides examples of questions that can be used to guide data
collection. Note that the questions listed should be used merely as a guide and should not
replace the development of locally relevant and culturally appropriate interview
questions.

T
able
3. S
ugge
sted
indi
cato
rs fo
r m
easu
ring
com
plem
enta
ry fe
edin
g pr
actic
es a
mon
g ch
ildre
n ag
es 6
�24
mon
ths
Feed
ing
Prac
tice
Rec
omm
enda
tion/
G
uidi
ng P
rinc
iple
a
Chi
ld-le
vel
Info
rmat
ion
need
ed
Dat
a co
llect
ion
appr
oach
C
omm
ents
, iss
ues
to c
onsi
der
Exa
mpl
es o
f qu
estio
nsb
Popu
latio
n-le
vel i
ndic
ator
C
ON
TIN
UE
D B
RE
AST
FEE
DIN
G (B
F)
C
ontin
ued
BF
Con
tinue
freq
uent
, on-
dem
and
BF
until
2 y
ears
of
age
or b
eyon
d
!
BF
(y/n
) !
Freq
uenc
y -d
aytim
e -n
ight
time
24-h
our r
ecal
lc H
ow sh
ould
in
form
atio
n on
fe
edin
g fr
eque
ncy
be c
olle
cted
and
in
terp
rete
d?
1. D
id y
ou b
reas
tfeed
th
e ch
ild
yest
erda
y? O
r do
you
curr
ently
br
east
feed
chi
ld?
2. H
ow m
any
times
di
d yo
u br
east
feed
ch
ild d
urin
g th
e da
y�du
ring
the
nigh
t? (C
odes
sh
ould
incl
ude
num
ber o
f tim
es
and
code
for �
on
dem
and.
�)
From
dat
a co
llect
ed a
t chi
ld
leve
l: !
% 6
-23
mo.
chi
ldre
n B
F ye
ster
day:
indi
cato
r can
al
so b
e de
rived
for s
mal
ler
age
grou
ps, a
ssum
ing
appr
opria
te sa
mpl
e si
ze
(e.g
., 6-
11, 1
2-17
, 18-
23,
etc.
) !
% c
hild
ren
BF
yest
erda
y at
le
ast m
inim
um n
umbe
r of
times
for a
ge (m
inim
um to
be
det
erm
ined
) !
% 6
-23
mo.
chi
ldre
n B
F �o
n de
man
d� (a
ccor
ding
to
loca
l def
initi
on)
EN
ER
GY
FR
OM
CO
MPL
EM
EN
TA
RY
FO
OD
S (C
F)
a)
Ene
rgy
dens
ity
(com
mun
ity/
grou
p le
vel
indi
cato
r;
loca
lly
defin
ed)
Ave
rage
ene
rgy
dens
ity
shou
ld b
e ≥
0.8
kcal
/g !
Ave
rage
ene
rgy
dens
ity o
f mai
n so
urce
s of
ener
gy
(por
ridge
or
grue
l)
Gro
up/
Com
mun
ity
leve
l:
1) G
roup
reci
pe
trial
s to
iden
tify
mai
n so
urce
s of
ener
gy a
t di
ffer
ent a
ges,
mea
sure
in
gred
ient
s us
ed in
pr
epar
atio
ns; o
r2)
reca
ll to
ga
ther
in
form
atio
n on
re
cipe
s
Info
rmat
ion
is th
en
used
to d
eriv
e en
ergy
den
sity
(and
nu
trien
t den
sity
) of
mai
n C
F, u
sing
food
co
mpo
sitio
n ta
bles
.
Gro
up/c
omm
unity
le
vel:
1)
Gro
up re
cipe
tria
ls
(see
met
hod,
Sec
tion
5, p
age
36)
2) R
ecal
l: 1.
Wha
t is t
he m
ain
food
(por
ridge
or
othe
r) th
at c
areg
iver
s us
ually
feed
chi
ldre
n [_
_] m
o. in
this
co
mm
unity
? 2.
How
is th
is fo
od
usua
lly p
repa
red?
(N
eed
to c
olle
ct
info
rmat
ion
on
reci
pes a
nd a
mou
nts
deriv
ed fr
om re
cipe
s)
From
dat
a co
llect
ed a
t gr
oup/
com
mun
ity le
vel:
!
Ave
rage
ene
rgy
dens
ity
of m
ain
sour
ces o
f en
ergy
for c
hild
ren
of
diff
eren
t age
gro
ups.
(con
tinue
d)
25

Feed
ing
Prac
tice
Rec
omm
enda
tion/
G
uidi
ng P
rinc
iple
a
Chi
ld-le
vel
Info
rmat
ion
need
ed
Dat
a co
llect
ion
appr
oach
C
omm
ents
, iss
ues
to c
onsi
der
Exa
mpl
es o
f qu
estio
nsb
Popu
latio
n-le
vel i
ndic
ator
b)
Fee
ding
(m
eal)
freq
uenc
y
Rec
omm
ende
d fr
eque
ncy
of fe
edin
g C
F ar
e:
2-3
times
: 6-8
mo.
old
3-
4 tim
es: 9
-11
mo.
3-
4 tim
es: 1
2-23
mo.
In
add
ition
, 1-2
nu
tritio
us sn
acks
shou
ld
be p
rovi
ded.
!
Num
ber o
f tim
es c
hild
fed
mea
ls o
f CF
yest
erda
y (e
ach
CF
or a
ny C
F)
!
Num
ber o
f tim
es c
hild
fed
snac
ks
yest
erda
y
24-h
our r
ecal
l N
eed
to d
efin
e fe
edin
g ep
isod
e;
Nee
d to
dis
tingu
ish
betw
een
mea
ls a
nd
snac
ks;
Nee
d to
dev
elop
ap
proa
ch to
elic
it ac
cura
te
info
rmat
ion.
How
man
y tim
es d
id
you
feed
the
child
CF
yest
erda
y (u
sing
loca
l ex
ampl
es)?
; H
ow m
any
times
did
yo
u fe
ed th
e ch
ild
snac
ks (u
sing
loca
l na
me
and
exam
ples
of
typi
cal s
nack
s in
this
pop
ulat
ion)
? A
ltern
ativ
e: U
se a
st
ep-b
y-st
ep se
ries o
f qu
estio
ns to
hel
p re
call
feed
ing
even
ts
of p
revi
ous d
ay.
From
dat
a co
llect
ed a
t chi
ld
leve
l: !
% 6
-8 m
o. o
ld c
hild
ren
fed
CF
at le
ast 2
tim
es in
pas
t 24
hou
rs
!
% 9
-11
mo.
old
chi
ldre
n fe
d C
F at
leas
t 3 ti
mes
in
last
24
hour
s !
% 1
2-23
mo.
old
chi
ldre
n fe
d C
F at
leas
t 3 ti
mes
in
last
24
hour
s !
% 6
-23
mo.
old
chi
ldre
n fe
d sn
acks
at l
east
1 ti
me
in la
st 2
4 ho
urs
Not
e: in
dica
tors
to b
e us
ed
only
if a
vera
ge e
nerg
y de
nsity
of
die
t ≥ 0
.8 k
cal/g
N
UT
RIE
NT
S FR
OM
CO
MPL
EM
EN
TA
RY
FO
OD
S
Nut
rien
t de
nsity
(d
ieta
ry
qual
ity)
Feed
a v
arie
ty o
f foo
ds
to e
nsur
e nu
trien
t nee
ds
are
met
. Mea
t, po
ultry
, fis
h, o
r egg
s sho
uld
be
eate
n da
ily, o
r as o
ften
as p
ossi
ble.
V
eget
aria
n di
ets c
anno
t m
eet n
eeds
unl
ess
supp
lem
ents
or f
ortif
ied
prod
ucts
are
use
d.
Vita
min
-A ri
ch fr
uits
an
d ve
geta
bles
shou
ld
be e
aten
dai
ly. P
rovi
de
diet
s with
ade
quat
e fa
t co
nten
t. U
se fo
rtifie
d C
F or
vi
tam
in-m
iner
al
supp
lem
ents
for i
nfan
t, as
nee
ded.
!
Chi
ld e
nerg
y an
d nu
trien
t in
take
; or i
ntak
e of
list
of f
oods
(y
/n);
or o
f lis
t of
food
gro
ups
(y/n
)
Alte
rnat
ive
appr
oach
es (b
y de
scen
ding
or
der o
f pr
ecis
ion
of
estim
ates
): 1.
Qua
ntita
tive
24-h
our r
ecal
l 2.
Foo
d fr
eque
ncy
(sel
ecte
d fo
ods)
3.
Num
ber o
f fo
ods o
r foo
d gr
oups
(die
tary
di
vers
ity (D
D))
4. In
take
of
pre-
sele
cted
fo
ods o
r foo
d gr
oups
24-h
our r
ecal
ls
Food
freq
uenc
y qu
estio
nnai
res (
for
spec
ific
nutri
ents
) 24
-hou
r or 7
-day
re
calls
of n
umbe
r of
food
s or f
ood
grou
ps (D
D)
24-h
our o
r 7-d
ay
reca
ll of
inta
ke o
f pr
e-se
lect
ed fo
ods
or fo
od g
roup
s
Exam
ples
of f
ood
freq
uenc
y qu
estio
nnai
res (
Hel
en
Kel
ler f
or v
itam
in A
in
take
(Hel
en K
elle
r In
tern
atio
nal 1
994)
) Ex
ampl
es o
f foo
d gr
oup
ques
tionn
aire
s:
KPC
2000
and
DH
S+
(ww
w.m
easu
redh
s. co
m)
From
dat
a co
llect
ed a
t chi
ld
leve
l: !
% 6
-23
mo.
chi
ldre
n w
ho
cons
umed
ani
mal
food
s !
% 6
-23
mo.
chi
ldre
n w
ho
cons
umed
dai
ry p
rodu
cts
!
% 6
-23
mo.
chi
ldre
n w
ho
cons
umed
vita
min
A-r
ich
frui
ts o
r veg
etab
les
!
% 6
-23
mo.
chi
ldre
n w
ho
cons
umed
forti
fied
food
s (li
st lo
cally
ava
ilabl
e on
es)
!
Mea
n nu
mbe
r of f
oods
or
food
gro
ups c
onsu
med
!
% 6
-23
mo.
chi
ldre
n w
ith
low
, ave
rage
, hig
h di
etar
y di
vers
ity (b
ased
on
sam
ple-
and
age
-spe
cific
te
rtile
s)
(c
ontin
ued)
26
Feed
ing
Prac
tice
Rec
omm
enda
tion/
G
uidi
ng P
rinc
iple
a
Chi
ld-le
vel
Info
rmat
ion
need
ed
Dat
a co
llect
ion
appr
oach
C
omm
ents
, iss
ues
to c
onsi
der
Exa
mpl
es o
f qu
estio
nsb
Popu
latio
n-le
vel i
ndic
ator
!
% 6
-23
mo.
chi
ldre
n w
ho
rece
ived
supp
lem
ents
: iro
n, v
itam
in A
, or i
odiz
ed
oil
Not
e: A
refe
renc
e pe
riod
nee
ds
to b
e se
lect
ed fo
r the
se
indi
cato
rs (2
4-h,
7-d
or o
ther
) SA
FE P
RE
PAR
AT
ION
AN
D S
TO
RA
GE
OF
CO
MPL
EM
EN
TA
RY
FO
OD
S
Han
d w
ashi
ng
Was
h ca
regi
vers
� and
ch
ildre
n�s h
ands
bef
ore
food
pre
para
tion
and
eatin
g
!
Car
egiv
er
repo
rts w
ashi
ng
hand
s bef
ore
cook
ing,
fe
edin
g ch
ild
(y/n
) !
Car
egiv
er
repo
rts w
ashi
ng
child
�s h
ands
be
fore
eat
ing
(y/n
)
Rec
all (
24-h
our
or u
sual
pr
actic
e) o
r ob
serv
atio
n
Rec
all m
etho
ds a
re
subj
ect t
o sy
stem
atic
ov
erre
porti
ng o
f go
od p
ract
ices
. O
bser
vatio
ns m
ay
be le
ss p
rone
to
bias
es, b
ut a
re ti
me-
cons
umin
g,
expe
nsiv
e, o
ften
unfe
asib
le, a
nd
subj
ect t
o re
activ
ity.
For r
ecal
l met
hods
: 1.
Whe
n do
you
us
ually
was
h yo
ur
hand
s? (o
pen-
ende
d qu
estio
n w
ith p
re-
code
d an
swer
s)
2. W
hen
do y
ou
usua
lly w
ash
the
child
�s h
ands
? (s
ame
as a
bove
) fee
ding
hi
m/h
er?
3. D
o yo
u us
ually
w
ash
your
han
ds w
ith
soap
? 4.
Do
you
usua
lly
was
h th
e ch
ild�s
ha
nds w
ith so
ap?
For r
ecal
l met
hods
; dat
a co
llect
ed a
t chi
ld le
vel:
!
% c
areg
iver
s who
repo
rt w
ashi
ng o
wn
hand
s bef
ore
cook
ing
!
% c
areg
iver
s who
repo
rt w
ashi
ng o
wn
hand
s bef
ore
feed
ing
child
!
% c
areg
iver
s who
repo
rt w
ashi
ng c
hild
�s h
ands
be
fore
feed
ing
!
% c
areg
iver
s who
usu
ally
w
ash
own
hand
s with
soap
!
% c
areg
iver
s who
usu
ally
w
ash
child
�s h
ands
with
so
ap
Safe
food
pr
epar
atio
n an
d st
orag
e
!
Coo
ked
food
shou
ld
be se
rved
with
in 3
0 m
inut
es o
f pr
epar
atio
n an
d st
ored
at >
60°
C o
r <
5° C
. !
Stor
ed fo
ods s
houl
d be
re-w
arm
ed a
t >
60° C
bef
ore
eatin
g.
!
Chi
ld is
fed
fres
hly
cook
ed
food
(y/n
). !
Chi
ld fe
d fo
od
re-h
eate
d ap
prop
riate
ly (i
f pr
evio
usly
st
ored
). !
Chi
ld fe
d fo
od
stor
ed in
re
frig
erat
ion
or
stor
ed fo
r < 3
0 m
in. a
t roo
m
tem
pera
ture
, an
d co
vere
d.
Rec
all (
24-h
our
or u
sual
pr
actic
e) o
r ob
serv
atio
n
Sam
e co
ncer
n ab
out
over
repo
rting
of
good
pra
ctic
es, a
nd
reac
tivity
of
obse
rvat
ions
. Im
poss
ible
to
mea
sure
tem
pera
ture
of
food
or s
tora
ge
plac
e.
1. D
o yo
u co
ok in
ad
vanc
e fo
r the
chi
ld
and
stor
e le
ftove
rs
(spe
cify
food
s fed
to
child
)?
2. H
ow o
ften
do y
ou
cook
thes
e fo
ods f
or
the
child
(eve
ry m
eal,
1/da
y, e
very
3 d
ays,
etc.
)?
3. W
here
(and
how
) do
you
stor
e le
ftove
r fo
od (c
hild
food
); do
yo
u co
ver t
hem
?
For r
ecal
l met
hods
; dat
a co
llect
ed a
t chi
ld le
vel:
!
% c
areg
iver
s who
repo
rt co
okin
g fo
od fo
r chi
ld a
nd
stor
ing
at ro
om
tem
pera
ture
for >
30
min
. !
% c
areg
iver
s who
repo
rt re
-war
min
g pr
evio
usly
co
oked
food
pre
pare
d fo
r ch
ild b
efor
e se
rvin
g it
!
% c
areg
iver
s who
repo
rt ha
ving
no
refr
iger
atio
n (n
o fr
ig o
r loc
al c
old
stor
age
faci
lity)
(c
ontin
ued)
27

Feed
ing
Prac
tice
Rec
omm
enda
tion/
G
uidi
ng P
rinc
iple
a
Chi
ld-le
vel
Info
rmat
ion
need
ed
Dat
a co
llect
ion
appr
oach
C
omm
ents
, iss
ues
to c
onsi
der
Exa
mpl
es o
f qu
estio
nsb
Popu
latio
n-le
vel i
ndic
ator
4. D
o yo
u re
-war
m
stor
ed fo
od
thor
ough
ly (m
ay n
eed
to a
sk h
ow lo
ng it
ta
kes t
o re
-hea
t) be
fore
serv
ing
it to
th
e ch
ild?
5.D
o yo
u ha
ve a
frig
. or
ano
ther
type
of
loca
lly a
dapt
ed c
old
stor
age
faci
lity?
C
lean
ute
nsils
an
d av
oida
nce
of
baby
bot
tles
!
Use
cle
an u
tens
ils
to p
repa
re/s
erve
fo
od
!
Use
cle
an
cups
/bow
ls to
feed
ch
ild
!
Avo
id fe
edin
g bo
ttles
!
Mom
repo
rts
was
hing
and
dr
ying
coo
king
an
d fe
edin
g ut
ensi
ls b
efor
e us
ing.
!
Feed
ing
bottl
es
are
used
(y/n
).
Rec
all (
24-h
our
or u
sual
pr
actic
e) o
r ob
serv
atio
n Fo
r bot
tles:
re
call:
24-
hour
s (a
s per
WH
O
1991
)
Sam
e co
ncer
n ab
out
over
repo
rting
of
good
pra
ctic
es a
nd
reac
tivity
of
obse
rvat
ions
B
ottle
s may
not
be
used
eve
ry d
ay. M
ay
be b
ette
r to
use
long
er re
call
perio
d.
Use
ful f
or
inte
rvie
wer
to c
heck
ar
ound
for s
igns
of
baby
bot
tles
1. W
hat u
tens
ils d
o yo
u us
ually
use
to
give
liqu
ids t
o ch
ild?
Ask
to se
e.
2. D
id y
ou fe
ed c
hild
w
ith a
bot
tle in
pas
t 24
hou
rs
3. W
hat u
tens
ils d
o yo
u us
ually
use
to
feed
chi
ld C
F. A
sk to
se
e.
4. H
ow o
ften
do y
ou
was
h bo
wls
and
oth
er
uten
sils
to fe
ed c
hild
; al
tern
ativ
ely:
whe
n di
d yo
u w
ash
them
ye
ster
day?
For r
ecal
l met
hods
; dat
a co
llect
ed a
t chi
ld le
vel:
!
% o
f car
egiv
ers w
ho re
port
was
hing
and
dry
ing
feed
ing
uten
sils
/bow
ls
befo
re fe
edin
g ch
ild
!
% o
f chi
ldre
n <
12 m
o.
bottl
e-fe
d in
pas
t 24
hour
s (W
HO
199
1) o
r !
% c
hild
ren
who
hav
e be
en
bottl
e-fe
d in
pas
t 7 d
ays,
mo.
, or s
ince
birt
h
Wat
er u
sed
in fo
od
prep
arat
ion
Wat
er u
sed
to p
repa
re
cold
drin
ks o
r unc
ooke
d fo
od fo
r chi
ld sh
ould
be
boile
d or
trea
ted.
!
Car
egiv
er
repo
rts tr
eatin
g th
e w
ater
use
d fo
r pre
parin
g fo
od a
nd d
rinks
fo
r chi
ld (y
/n)
(in a
reas
whe
re
wat
er is
uns
afe)
.
Rec
all
(yes
terd
ay) o
r us
ual p
ract
ice
Aga
in p
ossi
ble
bias
to
war
d ov
er-
repo
rting
of g
ood
prac
tice
1. W
here
do
you
get
the
wat
er y
ou u
se fo
r pr
epar
ing
food
or
drin
ks fo
r chi
ld?
2. D
o yo
u us
ually
tre
at th
e w
ater
you
us
e to
pre
pare
drin
ks
or fo
od fo
r chi
ld?
3. If
yes
, how
do
you
treat
it (p
robe
al
tern
ativ
es)
For r
ecal
l met
hods
; dat
a co
llect
ed a
t chi
ld le
vel:
!
% c
areg
iver
s who
trea
t w
ater
use
d to
pre
pare
food
an
d dr
inks
for c
hild
(boi
l, ch
lorin
e, e
tc.)
Not
e: in
dica
tor s
houl
d be
use
d on
ly in
are
as w
here
wat
er is
un
safe
.
(con
tinue
d)
28
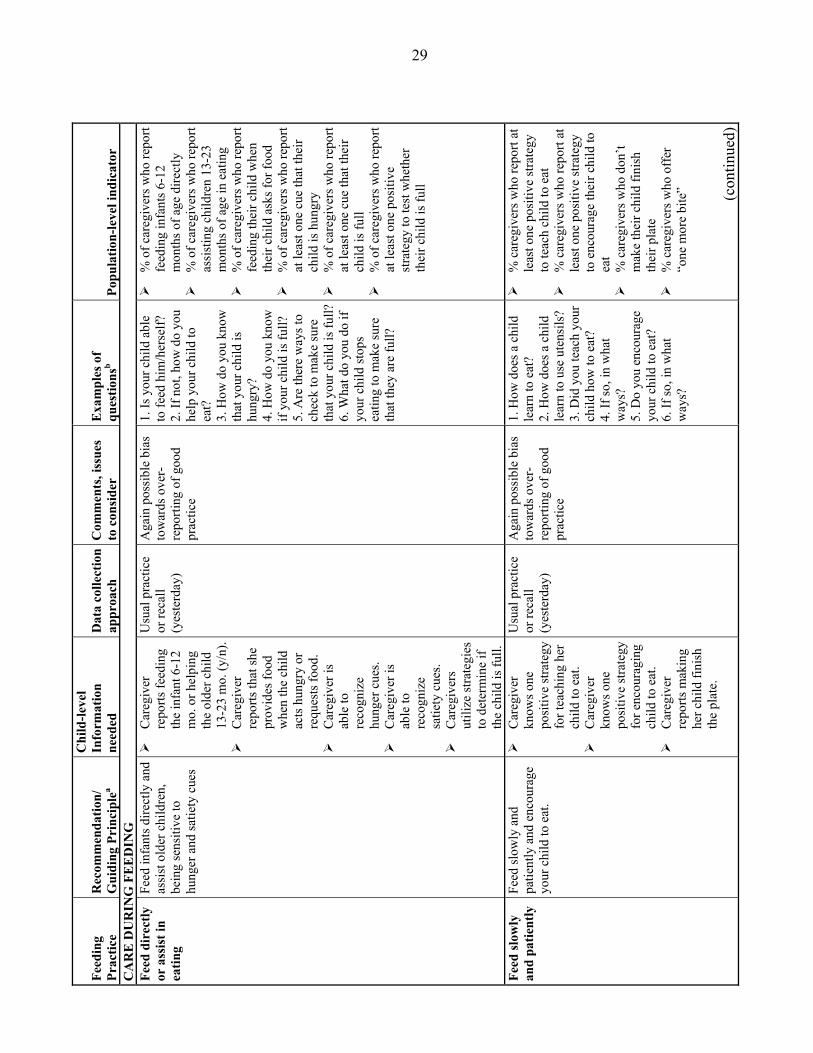
Feed
ing
Prac
tice
Rec
omm
enda
tion/
G
uidi
ng P
rinc
iple
a
Chi
ld-le
vel
Info
rmat
ion
need
ed
Dat
a co
llect
ion
appr
oach
C
omm
ents
, iss
ues
to c
onsi
der
Exa
mpl
es o
f qu
estio
nsb
Popu
latio
n-le
vel i
ndic
ator
C
AR
E D
UR
ING
FE
ED
ING
Fe
ed d
irec
tly
or a
ssis
t in
eatin
g
Feed
infa
nts d
irect
ly a
nd
assi
st o
lder
chi
ldre
n,
bein
g se
nsiti
ve to
hu
nger
and
satie
ty c
ues
!
Car
egiv
er
repo
rts fe
edin
g th
e in
fant
6-1
2 m
o. o
r hel
ping
th
e ol
der c
hild
13
-23
mo.
(y/n
).!
Car
egiv
er
repo
rts th
at sh
e pr
ovid
es fo
od
whe
n th
e ch
ild
acts
hun
gry
or
requ
ests
food
. !
Car
egiv
er is
ab
le to
re
cogn
ize
hung
er c
ues.
!
Car
egiv
er is
ab
le to
re
cogn
ize
satie
ty c
ues.
!
Car
egiv
ers
utili
ze st
rate
gies
to
det
erm
ine
if th
e ch
ild is
full.
Usu
al p
ract
ice
or re
call
(yes
terd
ay)
Aga
in p
ossi
ble
bias
to
war
ds o
ver-
repo
rting
of g
ood
prac
tice
1. Is
you
r chi
ld a
ble
to fe
ed h
im/h
erse
lf?
2. If
not
, how
do
you
help
you
r chi
ld to
ea
t?
3. H
ow d
o yo
u kn
ow
that
you
r chi
ld is
hu
ngry
? 4.
How
do
you
know
if
your
chi
ld is
full?
5.
Are
ther
e w
ays t
o ch
eck
to m
ake
sure
th
at y
our c
hild
is fu
ll?6.
Wha
t do
you
do if
yo
ur c
hild
stop
s ea
ting
to m
ake
sure
th
at th
ey a
re fu
ll?
!
% o
f car
egiv
ers w
ho re
port
feed
ing
infa
nts 6
-12
mon
ths o
f age
dire
ctly
!
% o
f car
egiv
ers w
ho re
port
assi
stin
g ch
ildre
n 13
-23
mon
ths o
f age
in e
atin
g !
% o
f car
egiv
ers w
ho re
port
feed
ing
thei
r chi
ld w
hen
thei
r chi
ld a
sks f
or fo
od
!
% o
f car
egiv
ers w
ho re
port
at le
ast o
ne c
ue th
at th
eir
child
is h
ungr
y !
% o
f car
egiv
ers w
ho re
port
at le
ast o
ne c
ue th
at th
eir
child
is fu
ll !
% o
f car
egiv
ers w
ho re
port
at le
ast o
ne p
ositi
ve
stra
tegy
to te
st w
heth
er
thei
r chi
ld is
full
Feed
slow
ly
and
patie
ntly
Fe
ed sl
owly
and
pa
tient
ly a
nd e
ncou
rage
yo
ur c
hild
to e
at.
!
Car
egiv
er
know
s one
po
sitiv
e st
rate
gy
for t
each
ing
her
child
to e
at.
!
Car
egiv
er
know
s one
po
sitiv
e st
rate
gy
for e
ncou
ragi
ng
child
to e
at.
!
Car
egiv
er
repo
rts m
akin
g he
r chi
ld fi
nish
th
e pl
ate.
Usu
al p
ract
ice
or re
call
(yes
terd
ay)
Aga
in p
ossi
ble
bias
to
war
ds o
ver-
repo
rting
of g
ood
prac
tice
1. H
ow d
oes a
chi
ld
lear
n to
eat
? 2.
How
doe
s a c
hild
le
arn
to u
se u
tens
ils?
3. D
id y
ou te
ach
your
ch
ild h
ow to
eat
? 4.
If so
, in
wha
t w
ays?
5.
Do
you
enco
urag
e yo
ur c
hild
to e
at?
6. If
so, i
n w
hat
way
s?
!
% c
areg
iver
s who
repo
rt at
le
ast o
ne p
ositi
ve st
rate
gy
to te
ach
child
to e
at
!
% c
areg
iver
s who
repo
rt at
le
ast o
ne p
ositi
ve st
rate
gy
to e
ncou
rage
thei
r chi
ld to
ea
t !
% c
areg
iver
s who
don
�t m
ake
thei
r chi
ld fi
nish
th
eir p
late
!
% c
areg
iver
s who
off
er
�one
mor
e bi
te�
(c
ontin
ued)
29

Feed
ing
Prac
tice
Rec
omm
enda
tion/
G
uidi
ng P
rinc
iple
a
Chi
ld-le
vel
Info
rmat
ion
need
ed
Dat
a co
llect
ion
appr
oach
C
omm
ents
, iss
ues
to c
onsi
der
Exa
mpl
es o
f qu
estio
nsb
Popu
latio
n-le
vel i
ndic
ator
!
Car
egiv
er
repo
rts o
ffer
ing
the
child
�on
e m
ore
bite
.�
7. D
o yo
u m
ake
your
ch
ild e
at e
very
thin
g,
even
if th
ey a
ppea
r fu
ll be
fore
fini
shin
g?
8. If
you
r chi
ld se
ems
full,
do
you
offe
r th
em �
one
mor
e bi
te�?
H
andl
ing
food
ref
usal
U
tiliz
e va
rious
stra
tegi
es
if a
child
refu
ses f
ood.
!
Car
egiv
er
know
s one
po
sitiv
e st
rate
gy
for o
verc
omin
g fo
od re
fusa
l.
Usu
al p
ract
ice
or re
call
(yes
terd
ay)
Aga
in p
ossi
ble
bias
to
war
ds o
ver-
repo
rting
of g
ood
prac
tice
1. D
oes y
our c
hild
ev
er re
fuse
to e
at, o
r st
op e
atin
g be
fore
fin
ishi
ng e
very
thin
g on
thei
r pla
te?
2. If
so, w
hat d
o yo
u do
in re
spon
se?
!
% c
areg
iver
s who
repo
rt at
le
ast o
ne p
ositi
ve st
rate
gy
for o
verc
omin
g fo
od
refu
sal
Prot
ectiv
e en
viro
nmen
t fo
r fe
edin
g
Feed
chi
ld in
a p
rote
cted
en
viro
nmen
t. !
Car
egiv
er
iden
tifie
s a
cons
iste
nt a
dult
as c
areg
iver
for
feed
ing.
!
Car
egiv
er
repo
rts a
bac
kup
plan
whe
n th
e pr
imar
y ca
regi
ver i
s not
av
aila
ble.
!
Car
egiv
er
repo
rts w
heth
er
ther
e ar
e an
imal
s pre
sent
in
the
plac
e w
here
the
child
ea
ts.
!
Car
egiv
er
repo
rts w
heth
er
child
is fe
d fr
om a
sepa
rate
bo
wl.
Usu
al p
ract
ice
or re
call
(yes
terd
ay)
Aga
in p
ossi
ble
bias
to
war
ds o
ver-
repo
rting
of g
ood
prac
tice
1. W
ho g
ener
ally
fe
eds y
our c
hild
? 2.
How
old
is th
is
pers
on?
3. W
hat i
f tha
t per
son
is n
ot a
vaila
ble?
4.
Whe
re d
oes t
he
child
usu
ally
eat
? 5.
Are
ther
e an
imal
s ne
ar b
y?
6. D
oes y
our c
hild
ha
ve h
is/h
er o
wn
bow
l to
eat f
rom
? 7.
Do
you
sit d
own
with
you
r chi
ld w
hen
he/s
he is
eat
ing?
!
% c
hild
ren
fed
by a
co
nsis
tent
adu
lt ca
regi
ver
!
% c
areg
iver
s who
repo
rt a
back
up p
lan
for t
hat
care
give
r !
% c
areg
iver
s who
don
�t al
low
ani
mal
s in
the
area
w
here
the
child
eat
s !
% c
hild
ren
fed
with
se
para
te b
owl
!
% c
areg
iver
s who
repo
rt si
tting
dow
n w
ith th
eir
child
dur
ing
eatin
g
(con
tinue
d)
30
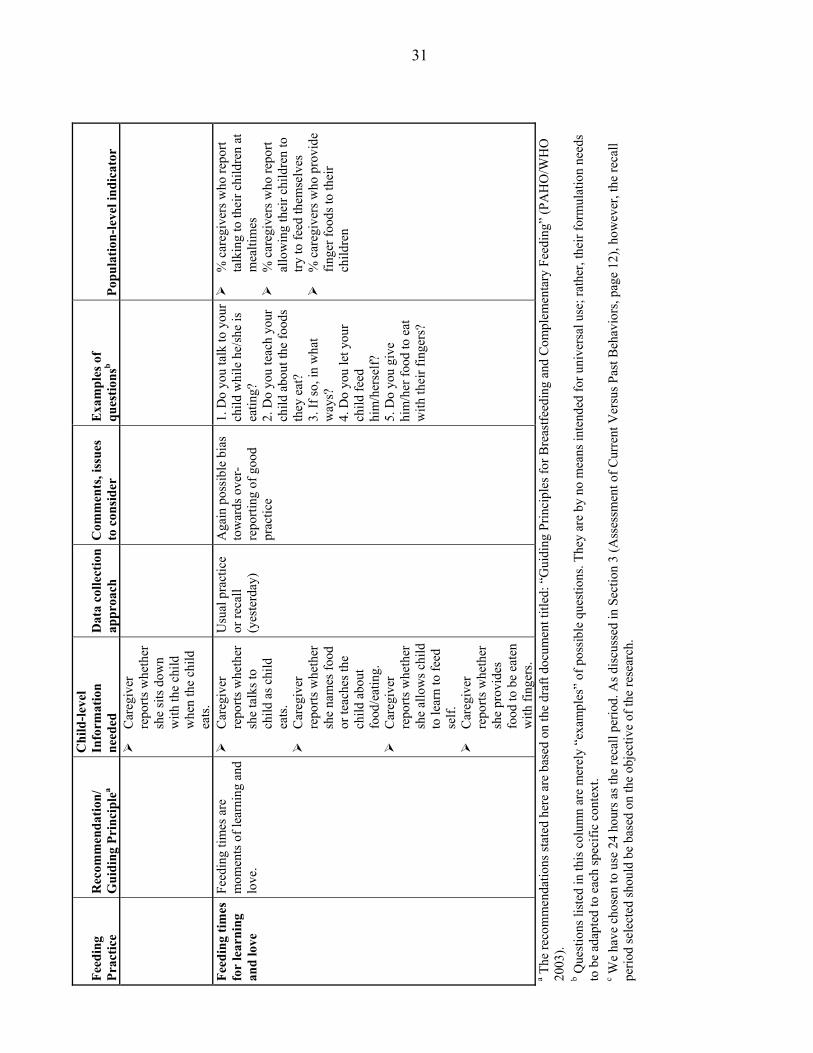
Feed
ing
Prac
tice
Rec
omm
enda
tion/
G
uidi
ng P
rinc
iple
a
Chi
ld-le
vel
Info
rmat
ion
need
ed
Dat
a co
llect
ion
appr
oach
C
omm
ents
, iss
ues
to c
onsi
der
Exa
mpl
es o
f qu
estio
nsb
Popu
latio
n-le
vel i
ndic
ator
!
Car
egiv
er
repo
rts w
heth
er
she
sits
dow
n w
ith th
e ch
ild
whe
n th
e ch
ild
eats
. Fe
edin
g tim
es
for
lear
ning
an
d lo
ve
Feed
ing
times
are
m
omen
ts o
f lea
rnin
g an
d lo
ve.
!
Car
egiv
er
repo
rts w
heth
er
she
talk
s to
child
as c
hild
ea
ts.
!
Car
egiv
er
repo
rts w
heth
er
she
nam
es fo
od
or te
ache
s the
ch
ild a
bout
fo
od/e
atin
g.
!
Car
egiv
er
repo
rts w
heth
er
she
allo
ws c
hild
to
lear
n to
feed
se
lf.
!
Car
egiv
er
repo
rts w
heth
er
she
prov
ides
fo
od to
be
eate
n w
ith fi
nger
s.
Usu
al p
ract
ice
or re
call
(yes
terd
ay)
Aga
in p
ossi
ble
bias
to
war
ds o
ver-
repo
rting
of g
ood
prac
tice
1. D
o yo
u ta
lk to
you
r ch
ild w
hile
he/
she
is
eatin
g?
2. D
o yo
u te
ach
your
ch
ild a
bout
the
food
s th
ey e
at?
3. If
so, i
n w
hat
way
s?
4. D
o yo
u le
t you
r ch
ild fe
ed
him
/her
self?
5.
Do
you
give
hi
m/h
er fo
od to
eat
w
ith th
eir f
inge
rs?
!
% c
areg
iver
s who
repo
rt ta
lkin
g to
thei
r chi
ldre
n at
m
ealti
mes
!
% c
areg
iver
s who
repo
rt al
low
ing
thei
r chi
ldre
n to
try
to fe
ed th
emse
lves
!
% c
areg
iver
s who
pro
vide
fin
ger f
oods
to th
eir
child
ren
a The
reco
mm
enda
tions
stat
ed h
ere
are
base
d on
the
draf
t doc
umen
t titl
ed: �
Gui
ding
Prin
cipl
es fo
r Bre
astfe
edin
g an
d C
ompl
emen
tary
Fee
ding
� (P
AH
O/W
HO
20
03).
b Que
stio
ns li
sted
in th
is c
olum
n ar
e m
erel
y �e
xam
ples
� of
pos
sible
que
stio
ns. T
hey
are
by n
o m
eans
inte
nded
for u
nive
rsal
use
; rat
her,
thei
r for
mul
atio
n ne
eds
to b
e ad
apte
d to
eac
h sp
ecifi
c co
ntex
t.
c We
have
cho
sen
to u
se 2
4 ho
urs a
s the
reca
ll pe
riod.
As d
iscu
ssed
in S
ectio
n 3
(Ass
essm
ent o
f Cur
rent
Ver
sus P
ast B
ehav
iors
, pag
e 12
), ho
wev
er, t
he re
call
perio
d se
lect
ed sh
ould
be
base
d on
the
obje
ctiv
e of
the
rese
arch
.
31
32
Breastfeeding
Information on breastfeeding is necessary to determine whether the child is still
receiving breast milk after six months of age and to estimate the quantity ingested. This
in turn is necessary to assess the amount of energy and nutrients that should be
contributed by complementary foods. Direct measurement of breast milk intake is
complex, even in exclusively breastfed children. Approaches such as isotopic techniques,
test-weighing, and analysis of nutrient composition of breast milk can be used in small
samples but are impractical for large-scale use. Thus, simpler methods based on maternal
recall have been widely used to determine whether mothers currently breastfeed their
children. The usual recall period is 24 hours, because in order to maintain breast milk,
mothers have to breastfeed regularly. Thus, if they have not breastfed the child in the
previous 24 hours, it is unlikely that the child is receiving a meaningful amount of
nutrients from breast milk.
Information on the intensity of breastfeeding can also be collected by recall, by
asking mothers the number of times they breastfed their child during the previous day and
night. In one study, the frequency of breastfeeding was highly correlated (r = 0.63) with
the volume of breast milk consumed (Brown et al. 1982). It may be useful to examine this
relation in other settings to determine whether sufficient homogeneity exists to allow for
an accurate and precise prediction of breast milk intake from the recall of breastfeeding
frequency that could be applied broadly. If not, context- or population-specific equations
to predict breast milk intake from breastfeeding frequency will have to be developed.
Assessing breastfeeding frequency by recall is sometimes difficult because
mothers are often unable to remember the number of times they breastfed their child
during the previous day and night. Many mothers report breastfeeding as often as the
child wants, implying that they breastfeed �on demand.� Although highly desirable and
reflecting responsive feeding and caregiving, �on-demand� breastfeeding is difficult to
quantify. This is particularly problematic, because the number of times children of the
same age request to be breastfed may vary widely; therefore �on demand� does not
33
provide sufficient information about breastfeeding frequency. Thus, even developing a
cultural definition of �on-demand feeding,� or estimating the distribution of feeding
frequency by the child�s age among women who report feeding on demand is unlikely to
provide the information needed regarding breast milk volume or energy intake.
Therefore, it is recommended that when women characterize their breastfeeding
frequency as being �on demand�, a second-level question be introduced to assess how
frequently the particular infant/child asks for the breast.
In summary, indicators to assess breastfeeding during the period of
complementary feeding should focus on whether breastfeeding is continued through at
least 23 months, and whether more than a minimal or token amount of breast milk is
offered to the child to confirm that there is some nutritional value in the continued
breastfeeding. Information on breastfeeding frequency should also be gathered in order to
get at least a rough estimate of breast milk intake, for example, to be able to assess
whether breast milk intake is likely to be low, average or high.
Breastfeeding indicators can be defined to include the entire age range (6�23
months) or specific age groups of interest, depending on the usual age of termination of
breastfeeding. For example, if breastfeeding declines markedly around 12 months of age
in a given population, it may be appropriate to use an indicator that includes children
between say, 9 and 15 months. An important aspect that also needs to be considered in
selecting appropriate age ranges for this indicator is sample size. In surveys that include
all children under the ages of two or three years, it is possible that the number of children
within three- or six-month intervals is relatively small (say, under 100), which may lead
to imprecise estimates (i.e., large confidence intervals around the estimate). This, in turn,
reduces the ability of the indicator to detect differences or changes over time (especially
if they are small), and therefore reduces the usefulness of the indicator for monitoring and
evaluation or for comparison purposes. It is thus important to take into consideration
sample size issues when selecting age groups for specific indicators.
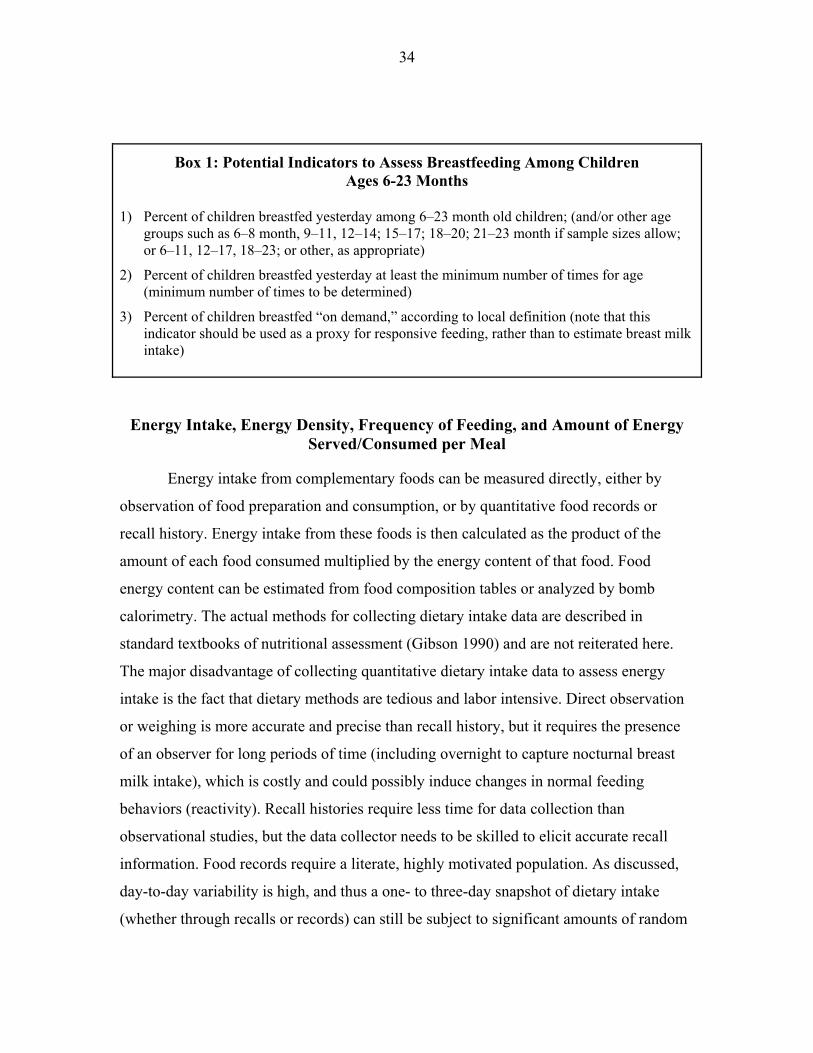
34
Box 1: Potential Indicators to Assess Breastfeeding Among Children Ages 6-23 Months
1) Percent of children breastfed yesterday among 6�23 month old children; (and/or other age
groups such as 6�8 month, 9�11, 12�14; 15�17; 18�20; 21�23 month if sample sizes allow; or 6�11, 12�17, 18�23; or other, as appropriate)
2) Percent of children breastfed yesterday at least the minimum number of times for age (minimum number of times to be determined)
3) Percent of children breastfed �on demand,� according to local definition (note that this indicator should be used as a proxy for responsive feeding, rather than to estimate breast milk intake)
Energy Intake, Energy Density, Frequency of Feeding, and Amount of Energy Served/Consumed per Meal
Energy intake from complementary foods can be measured directly, either by
observation of food preparation and consumption, or by quantitative food records or
recall history. Energy intake from these foods is then calculated as the product of the
amount of each food consumed multiplied by the energy content of that food. Food
energy content can be estimated from food composition tables or analyzed by bomb
calorimetry. The actual methods for collecting dietary intake data are described in
standard textbooks of nutritional assessment (Gibson 1990) and are not reiterated here.
The major disadvantage of collecting quantitative dietary intake data to assess energy
intake is the fact that dietary methods are tedious and labor intensive. Direct observation
or weighing is more accurate and precise than recall history, but it requires the presence
of an observer for long periods of time (including overnight to capture nocturnal breast
milk intake), which is costly and could possibly induce changes in normal feeding
behaviors (reactivity). Recall histories require less time for data collection than
observational studies, but the data collector needs to be skilled to elicit accurate recall
information. Food records require a literate, highly motivated population. As discussed,
day-to-day variability is high, and thus a one- to three-day snapshot of dietary intake
(whether through recalls or records) can still be subject to significant amounts of random
35
error. However, when estimating dietary intakes at the population level, specific
techniques can be used to infer the distribution of true usual intakes. Such calibration
techniques are widely used in national nutrition surveys such as the NHANES in the
United States. A literature on the best means of collecting the required information for
calibration is developing rapidly (Willett 1998b; Willett 1998a; Institute of Medicine
2000).
If food intake is not measured directly, energy intake from complementary foods
can be estimated by using proxy measures for the three interrelated factors that contribute
to energy intake: (1) the average energy density of complementary foods, (2) the
frequency of feeding, and (3) the amount of food consumed during each feeding episode.
As already described, these three factors need to be taken into consideration
simultaneously, and �optimal� behaviors can only be defined locally depending on the
relationships among these three factors. Because the amount of food consumed is likely
to be measured imprecisely in most large survey or program contexts, the following
sections propose methodologies to assess energy density and feeding frequency;
however, they do not focus on estimating quantities.
It is important to recognize that in the absence of information on one of the three
aspects that determine energy intake (in this case amount consumed), the information
derived from the other two indicators will be useful only at the population level. For
example, an individual child cannot be classified as having appropriate energy intake
based on the fact that he/she is being fed a diet of appropriate energy density the
recommended number of times. Without information on the amount consumed, the
adequacy of the child�s energy intake remains unknown. At the population level,
however, it is still useful to assess the percentage of children who are fed less frequently
than the minimum recommended times and to determine whether the energy density of
complementary foods is generally above the minimum 0.8 kcal/g.

36
Group Recipe Trials to Assess Average Energy Density of Main Sources of Energy
This section describes a method to assess the average energy density of the main
sources of energy in children�s diet at different ages. It is based on the assumption that
infants and young children receive the bulk of their energy from one or two foods�
usually a cereal- or tuber-based porridge. It is therefore particularly important to assess
the distribution of energy density of these main foods when detailed quantitative dietary
intake data is not available.
The method consists of gathering information on recipes and preparation methods
used to prepare complementary foods for infants and young children. This can be done in
a variety of communities or regions, which then allows the derivation of a community-
level average energy density.
Group recipe trials�or participatory cooking sessions conducted with small
groups of caregivers�have been used successfully in a number of contexts to gather
information on the main complementary foods and to develop improved recipes based on
locally available ingredients (Dickin, Griffiths, and Piwoz 1997; Piwoz 1994; Kanashiro
et al. 1991; Bentley et al. 1991a). A recent experience in Haiti showed that the trials were
useful to gather information about the types of complementary foods usually prepared
and served to infants and young children at different ages, and to inform about specific
preparation methods and ingredients used. All ingredients and the final amounts of the
food prepared could also be weighed during the trials so that the energy and nutrient
composition could be quantified (Menon et al. 2002).
As indicated earlier, the method is based on the assumption that infants derive
most of their energy from one or a few complementary foods. This is likely to be true for
infants up to 12 to 15 months of age�but not much beyond�as in most cultures children
start consuming the family diet early in their second year of life. Although this is a
potential limitation of the approach, the 6�12 month period is clearly the age interval of
most concern regarding energy density. Once children have transitioned to the family
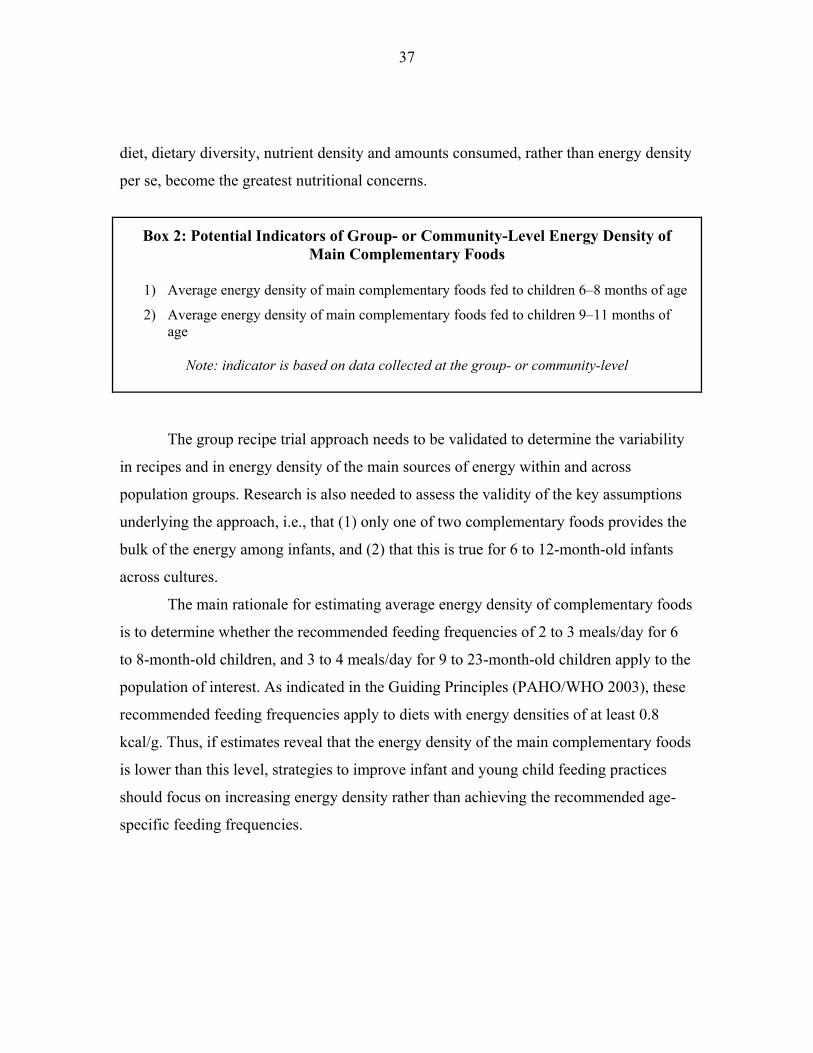
37
diet, dietary diversity, nutrient density and amounts consumed, rather than energy density
per se, become the greatest nutritional concerns.
Box 2: Potential Indicators of Group- or Community-Level Energy Density of Main Complementary Foods
1) Average energy density of main complementary foods fed to children 6�8 months of age
2) Average energy density of main complementary foods fed to children 9�11 months of age
Note: indicator is based on data collected at the group- or community-level
The group recipe trial approach needs to be validated to determine the variability
in recipes and in energy density of the main sources of energy within and across
population groups. Research is also needed to assess the validity of the key assumptions
underlying the approach, i.e., that (1) only one of two complementary foods provides the
bulk of the energy among infants, and (2) that this is true for 6 to 12-month-old infants
across cultures.
The main rationale for estimating average energy density of complementary foods
is to determine whether the recommended feeding frequencies of 2 to 3 meals/day for 6
to 8-month-old children, and 3 to 4 meals/day for 9 to 23-month-old children apply to the
population of interest. As indicated in the Guiding Principles (PAHO/WHO 2003), these
recommended feeding frequencies apply to diets with energy densities of at least 0.8
kcal/g. Thus, if estimates reveal that the energy density of the main complementary foods
is lower than this level, strategies to improve infant and young child feeding practices
should focus on increasing energy density rather than achieving the recommended age-
specific feeding frequencies.
38
Measurement or Estimation of Feeding Frequency, Including Snacks
Measuring feeding episodes and distinguishing between meals and snacks are
challenging. It is first necessary to define what is meant by a feeding episode. In fact, this
definition may be somewhat arbitrary, particularly with regard to young children, who
may eat small amounts of food, fall asleep or get distracted, and then resume eating�the
same or other foods�a short while later. It is not certain whether this example should be
considered a single feeding episode or more than one. Because of this uncertainty, some
investigators arbitrarily define a feeding episode as any food consumption separated by
previous food consumption by a fixed amount of time, such as 10 minutes or a half hour.
Distinguishing between meals and snacks is equally challenging, and the
definitions may vary across settings. It is not known whether there is any nutritional
significance in making this distinction, except that given gastric capacity and energy
density concerns, young children need to be fed more frequently than the typical family
meal pattern in many cultures; and if snacks are provided (extra opportunities to eat), it is
more likely that a child�s energy intake will be met. Perhaps more important to consider
is that querying the caregiver regarding both meals and snacks may lead to a more precise
estimate of dietary intakes.
Any of the quantitative methods of measuring dietary intake (whether by direct
observation, food records, or recall history) can be used to collect information on feeding
frequency, so long as either the times when feeding episodes start and end are recorded or
a specific rule set is established to identify separate feeding episode. However, since
feeding frequency is to be used as an alternative indicator when detailed quantitative
information is not available, a simpler approach to measuring feeding frequency is
required. The approach can be as simple as asking the caregiver to recall the number of
meals and snacks provided to the child during the previous 24 hours, or it may involve a
set or questions and probes to help caregivers recall the feeding events of the previous
day. If a simple question is asked, prior qualitative work and pretesting of the question is

39
required to derive local definitions of meals and snacks and to ensure that the question is
understood properly.
Box 3: Potential Indicators to Assess Frequency of Feeding Complementary Foods Among Children Ages 6�23 Months
1) Percentage of children ages 6�8 months fed complementary foods at least two times/day 2) Percentage of children ages 9�11 months fed complementary foods at least three
times/day 3) Percentage of children ages 12�23 months fed complementary foods at least three
times/day 4) Percentage of children ages 6�23 months fed at least one snack in previous 24 hours
Note: These indicators should be used only if average energy density of the diet is ≥ 0.8 kcal/g.
Nutrient Density�Dietary Quality
Nutrient density refers to the amount of nutrients present in foods or mixed diets
in relation to their energy content. The approach taken in recent work (Dewey and Brown
2003; Brown, Dewey, and Allen 1998) to estimate whether age-specific nutrient
requirements could be met from breast milk and complementary foods was to examine
the nutrient density of the usual diet of the child. In this approach, one calculates the
amount of each micronutrient per unit of energy intake (e.g., mg/100 kcal) in the usual
diet, and uses this information in combination with the energy requirements of the target
population to consider whether micronutrient needs will be met with the usual dietary
pattern and/or with optimal energy intakes (if energy is limiting in the diet). This
approach is appropriate to derive this type of information, but again, it is likely to be of
limited use for the purpose of large-scale assessments because it requires detailed
quantitative information on the usual dietary intakes of infants and young children.
Moreover, for some nutrients like vitamin A, additional information would be required to
address issues of seasonality of intake.

40
Another approach that has been used extensively, and particularly so for the
assessment of vitamin A intake, is the use of food frequency questionnaires. This method
is based on the careful selection of a number of different foods, based on their ability to
accurately predict the adequacy of intake of a particular nutrient at the population level
(Sanjur 1982; Helen Keller International 1994). The list of pre-selected foods is usually
drawn from validation studies in which quantitative dietary recalls or records are used to
identify the main sources of a particular micronutrient in the usual diet of the population
studied. This type of food frequency questionnaire has been adapted to a variety of
contexts for the assessment of vitamin A intake, but it has not been applied
internationally to examine the adequacy of usual nutrient intakes in young children.
Finally, an even more simplified version of this approach is to use a food or food-
group dietary diversity questionnaire. Although only a few validation studies have been
carried out to date in developing countries, the results are consistent in showing a strong
association between food group dietary diversity and nutrient adequacy for a number of
nutrients (Hatløy, Torheim, and Oshaug 1998; Ogle, Hung, and Tuyet 2001; Onyango,
Koski, and Tucker 1998). In Guatemala, greater food diversity among infants aged 9�11
months was associated with higher intake of energy, protein, fat, and all the vitamins and
minerals examined, although it was not associated with greater nutrient density (as
percentage of energy) (Brown et al. 2002). By contrast, infants who obtained a larger
percentage of their energy from animal source foods (ASF) had a significantly greater
intake of energy and nutrients, as well as a greater nutrient density for a number of
nutrients. Thus, in this population, increased dietary diversity was associated with greater
intake of energy and nutrients, but it did not enhance the nutritional quality of the diet,
whereas higher intake of ASF was associated with both greater nutrient intake and dietary
quality.
The well-documented contribution of ASF to nutrient adequacy is now reflected
in the new Dietary Guidelines, which recommend that infants be fed meat, poultry, fish,
or eggs daily, or as often as possible (PAHO/WHO 2003). Recent research also suggests
that not only should ASF be consumed regularly to ensure adequate daily intake of

41
certain key nutrients such as iron and zinc, but they also need to be consumed in
relatively large amounts (Darmon, Ferguson, and Briend 2002; Brown et al. 2002). More
research is needed to determine the minimal amounts of different types of ASF required
at different ages to prevent nutrient deficiencies. Dairy products also contribute
significant amounts of certain nutrients, such as calcium, and there is a suggestion they
have a growth enhancing effect, even among breastfed children (Grillenberger et al.
2002; Ruel 2003).
Vitamin A-rich fruits and vegetables are also recommended daily because of the
recognized importance of preventing vitamin A deficiency. These foods also contribute
other essential nutrients.
Finally, other potentially important sources of micronutrients include fortified
processed complementary foods or other available fortified foods, as well as
supplements.
Thus, in defining proxy indicators for nutrient adequacy, it is important to include
both indicators of overall dietary diversity and indicators of intake of specific foods or
food groups known to contribute significant amounts of specific nutrients in a given
population. These include locally available ASF, dairy products, vitamin A-rich fruits and
vegetables, and fortified processed complementary foods. Intake of iodized salt or of
other vitamin A-, iron-, or multiple micronutrient-fortified products should also be
assessed. This will require prior identification of these products through qualitative work
and an assessment of the availability of the products in local markets. Intake of
micronutrient supplements, especially vitamin A and iron should also be assessed.
A list of potential diversity-type indicators that can be used to assess nutrient
adequacy is provided in the box below. For the overall dietary diversity indicator, either
the number of foods or food groups consumed over a given reference period can be used.
Note, however, that in the absence of universal standards for �optimal� number of foods
or food groups, sample-specific cutoff points are needed to create meaningful categories
of dietary diversity (e.g., low, average, high). Sample- and age-specific terciles have been

42
used successfully for this purpose in a number of studies (Ogle, Hung, and Tuyet 2001;
Brown et al. 2002); Arimond and Ruel 2003).
Box 4: Potential Indicators to Assess Nutrient Adequacy of Complementary Foods and Supplements Among Children Ages 6�23 Months
1) Percentage of children ages 6�23 months who consumed animal products
2) Percentage of children ages 6�23 months who consumed dairy products
3) Percentage of children ages 6�23 months who consumed vitamin A-rich fruits or vegetables
4) Percentage of children ages 6�23 months who consumed fortified products (indicators should be developed for each type of fortified product, e.g., iodized salt, vitamin-A fortified sugar, iron-fortified flour, micronutrient-fortified processed CF, etc.
5) Mean number of foods (or food groups) consumed by children
6) Percentage of children ages 6�23 months with low, average, or high dietary diversity for this sample (sample- and age-specific terciles of dietary diversity can be derived from data on the mean number of foods [or food groups] consumed [indicator 5]).
7) Percentage of children ages 6�23 months who received iron supplements (in past month, for example�specify type); vitamin-A supplementation (in past six months); iodized oil; or other micronutrient supplements
Note 1: All these indicators can be derived from either a 24-hour recall or another preselected reference period; all can also be computed for children aged 6�23 months or for specific age
groups of interest.
Note 2: Specific, locally available foods consumed in sufficient (to be defined) amounts need to be identified with prior qualitative work; available fortified products also need to be identified prior
to developing indicator 4.
Note that the indicators proposed below are purposely defined in general terms.
They will need to be adapted locally to include specific examples of available foods.
Specific foods such as liver, eggs, or mangoes, for example, may be singled out if they
are available and likely to contribute significantly to young children�s nutrient intakes.
Foods, however, should be selected based not only on their nutrient density, but on their
frequency of use and on the amounts usually consumed. Foods like fish flour, for

43
example, are commonly used in the preparation of gruels for infants and young children
in some African countries, but they are often used in minute amounts�as condiments�
and are unlikely to contribute significant amounts of nutrients to children�s diets. It is
therefore necessary to identify these foods through prior qualitative inquiry and to set
exclusion criteria for foods consumed in token amounts.
Appropriate Consistency of Main Complementary Foods for Age of the Child
The precise consistency of complementary foods is difficult to assess in survey
contexts. However, some simple assessment can be made of whether the usual porridges
or other main sources of energy in the child�s diet tend to be very thick or very liquid. For
most purposes here, it will likely be sufficient to assess the general consistency of
complementary foods at the group or population level (for children of different ages), and
this could be done through the group recipe trials and/or other qualitative research
methods. Another issue relates to whether or not the texture of the foods offered is
appropriate for young infants with poorly developed chewing skills.
Safe Preparation and Storage of Complementary Foods
Experience with the measurement of hygiene practices abounds. As indicated in
Section 3, recall methods to assess hygiene practices are generally not recommended
because they tend to overestimate the prevalence of good practices. Observational
methods are considered the method of choice for measuring hygiene practices, but they
are not practical for measuring specific activities such as food preparation and feeding,
because the observer needs to be present exactly at the time when these activities take
place. Structured observations are also time- and resource-intensive, so simpler and faster
methods are required for wider use. The spot check observation method described earlier
is likely to be useful to assess general hygiene of the house or compound and to
characterize the cleanliness of specific individuals (e.g., child caregiver). This method,
however, is not appropriate to assess hygiene during food preparation and feeding,

44
because this would require direct observation of meal preparation and consumption,
which is impractical. Further, such methods do not deal with the inherent within-subject
variability in these behaviors; this point, however, does not negate their usefulness for
population-level inferences.
With these limitations in mind, we have identified a series of potential indicators
based on caregiver recall that can be used to assess the hygiene practices related to food
preparation and child feeding included in the Guiding Principles (PAHO/WHO 2003).
These include indicators for the following aspects: (1) hand washing; (2) safe food
storage; (3) clean utensils to prepare and serve foods; (4) clean cups and bowls for
feeding children; and (5) avoidance of feeding bottles. We also include an indicator for
safe water use.
For the use of baby bottles, the existing WHO indicator (WHO 1991) can be
applied. This indicator is based on the proportion of infants under 12 months of age who
are receiving any food or drink from a bottle in the previous 24 hours. Indicators based
on longer recall periods (e.g., seven days, previous month, or even since birth) could also
be tested, because it is possible that even though bottle feeding does not occur every day,
it can still increase the risk of infections in young infants.
Note that the recommendations concerning the ideal temperature for storage and
re-warming of food before consumption cannot be measured by recall. Thus, the
measurement of this aspect of the recommendations can only be done through imperfect
proxies that estimate whether the food is reheated and/or consumed warm.
The importance of carefully designed survey instruments cannot be
overemphasized for the collection of information on hygiene practices, which are highly
subject to overreporting of good practices. Methods should be developed that will prevent
providing clear leads to respondents of the expected answer. For example, asking a
caregiver whether she washes her child�s plate before feeding him/her is likely to elicit a
positive response. However, the question can be asked in a more general, and less leading
way, such as asking when the caregiver washed her child�s plate yesterday, or how many
times the caregiver wash it during the past 24 hours? A follow-up question at some other
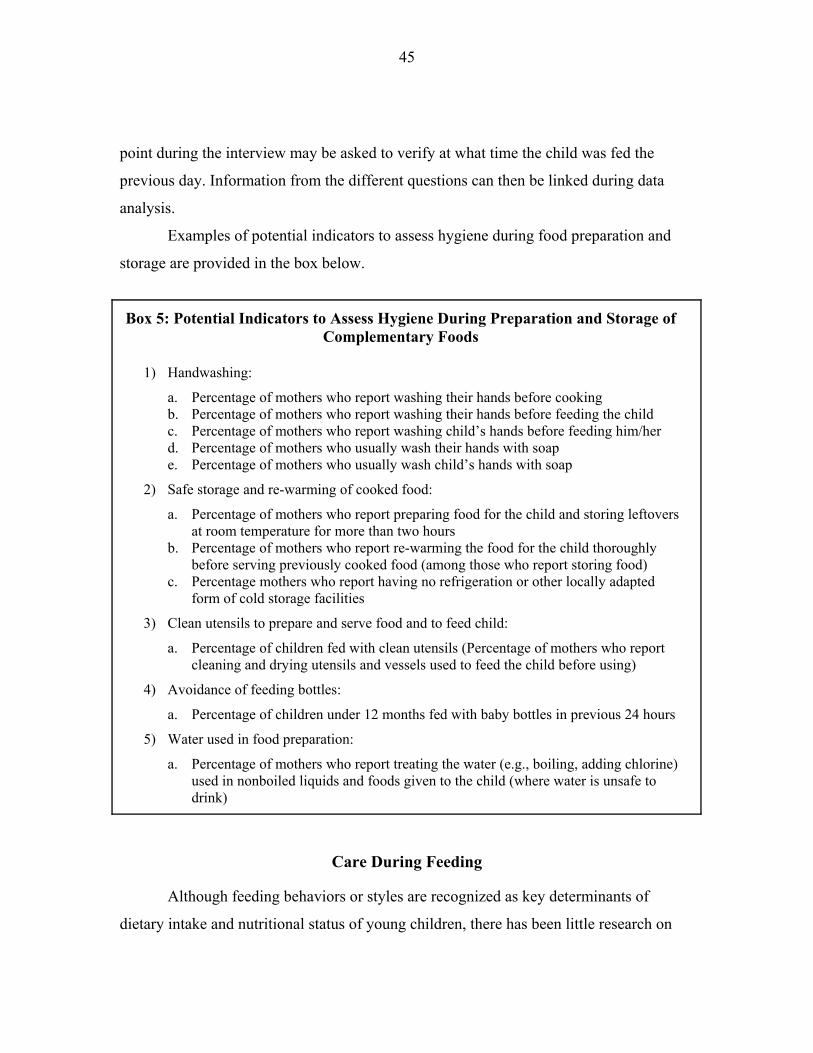
45
point during the interview may be asked to verify at what time the child was fed the
previous day. Information from the different questions can then be linked during data
analysis.
Examples of potential indicators to assess hygiene during food preparation and
storage are provided in the box below.
Box 5: Potential Indicators to Assess Hygiene During Preparation and Storage of Complementary Foods
1) Handwashing:
a. Percentage of mothers who report washing their hands before cooking b. Percentage of mothers who report washing their hands before feeding the child c. Percentage of mothers who report washing child�s hands before feeding him/her d. Percentage of mothers who usually wash their hands with soap e. Percentage of mothers who usually wash child�s hands with soap
2) Safe storage and re-warming of cooked food:
a. Percentage of mothers who report preparing food for the child and storing leftovers at room temperature for more than two hours
b. Percentage of mothers who report re-warming the food for the child thoroughly before serving previously cooked food (among those who report storing food)
c. Percentage mothers who report having no refrigeration or other locally adapted form of cold storage facilities
3) Clean utensils to prepare and serve food and to feed child:
a. Percentage of children fed with clean utensils (Percentage of mothers who report cleaning and drying utensils and vessels used to feed the child before using)
4) Avoidance of feeding bottles:
a. Percentage of children under 12 months fed with baby bottles in previous 24 hours
5) Water used in food preparation:
a. Percentage of mothers who report treating the water (e.g., boiling, adding chlorine) used in nonboiled liquids and foods given to the child (where water is unsafe to drink)
Care During Feeding
Although feeding behaviors or styles are recognized as key determinants of
dietary intake and nutritional status of young children, there has been little research on

46
the development of indicators to capture various aspects of feeding behaviors.
International research on feeding behaviors has relied on qualitative methods or on
structured observations of caregiver-child interactions during feeding in natural (home)
settings. As is true for observational methods to quantify dietary intake or to characterize
hygiene behaviors, observations of feeding behaviors or style would be labor intensive
and probably not amenable to use for large population assessment, monitoring and
program evaluation. Alternatively, one could query caregivers about usual feeding
behaviors or about parenting theories that underlie feeding behaviors. For example, Birch
has developed a Child Feeding Questionnaire (Birch et al. 2001) to assess the extent to
which caregivers accept or reject parenting theories that support a controlled style of
feeding, and this tool has been applied in studies in the U.S. to examine risk of obesity in
young children (Spruijt-Metz et al. 2002). Similar tools to characterize laissez-faire or
responsive feeding are not currently available.
From the standpoint of simplicity, the development of valid and reliable
questionnaires to assess feeding style�or parenting theories that lead to them�would be
optimal for monitoring and evaluation. This is a key gap in indicator development, and
resources should be devoted to determine the contribution of optimal feeding behaviors to
dietary intakes, growth and development in children, and to develop appropriate
indicators for monitoring and evaluation of such behaviors in the programmatic context.
Presented below are two proposed formulations for indicator development in this area. In
the first, indicators to characterize feeding behaviors or styles are presented, and in the
second, indicators to characterize psychosocial care as it relates to feeding are presented.
As noted, these lists are not mutually exclusive.
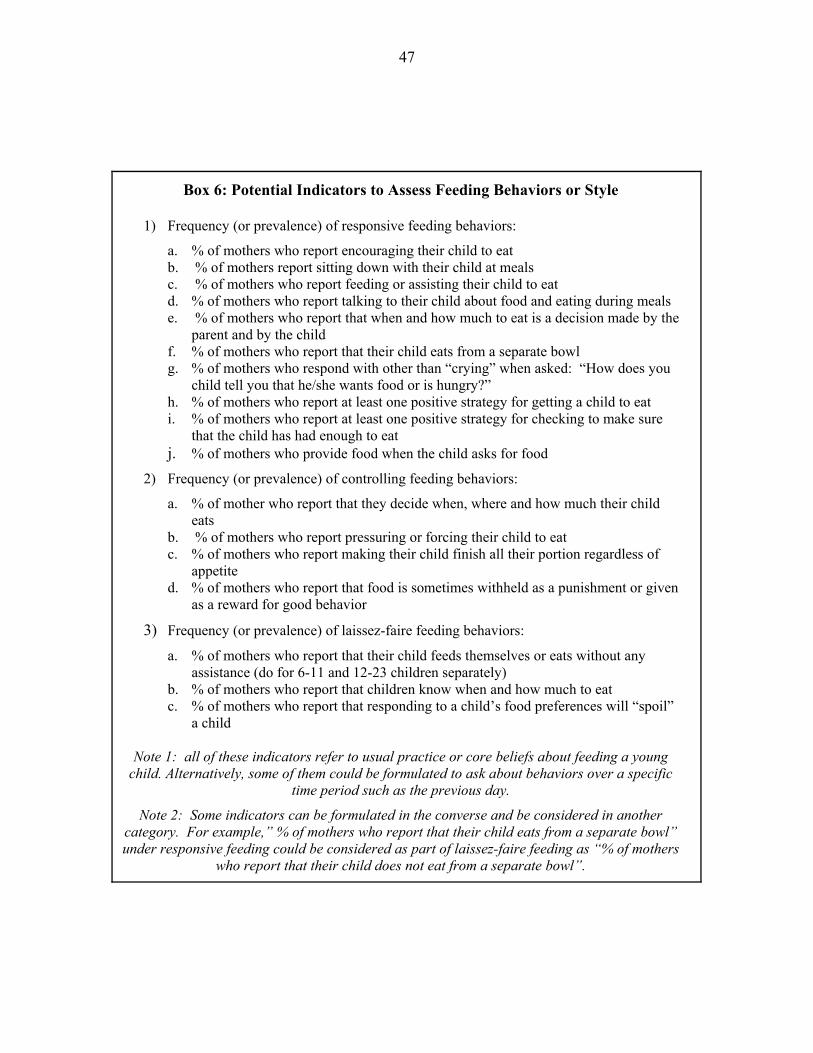
47
Box 6: Potential Indicators to Assess Feeding Behaviors or Style
1) Frequency (or prevalence) of responsive feeding behaviors:
a. % of mothers who report encouraging their child to eat b. % of mothers report sitting down with their child at meals c. % of mothers who report feeding or assisting their child to eat d. % of mothers who report talking to their child about food and eating during meals e. % of mothers who report that when and how much to eat is a decision made by the
parent and by the child f. % of mothers who report that their child eats from a separate bowl g. % of mothers who respond with other than �crying� when asked: �How does you
child tell you that he/she wants food or is hungry?� h. % of mothers who report at least one positive strategy for getting a child to eat i. % of mothers who report at least one positive strategy for checking to make sure
that the child has had enough to eat j. % of mothers who provide food when the child asks for food
2) Frequency (or prevalence) of controlling feeding behaviors:
a. % of mother who report that they decide when, where and how much their child eats
b. % of mothers who report pressuring or forcing their child to eat c. % of mothers who report making their child finish all their portion regardless of
appetite d. % of mothers who report that food is sometimes withheld as a punishment or given
as a reward for good behavior
3) Frequency (or prevalence) of laissez-faire feeding behaviors:
a. % of mothers who report that their child feeds themselves or eats without any assistance (do for 6-11 and 12-23 children separately)
b. % of mothers who report that children know when and how much to eat c. % of mothers who report that responding to a child�s food preferences will �spoil�
a child
Note 1: all of these indicators refer to usual practice or core beliefs about feeding a young child. Alternatively, some of them could be formulated to ask about behaviors over a specific
time period such as the previous day.
Note 2: Some indicators can be formulated in the converse and be considered in another category. For example,� % of mothers who report that their child eats from a separate bowl� under responsive feeding could be considered as part of laissez-faire feeding as �% of mothers
who report that their child does not eat from a separate bowl�.

48
Box 7: Potential Indicators for Psychosocial Care During Feeding
1) Feed infants directly and assist older children, being sensitive to hunger and satiety cues:
a. % of mothers who report feeding infants 6-11 months of age directly b. % of mothers who report assisting children 12-23 months of age in eating c. % of mothers who report feeding their child when their child asks for food d. % of mothers who report at least one cue that their child is hungry e. % of mothers who report at least one cue that their child is full f. % of mothers who report at least one positive strategy to test whether their child is
full
2) Feed slowly and patiently, encouraging the child to eat:
a. % of mothers who report at least one positive strategy to teach their child to eat b. % of mothers who report at least one positive strategy to encourage their child to eat c. % of mothers who report making their child finish their plate d. % of mothers who report �offering one more bite� when their child appears full
3) Utilize various strategies if a child refuses food:
a. % of mothers who report at least one positive strategy in response to a child refusing food
4) Feed in a protective environment:
a. % of mothers who report that their child is usually fed by a consistent �adult� caregiver
b. % of mothers who can respond as to what happens when the principle caregiver is away
c. % of mothers who report that animals are present in the area where the child eats d. % of mothers who report that child eats from a separate bowl e. % of mothers report sitting down with their child at meals
5) Feeding times are period of learning and love:
a. % of mothers who report talking to their child about food and eating during meals b. % of mothers who report allowing their children to try to feed themselves c. % of mothers who report giving their children �finger foods�
Note 1: all of these indicators refer to usual practice or core beliefs about feeding a young child. Alternatively, some of them could be formulated to ask about behaviors over a specific time
period such as the previous day.
Note 2: Some indicators can be formulated in the converse and be considered in another category. For example, �% of mothers who report that their child eats from a separate bowl� under responsive feeding could be considered as part of laissez-faire feeding as �% of mothers
who report that their child does not eat from a separate bowl.�

49
6. Research and Indicator Validation Priorities
This section summarizes the recommendations of this report regarding the
indicators for the measurement of different aspects of complementary feeding practices
and highlights research priorities to validate these indicators.
Continued Breastfeeding
! Current breastfeeding status: Simple recall methods to collect data on current
breastfeeding status have been widely used and seem to provide reliable and
precise estimates. It is recommended to use a 24-hour reference period to ensure
that the mother breastfeeds regularly, and thus is more likely to have an adequate
supply of breast milk.
! Breastfeeding frequency: Information on breastfeeding frequency is usually
collected by recall by asking mothers the number of times she has put the child to
the breast in the previous 24 hours. Validation studies to assess the usefulness of
recall information on breastfeeding frequency should be designed according to the
purpose for which the indicator is to be used.
o If the purpose is to determine whether breast milk provides a minimum
amount of nutrients to children at different ages, the association between
breastfeeding frequency and total breast milk intake and composition should
be tested using appropriate methods to collect data on breast milk intake and
nutrient composition.
o If the purpose is to determine whether breastfeeding is on demand, or
responds to the child�s needs, observational studies should be carried out to
determine what �on demand� means in a particular context and to assess the
average number of times children of different ages who are breastfed on
demand are actually put to the breast over a 24-hour period.
Research and validation studies are needed to determine whether or not
the information on breastfeeding frequency that is currently being collected in

50
many studies around the world (in all nationally-representative DHS surveys, for
example) is useful at least to accurately differentiate between children who have
low vs. high breast milk intake. Validation studies should also be undertaken to
assess the accuracy of recall methods compared to observational approaches.
Energy Intake From Complementary Foods
! The optimal approach to measuring energy and nutrients from complementary
foods is quantitative dietary assessment. When individual intakes are to be
estimated, the number of days of recall should be selected based on information
on usual day-to-day variability for each nutrient of interest. For population
assessments, however, the 24-hour recall approach is usually appropriate, and
specific techniques have been developed to correct for the distribution of true
usual intakes at the population level (Willett 1998b;Willett 1998a; Institute of
Medicine 2000).
! When quantitative dietary intake data at the individual level is not available,
information on energy density of the main sources of energy, combined with
amount usually consumed and frequency of feeding can be used to estimate,
indirectly, the adequacy of energy intake from these complementary foods at the
population level. This report addressed measurement approaches and indicators
only for two of these factors (energy density and frequency of feeding) because
measuring amounts through the use of simple tools appeared likely to provide
inaccurate assessments, and thus to be of little use.
! Energy density: In Section 5, we recommend a simple approach using group
recipe trials to assess average energy density of main complementary foods at the
population level. The method needs to be validated by assessing the variability in
recipes and in energy density of the main sources of energy within and across
population groups. This will help determine the sample sizes required to obtain
51
precise estimates of average energy density of complementary foods in different
contexts.
The method also needs to be validated in different contexts and for
different age groups. It is possible that our main assumption�that infants receive
most of their energy from a few key complementary foods�holds mainly for
infants in their first year, and that it is not valid in most contexts for children in
their second year of life. In many cultures, children start consuming the family
diet as early as 12�15 months of age. It may be much more difficult to assess
average energy density of the diet in such cases. However, as indicated before, the
key nutritional concern of children who consume the family diet is likely to be the
low micronutrient density and insufficient amounts consumed rather than energy
density.
As noted in Section 5, the method proposed to assess average energy
density of the diet is also likely to result in significant levels of misclassification
of individual children, and thus the sources and magnitude of the misclassification
should be assessed to determine whether the levels of error are acceptable, even
for population estimates. Specifically, misclassification from individual variations
in breast milk energy intake, from differences in recipes and preparation methods
for main complementary foods, which in turn affect average energy density of the
diet, and variations in quantities consumed by individual children should be
assessed.
! Feeding frequency: Recall methods to assess feeding frequency should be
validated against observations. In addition, recall methods based on a simple
question should be compared with a more step-by-step approach that asks a series
of questions to help caregivers recall feeding episodes during the previous day.
The nutritional contribution of snacks in the diets of infants and young children at
different ages also needs to be better understood. In some cultures they may be
important sources of energy, while in others they may contribute mainly to
micronutrient intakes. Research should be undertaken to test the validity of

52
various recall-based methods in assessing meal frequency and in differentiating
between meals and snacks, compared to observational methods.
Nutrient Density of Complementary Foods
! The simplest tool identified to assess micronutrient intake is the measurement of
dietary diversity, defined as the number of foods or food groups consumed over a
reference period. Considerably more research is needed, however, to assess the
usefulness of dietary diversity indicators to predict intake of a variety of essential
nutrients.
! A number of methodological aspects also need to be addressed in developing and
validating dietary diversity indicators. These include the classification systems for
foods and food groups, the reference period for the recall, the scoring system and
the cutoff points to define low and high diversity, and the inclusion/exclusion
criteria (based on amounts) for different foods (Ruel 2002). More research is
needed to determine whether all dietary diversity indicators and their cutoff points
have to be defined locally, or whether a more �universal� approach to the
selection of food groups (as used in the DHS) would be suitable at least for some
purposes. The advantage of using standard food groups is the possibility of
making comparisons between studies carried out in different populations,
countries, or regions. The same is true for cutoff points. It is unclear at this time,
however, whether it will be possible with additional validation studies to identify
food groups (and possibly cutoff points) that can be universally meaningful to
characterize dietary diversity in populations with widely different dietary patterns.
For instance, is there a number of food groups below which all children will be at
higher risk of not meeting their nutrient requirements for most nutrients?
Conversely, is there a number of food groups above which nutrient adequacy will
be achieved for most children, in most environments? These key questions need
53
to be answered before dietary diversity indicators can be recommended for wider
use as indicators of nutrient adequacy.
! The contribution to micronutrient intake of specific food groups such as eggs,
liver, poultry, meat, or dairy products needs to be better understood. The question
of whether certain high-quality foods or food groups could be used as sentinel
food groups or as proxies for nutrient adequacy should also be addressed in future
validation studies.
Safe Preparation and Storage of Complementary Foods
! The main concern with the measurement of food safety and hygiene practices is
the validity and reliability of recall approaches, as discussed previously.
Handwashing has been shown to be particularly poorly assessed by recall
methods because respondents know that handwashing is desirable and thus tend to
over-report it (Curtis et al. 1993; Stanton et al. 1987). The same is likely to be true
for questions regarding hygiene during food preparation, and possibly also for
water treatment, especially in populations that have been exposed to hygiene
education.
! There is a need to specifically validate indicators of hygiene during preparation
and storage of complementary foods based on recall against more rigorous
approaches, such as structured observations for multiple days. It would also be
useful to explore the possibility of developing spot-check observation methods for
certain practices related to food hygiene and safety. For example, efforts could be
made to develop a methodology to conduct spot observations of certain key
hygiene practices during feeding episodes. Spot-check observations have been
shown to require substantially less time than structured observations and to be less
reactive, because observers are usually able to carry out the observation rapidly
and discretely (Ruel and Arimond 2002). Spot-check instruments to measure
hygiene during food preparation have not yet been developed to our knowledge.
54
Care During Feeding (Feeding Behaviors and Psychosocial Care)
! Indicators of feeding behavior: There is a tremendous amount of work to be done
to develop and test indicators of feeding behaviors within the context of
psychosocial care during feeding.
! We recommend relying on maternal or caregiver reporting instead of relying on
structured observations of behavior during a specific meal or feeding event.
Although one would ideally like to know about usual feeding behaviors
(recognizing the variability inherent in feeding behavior), it is not known whether
caregivers can report their usual behavior, or whether more accurate reporting of
behavior would occur if caregivers were queried regarding their behaviors over a
specific time period (e.g., day prior to interview).
! Research is required on the precise wording of questions regardless of time frame;
clearly, it would be important to use cognitive interviewing or other qualitative
research techniques to further our understanding of how caregivers would
interpret and respond to particular questions in this area.
! Finally, and most importantly, it would be important to validate these indicators
against some reference measure of maternal/caregiver feeding behaviors, with the
reference behavior likely to be based on structured observations of feeding
behaviors over a meal or a series of feeding events.
Concluding Remarks
This report highlights the need to carry out a wide range of validation studies to
accelerate progress in developing simple and useful indicators of complementary feeding.
It is important to note that a number of existing datasets could be used to address most of
the indicator validation needs identified here. An effort should be made to identify
existing datasets that contain detailed quantitative information on dietary intakes of
infants and young children of different ages and to design a global research agenda to
address key methodological issues and validation needs. Standard analytical approaches
55
could be defined to ensure that comparable approaches are used in validation studies
carried out with datasets from a wide variety of populations with different sociocultural
characteristics and dietary patterns. Research to develop and validate simple tools to
assess the crucial psychosocial care aspects of complementary feeding is also urgently
needed.

56
References
Aarts, C., Kylberg, E., Hörnell, A., Hofvander, Y., Gebre-Medhin, M., and Greiner, T.
(2000) How exclusive is exclusive breastfeeding? A comparison of data since
birth with current status data. International Journal of Epidemiology 29:
1041-1046.
ACC/SCN (United Nations Administrative Committee on Coordination�Sub-Committee
on Nutrition) (2000) Fourth Report on the World Nutrition Situation. ACC/SCN,
in collaboration with the International Food Policy Research Institute, Geneva,
Switzerland.
Arimond, M., and Ruel, M. T. (2001) Assessing care: Progress towards the measurement
of selected childcare and feeding practices, and implications for program. Food
Consumption and Nutrition Division Discussion Paper 119. International Food
Policy Research Institute, Washington, D.C.
Arimond, M., and Ruel, M. T. (2003) Progress in developing an infant and child-feeding
index: An example using the Ethiopia Demographic and Health Survey 2000.
Food Consumption and Nutrition Discussion Paper 143. International Food Policy
Research Institute, Washington, D.C.
Bentley, M. E. (1999) Caretaker style of infant feeding as a determinant of dietary intake:
The need for promotion of "interactive" feeding (Abstract #195.1). FASEB
Journal 13: A211.
Bentley, M. E., Black, M., and Hurtado, E. (1996) Child feeding and appetite�What can
programs do? Food and Nutrition Bulletin 16: 340-348.
Bentley, M., Stallings, R., Fukumoto, M., and Elder, J. (1991b) Maternal feeding
behavior and child acceptance of food during diarrhea, convalescence, and health
in the central sierra of Peru. American Journal of Public Health 81: 43-47.

57
Bentley, M. E., Dickin, K. L., Mebrahtu, S., Kayode, B., Oni, G. A., Verzosa, C. C.,
Brown, K. H., and Idowu, J. R. (1991a) Development of a nutritionally adequate
and culturally appropriate weaning food in Kwara State, Nigeria: An
interdisciplinary approach. Social Science and Medicine 33: 1103-1110.
Birch, L. L., and Fisher, J. A. (1995) Appetite and eating behavior in children. Pediatric
Clinics of North America 42: 931-953.
Birch, L. L., and Fisher, J. O. (2000) Mothers' child-feeding practices influence
daughters' eating and weight. American Journal of Clinical Nutrition 71:
1054-1061.
Birch, L. L., Fisher, J. O., Castro, C. N., Grimm-Thomas, K., Sawyer, R., and Johnson, S.
L. (2001) Confirmatory factor analysis of the Child Feeding Questionnaire: A
measure of parental attitudes, beliefs and practices about child feeding and obesity
proneness. Appetite 6: 201-210.
Black, M. M., Kerr, M. A., Dubowitz, H., and Starr, R. H. (2001) Obesity among
children recovering from failure-to-thrive (Abstract #587.5). FASEB Journal
A740.
Brown, K., Dewey, K., and Allen, L. (1998) Complementary feeding of young children in
developing countries: A review of current scientific knowledge. World Health
Organization, Geneva.
Brown, K. H., Peerson, J. M., Kimmons, J. E., and Hotz, C. (2002) Options for achieving
adequate intake from home-prepared complementary foods in low income
countries. In: Public health issues in infant and child nutrition (Black, R. E. and
Fleischer Michaelsen, K., eds.), Nestec Ltd. and Lippincott Williams and Wilkins,
Philadelphia, Pa.
Brown, K. H., Black, R. E., Robertson, A. D., Akhtar, N. A., Ahmed, G., and Becker, S.
(1982) Clinical and field studies of human lactation: methodological
considerations. American Journal of Clinical Nutrition 35: 745-756.

58
Caulfield, L. E., Huffman, S. L., and Piwoz, E. G. (1999) Interventions to improve the
complementary food intakes of 6-12 month old infants in developing countries:
Impact on growth, prevalence of malnutrition and potential contribution to child
survival. Food and Nutrition Bulletin 20: 183-200.
Curtis, V., Cousens, S., Mertens, T., Traore, E., Kanki, B., and Diallo, I. (1993)
Structured observations of hygiene behaviours in Burkina Faso: Validity,
variability, and utility. Bulletin of the World Health Organization 71: 23-32.
Darmon, N., Ferguson, E. L., and Briend, A. (2002) Linear and nonlinear programming
to optimize the nutrient density of a population's diet: An example based on diets
of preschool children in rural Malawi. American Journal of Clinical Nutrition 75:
245-253.
Dettwyler, K. A. (1989a) Styles of infant feeding: Parental/caretaker control of food
consumption in young children. American Anthropologist 91: 696-703.
Dettwyler, K. (1989b) Interaction of anorexia and cultural beliefs in infant malnutrition in
Mali. American Journal of Human Biology 1: 683-695.
Dewey, K. G., and Brown, K. H. (2003) Update on technical issues concerning
complementary feeding of young children in developing countries and
implications for intervention programs. Food and Nutrition Bulletin 24: 5-28.
Dickin, K., Griffiths, M., and Piwoz, E. (1997) Designing by dialogue. A program
planner's guide to consultative research for improving young child feeding.
SARA Project, Academy for Educational Development (AED), Washington, D.C.
Engle, P., and Zeitlin, M. (1996) Active feeding behavior compensates for low interest in
food among young Nicaraguan children. Journal of Nutrition 126: 1808-1816.
Engle, P., Bentley, M., and Pelto, G. (2000) The role of care in nutrition research
programmes: Current research and a research agenda. Proceedings of the
Nutrition Society 59: 25-35.
Gibson, R. S. (1990) Principles of nutritional assessment. Oxford University Press, New
York, Oxford.
59
Gittelsohn, J., Shankar, A., Ram, R., Gnywali, T., and West, K. (1997) Estimating
reactivity and its effects in direct observation studies of health behavior. Human
Organization 56: 182-189.
Gittelsohn, J., Shankar, A., West, K. J., Faruque, F., Gnywali, T., and Pradhan, E. (1998)
Child feeding and care behaviors are associated with xerophthalmia in rural
Nepalese households. Social Science and Medicine 47: 477-486.
Grillenberger, M., Neumann, C. G., Murphy, S. P., Bwibo, N. O., van't Veer, P.,
Hautvast, J. G. A. J., and West, C. E. (2002) Food supplements have a positive
impact on weight gain and the addition of animal source foods increases lean
body mass in Kenyan schoolchildren. Journal of Nutrition.
Guldan, G. S., Zhang, M., Zhang, J., Hong, J., Zang, H., Fu, S., and Fu, N. (1993)
Weaning practices and growth in rural Sichuan infants: A positive deviance study.
Journal of Tropical Pediatrics 39: 169-175.
Habicht, J.-P., and Pelletier, D. L. (1990) The importance of context in choosing
nutritional indicators. Journal of Nutrition 120: 1519-1524.
Habicht, J.-P., Yarbrough, C., and Martorell, R. (1979) Anthropometric field methods:
Criteria for selection. In: Human nutrition�A comprehensive treatise, Vol. 2
Nutrition and growth. (Jelliffe, D. B., and Jelliffe, E. F. P., eds.), Plenum
Publishing Corporation, New York.
Hatløy, A., Torheim, L. E., and Oshaug, A. (1998) Food variety�A good indicator of
nutritional adequacy of the diet? A case study from an urban area in Mali, West
Africa. European Journal of Clinical Nutrition 52: 891-898.
Helen Keller International (1994) How to use the HKI food frequency method to assess
community risk of vitamin A deficiency. Helen Keller International, New York.
Huttly, S. R., Barros, F. C., Victora, C. G., Beria, J. U., and Vaughan, J. P. (1990) Do
mothers overestimate breast feeding duration? An example of recall bias from a
study in southern Brazil. American Journal of Epidemiology 132: 572-575.
Institute of Medicine (2000) Dietary reference intakes: Applications in dietary
assessment. National Academy Press, Washington, D.C.

60
Kanashiro, H. C., Fukomoto, M., Bentley, M. E., Jacoby, E., Verzpsa, C., and Brown, K.
H. (1991) Use of recipe trials and anthropological techniques for the development
of a home-prepared weaning food in the Central Highlands of Peru. Journal of
Nutrition Education 23: 30-35.
Kleinbaum, D. G., Kupper, L. L., and Morgenstern, H. (1982) Epidemiologic research.
Principles and Quantitative Methods Lifetime Learning Publications, A division
of Wadsworth, Inc., Belmont, Calif.
Klesges, R. C., Stein, R. J., Eck, L. H., Isbell, T. R., and Klesges, L. M. (1991) Parental
influence on food selection in young children and its relationships to childhood
obesity. American Journal of Clinical Nutrition 55: 859-864.
Marquis, G. S., Diaz, J., Bartolini, R., Creed de Kanashiro, H., and Rasmussen, K. M.
(1998) Recognizing the reversible nature of child-feeding decisions:
Breastfeeding, weaning, and relactation patterns in a shanty town community of
Lima, Peru. Social Science and Medicine 47: 645-656.
Menon, P., Loechl, C., Pelto, G., Ruel, M., and Metellus, E. (2002) Development of a
behavior change communications program to prevent malnutrition in the Central
Plateau of Haiti: Results and challenges from a formative research study. Report
submitted to The food and Nutrition Technical Assistance (FANTA) Project,
September 11, 2002. International Food Policy Research Institute, Washington,
D.C.
Nelson, M., Black, A. E., Morris, J. A., and Cole, T. J. (1989) Between- and within-
subject variation in nutrient intake from infancy to old age: Estimating the number
of days required to rank dietary intakes with desired precision. American Journal
of Clinical Nutrition 50: 155-167.
Ogle, B. M., Hung, P. H., and Tuyet, H. T. (2001) Significance of wild vegetables in
micronutrient intakes of women in Vietnam: An analysis of food variety. Asia
Pacific Journal of Clinical Nutrition 10: 21-30.

61
Onyango, A., Koski, K. G., and Tucker, K. L. (1998) Food diversity versus breastfeeding
choice in determining anthropometric status in rural Kenyan toddlers.
International Journal of Epidemiology 27: 484-489.
PAHO/WHO (Pan American Health Organization/World Health Organization) (2003)
Guiding principles for complementary feeding of the breastfed child. Washington,
D.C.
Pelto, G., Levitt, E., and Thairu, L. (2002) Improving feeding practices: Current patterns,
common constraints, and the design of interventions. WHO Global Consultation
on Complementary Feeding. WHO, Geneva.
Piwoz, E. (1994) Improving feeding practices during childhood illness and
convalescence: Lessons learned in Africa. AEDl, SARA Project, Washington,
D.C.
Piwoz, E. G., Creed de Kanashiro, H., Lopez de Romaña, G., Black, R. E., and Brown, K.
H. (1994) Within-and between-individual variation in energy intakes by low-
income Peruvian infants. American Journal of Clinical Nutrition 48: 333-340.
Piwoz, E. G., Creed de Kanashiro, H., Lopez de Romaña, G., Black, R. E., and Brown, K.
H. (1995) Potential for misclassification of infants' usual feeding practices using
24-hour dietary assessment methods. Journal of Nutrition 125: 57-65.
Rothman, K. J. (1986) Modern epidemiology. Little, Brown and Company, Boston,
Mass./Toronto.
Ruel, M. T. (2002) Is dietary diversity an indicator of food security or dietary quality? A
review of measurement issues and research needs. Food Consumption and
Nutrition Division Discussion Paper 140. International Food Policy Research
Institute, Washington, D.C.
Ruel, M. T. (2003) Milk intake is associated with better growth in Latin America:
Evidence from the Demographic and Health Surveys. FASEB Journal.
Ruel, M. T., and Arimond, M. (2002) Spot check observations for assessing hygiene
practices: Review of experience and implications for programs. Journal of Health,
Population and Nutrition 20: 65-76.
62
Ruel, M. T., and Menon, P. (2002) Child feeding practices are associated with child
nutritional status in Latin America: innovative uses of the Demographic and
Health Surveys. Journal of Nutrition 132: 1180-1187.
Sanjur, D. (1982) Food consumption surveys: Issues concerning the process of data
collection. In: Social and cultural perspectives in nutrition. Prentice-Hall, Inc.,
Englewood Cliffs, N.J.
Spruijt-Metz, D., Lindquist, C. H., Birch, L. L., Fisher, J. O., and Goran, M. I. (2002)
Relation between mothers' child-feeding practices and children's adiposity.
American Journal of Clinical Nutrition 75: 581-586.
Stanton, B., Clemens, J., Aziz, K., and Rahaman, M. (1987) Twenty-four hour recall,
knowledge-attitude-practice and direct observations of sanitary practices: A
comparative study. Bulletin of the World Health Organization 65: 217-222.
WHO (World Health Organization) (1991) Indicators for assessing breastfeeding
practices. Reprinted report of an informal meeting 11-12 June 1991, Geneva.
WHO/CDD/SER/91.14. Geneva.
WHO (World Health Organization) (1995) The World Health Organization's infant-
feeding recommendations. Bulletin of the World Health Organization 73:
165-174.
WHO (World Health Organization) (2001) Five keys to safer food.
WHO/SDE/PHE/FOS/01.1. Geneva.
WHO (World Health Organization) (2002) Report of the expert consultation on the
optimal duration of exclusive breastfeeding. Department of Nutrition for Health
and Development, Department of Child and Adolescent Health and Development,
Geneva.
Willett, W. (1998a) Corrections for the effects of measurement error. In: Nutritional
epidemiology. Monographs in Epidemiology and Biostatistics, Vol. 15 (Willett,
W., ed.). Oxford University Press, Oxford.
Willett, W. (1998b) Nutritional epidemiology. Monographs in Epidemiology and
Biostatistics, Vol. 15. Oxford.
63
Windsor, R., Baranowski, T., Clark, N., and Cutter, G. (1994) Evaluation of health
promotion, health education, and disease prevention programs, 2nd Edition.
Mayfield Publishing Co., Mountain View, Calif.
Zeitlin, M. (1996) Child care and nutrition: The findings from positive deviance
research. Report to UNICEF, Positive Deviance in Nutrition Research Project,
Vol. 27. International Nutrition Monograph Series. Cornell University Program in
International Nutrition, Ithaca, N.Y.
Zohoori, N. J., Popkin, B. M., and Fernandez, M. E. (1993) Breast-feeding patterns in the
Philippines: A prospective analysis. Journal of Biosocial Sciences 25: 127-138.

FCND DISCUSSION PAPERS
01 Agricultural Technology and Food Policy to Combat Iron Deficiency in Developing Countries, Howarth E. Bouis, August 1994
02 Determinants of Credit Rationing: A Study of Informal Lenders and Formal Credit Groups in Madagascar, Manfred Zeller, October 1994
03 The Extended Family and Intrahousehold Allocation: Inheritance and Investments in Children in the Rural Philippines, Agnes R. Quisumbing, March 1995
04 Market Development and Food Demand in Rural China, Jikun Huang and Scott Rozelle, June 1995
05 Gender Differences in Agricultural Productivity: A Survey of Empirical Evidence, Agnes R. Quisumbing, July 1995
06 Gender Differentials in Farm Productivity: Implications for Household Efficiency and Agricultural Policy, Harold Alderman, John Hoddinott, Lawrence Haddad, and Christopher Udry, August 1995
07 A Food Demand System Based on Demand for Characteristics: If There Is "Curvature" in the Slutsky Matrix, What Do the Curves Look Like and Why?, Howarth E. Bouis, December 1995
08 Measuring Food Insecurity: The Frequency and Severity of "Coping Strategies," Daniel G. Maxwell, December 1995
09 Gender and Poverty: New Evidence from 10 Developing Countries, Agnes R. Quisumbing, Lawrence Haddad, and Christine Peña, December 1995
10 Women's Economic Advancement Through Agricultural Change: A Review of Donor Experience, Christine Peña, Patrick Webb, and Lawrence Haddad, February 1996
11 Rural Financial Policies for Food Security of the Poor: Methodologies for a Multicountry Research Project, Manfred Zeller, Akhter Ahmed, Suresh Babu, Sumiter Broca, Aliou Diagne, and Manohar Sharma, April 1996
12 Child Development: Vulnerability and Resilience, Patrice L. Engle, Sarah Castle, and Purnima Menon, April 1996
13 Determinants of Repayment Performance in Credit Groups: The Role of Program Design, Intra-Group Risk Pooling, and Social Cohesion in Madagascar, Manfred Zeller, May 1996
14 Demand for High-Value Secondary Crops in Developing Countries: The Case of Potatoes in Bangladesh and Pakistan, Howarth E. Bouis and Gregory Scott, May 1996
15 Repayment Performance in Group-Based credit Programs in Bangladesh: An Empirical Analysis, Manohar Sharma and Manfred Zeller, July 1996
16 How Can Safety Nets Do More with Less? General Issues with Some Evidence from Southern Africa, Lawrence Haddad and Manfred Zeller, July 1996
17 Remittances, Income Distribution, and Rural Asset Accumulation, Richard H. Adams, Jr., August 1996
18 Care and Nutrition: Concepts and Measurement, Patrice L. Engle, Purnima Menon, and Lawrence Haddad, August 1996
19 Food Security and Nutrition Implications of Intrahousehold Bias: A Review of Literature, Lawrence Haddad, Christine Peña, Chizuru Nishida, Agnes Quisumbing, and Alison Slack, September 1996
20 Macroeconomic Crises and Poverty Monitoring: A Case Study for India, Gaurav Datt and Martin Ravallion, November 1996
21 Livestock Income, Male/Female Animals, and Inequality in Rural Pakistan, Richard H. Adams, Jr., November 1996
22 Alternative Approaches to Locating the Food Insecure: Qualitative and Quantitative Evidence from South India, Kimberly Chung, Lawrence Haddad, Jayashree Ramakrishna, and Frank Riely, January 1997
FCND DISCUSSION PAPERS
23 Better Rich, or Better There? Grandparent Wealth, Coresidence, and Intrahousehold Allocation, Agnes R. Quisumbing, January 1997
24 Child Care Practices Associated with Positive and Negative Nutritional Outcomes for Children in Bangladesh: A Descriptive Analysis, Shubh K. Kumar Range, Ruchira Naved, and Saroj Bhattarai, February 1997
25 Water, Health, and Income: A Review, John Hoddinott, February 1997
26 Why Have Some Indian States Performed Better Than Others at Reducing Rural Poverty?, Gaurav Datt and Martin Ravallion, March 1997
27 "Bargaining" and Gender Relations: Within and Beyond the Household, Bina Agarwal, March 1997
28 Developing a Research and Action Agenda for Examining Urbanization and Caregiving: Examples from Southern and Eastern Africa, Patrice L. Engle, Purnima Menon, James L. Garrett, and Alison Slack, April 1997
29 Gender, Property Rights, and Natural Resources, Ruth Meinzen-Dick, Lynn R. Brown, Hilary Sims Feldstein, and Agnes R. Quisumbing, May 1997
30 Plant Breeding: A Long-Term Strategy for the Control of Zinc Deficiency in Vulnerable Populations, Marie T. Ruel and Howarth E. Bouis, July 1997
31 Is There an Intrahousehold 'Flypaper Effect'? Evidence from a School Feeding Program, Hanan Jacoby, August 1997
32 The Determinants of Demand for Micronutrients: An Analysis of Rural Households in Bangladesh, Howarth E. Bouis and Mary Jane G. Novenario-Reese, August 1997
33 Human Milk�An Invisible Food Resource, Anne Hatløy and Arne Oshaug, August 1997
34 The Impact of Changes in Common Property Resource Management on Intrahousehold Allocation, Philip Maggs and John Hoddinott, September 1997
35 Market Access by Smallholder Farmers in Malawi: Implications for Technology Adoption, Agricultural Productivity, and Crop Income, Manfred Zeller, Aliou Diagne, and Charles Mataya, September 1997
36 The GAPVU Cash Transfer Program in Mozambique: An assessment, Gaurav Datt, Ellen Payongayong, James L. Garrett, and Marie Ruel, October 1997
37 Why Do Migrants Remit? An Analysis for the Dominican Sierra, Bénédicte de la Brière, Alain de Janvry, Sylvie Lambert, and Elisabeth Sadoulet, October 1997
38 Systematic Client Consultation in Development: The Case of Food Policy Research in Ghana, India, Kenya, and Mali, Suresh Chandra Babu, Lynn R. Brown, and Bonnie McClafferty, November 1997
39 Whose Education Matters in the Determination of Household Income: Evidence from a Developing Country, Dean Jolliffe, November 1997
40 Can Qualitative and Quantitative Methods Serve Complementary Purposes for Policy Research? Evidence from Accra, Dan Maxwell, January 1998
41 The Political Economy of Urban Food Security in Sub-Saharan Africa, Dan Maxwell, February 1998
42 Farm Productivity and Rural Poverty in India, Gaurav Datt and Martin Ravallion, March 1998
43 How Reliable Are Group Informant Ratings? A Test of Food Security Rating in Honduras, Gilles Bergeron, Saul Sutkover Morris, and Juan Manuel Medina Banegas, April 1998
44 Can FAO's Measure of Chronic Undernourishment Be Strengthened?, Lisa C. Smith, with a Response by Logan Naiken, May 1998
45 Does Urban Agriculture Help Prevent Malnutrition? Evidence from Kampala, Daniel Maxwell, Carol Levin, and Joanne Csete, June 1998
46 Impact of Access to Credit on Income and Food Security in Malawi, Aliou Diagne, July 1998

FCND DISCUSSION PAPERS
47 Poverty in India and Indian States: An Update, Gaurav Datt, July 1998
48 Human Capital, Productivity, and Labor Allocation in Rural Pakistan, Marcel Fafchamps and Agnes R. Quisumbing, July 1998
49 A Profile of Poverty in Egypt: 1997, Gaurav Datt, Dean Jolliffe, and Manohar Sharma, August 1998.
50 Computational Tools for Poverty Measurement and Analysis, Gaurav Datt, October 1998
51 Urban Challenges to Food and Nutrition Security: A Review of Food Security, Health, and Caregiving in the Cities, Marie T. Ruel, James L. Garrett, Saul S. Morris, Daniel Maxwell, Arne Oshaug, Patrice Engle, Purnima Menon, Alison Slack, and Lawrence Haddad, October 1998
52 Testing Nash Bargaining Household Models With Time-Series Data, John Hoddinott and Christopher Adam, November 1998
53 Agricultural Wages and Food Prices in Egypt: A Governorate-Level Analysis for 1976-1993, Gaurav Datt and Jennifer Olmsted, November 1998
54 Endogeneity of Schooling in the Wage Function: Evidence from the Rural Philippines, John Maluccio, November 1998
55 Efficiency in Intrahousehold Resource Allocation, Marcel Fafchamps, December 1998
56 How Does the Human Rights Perspective Help to Shape the Food and Nutrition Policy Research Agenda?, Lawrence Haddad and Arne Oshaug, February 1999
57 The Structure of Wages During the Economic Transition in Romania, Emmanuel Skoufias, February 1999
58 Women's Land Rights in the Transition to Individualized Ownership: Implications for the Management of Tree Resources in Western Ghana, Agnes Quisumbing, Ellen Payongayong, J. B. Aidoo, and Keijiro Otsuka, February 1999
59 Placement and Outreach of Group-Based Credit Organizations: The Cases of ASA, BRAC, and PROSHIKA in Bangladesh, Manohar Sharma and Manfred Zeller, March 1999
60 Explaining Child Malnutrition in Developing Countries: A Cross-Country Analysis, Lisa C. Smith and Lawrence Haddad, April 1999
61 Does Geographic Targeting of Nutrition Interventions Make Sense in Cities? Evidence from Abidjan and Accra, Saul S. Morris, Carol Levin, Margaret Armar-Klemesu, Daniel Maxwell, and Marie T. Ruel, April 1999
62 Good Care Practices Can Mitigate the Negative Effects of Poverty and Low Maternal Schooling on Children's Nutritional Status: Evidence from Accra, Marie T. Ruel, Carol E. Levin, Margaret Armar-Klemesu, Daniel Maxwell, and Saul S. Morris, April 1999
63 Are Urban Poverty and Undernutrition Growing? Some Newly Assembled Evidence, Lawrence Haddad, Marie T. Ruel, and James L. Garrett, April 1999
64 Some Urban Facts of Life: Implications for Research and Policy, Marie T. Ruel, Lawrence Haddad, and James L. Garrett, April 1999
65 Are Determinants of Rural and Urban Food Security and Nutritional Status Different? Some Insights from Mozambique, James L. Garrett and Marie T. Ruel, April 1999
66 Working Women in an Urban Setting: Traders, Vendors, and Food Security in Accra, Carol E. Levin, Daniel G. Maxwell, Margaret Armar-Klemesu, Marie T. Ruel, Saul S. Morris, and Clement Ahiadeke, April 1999
67 Determinants of Household Access to and Participation in Formal and Informal Credit Markets in Malawi, Aliou Diagne, April 1999
68 Early Childhood Nutrition and Academic Achievement: A Longitudinal Analysis, Paul Glewwe, Hanan Jacoby, and Elizabeth King, May 1999

FCND DISCUSSION PAPERS
69 Supply Response of West African Agricultural Households: Implications of Intrahousehold Preference Heterogeneity, Lisa C. Smith and Jean-Paul Chavas, July 1999
70 Child Health Care Demand in a Developing Country: Unconditional Estimates from the Philippines, Kelly Hallman, August 1999
71 Social Capital and Income Generation in South Africa, 1993-98, John Maluccio, Lawrence Haddad, and Julian May, September 1999
72 Validity of Rapid Estimates of Household Wealth and Income for Health Surveys in Rural Africa, Saul S. Morris, Calogero Carletto, John Hoddinott, and Luc J. M. Christiaensen, October 1999
73 Social Roles, Human Capital, and the Intrahousehold Division of Labor: Evidence from Pakistan, Marcel Fafchamps and Agnes R. Quisumbing, October 1999
74 Can Cash Transfer Programs Work in Resource-Poor Countries? The Experience in Mozambique, Jan W. Low, James L. Garrett, and Vitória Ginja, October 1999
75 Determinants of Poverty in Egypt, 1997, Gaurav Datt and Dean Jolliffe, October 1999
76 Raising Primary School Enrolment in Developing Countries: The Relative Importance of Supply and Demand, Sudhanshu Handa, November 1999
77 The Political Economy of Food Subsidy Reform in Egypt, Tammi Gutner, November 1999.
78 Determinants of Poverty in Mozambique: 1996-97, Gaurav Datt, Kenneth Simler, Sanjukta Mukherjee, and Gabriel Dava, January 2000
79 Adult Health in the Time of Drought, John Hoddinott and Bill Kinsey, January 2000
80 Nontraditional Crops and Land Accumulation Among Guatemalan Smallholders: Is the Impact Sustainable? Calogero Carletto, February 2000
81 The Constraints to Good Child Care Practices in Accra: Implications for Programs, Margaret Armar-Klemesu, Marie T. Ruel, Daniel G. Maxwell, Carol E. Levin, and Saul S. Morris, February 2000
82 Pathways of Rural Development in Madagascar: An Empirical Investigation of the Critical Triangle of Environmental Sustainability, Economic Growth, and Poverty Alleviation, Manfred Zeller, Cécile Lapenu, Bart Minten, Eliane Ralison, Désiré Randrianaivo, and Claude Randrianarisoa, March 2000
83 Quality or Quantity? The Supply-Side Determinants of Primary Schooling in Rural Mozambique, Sudhanshu Handa and Kenneth R. Simler, March 2000
84 Intrahousehold Allocation and Gender Relations: New Empirical Evidence from Four Developing Countries, Agnes R. Quisumbing and John A. Maluccio, April 2000
85 Intrahousehold Impact of Transfer of Modern Agricultural Technology: A Gender Perspective, Ruchira Tabassum Naved, April 2000
86 Women�s Assets and Intrahousehold Allocation in Rural Bangladesh: Testing Measures of Bargaining Power, Agnes R. Quisumbing and Bénédicte de la Brière, April 2000
87 Changes in Intrahousehold Labor Allocation to Environmental Goods Collection: A Case Study from Rural Nepal, Priscilla A. Cooke, May 2000
88 The Determinants of Employment Status in Egypt, Ragui Assaad, Fatma El-Hamidi, and Akhter U. Ahmed, June 2000
89 The Role of the State in Promoting Microfinance Institutions, Cécile Lapenu, June 2000
90 Empirical Measurements of Households� Access to Credit and Credit Constraints in Developing Countries: Methodological Issues and Evidence, Aliou Diagne, Manfred Zeller, and Manohar Sharma, July 2000
91 Comparing Village Characteristics Derived From Rapid Appraisals and Household Surveys: A Tale From Northern Mali, Luc Christiaensen, John Hoddinott, and Gilles Bergeron, July 2000
FCND DISCUSSION PAPERS
92 Assessing the Potential for Food-Based Strategies to Reduce Vitamin A and Iron Deficiencies: A Review of Recent Evidence, Marie T. Ruel and Carol E. Levin, July 2000
93 Mother-Father Resource Control, Marriage Payments, and Girl-Boy Health in Rural Bangladesh, Kelly K. Hallman, September 2000
94 Targeting Urban Malnutrition: A Multicity Analysis of the Spatial Distribution of Childhood Nutritional Status, Saul Sutkover Morris, September 2000
95 Attrition in the Kwazulu Natal Income Dynamics Study 1993-1998, John Maluccio, October 2000
96 Attrition in Longitudinal Household Survey Data: Some Tests for Three Developing-Country Samples, Harold Alderman, Jere R. Behrman, Hans-Peter Kohler, John A. Maluccio, Susan Cotts Watkins, October 2000
97 Socioeconomic Differentials in Child Stunting Are Consistently Larger in Urban Than in Rural Areas, Purnima Menon, Marie T. Ruel, and Saul S. Morris, December 2000
98 Participation and Poverty Reduction: Issues, Theory, and New Evidence from South Africa, John Hoddinott, Michelle Adato, Tim Besley, and Lawrence Haddad, January 2001
99 Cash Transfer Programs with Income Multipliers: PROCAMPO in Mexico, Elisabeth Sadoulet, Alain de Janvry, and Benjamin Davis, January 2001
100 On the Targeting and Redistributive Efficiencies of Alternative Transfer Instruments, David Coady and Emmanuel Skoufias, March 2001
101 Poverty, Inequality, and Spillover in Mexico�s Education, Health, and Nutrition Program, Sudhanshu Handa, Mari-Carmen Huerta, Raul Perez, and Beatriz Straffon, March 2001
102 School Subsidies for the Poor: Evaluating a Mexican Strategy for Reducing Poverty, T. Paul Schultz, March 2001
103 Targeting the Poor in Mexico: An Evaluation of the Selection of Households for PROGRESA, Emmanuel Skoufias, Benjamin Davis, and Sergio de la Vega, March 2001
104 An Evaluation of the Impact of PROGRESA on Preschool Child Height, Jere R. Behrman and John Hoddinott, March 2001
105 The Nutritional Transition and Diet-Related Chronic Diseases in Asia: Implications for Prevention, Barry M. Popkin, Sue Horton, and Soowon Kim, March 2001
106 Strengthening Capacity to Improve Nutrition, Stuart Gillespie, March 2001
107 Rapid Assessments in Urban Areas: Lessons from Bangladesh and Tanzania, James L. Garrett and Jeanne Downen, April 2001
108 How Efficiently Do Employment Programs Transfer Benefits to the Poor? Evidence from South Africa, Lawrence Haddad and Michelle Adato, April 2001
109 Does Cash Crop Adoption Detract From Childcare Provision? Evidence From Rural Nepal, Michael J. Paolisso, Kelly Hallman, Lawrence Haddad, and Shibesh Regmi, April 2001
110 Evaluating Transfer Programs Within a General Equilibrium Framework, Dave Coady and Rebecca Lee Harris, June 2001
111 An Operational Tool for Evaluating Poverty Outreach of Development Policies and Projects, Manfred Zeller, Manohar Sharma, Carla Henry, and Cécile Lapenu, June 2001
112 Effective Food and Nutrition Policy Responses to HIV/AIDS: What We Know and What We Need to Know, Lawrence Haddad and Stuart Gillespie, June 2001
113 Measuring Power, Elizabeth Frankenberg and Duncan Thomas, June 2001
114 Distribution, Growth, and Performance of Microfinance Institutions in Africa, Asia, and Latin America, Cécile Lapenu and Manfred Zeller, June 2001

FCND DISCUSSION PAPERS
115 Are Women Overrepresented Among the Poor? An Analysis of Poverty in Ten Developing Countries, Agnes R. Quisumbing, Lawrence Haddad, and Christina Peña, June 2001
116 A Multiple-Method Approach to Studying Childcare in an Urban Environment: The Case of Accra, Ghana, Marie T. Ruel, Margaret Armar-Klemesu, and Mary Arimond, June 2001
117 Evaluation of the Distributional Power of PROGRESA�s Cash Transfers in Mexico, David P. Coady, July 2001
118 Is PROGRESA Working? Summary of the Results of an Evaluation by IFPRI, Emmanuel Skoufias and Bonnie McClafferty, July 2001
119 Assessing Care: Progress Towards the Measurement of Selected Childcare and Feeding Practices, and Implications for Programs, Mary Arimond and Marie T. Ruel, August 2001
120 Control and Ownership of Assets Within Rural Ethiopian Households, Marcel Fafchamps and Agnes R. Quisumbing, August 2001
121 Targeting Poverty Through Community-Based Public Works Programs: A Cross-Disciplinary Assessment of Recent Experience in South Africa, Michelle Adato and Lawrence Haddad, August 2001
122 Strengthening Public Safety Nets: Can the Informal Sector Show the Way?, Jonathan Morduch and Manohar Sharma, September 2001
123 Conditional Cash Transfers and Their Impact on Child Work and Schooling: Evidence from the PROGRESA Program in Mexico, Emmanuel Skoufias and Susan W. Parker, October 2001
124 The Robustness of Poverty Profiles Reconsidered, Finn Tarp, Kenneth Simler, Cristina Matusse, Rasmus Heltberg, and Gabriel Dava, January 2002
125 Are the Welfare Losses from Imperfect Targeting Important?, Emmanuel Skoufias and David Coady, January 2002
126 Health Care Demand in Rural Mozambique: Evidence from the 1996/97 Household Survey, Magnus Lindelow, February 2002
127 A Cost-Effectiveness Analysis of Demand- and Supply-Side Education Interventions: The Case of PROGRESA in Mexico, David P. Coady and Susan W. Parker, March 2002
128 Assessing the Impact of Agricultural Research on Poverty Using the Sustainable Livelihoods Framework, Michelle Adato and Ruth Meinzen-Dick, March 2002
129 Labor Market Shocks and Their Impacts on Work and Schooling: Evidence from Urban Mexico, Emmanuel Skoufias and Susan W. Parker, March 2002
130 Creating a Child Feeding Index Using the Demographic and Health Surveys: An Example from Latin America, Marie T. Ruel and Purnima Menon, April 2002
131 Does Subsidized Childcare Help Poor Working Women in Urban Areas? Evaluation of a Government-Sponsored Program in Guatemala City, Marie T. Ruel, Bénédicte de la Brière, Kelly Hallman, Agnes Quisumbing, and Nora Coj, April 2002
132 Weighing What�s Practical: Proxy Means Tests for Targeting Food Subsidies in Egypt, Akhter U. Ahmed and Howarth E. Bouis, May 2002
133 Avoiding Chronic and Transitory Poverty: Evidence From Egypt, 1997-99, Lawrence Haddad and Akhter U. Ahmed, May 2002
134 In-Kind Transfers and Household Food Consumption: Implications for Targeted Food Programs in Bangladesh, Carlo del Ninno and Paul A. Dorosh, May 2002
135 Trust, Membership in Groups, and Household Welfare: Evidence from KwaZulu-Natal, South Africa, Lawrence Haddad and John A. Maluccio, May 2002
136 Dietary Diversity as a Food Security Indicator, John Hoddinott and Yisehac Yohannes, June 2002
FCND DISCUSSION PAPERS
137 Reducing Child Undernutrition: How Far Does Income Growth Take Us? Lawrence Haddad, Harold Alderman, Simon Appleton, Lina Song, and Yisehac Yohannes, August 2002
138 The Food for Education Program in Bangladesh: An Evaluation of its Impact on Educational Attainment and Food Security, Akhter U. Ahmed and Carlo del Ninno, September 2002
139 Can South Africa Afford to Become Africa�s First Welfare State? James Thurlow, October 2002
140 Is Dietary Diversity an Indicator of Food Security or Dietary Quality? A Review of Measurement Issues and Research Needs, Marie T. Ruel, November 2002
141 The Sensitivity of Calorie-Income Demand Elasticity to Price Changes: Evidence from Indonesia, Emmanuel Skoufias, November 2002
142 Social Capital and Coping With Economic Shocks: An Analysis of Stunting of South African Children, Michael R. Carter and John A. Maluccio, December 2002
143 Progress in Developing an Infant and Child Feeding Index: An Example Using the Ethiopia Demographic and Health Survey 2000, Mary Arimond and Marie T. Ruel, December 2002
144 Targeting Outcomes Redux, David Coady, Margaret Grosh, and John Hoddinott, December 2002
145 Child Labor and School Decisions in Urban and Rural Areas: Cross Country Evidence, Lire Ersado, December 2002