movements induced by tunneling with an epb machine in over
TRANSCRIPT

Missouri University of Science and Technology Missouri University of Science and Technology
Scholars' Mine Scholars' Mine
International Conference on Case Histories in Geotechnical Engineering
(2008) - Sixth International Conference on Case Histories in Geotechnical Engineering
15 Aug 2008, 11:00am - 12:30pm
Movements Induced by Tunneling With an Epb Machine in over Movements Induced by Tunneling With an Epb Machine in over
Consolidated Soils: Compans Monitoring Section of Toulouse Consolidated Soils: Compans Monitoring Section of Toulouse
Subway Line B Subway Line B
Fabrice Emeriault LGCIE – INSA, Lyon, France
Richard Kastner LGCIE – INSA, Lyon, France
Emilie Vanoudheusden Formerly Arcadis ESG, Labège, France/ BRGM, Orléans, France
Follow this and additional works at: https://scholarsmine.mst.edu/icchge
Part of the Geotechnical Engineering Commons
Recommended Citation Recommended Citation Emeriault, Fabrice; Kastner, Richard; and Vanoudheusden, Emilie, "Movements Induced by Tunneling With an Epb Machine in over Consolidated Soils: Compans Monitoring Section of Toulouse Subway Line B" (2008). International Conference on Case Histories in Geotechnical Engineering. 10. https://scholarsmine.mst.edu/icchge/6icchge/session06/10
This work is licensed under a Creative Commons Attribution-Noncommercial-No Derivative Works 4.0 License.
This Article - Conference proceedings is brought to you for free and open access by Scholars' Mine. It has been accepted for inclusion in International Conference on Case Histories in Geotechnical Engineering by an authorized administrator of Scholars' Mine. This work is protected by U. S. Copyright Law. Unauthorized use including reproduction for redistribution requires the permission of the copyright holder. For more information, please contact [email protected].

MOVEMENTS INDUCED BY TUNNELLING WITH AN EPB MACHINE IN OVERCONSOLIDATED SOILS: COMPANS MONITORING SECTION OF
TOULOUSE SUBWAY LINE B Fabrice Emeriault Richard Kastner Emilie Vanoudheusden LGCIE – INSA Lyon LGCIE – INSA Lyon Formerly Arcadis ESG F69621, Villeurbanne, France F69621, Villeurbanne, France F31675, Labège, France Now BRGM, Orléans, France ABSTRACT A part of Toulouse’s underground line B has been excavated by a 7.8 meters diameter earth-pressure balance machine. A comprehensive monitoring section has been installed in the Compans garden at a point where the tunnel cover is 12.8-meter and is running through overconsolidated clayey molasses underlying a 6.8 meters layer of made ground and gravels. The monitoring devices give full information on the ground movements above the tunnel and on deformations of the tunnel lining. Vertical movements are measured by 5 multipoint borehole extensometers with automatic data acquisition (every 5 seconds when the TBM crosses the monitoring section). At the end of each excavation phase, a high precision levelling of the borehole extensometer heads is performed in order to determine the total vertical displacements. Horizontal movements are measured by 3 inclinometers, one in the axis of the tunnel and the others on its sides, 2.3 meters away from the tunnel extrados. One of these inclinometers is 42 m long, i.e. 21.8 m below the level of the tunnel invert. The induced horizontal strains at ground level are measured by an invar thread in both longitudinal and transverse directions. Measurements show a specific behaviour of the soil due to its overconsolidated character (K0 greater than 1.5): even though the magnitude of the displacements is limited to a few millimeters, horizontal convergent movements are observed at the level of the tunnel axis while 3 to 4 times smaller heave is measured at ground surface (associated with horizontal extensions). Excavation parameters are automatically recorded and give information on the variation of the torque on the cutting wheel, the advancement rate, the confining pressure, the injection of annular void between soil and the concrete tunnel lining… This paper presents the results of the different monitoring devices and the possible correlations with the tunnel excavation parameters recorded by the TBM. INTRODUCTION The increasing urban transport needs lead to build underground structures such as tunnels and stations in a more and more urbanized environment. Particular attention should be paid to the range of induced soil deformations in depth and at ground level and potential effects on surrounding structures. At the design level, assumptions are required to characterize the behavior of the soil and nearby structures but also for the modeling of the different excavation phases (excavation, installation of the concrete lining, grouting of the annular void, …). Therefore contractors usually install at key locations complete sets of measuring devices to evaluate the movements during and after the works and improve the design model (Bowers et al. 2005, Melis et al. 1997, Pantet 1991, Bonnet-Eymard et al. 2005a) In addition, new techniques such as the pressurized-face tunnel excavation by Tunnel Boring Machines (TBM) are becoming increasingly common. In that case, tunnel excavating parameters must be thoroughly determined and controlled to minimize soil movements (Clough et al. 1983,
Lee et al. 1999, Ollier 1997, Matsushita et al. 1995, Wongsaroj et al. 2005, Vanoudheusden et al. 2005a, Emeriault et al. 2005a, Emeriault et al. 2005b, Vanoudheusden 2006, Robert et al. 2007). The research project METROTOUL has been initiated to collect and analyze the results of the different monitoring devices installed during the excavation of the 12.6 km long subway line B of Toulouse, France (METROTOUL 2005). Contract 2 (4.7 km long) has been excavated by a 7.8 meter in diameter Herrenknecht earth-pressure balance machine. One monitoring section has been installed 3.7 km after the start of the TBM. It includes inclinometers, multi-points borehole extensometers, precise levelling, pore pressure cells and horizontal strains measurement at ground surface. This article presents the results of this instrumentation and their analysis taking into account the main excavation parameters recorded by the TBM works and the geological conditions of the site.
Paper No. 6.14a 1

TUNNEL SUBWAY LINE B The 12.6 km long subway line B of Toulouse (France) has been realized with three different pressurized-face TBM techniques (Fig. 1):
- Contracts 2 and 5 are excavated with earth-pressure balanced TBMs (respectively from Trois Cocus to Jeanne d’Arc stations and from Université Paul Sabatier to Saint Agne)
- and Contract 4 with a slurry shield TBM (from Saint Agne to Francois Verdier stations): all three machines are approximately 7.7 m in diameter
- while Contract 3 uses a compressed-air TBM of 5.3 m in diameter (between Jeanne d’Arc and Francois Verdier stations).
The encountered geology is homogeneous on the whole layout. The tunnels run through the Toulouse molasses (hard sandy clay with pockets and lenses of very dense sand). Geotechnical investigations have shown that in these formations, K is greater than 1, generally close to 1.0 5 and that geotechnical characteristics are homogeneous (γ = 22 kN/m3, Su = 300 kPa, c’ = 30 kPa, φ’ = 32°). The average cover ranges between 10 and 20 m and the water table is mostly found 4 m below ground level. Since the geology, stratigraphy and tunnel cover are almost identical, the differences in soil reaction can be explained by the tunnelling parameters such as the pressure used for the stabilization of the excavation face (earth, slurry or air pressure) and the grouting pressure used to fill the remaining annular void behind the tunnel lining.
Fig. 1. Map of Toulouse subway network
COMPANS MONITORING SECTION A comprehensive monitoring section has been installed in the Compans garden (Fig. 2 - section S23) at a point where the tunnel cover is 12.8-meter and is running through overconsolidated clayey molasses underlying a 6.8 meters layer of made ground and gravels (Figs. 3 and 4). The monitoring devices give full information on the ground movements above the tunnel.
- Vertical movements are measured by 5 multipoint borehole extensometers noted E1 to E5 with automatic data acquisition (every 5 seconds when the TBM crosses the monitoring section).
0m 10m 20m 30m
S23
Direction of excavation
Fig. 2. Compans monitoring section S23: general view
Paper No. 6.14a 2

Jardin Compans
E1 I1 - E2 I2 - E3 E4 - I3 E5
E5 - 2
E5 - 1
E3 - 2E2 - 4E1 - 2
E1 - 1 E2 - 3
E4 - 4
E4 - 3
E4 - 2
E4 - 1E2 - 1
E2 - 2
E3 - 1CPI 1
CPI 2
- LEGEND -
Vibrating wire strain gauges in the lining
Borehole extensometers
Inclinometers
Pore pressure cells
Water table
Top of the molasses
Fig. 3. Compans monitoring section S23: transverse view
- At the end of each excavation phase, a high precision levelling of the borehole extensometer heads E1 to E5 is performed in order to determine the total vertical displacements.
- Horizontal movements are measured by 3 inclinometers, I2 is in the axis of the tunnel and I1 and I3 on its sides, 2.3 meters away from the tunnel extrados. The inclinometer I1 is 42 m long, i.e. 21.8 m below the level of the tunnel invert.
- The induced horizontal strains at ground level are measured by an invar thread in both longitudinal and transverse directions (Fig. 4), the different locations of the measurement are denoted D1 to D7 for the measurement of the transverse strains and C1,C2 and D5 are used for the longitudinal measurements.
CPI
1C
PI 2 C2
C1
D7
D6
D5
D4
D3
D2
D1
E5
E4
E3
E1
E2
I3
I2
I1
30m20m10m0m
- LEGEND -
Pore pressure cells
Inclinometers
Horizontal extension points
Borehole extensometers
Fig. 4. Compans monitoring section S23: plane view Some of the monitoring devices are also used to determine the induced stresses and loads in the lining and in the soil close to the tunnel face. Two pore pressure cells noted CPI1 and CPI2 have been installed in the tunnel axis:
- CPI2 is located within the TBM path and is destroyed during excavation.
- CPI1 is located 0.75 m above the tunnel crown. Strains in the concrete lining segments are measured by 5 pairs of vibrating wire strain gauges. In the vicinity of the monitoring section, the TBM advancement rate is constant (approximately 25 m / day). The concrete lining rings are either 1.4 or 1.0 m in length. In this part of the project where the radius of curvature is small (Fig.2), cycles of two 1.0 m rings and one 1.4 m ring are used. The monitoring section corresponds to Ring # 2580. The results obtained with all these monitoring devices are presented in the sequel. GROUND SURFACE SETTLEMENT For the vertical displacement analysis, the reference position of the borehole extensometer heads is taken when the TBM wheel is only 9 m from the monitoring section. Figure 5 shows that during the full monitoring period (from -9 m to +150 m), the ground surface movements are limited (the
Paper No. 6.14a 3

maximum is close to 2 mm). In addition, upward movements are mainly observed instead of settlements.
-0.5
0.0
0.5
1.0
1.5
2.0
2.5
-15 0 15 30 45 60 75 90 105 120 135 150Distance to the section (m)
Vert
ical
dis
plac
emen
t (m
m)
E1 E2E3 E4E5
Fig. 5. Vertical displacement measurement Figure 6 gives a closer view on the movements observed during the passage of the TBM through the monitoring section (from -9 m to + 30 m). Once the cutting wheel has gone through the section, heave is observed for all points E1 to E5 with a maximum value of 0.1 to 0.4 mm for approximately +5 m. Then all the points settle a little bit until the measure corresponding to +15 m. The release of the TBM skirt does not correspond to an increase in settlements. From then on, heave is again observed: these movements can hardly be linked to the tunnelling operations and show that there is a natural movement of the ground surface.
-0.4
-0.2
0.0
0.2
0.4
0.6
0.8
1.0
1.2
1.4
-10 -5 0 5 10 15 20 25Distance to the section (m)
Vert
ical
dis
plac
emen
t (m
m)
30
E1 E2E3 E4E5
Fig. 6. Vertical displacement measurement (-9 m to +30 m)
-0.40
-0.20
0.00
0.20
0.40
0.60
0.80
1.00
1.20
-15.0 -10.0 -5.0 0.0 5.0 10.0 15.0
Distance to the tunnel axis (m)
Vert
ical
dis
plac
emen
t (m
m)
- 0.5 m+ 5.7 m+ 15.3 m+ 30 m
Fig. 7. Vertical displacement transverse trough Transverse settlement trough can also be drawn for several positions of the TBM with respect to the monitoring section (Fig. 7). It appears that the maximum heave corresponds to the tunnel axis. The troughs have generally an gaussian shape: when the TBM wheel is 5.7 m away from the section, this trough can be described by Smax = 0.58 mm and i = 6 m (with respect to the notations of Peck 1969). This corresponds to a volume “gain” of 0.02 % of the theoretical volume excavated by the TBM. Settlements due to the release of the TBM skirt (+15 m) have the same amplitude for all the levelling points. BOREHOLE EXTENSOMETERS Relative displacements measured by the 5 multipoints borehole extensometers E1 to E5 are limited (less than 0.5 mm in amplitude) which is in agreement with the precise levelling measurements. Figure 8 presents the results obtained for the central extensometer E3 (positive relative displacement corresponds to the shortening of the distance between the 2 points).
-0.4
-0.3
-0.2
-0.1
0
0.1
0.2
0.3
0.4
3/10/2004 00:00 3/10/2004 12:00 3/11/2004 00:00
Date
Rel
ativ
e di
spla
cem
ent (
mm
)
E3-1
E3-2
The cutting wheel reaches the monitoring section
The end of shield tail reaches the monitoring
i
Section + 4,3 m
Section + 7,7 m
Section + 11,5 mE3-1
E3-2
shor
teni
ng
Fig. 8. Relative displacements measured between points E3-1 (respectively E3-2) and the ground surface (extensometer head E3). E3-1 is located 1.7 m above the tunnel crown while E3-2 is installed 5.5 m above E3-1 and 5.5 m below ground surface (Fig. 3). The reference is also taken when the TBM is 9 m to
Paper No. 6.14a 4

the section. As it has been observed for the levelling points, movements are only significant once the TBM wheel has crossed the section. Both anchors exhibit a shortening of the distance with the ground surface (approximately 0.15 mm) which corresponds to a compression of the soil above the tunnel crown. This phenomenon is reversed for E3-1 and E3-2 when the TBM is respectively 4.3 m and 7.7 m away from the section. At a later stage (approximately 9 m), the anchor E3-2 goes back to its original position while there is still a heave of E3-1, indicating a compression of the soil between these two points, probably due to the grouting of the annular void. Finally, when the TBM is +11.5 m away from the section, the TBM stops in order to install the lining segments: it appears that E3-1 is subjected to a sudden lengthening followed after a short while by a sudden shortening for E3-2. INCLINOMETERS Three inclinometers have been installed on the monitoring section. Inclinometer I1 is located on the left side of the tunnel only 2.3 m from the tunnel extrados. In addition, it is 42 m long which corresponds to a length of 21.8 m below the tunnel invert (equivalent to 3 times D the tunnel diameter). The obtained displacement profiles are presented in Fig. 9. Inclinometer I2 is located on the tunnel axis and is destroyed when the TBM crosses the section. The detailed results are not shown in this paper because movements are very small and within the precision of the measurements. It may be concluded that there is almost no movement towards the tunnel face before the TBM wheel reaches the section. Inclinometer I3 (Fig. 10) is the symmetric of I1 on the right side of the section. It is only 28 m long and goes 7.8 m below the tunnel invert (equivalent to 1 D). From Figs. 9 and 10, it can be concluded that the excavation of the tunnel induces only convergent horizontal transverse movements. Even though there are no ground surface movements at the same time, horizontal movements of up to 3mm develop before the TBM wheel reaches the section (for example for I3 at -2 m). This movement increases with the progression of the TBM up to 4 mm for I1 and 7 mm for I3 before reaching its stabilized value approximately +30 m after the TBM wheel crossed the section. The unusual depth of the inclinometer I1 showed that at a distance of 1 D below the tunnel invert, displacements are within the precision of the measurement (between -0.35 and 0.62 mm). This justifies the assumption of a fixed point for the tip of the inclinometer I3 for example and all the other inclinometers installed on the different monitoring sections of the Toulouse subway line B. The simultaneous development of horizontal convergent displacements (up to 7 mm) and ground surface heave (limited to 1.1 mm) is mainly due to the overconsolidated character of the Toulouse molasses where K0 is greater than 1.0. This
assumption has been validated by numerical simulations (METROTOUL 2005)
0
5
10
15
20
25
30
35
40
45
-4 -2 0 2 4 6 8
Horizontal displacement (mm)
Dep
th (m
)
-10 m
-5 m
-2 m
+5 m
+ 10 m
+ 30 m
Fig. 9. Horizontal displacement in inclinometer I1
0
5
10
15
20
25
30
-10 -8 -6 -4 -2 0 2
Horizontal displacement (mm)
Dep
th (m
)
-10 m
-5 m
-2 m
+5 m
+ 10 m
+ 30 m
+ 15 days
Fig. 10. Horizontal displacement in inclinometer I2
Paper No. 6.14a 5

GROUND SURFACE HORIZONTAL EXTENSIONS One of the originality of the Compans monitoring section is the fact that it has been possible to measure horizontal extension with an invar thread in both the transverse and longitudinal directions. For the transverse direction, seven points have been installed whereas only 3 points are used for the longitudinal direction (Fig. 4). D1 is installed 32 m away from the tunnel axis (corresponding to 2 times the depth of the tunnel axis) and could be considered as a fixed point in a first analysis. Figure 11 presents the results for the transverse direction. Positive values correspond to extension and negative to compression. When the strain is measured between points Di and Dj, the corresponding value of the strain is located in the middle of segment Di-Dj.
-150
-100
-50
0
50
100
-35 -30 -25 -20 -15 -10 -5 0 5 10 15
défo
rmat
ions
(µm
/m)
-6.10 1.10
5.90 10.70
147.80
exte
nsio
nco
mpr
essi
on
D1
D4
D3D2
D7
D6
D5
Fig. 11. Ground surface horizontal extension – transverse profile A global dissymmetry of the horizontal strains can be observed during the progression of the TBM: all the measurements performed between -6 m and +11 m show that on the left side of the tunnel there is extension up to 10 m from the tunnel axis whilst on the right side only compressive strains are measured. A close look at the values of strains given for the interval D1-D2 enables to shed some light on the progressive development of the horizontal ground surface movements with the excavation: no strain can be noticed before the TBM wheel is 6 m away from the section which means that these 2 points are fixed. Nevertheless, when the TBM is 11 m from the section, positive strains are measured indicating an increase in the distance between D1 and D2, probably due to a convergent movement of D2 towards the tunnel axis. The measured strains remain limited to 50 µm/m in extension and 100 µm/m in compression. Based on the works of Boscardin et al. (1989) or Burland (1995), these compression and extension would not be responsible for any damage to a building located in the vicinity of the excavation. These same results are presented in an other manner on Fig. 12 and compared with the observed “settlement” trough. The
lower part of Fig. 12 shows for 3 different positions of the TBM the distances between points D1 to D7: the top part corresponds to the initial position, the middle one to +11 m and the bottom part to the final stabilized position (+300 m).
0.00
0.20
0.40
0.60
0.80
-40.0 -30.0 -20.0 -10.0 0.0 10.0 20.0 30.0
Distance to the tunnel axis (m)
Vert
ical
dis
plac
emen
t (m
m) + 5.7 m
-40.00 -30.00 -20.00 -10.00 0.00 10.00 20.00 30.00distance to the tunnel axis
initial position of points D1 to D7
position of points when the cutting wheel is 11 m after the section
final position of points
compressioncompression extension
extensioncompression compression
Fig. 12. Ground surface horizontal extension and comparison with vertical movements The observed zones of compression and extension are coherent with the measured vertical displacements at ground surface (top part of Fig. 12 when the TBM is +5.7 m from the section): heave on the left side of the tunnel induce extension and settlement on the right side leads to compressive horizontal strains. These horizontal movements can also be compared with the displacement of the inclinometer heads (not measured directly but deduced from the assumption of fixed lowertip of the inclinometer casing). Assuming that D5 is fixed (no horizontal movement), then D4 and D6 exhibit an horizontal convergent displacement of 0.1 mm approximately. These values are smaller than the computed displacements of inclinometers I1 and I3 heads but remain in the precision of this type of measurement (1 to 2 mm for a 20 m long inclinometer).
-120
-100
-80
-60
-40
-20
0
20
403/9/2004 3/10/2004 3/11/2004 3/12/2004Date
Def
orm
atio
n (µ
m/m
)
C1-C2
C2-D5
the cutting w heel reaches C1
reaches C2
reaches D5
Fig. 13. Ground surface horizontal extension – longitudinal profile Concerning the longitudinal horizontal strains measured with points C1, C2 and D5 (Fig.13), it appears that compression strains occurs once the TBM wheel has crossed the section and that no permanent strains are created by the excavation (especially for C1-C2).
Paper No. 6.14a 6

PORE PRESSURE CELLS Two pore pressure cells noted CPI1 and CPI2 have been installed in the tunnel axis, CPI2 is located within the TBM path and is destroyed during excavation and CPI1 is located 0.75 m above the tunnel crown but for technical reasons 1 m away from the monitoring section (Fig. 4). Figures 14 to 16 show the variation of pore pressure due to the tunnel excavation. A positive value corresponds to an increase in pore pressure. The reference values are considered 3 weeks before the TBM reaches the section, i.e. when it is 290 m before the section. The passage of the TBM is responsible for high variations of the pore pressures (between -80 and + 140 kPa from Fig. 15). Before that, both cells present almost identical slow sinusoidal variations (Fig. 14) due to variations of the water table level.
-20
-15
-10
-5
0
5
10
15
20
2/18/2004 2/23/2004 2/28/2004 3/4/2004 3/9/2004 3/14/2004 3/19/2004 3/24/2004 3/29/2004
Date
Varia
tion
of p
ore
pres
sure
(kPa
)
CPI 1CPI 2
cut of the computer link
stop
the TBM arrived at the station
stopstop
Fig. 14. Evolution of pore pressures in CPI1 and CPI2
-100
-50
0
50
100
150
03/09/04 18:00 03/10/04 06:00
Varia
tion
of p
ore
pres
sure
(kPa
)
Cutting wheel 6.4m before CPI 1 7.4m before CPI 2
Cutting wheel 3m before CPI 1 4m before CPI 2
Cutting wheel 1.6m before CPI 1 2.6m before CPI 2
Excavation under CPI 1
Cutting wheel 4.2m behind CPI 1excavation
stop
CPI 1
CPI 2
Fig. 15. Evolution of pore pressures in CPI1 and CPI2 Fig. 15 presents the pore pressure variations for CPI1 and CPI2 and relates them to the tunnel excavation sequences (boring + ring installation) until the TBM is +4.2 m from the section. It appears that the effect of the TBM progression is significant 7 m before the wheel reaches the section. The observed decrease of the pore pressure can be explained by the partial release of horizontal soil stresses even though a
confining pressure is used in the TBM working chamber. When the wheel is 3 m from the section, the pore pressure globally increases in each cell, with alternating periods of increase and decrease of the pressure that could be related to the excavation sequences. This evolution is observed until CPI2 is destroyed by the TBM wheel. Further on, pressure in CPI1 goes slowly back to its initial value when the TBM is +4.2 m from the section.
-100
-50
0
50
100
150
3/10/2004 05:00 3/10/2004 17:00
Date
Varia
tion
of p
ore
pres
sure
(kPa
)
CPI 1CPI 2Série3
Excavation of ring # 2585 without injection
Position of the cutting wheel against captor CPI 1 :
+ 4.20 m + 5.20 m+ 6.60 m
+ 8.00 m + 9.00 m+ 10.00 m
+ 11.40 m+ 12.80 m + 14.80 m
+ 13.80 m
Start of excavation of ring # 2578Cutting wheel 3 2 m behind CPI1
Fig. 16. Evolution of pore pressures in CPI1 and CPI2 Figure 16 presents the variation of pressure in CPI1 while the TBM goes from +4.2 m to +15 m from the section. The boring and grouting sequence (the two operations are performed at the same time) leads to a decrease in pore pressure. A sudden increase of the pressure is observed at the end of this sequence probably due to the fact that the grouting continues for a short time after the TBM wheel has stopped. The ring installation phase is generally associated with an decrease in pore pressure. At the beginning of the excavation of Ring # 2585, the grouting has not resumed (the grouting pipes are then located 3 m ahead of CPI1). It results in a large negative pore pressure variation while 0.3 m of soil have been excavated. When the grouting resumes, the pressure goes quickly back to its initial value. After 15 m, the influence of the tunnel excavation and of the annular void grouting disappears. Figures 15 and 16 clearly show that each stop of the TBM (either for technical reasons or for ring installation) enables the dissipation of an important amount of the excess pore pressures induced by the excavation. This dissipation is very quick: for example at the end of the excavation of Ring # 2584, an excess pore pressure of 61 kPa is measured while 2 hours later the pressure has gone back to its initial value. INDUCED STRAINS IN THE CONCRETE LINING Strains in the concrete lining segments are measured by 5 pairs of vibrating wire strain gauges (Fig. 17).
Paper No. 6.14a 7

n° 550
n° 555
n° 556
n° 554
n° 553
n° 552n° 551
n° 549
n° 558n° 557
Fig. 17. Location of the vibrating wire strain gauges in the concrete lining
-100
-80
-60
-40
-20
0
20
40
60
80
100
0 5 10 15 20 25 30
Time (days)
Def
orm
atio
n ( µ
m/m
)
547 548 549 550 551
552 553 554 555 556
Fig. 18. Induced strains in the concrete lining Figure 18 shows the evolution of the strains in each gauge (a negative value corresponds to compressive strain). Most of the gauges are compressed after the installation of the ring segments, the maximum value is 60 µm/m and could be related to an increase in hoop stress of only 0.8 MPa. For each pair, the difference in strain (representing the bending moment induced in the ring) is negative for 3 pairs and close to 0 for pair 549-550 and 551-552. This indicates that the ring is slightly ovalized, the long axis of the ellipse being close to the vertical direction. This mechanism is coherent with the horizontal movements measured by the inclinometers and the ground surface vertical movements obtained by precise levelling. The same type of results have been obtained on other sections of the Toulouse subway B, not only for EPB tunnel boring machines (Emeriault et al. 2005a). SUMMARY OF THE SOIL DISPLACEMENTS A total displacement field can be deduced from the levelling, inclinometer and borehole extensometer measurements. For example on Fig. 19, the obtained field is presented when the TBM is 18 m away from the section. Vertical displacements are limited while horizontal convergence movements are concentrated in the vicinity of the tunnel and reach 3.5 mm. The soil above the tunnel heaves and since the vertical displacements are identical at ground surface
and close to the tunnel crown, a global upwards movement can be observed. These results are similar to those obtained by Vanoudheusden et al. (2005a) and Emeriault et al. (2005b) for other sections of Toulouse subway line B or by Vanoudheusden et al. (2005b) for the excavation of a similar gallery with a traditional method. During the excavation of several stations of Toulouse subway line B, large horizontal movements compared to the settlements have also been measured (Bonnet-Eymard 2005b, Vanoudheusden et al. 2005c). The unusual features of the soil displacement field are essentially due to the high K0 value due to overconsolidation (Serratrice 2005).
Fig. 19. Total displacement field (+18 m) TBM PARAMETERS Excavation parameters are automatically recorded and give information on the variation of the torque on the cutting wheel, the advancement rate, the confining pressure, the injection of annular void between soil and the concrete tunnel lining. In the vicinity of the monitoring section, the advancement rate is almost constant equal to 25 m / day. The confining pressure inside the TBM working chamber measured at the top of it is reported in Fig. 20: an average pressure is determined for each ring from the data collected every 2 s by the machine. Rings # 2560 to 2625 correspond to a position of the TBM between -
Paper No. 6.14a 8
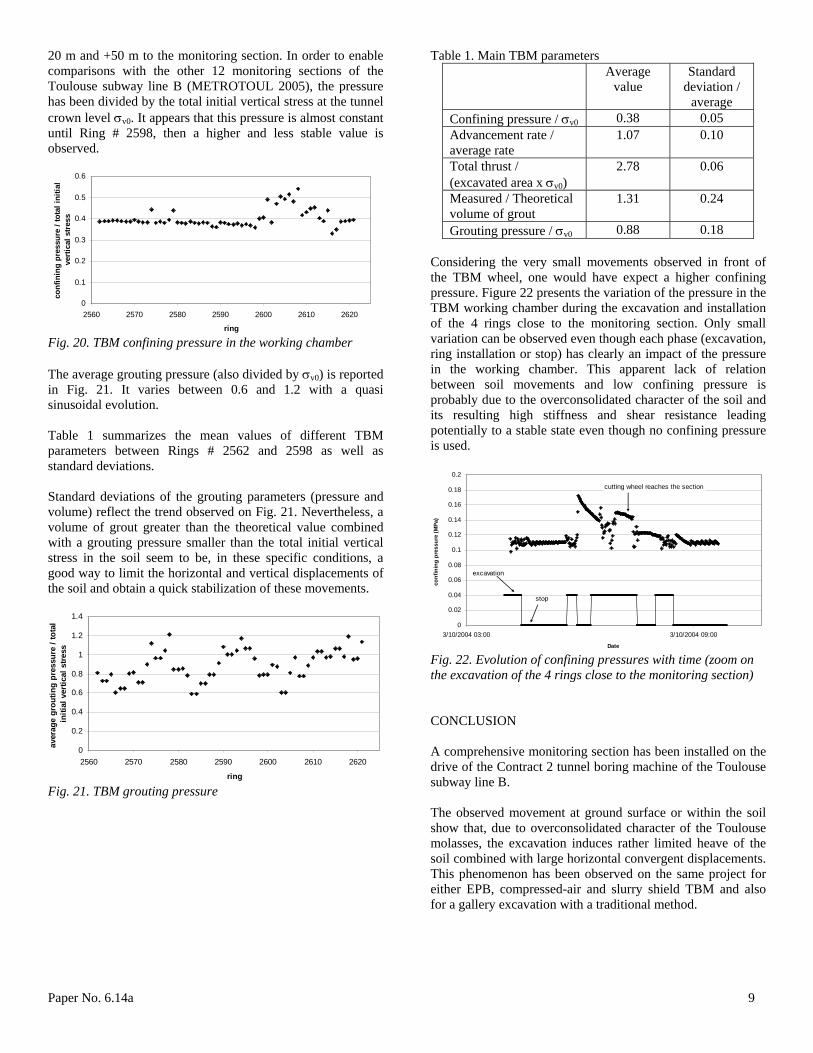
20 m and +50 m to the monitoring section. In order to enable comparisons with the other 12 monitoring sections of the Toulouse subway line B (METROTOUL 2005), the pressure has been divided by the total initial vertical stress at the tunnel crown level σv0. It appears that this pressure is almost constant until Ring # 2598, then a higher and less stable value is observed.
0
0.1
0.2
0.3
0.4
0.5
0.6
2560 2570 2580 2590 2600 2610 2620
ring
conf
inin
g pr
essu
re /
tota
l ini
tial
vert
ical
str
ess
Fig. 20. TBM confining pressure in the working chamber The average grouting pressure (also divided by σv0) is reported in Fig. 21. It varies between 0.6 and 1.2 with a quasi sinusoidal evolution. Table 1 summarizes the mean values of different TBM parameters between Rings # 2562 and 2598 as well as standard deviations. Standard deviations of the grouting parameters (pressure and volume) reflect the trend observed on Fig. 21. Nevertheless, a volume of grout greater than the theoretical value combined with a grouting pressure smaller than the total initial vertical stress in the soil seem to be, in these specific conditions, a good way to limit the horizontal and vertical displacements of the soil and obtain a quick stabilization of these movements.
0
0.2
0.4
0.6
0.8
1
1.2
1.4
2560 2570 2580 2590 2600 2610 2620
ring
aver
age
grou
ting
pres
sure
/ to
tal
initi
al v
ertic
al s
tress
Fig. 21. TBM grouting pressure
Table 1. Main TBM parameters Average
value Standard
deviation / average
Confining pressure / σv0 0.38 0.05 Advancement rate / average rate
1.07 0.10
Total thrust / (excavated area x σv0)
2.78 0.06
Measured / Theoretical volume of grout
1.31 0.24
Grouting pressure / σv0 0.88 0.18 Considering the very small movements observed in front of the TBM wheel, one would have expect a higher confining pressure. Figure 22 presents the variation of the pressure in the TBM working chamber during the excavation and installation of the 4 rings close to the monitoring section. Only small variation can be observed even though each phase (excavation, ring installation or stop) has clearly an impact of the pressure in the working chamber. This apparent lack of relation between soil movements and low confining pressure is probably due to the overconsolidated character of the soil and its resulting high stiffness and shear resistance leading potentially to a stable state even though no confining pressure is used.
0
0.02
0.04
0.06
0.08
0.1
0.12
0.14
0.16
0.18
0.2
3/10/2004 03:00 3/10/2004 09:00
Date
conf
inin
g pr
essu
re (M
Pa)
cutting wheel reaches the section
excavation
stop
Fig. 22. Evolution of confining pressures with time (zoom on the excavation of the 4 rings close to the monitoring section) CONCLUSION A comprehensive monitoring section has been installed on the drive of the Contract 2 tunnel boring machine of the Toulouse subway line B. The observed movement at ground surface or within the soil show that, due to overconsolidated character of the Toulouse molasses, the excavation induces rather limited heave of the soil combined with large horizontal convergent displacements. This phenomenon has been observed on the same project for either EPB, compressed-air and slurry shield TBM and also for a gallery excavation with a traditional method.
Paper No. 6.14a 9

Horizontal strain have been measured on this section in almost greenfield conditions: there is a global coherence with the observed “settlement” trough. These horizontal strains remain limited and would not cause any damage to building if there were any. The pore pressure measurement indicate a close interaction with the excavation phases (boring, stop or ring installation). ACKNOWLEDGMENTS The authors would like to thank for their financial support the French Ministry of Research and the Réseau Génie Civil & Urbain (RGC&U). They also would like to acknowledge the help of the different contractors in collecting data. REFERENCES Boscardin, M.D. and Cording, E.J. [1989], “Building response to excavation induced settlement”. Journal of Geotechnical Engng., ASCE, Vol. 115, No 1, pp. 1-21.
Bowers, K.H. and Moss, N.A. [2005], “Settlement due to tunnelling on the CTRL London Tunnels”, Proc. 5th Symp. on Geotechnical Aspects of Underground Construction in Soft Ground, K.J. Bakker et al. eds, Amsterdam, 15-17 june 2005, pp 203-209.
Bonnet-Eymard, T., Emeriault, F., Kastner, R., Lamballerie, J.-Y., Robert, J. and Reynaud B. [2005a], « Effets sur le bâti existant du creusement par tunnelier à pression de terre - Cas d’une section de mesure sur le chantier du métro de Toulouse. » XVIème Congrès International de Géotechnique et Mécanique des Sols. Osaka (Japon), 12/09/2005 – 16/09/2005. p. 1595-1598.
Bonnet-Eymard, T., Emeriault, F., Kastner, R., Vanoudheusden, E. and Lamballerie, J.-Y. [2005b], “Movements induced on existing masonry buildings by the excavation of a station of Toulouse subway line B”. Geotechnical aspects of underground construction in soft ground. AMSTERDAM (Netherlands), 15/06/2005-17/06/2005. p.19-24.
Burland J.B. [1995], “Assessment of risk of damage to buildings due to tunnelling and excavation”. Proc. 1st Int. Conf. Earthquake Geot. Eng., IS-Tokyo ’95
Clough, G.W., Sweeney, B.P. and Finno, R.J. [1983], “Measured soil response to EPB shield tunnelling”, ASCE Journal of Geotechnical Engineering, 109 (2), pp. 131-149.
Emeriault., F., Bonnet-Eymard, T., Kastner., R., Vanoudheusden, E., Petit, G., Robert, J., Lamballerie, J.-Y. and Reynaud B. [2005a], “Analysis of ground movements induced by tunnelling: comparison of the earth-pressure balanced, slurry shield and compressed-air TBM techniques on Toulouse subway line B”. Underground Space Use -
Proceeding of the 31st ITIA-AITES World Tunnel Congress. Erdem & Solak eds BALKEMA, Istanbul (Turquie), 07/05/2005-12/05/2005. p.841-848.
Emeriault., F., Bonnet-Eymard, Vanoudheusden, E. and Lamballerie, J.-Y. [2005], « Creusement de tunnel par tunnelier à pression d'air : mouvements induits et effets sur le bâti existant - Cas du Lot 3 de la ligne B du métro de Toulouse ». Conférence Internationale GeoCity Net. Lille (France), 10/10/2005-11/10/2005. 8p.
Lee, K.M., Ji, H.W., Shen, C.K., Liu, J.H. and Bai, T.H. [1999], “Ground response to the construction of Shanghai Metro Tunnel-Line 2”, Soil and Foundations, 39 (3), pp. 113-134.
Matsushita, Y., Iwasaki, Y., Hashimoto, T. and Imanishi, H. [1995], “Behaviour of subway tunnel driven by large slurry shield”, Underground Construction in Soft Ground, pp. 253-256.
Melis, M., Arnaiz, M., Oteo, C.S. and Mendana F. [1997], “Ground displacements in Madrid soils due to tunnel excavation with earth pressure TBM”, International Conference on Soil Mechanics and Foundation Engineering, Hamburg, pp. 1433-1436.
METROTOUL [2005], Rapport final du projet de recherche METROTOUL, novembre 2005.
Ollier, C. [1997], Etude expérimentale de l’interaction sol-machine lors du creusement d’un tunnel peu profound par tunnelier à pression de boue, PhD thesis, INSA de Lyon, France.
Pantet, A. [1991], Creusement de galleries à faible profondeur à l’aide d’un tunnelier à pression de boue. Mesures in-situ et etude théorique du champ de déplacement, PhD thesis, INSA de Lyon, France.
Peck, R.B. [1969], “Deep excavations and tunneling in soft ground”, Proceedings of the 7th International Congress of Soil Mechanics and Foundation Engineering, Mexico, pp. 225-285.
Robert, J., Vanoudheusden, E., Emeriault, F. and Kastner, R. [2007], “Soil deformation analysis during TBM excavation: comparing three different TBM technologies used during the construction of the Toulouse Metro Line B”. RETC Conference, Toronto, Canada, 10/06/07 – 13/06/07, 15 pages
Serratrice, J.F. [2005], « Métro de Toulouse – Ligne B. Essais de laboratoire. Avril Août 2005. Rapport du LRPC d’Aix en Provence, CETE Méditerranée, du 12/10/2005 ». Unpublished report.
Vanoudheusden, E. [2006], Impact de la construction de tunnels urbains sur les mouvements de sol et le bâti existant. Incidence du mode de pressurisation du front, PhD thesis, INSA de Lyon, France.
Paper No. 6.14a 10

Vanoudheusden, E., Petit, G., Robert, J., Emeriault, F., Kastner, R., Lamballerie, J.-Y. and Reynaud, B. [2005a], “Analysis of movements induced by tunnelling with an earth-pressure balance machine and correlation with excavating parameters”. Geotechnical aspects of underground construction in soft ground. AMSTERDAM (Pays-bas), 15/06/2005-17/06/2005. p.81-86.
Vanoudheusden, E., Petit, G., Robert, J., Emeriault, F., Kastner, R., Lamballerie, J.-Y. and Reynaud, B. [2005b], “Impact on the environment of a shallow gallery excavated in Toulouse's molasse by a conventional method.” Underground Space Use - Proceedings of the 31st ITA-AITES world tunnel Congress. Erdem & Solak eds BALKEMA, Istanbul (Turquie), 07/05/2005-12/05/2005. p.1219-1225
Vanoudheusden, E., Petit, G., Robert, J., Emeriault, F. and Kastner, R. [2005c], « Comportement d'une paroi moulée en site urbain : modélisations et mesures ». XVIème Congrés International de Géotechnique et Mécanique des Sols. Osaka (Japon), 12/09/2005-16/09/2005. p. 1141-1144.
Wongsaroj, J., Borghi, X., Soga, K., Mair, R.J., Sugiyama, T, Hagiwara T. and Bowers, K.H. [2005], “Effect of TBM driving parameters on ground surface movements : Channel Tunnel Rail Link Contract 220”, Proc. 5th Symp. on Geotechnical Aspect of Underground Construction in Soft Ground, K.J. Bakker et al. eds, Amsterdam, 15-17 june 2005,pp. 335-341.
Paper No. 6.14a 11