movement ecology of philippine birds of prey
TRANSCRIPT

Graduate Theses, Dissertations, and Problem Reports
2017
Movement Ecology of Philippine Birds of Prey Movement Ecology of Philippine Birds of Prey
Camille B. Concepcion
Follow this and additional works at: https://researchrepository.wvu.edu/etd
Recommended Citation Recommended Citation Concepcion, Camille B., "Movement Ecology of Philippine Birds of Prey" (2017). Graduate Theses, Dissertations, and Problem Reports. 5385. https://researchrepository.wvu.edu/etd/5385
This Dissertation is protected by copyright and/or related rights. It has been brought to you by the The Research Repository @ WVU with permission from the rights-holder(s). You are free to use this Dissertation in any way that is permitted by the copyright and related rights legislation that applies to your use. For other uses you must obtain permission from the rights-holder(s) directly, unless additional rights are indicated by a Creative Commons license in the record and/ or on the work itself. This Dissertation has been accepted for inclusion in WVU Graduate Theses, Dissertations, and Problem Reports collection by an authorized administrator of The Research Repository @ WVU. For more information, please contact [email protected].

Movement ecology of Philippine birds of prey
Camille B. Concepcion
Dissertation submitted to the Davis College of Agriculture, Natural Resources and Design at West Virginia University
in partial fulfillment of the requirements for the degree of
Doctor of Philosophy in
Forest Resources Science
Petra B. Wood, Ph.D., Chair James T. Anderson, Ph.D. Keith L. Bildstein, Ph.D. Todd E. Katzner, Ph.D.
Brenden E. McNeil, Ph.D.
School of Natural Resources
Morgantown, West Virginia 2017
Keywords: Movement ecology, Philippines, Grey-faced buzzard, Philippine serpent eagle, East Asian Oceanic-Flyway, Migration, Island endemic
Copyright 2017 Camille B. Concepcion

ABSTRACT
Movement ecology of Philippine birds of prey
Camille B. Concepcion
Movement ecology is an emerging paradigm important to conservation biology and
to the protection of global biodiversity. I used two common, but poorly known
Philippine birds of prey as study tools in understanding movement ecology. One
species is the migratory grey-faced buzzard (Butastur indicus), a raptor that which
visits the islands in large numbers in winter. The other is the resident Philippine
serpent eagle (Spilornis holospilus) which lives there at relatively high population
density year-round. I used migration data at two terrestrial hawkwatch sites to
assess how weather correlates influenced the movement behaviors of grey-faced
buzzards. The grey-faced buzzard was the second most common raptor migrant
using the Philippines as part of their migration route. My models show that they are
more likely observed, either initiating or completing over-water crossings, in
headwinds. I also created spatial models to understand how grey-faced buzzards
overcome movement barriers (i.e. ocean). Modeled buzzard routes across the
Philippines were between 1,582 and 2,970 km, and all repeatedly crossed water.
Some of the routes overlapped at long and unavoidable over-water crossings. My
models suggest that the optimal strategy for these birds is to find the shortest route
to an exit point with the greatest possible access to stopover habitats and fewest
over-water crossings under wind resistance. Additionally, I used road survey data to
determine habitat associations of Philippine serpent eagle abundance across central
and eastern Mindanao. My model showed that detection probability for the
Philippine serpent eagle is relatively low, and the probability of occupancy was
highest in near-pristine forests, especially low elevation dipterocarp forests. My
road surveys helped establish the beginning of the breeding season for the
Philippine serpent eagle. They also provided initial information on wintering
habitats for grey-faced buzzards. This work is cutting-edge ecology and also

provided natural history information about species for which there is almost no
existing knowledge.

iv
DEDICATION
For my Lolo (grandpa) Fred -
As usual, you were right. This is more amazing than flying airplanes.

v
ACKNOWLEDGMENTS I am grateful for my mentors, Dr. Todd Katzner and Dr. Keith Bildstein, for taking me
under their golden eagle and turkey vulture wings.
To Todd, who has not yet grown tired of me taking advantage of his knowledge and
connections. I would have probably stopped pursuing raptors if it weren’t for you. I
owe you a lot. Thank you.
To Keith, who introduced me to the wonderful world of migration. You have
renewed my love for raptor ecology. Thank you for the training and funding my
work.
To Dr. Petra Wood, thank you for adopting me.
I also thank my other committee members, Dr. Jim Anderson and Dr. Brenden
McNeil, for their help and thoughtful reviews.
I thank the Project Soar Grant from Hawk Mountain Sanctuary (U.S.A.) and The
Sperry Fund Scholars in Raptor Conservation Science for funding my Ph.D.
Additional funding also came from the Lewis and Clark Exploration Fund, the
William A. Burnham Memorial Fund, and the Peregrine Fund.
I am grateful for the assistance of the Biodiversity Management Bureau, especially
Director Theresa Mundita S. Lim, D.V.M., Mr. Carlo Custodio and Mrs. Josefina De
Leon. I also thank the Department of Environment and Natural Resources regional
offices for regions II, X, XI and XII. The support of the local government units of the
province of Batanes, and the towns of Arakan, Basco, Governor Generoso, Ivana,
Lantapan, and San Isidro was invaluable.
To my Hawk Mountain family, thank you for being my home in the US of A. I
appreciate all the cheese fries and enjoyed all the skipping.
To members of Katzner Lab, past and present - A. Dennhardt, S. Behmke, M. Braham,
B. Drahota, A. Duerr, J. Hall, M. Jensen, T. Miller, M. Paulson, S. Poessel, V. Slabe, C.
Slover, L. Stiffler, M. Sur, M. Wheeler – who were forced to be my friends. Thank you.

vi
Special thanks to Adam Duerr for all the help with setting up and interpreting some
of my models.
To my amazing field family, Pat Dumandan, Tracy Prado, Marvin Tancio, Perfecto
Balicao, and Emiliano “Blacky” Lumiston. I am proud to call you my friends. You
made the mud fun again. We should make all efforts to avoid the puddles.
To all the communities who gave me a home, you are my people. You have all
enriched my life with your generosity, support and love.
I am grateful to my parents, Nap and Beng, who encouraged me to find my passion,
whatever it may be. You cheered for your only daughter as she climbed mountains,
lived in the middle of the forest, and even as she developed all sorts of allergies. You
are my rock and inspiration. My brothers, Butch and Lance, are weird, but I love
them. Thankfully, their wives, Jen and CJ, make them better. Lance gets half a bonus
point for having fathered my adorable niece, Carra Isabelle. I thank my lola
(grandma) Sylvia for always laughing at the jokes I learned on field.
To my husband, Medel, you are my cheerleader, my lethal protector, and my best
friend. You showed me my first Philippine eagle and taught me how to do this whole
“field” thing. You are my favorite and I adore you a lot.
Like the song says, “ang kinabuhi ko o Dios, Kanimo lamang.”

vii
TABLE OF CONTENTS ABSTRACT................................................................................................................................... ..................ii DEDICATION………………..........................................................................................................................iv ACKNOWLEDGEMENTS...........................................................................................................................v TABLE OF CONTENTS............................................................................................................................vii CHAPTER 1: LIST OF FIGURES..............................................................................................................x CHAPTER 2: LIST OF TABLES..............................................................................................................xi CHAPTER 2: LIST OF FIGURES...........................................................................................................xii CHAPTER 3: LIST OF TABLES............................................................................................................xiii CHAPTER 3: LIST OF FIGURES..........................................................................................................xiv CHAPTER 4: LIST OF TABLES.............................................................................................................xv CHAPTER 4: LIST OF FIGURES..........................................................................................................xvi CHAPTER 5: LIST OF TABLES...........................................................................................................xvii CHAPTER 5: LIST OF FIGURES.......................................................................................................xviii CHAPTER 5: LIST OF APPENDICES.................................................................................................xix CHAPTER 1....................................................................................................................................................1 Introduction………………………………………………………………………………....................................1
Rationale...............................................................................................................................................2 Focal species........................................................................................................................................5
Objectives..............................................................................................................................................6 Methods…..............................................................................................................................................7 Study area…………..........................................................................................................................7 Data collection…......................................................................................................................... ...9 Limitations of the study.............................................................................................................11 Natural history information....................................................................................................12 Contents of the dissertation....................................................................................................13 References.........................................................................................................................................14 CHAPTER 2.................................................................................................................... .............................20 Conservation threats and priorities for raptors across Asia................................................20 Abstract............................................................................................................................. ...................21
Introduction......................................................................................................................................22 Threats to Asian raptors..........................................................................................................23 Methods………………….....................................................................................................................24 Results..................................................................................................................................................25 Discussion............................................................................................................................. .............28 Overview……………………............................................................................................................28 Threats...........................................................................................................................................29 Priority species............................................................................................................................33

viii
Priority regions and countries..............................................................................................34 Priority topics for research....................................................................................................35 Conclusions............................................................................................................................. ..........37 Acknowledgements............................................................................................................. .........39 References.........................................................................................................................................39 CHAPTER 3.................................................................................................................................................62 Species composition, timing, and weather correlates of autumn open-water crossings by raptors migrating along the East-Asian Oceanic Flyway……......................62
Abstract................................................................................................................. ..............................63 Introduction......................................................................................................................................64
Methods............................................................................................................... ................................66 Study areas...................................................................................................................................66 Survey techniques…...................................................................................................................67 Data analysis................................................................................................................................68 Results..................................................................................................................................................69 Timing of migration..................................................................................................................69 Direction of migration..............................................................................................................71 Migration and weather............................................................................................................71 Among-species differences in behavior..............................................................................73 Discussion.......................................................................................................... ................................74 Timing of flights…………............................................................................................................74 Meteorological and behavioral correlates of ocean crossing flights......................75 Species differences in flight behavior.................................................................................77 Overwater crossing as an influence on raptor migration...........................................77 Acknowledgements......................................................................................................................79 Literature cited...............................................................................................................................80 CHAPTER 4.................................................................................................................................................92 Abundance of island avian predators in a heavily impacted tropical forest suggests that endemics face greatest risk from landscape changes…….............................................92
Abstract................................................................................................................. ..............................93 Introduction......................................................................................................................................94
Methods................................................................................................................. ..............................95 Study area.....................................................................................................................................95 Survey techniques.......................................................................................................................97 Data analysis............................................................................................................................. ...98 Results..................................................................................................................................................99 Raptor communities within central and eastern Mindanao…………………………..99 Among-species differences in detection and occupancy...........................................100 Discussion............................................................................................................................. ..........102 Acknowledgements....................................................................................................................104 References.......................................................................................................................................105

ix
CHAPTER 5...............................................................................................................................................118 Modeled island hopping through the Philippines demonstrates trade-offs migrant birds face during oceanic crossings ……......................................................................................118
Summary................................................................................................................. .........................119 Introduction...................................................................................................................................120
Methods................................................................................................................. ...........................122 Study area..................................................................................................................................122 Focal species..............................................................................................................................122 Modeling approach.................................................................................................................123 Model input data......................................................................................................................124 Calculating movement costs................................................................................................125 Determining movement possibilities and optimum paths.......................................126 Validation…………………………................................................................................................128 Results...............................................................................................................................................128 Route variation and trade-offs in migratory response.............................................128 Possible autumn migratory routes and movement funnels....................................131 Model validation……………………………………………………………………………………..…132 Discussion.......................................................................................................... .............................133 Trade-offs in migratory response......................................................................................133 Exit points according to migration strategy.................................................................135 Optimal migration strategy.................................................................................................136 Acknowledgements....................................................................................................................138 References.......................................................................................................................................139

x
CHAPTER 1: LIST OF FIGURES FIGURE 1. Geographic locations of study areas around the Philippines. Left inset shows the entire Philippines. Figure part (A) shows the location of the watchsite () at Basco and part of Taiwan, which is 180 km north, and mainland Luzon of the Philippines, 280 km south. Top right map (B) shows the location of the watchsite () at Cape San Agustin found in the island of Mindanao, as well as the northernmost islands of Indonesia (Sulawesi), 170 km south. Bottom inset (C) shows the distribution of areas where 10-km road transects ( ) where surveyed. Areas shaded grey in c have at least 50% tree cover and are from Bartholomé and Belward (2005) and Hansen et al (2013). Outlines in c show town boundaries of study sites……………………………………………...................................................................................18
Polylines

xi
CHAPTER 2: LIST OF TABLES TABLE 1. Distribution and conservation status of raptors in the world and in Asia based on BirdLife International (2017). Migratory species include species with a significant portion of populations that make seasonal, cyclical and predictable movements. Endemic species are species that breed in a single country.......................52 TABLE 2. Asia’s Critically Endangered (CR) and Endangered (EN) raptor species based on BirdLife International (2017). Migratory species include species with a significant portion of populations that make seasonal, cyclical and predictable movements. Endemic species are species that breed in a single country.......................53 TABLE 3. Summary of ongoing threats to globally Threatened and Near-Threatened diurnal and nocturnal raptor species of Asia. Threats are based on BirdLife International (2017). Percentages represent proportions of Threatened and Near-Threatened species in Asia..................................................................................................................55 TABLE 4. Summary of distribution and conservation status of raptors in according to regions of Asia based on BirdLife International (2017). Migratory species include species with a significant portion of populations that make seasonal, cyclical and predictable movements. Endemic species are species that breed in a single country. Percentages indicate proportion of Threatened and Near-Threatened migratory and endemic species…………………………………………………………………………………………………56 TABLE 5. Summary of distribution and conservation status of raptors in ten Asian countries with the most Threatened and Near-Threatened raptor species based on BirdLife International (2017). Migratory species include species with a significant portion of populations that make seasonal, cyclical and predictable movements. Endemic species are species that breed in a single country. Percentages indicate proportion of Threatened and Near-Threatened migratory and endemic species....57

xii
CHAPTER 2: LIST OF FIGURES FIGURE 1. Regional Asia. Country boundaries are from the Global Administrative Areas database (www.dabm.org) and, in some regions (e.g., borders of India with Pakistan and China), are not fixed owing to on-going territorial disputes (Fravel 2015). The Middle East is not included………………………………………………………………59 FIGURE 2. Population trends of Asian raptors. Population trends are based on BirdLife International (2017). Population trend is either directly estimated or suspected based on existing threats and other factors. Population estimates were not taken in the same year and global population sizes have been estimated between 1999 to 2016..........................................................................................................................60 FIGURE 3. Species status of Asian raptors found in the five most occupied land types. Conservation status and land types are based on BirdLife International (2017)……61

xiii
CHAPTER 3: LIST OF TABLES TABLE 1. Migratory raptors counted at Basco (25 August – 19 October 2014) and Cape San Agustin (12 September – 30 October 2012), Philippines…..……………………85

xiv
CHAPTER 3: LIST OF FIGURES FIGURE 1. Geographic locations of watchsites in the Philippines where migration counts
were conducted in 2012 (Cape San Agustin) and 2014 (Basco). Map on the left shows the
entire Philippines with the location of watchsites (). The top right inset (a) shows the
location of the watchsite at Basco and part of Taiwan, which is 180 km north, and
mainland Luzon of the Philippines, 280 km south. The bottom right map (b) shows the
location of the watchsite at Cape San Agustin found in the island of Mindanao, as well as
the northernmost islands of Indonesia (Sulawesi), 170 km south……………………….86 FIGURE 2. Within-season distribution of autumn migration flights observed at (a) Basco
(25 August – 19 October 2014) and (b) Cape San Agustin (12 September – 30 October
2012), Philippines. Vertical dashed line shows the first day that migration was observed.
Asterisks show the first and last days of count. These data did not allow us to assess
interannual variation in migration behavior. Because sampling periods were not identical,
the start and end of some seasonal distributions may not be represented in these data…87
FIGURE 3. Time of day of autumn migration flights observed at Basco (25 August – 19
October 2014) and Cape San Agustin (12 September – 30 October 2012), Philippines.
Migration flights were observed from 0530 H to 1730 H (Basco) and 0600 H to 1530 H
(Cape San Agustin)………………………………………………………………………88 FIGURE 4. Average passage rates of all raptors counted per hour during different (a) wind
directions and (b) wind speeds (m/sec) during autumn migration at Basco (25 August –
19 October 2014) and Cape San Agustin (12 September – 30 October 2012), Philippines.
Standardized categories for wind speeds were based on the Beaufort scale (Hasse
2015)……………………………………………………………………………………89
FIGURE 5. Coefficient estimates for generalized linear mixed models for weather
conditions associated with hourly autumn passage rates for Basco (25 August – 19
October 2014) and Cape San Agustin (12 September – 30 October 2014), Philippines. U
and V wind components were measured using handheld, digital anemometer. Cloud
cover was the estimated percent of sky with background cloud cover. Bars represent 95%
confidence intervals. Statistical significance indicated by number of asterisks: * indicates
P <0.05, ** indicates P <0.01, *** indicates P <0.001)…………………………………90 FIGURE 6. Coefficient estimates for generalized linear model for weather conditions
associated with Accipiter and Grey-faced Buzzard hourly autumn passage rates for (a)
Basco (25 August – 19 October 2014) and (b) Cape San Agustin (12 September – 30
October 2012), Philippines. U and v wind components were measured using handheld,
digital anemometer. Cloud cover was the estimated percent of sky with background cloud
cover. Bars represent 95% confidence intervals. Statistical significance indicated by
number of asterisks: * indicates P <0.05, ** indicates P <0.01, *** indicates P <0.001)
……………………………………………………………………………………………91

xv
CHAPTER 4: LIST OF TABLES TABLE 1. Number of birds of prey observed around central and eastern Mindanao, 2014-2016. Surveys were conducted between November and December each year. Standard deviations are provided. Conservation status are based on IUCN (BirldLife International 2017) and are either Least Concern (LC), Endangered (EN) or Critically Endangered (CR). Migratory status is either resident (R) or Migratory (M). Habitat specialists (S), habitat generalists (G), and “intermediate” species (I) are also identified. ……………………………………………………………………………...111 TABLE 2. Model selection table describing detection probability and occupancy of birds of prey around central and eastern Mindanao. These models estimate intensity (λ) and individual detection probability (r) parameters. We set individual detection probability and occupancy to be either constant (rconstant or λconstant) or to vary among the three survey years (rtime or λtime). We allowed the intensity parameter to be influenced by forest type and level of disturbance. Models are ranked according to increasing AICc values. For all raptors, lowest AIC = 3421.65, for Brahminy Kites, AIC = 2397.66, and for Philippine Serpent Eagles, AIC = 1503.08………………….…….113 TABLE 3. Model averaged parameter estimates for models describing detection and occupancy probabilities of Brahminy Kites, Philippine Serpent Eagles and all raptors considered together. Our models estimated the binomial sampling probability that a particular individual is detected (r), and the Poisson intensity parameter of occupancy (λ) at each point. Global detection and transect-specific occupancy probability parameters were calculated from r and λ. Standard errors are provided………………………………………………………………………………………………………….114 TABLE 4. Study site-specific modeled estimates of numbers of Brahminy Kites, Philippine Serpent Eagles, and all raptors combined. We used the beta coefficients of intensity parameter (λ), and the influence of forest type and level of disturbance to estimate abundance or raptors in each location…………………………...…………………....115

xvi
CHAPTER 4: LIST OF FIGURES FIGURE 1. Distribution of areas surveyed around central and eastern Mindanao, Philippines. Inset on the top left shows the entire Philippines; island of Mindanao is shaded. Enlarged map of Mindanao shows the locations of the 5 study areas. Figure part (a) shows the fixed 10-km transect ( ) surveyed in Lantapan. Middle map (b) shows the fixed 10-km transect surveyed in Davao City and Arakan. Right map (c) shows the fixed 10-km transect surveyed in San Isidro and Governor Generoso. Areas shaded grey in a, b, and c have at least 50% tree cover and are from Bartholomé and Belward (2005) and Hansen et al (2013). Outlines in a, b and c show town boundaries. Forests nearest to study areas are identified…………………116 FIGURE 2. Number of individuals of Brahminy kites, Philippine serpent eagles and all raptors combined counted according to forest type and level of disturbance. Forest type is either high elevation montane or low elevation dipterocarp forest. Level of disturbance is categorized as near-pristine (or low disturbance), moderate or severe………………………………………………………………………………………………………….......117
Polylines

xvii
CHAPTER 5: LIST OF TABLES TABLE 1. Characteristics of 20 modeled Grey-faced Buzzard autumn migratory routes leading to four logical exit points in the south of the Philippines. These routes were modeled using 5 different cost raster datasets as follows: Stopover distances only; Wind costs only; Stopover distances * Wind costs; Wind costs * Over-water costs; and Wind costs * Over-water costs * Stopover distances. See text for additional details……………………………………………………………………………………………………………...147 TABLE 2. Means and standard deviations (SD) of distance from modeled routes to 29 observations of Grey-faced Buzzards during migration season and to 87 random points. Also shown are results of Mann Whitney U tests to compare distances of observation points and of random points to each of the 20 modeled migratory routes using 5 different cost raster datasets as described in Table 1. Significant p-values are bold………………………………………………………………………………………………...150

xviii
CHAPTER 5: LIST OF FIGURES FIGURE 1. Geographic locations of migratory entry () and exit points () in the Philippines. The Philippine archipelago is divided into three island groups: Luzon in the north, Visayas in the middle, and Mindanao in the south. The entry point of Batan is 180 km south of Taiwan and 280 km north of mainland Luzon. The exit point of Balabac is 70 km north of Borneo, while Bongao is 60 km east of Borneo. Balut Island is 180 km north of Indonesia, while Cape San Agustin is 200 km north. Also shown are four potential migration funnels (shaded gray) that were identified based on modeled Grey-faced Buzzard migratory routes. (A) At eastern and central Luzon, a bottleneck passes along the Sierra Madre Mountains, the longest mountain range in the country. (B) An unavoidable 70 km over-water crossing exists between the islands of Mindoro and Palawan. (C) A bottleneck between the islands of Negros and Zamboanga del Norte includes a 50 km over-water crossing. (D) An unavoidable 20 km over-water crossing exists between the island of Leyte and Surigao on Mindanao Island……………………………………………………………………………………………....151 FIGURE 2. Migratory routes of hypothetical Grey-faced Buzzards migrating through the Philippines modeled using 5 different cost of movement datasets and exiting the country at Balut Island (because of space considerations, modeled routes to four other exit points are shown in the SI). Modeled routes demonstrate trade-offs between response to external factors and were modeled using (A) costs of moving between stopover sites only (2,408 km); (B) cost of wind direction only (1,810 km); (C) combined costs of stopover distances and wind direction (2,410 km); (D) combined costs of wind direction and over-water travel (1,981 km); and (E) combined costs of distances between stopover sites, costs of wind direction and over-water travel (2,506 km)……………………………………………………………………………153 FIGURE 3. Least costly (in terms of movement costs) migratory route alternatives based on different migration strategies of hypothetical Grey-faced Buzzards. Migration strategies considered (A) stopover distances only; (B) wind costs only; (C) stopover distances * wind costs; (D) wind costs * over-water costs; and (E) wind costs * over-water costs * stopover distances. Also shown is the distribution of observation points ( ) of Grey-faced Buzzards during migration. Observation points (n=29) were compiled from published, citizen-science and personal data and illustrate how modeled routes correspond to observed buzzard behavior…………154 FIGURE 4. Difference in distances of observations of Grey-faced Buzzards and random points to modeled routes grouped according to exit point. There are 5 modeled routes for each exit point. When observation points are closer on average to the routes, the difference is positive. When observation points are farther on average to the routes, the difference is negative…………………………………………………………………155

xix
CHAPTER 5: LIST OF APPENDICES TABLE A1. Land cover classifications according to the Global Land Cover (GLC) 2000 dataset (GLC 2003)…………………………………………………………………………………………..156 FIGURE A1. The five migratory routes of hypothetical Grey-faced Buzzards exiting through Balabac modeled using (A) costs of moving between stopover sites only (1,923 km); (B) cost of wind direction only (1,582 km); (C) combined costs of stopover distances and wind direction (1,923 km); (D) combined costs of wind direction and over-water travel (1,662 km); and (E) combined costs of distances between stopover sites, costs of wind direction and over-water travel (2,011 km) ………………………………………………………………………………………………………………………..157 FIGURE A2. The five migratory routes of hypothetical Grey-faced Buzzards exiting through Bongao modeled using (A) costs of moving between stopover sites only (2,527 km); (B) cost of wind direction only (1,798 km); (C) combined costs of stopover distances and wind direction (2,517 km); (D) combined costs of wind direction and over-water travel (2,419 km); and (E) combined costs of distances between stopover sites, costs of wind direction and over-water travel (2,970 km) ……………………………………………………………………………………………………………………….158 FIGURE A3. The five migratory routes of hypothetical Grey-faced Buzzards exiting through Cape San Agustin modeled using (A) costs of moving between stopover sites only (2,536 km); (B) cost of wind direction only (1,750 km); (C) combined costs of stopover distances and wind direction (2,535 km); (D) combined costs of wind direction and over-water travel (1,900 km); and (E) combined costs of distances between stopover sites, costs of wind direction and over-water travel (2,355 km) ………………………………………………………………………………………………………………………..159

1
CHAPTER 1
Introduction
Camille B. Concepcion1
1 Division of Forestry and Natural Resources, West Virginia University, Morgantown WV 26506 U.S.A.
2
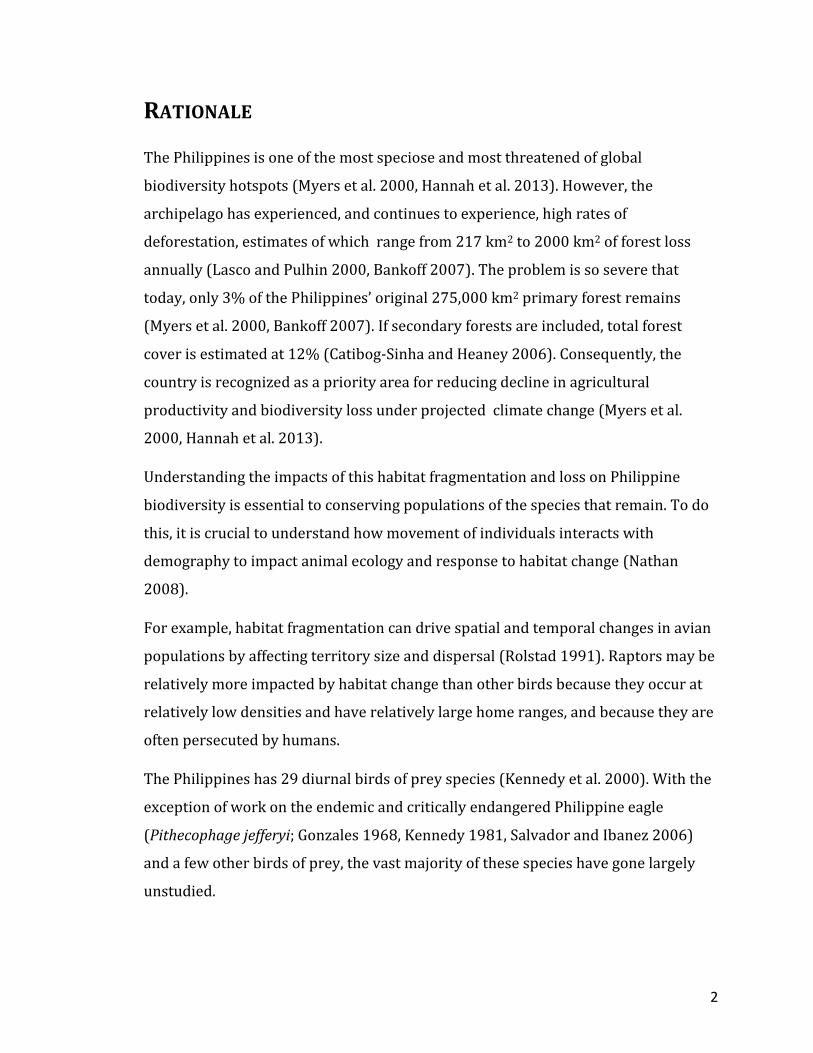
RATIONALE
The Philippines is one of the most speciose and most threatened of global
biodiversity hotspots (Myers et al. 2000, Hannah et al. 2013). However, the
archipelago has experienced, and continues to experience, high rates of
deforestation, estimates of which range from 217 km2 to 2000 km2 of forest loss
annually (Lasco and Pulhin 2000, Bankoff 2007). The problem is so severe that
today, only 3% of the Philippines’ original 275,000 km2 primary forest remains
(Myers et al. 2000, Bankoff 2007). If secondary forests are included, total forest
cover is estimated at 12% (Catibog-Sinha and Heaney 2006). Consequently, the
country is recognized as a priority area for reducing decline in agricultural
productivity and biodiversity loss under projected climate change (Myers et al.
2000, Hannah et al. 2013).
Understanding the impacts of this habitat fragmentation and loss on Philippine
biodiversity is essential to conserving populations of the species that remain. To do
this, it is crucial to understand how movement of individuals interacts with
demography to impact animal ecology and response to habitat change (Nathan
2008).
For example, habitat fragmentation can drive spatial and temporal changes in avian
populations by affecting territory size and dispersal (Rolstad 1991). Raptors may be
relatively more impacted by habitat change than other birds because they occur at
relatively low densities and have relatively large home ranges, and because they are
often persecuted by humans.
The Philippines has 29 diurnal birds of prey species (Kennedy et al. 2000). With the
exception of work on the endemic and critically endangered Philippine eagle
(Pithecophage jefferyi; Gonzales 1968, Kennedy 1981, Salvador and Ibanez 2006)
and a few other birds of prey, the vast majority of these species have gone largely
unstudied.

3
The Philippine eagle is a useful umbrella for conservation because survival of its
population continues to be threatened by habitat loss, decline in prey abundance,
demographic instability and threat of disease (BirdLife International 2001). These
threats are mostly driven by human actions and are not necessarily independent of
each other. Conservation of this iconic species depends on better understanding of
the processes and conditions that have supported its continued existence. For
example, although it is known that juveniles will spend more time at the forest edge
than the adults, the effects of frequent movement outside the forest borders on
juvenile dispersal and survival is yet to be established (Afan et al. 2000).
As a rare species of great cultural importance, the Philippine eagle is quite difficult
to study because there are so few individuals left, encounter rates are low and there
are massive legal and logistical hurdles to its study. If information is needed about
this and other endemic Philippine raptors, it would make more sense to focus on
common species and draw inferences about them that could then be applied to
harder to study species. With this in mind, this study focused on two common but
poorly researched Philippine raptors as a mechanism to understand movement
ecology of Philippine raptors in a heavily fragmented tropical ecosystem. These are
the migratory, winter resident grey-faced buzzard (Butastur indicus) and the non-
migratory, year-round resident Philippine serpent eagle (Spilornis holospilus).
I studied two common species because (a) common species should occur in larger
numbers than rare species, ensuring a good sample size and greater statistical
power; (b) by studying two species with different ecologies, I can more fully
understand how habitat change impacts the suite of local raptors; and (c) the rarity
and legal protection of the highly-endangered species creates logistical hurdles that
make research on those taxa nearly impossible. Thus, these two common species are
intended to serve as both indicators of general trends in biodiversity in the
Philippines and also proxies for less common but ecologically similar taxa.
I will adopt the conceptual framework for movement ecology defined by Nathan et
al. (2008). Movement ecology is a paradigm that provides common context and tools

4
towards a “better understanding of the causes, mechanisms, patterns, and
consequences of all movement phenomena” (Nathan 2008). This framework is
based on three basic components that characterize the study individuals (internal
state, motion capacity and navigation capacity) and a fourth basic component
related to external factors that affect movement.
The internal state accounts for the physiological conditions that provides the
motivation (goal) for an individual to move. Motivations for movement may include
factors as variable as seeking a safe place to spend winter, reproduce and establish a
territory. The ability of an individual to move to fulfill these goals is referred to as
motion capacity, while the ability to orient movement in time or space are related to
navigation capacity.
Movement may occur at different spatiotemporal scales – “movement step,”
“movement phase,” or “lifetime track” (Nathan et al. 2008). A movement step is a
displacement from one location to another. A movement phase, on the other hand, is
a sequence of steps and stops associated with fulfilling a particular goal. A complete
sequence of steps and stops from birth to death is a lifetime track.
Understanding the movement behavior of an individual is important to understand
spatial population dynamics (Patterson et al. 2008, Schick et al. 2008). Movement
behavior also relates to how individuals mix and interact with the population and
community (Morales et al. 2010) and is influenced by body condition. These in turn
impact fitness, vital rates, energy balance, and food provisioning. Further,
movement of individuals shape biodiversity by providing links between habitats or
ecosystems and by facilitating coexistence in communities (Jeltsch et al. 2013).
The use of extrinsic or intrinsic markers is a common approach in studying
movement ecology. Extrinsic markers involve the use of telemetry or individual tags
which are both direct ways of monitoring movement (Kendall and Nichols 2004).
Telemetry, for example, has allowed researchers to gather vast amounts of data on
animal positions that together are used to establish movement phases (Cagnacci et
al. 2010). These data have also been used to relate movement to external factors

5
such as landscape properties (Bennetts and Kitchens 2000, Cagnacci et al. 2010) and
meteorological conditions (Mandel et al. 2008, Sunde et al. 2014). Intrinsic markers,
on the other hand, can either be biological (e.g. morphological and behavioral) or
biogeochemical (e.g. trace element concentrations and stable isotopes) (Rubenstein
and Hobson 2004). For example, stable isotope analysis has been used to establish
foraging preferences and migration connectivity for birds (Inger and Bearhop
2008). Results from stable isotope analysis could be enhanced by combining it with
other markers, such as bird banding or telemetry (Van Wilgenburg and Hobson
2011).
FOCAL SPECIES
The grey-faced buzzard is a migratory bird of prey that breeds in eastern mainland
Asia and winters in Southern China and parts of Pacific Asia (Ferguson-Lees and
Christie 2001). It regularly engages in over-water travel during migration and is
considered one of the most oceanic of raptor migrants (Bildstein 2006). Every year,
more than 10,000 grey-faced buzzards migrate through Taiwan before crossing 180
kilometers of open ocean to reach the Philippines (Lin and Severinghaus 1998).
Grey-faced buzzards exhibit high fidelity to both migration route and to stopover
sites (Shiu et al. 2006) and the species’ passage is a good indicator to identify
important watchsites (Lin and Severinghaus 1998).
The grey-faced buzzard is said to occupy open habitat and typically hunts outside
the forest (Gamauf et al. 1998, Sakai et al. 2011). It favors foraging in wet open
areas, most commonly cultivated rice paddy fields, where it hunts prey such as
frogs, lizards and grasshoppers (Matsuura et al. 2005, Wu et al. 2006, Kadowaki et
al. 2007). The rice fields more often used share edges with forests or wooded areas.
These are also the characteristic of the preferred migration stop-over sites, and
wintering and breeding habitats (Matsuura et al. 2005, Ueta et al. 2006, Wu et al.
2006, Sakai et al. 2011). The loss of these habitats through the abandonment of
traditional rice paddy fields has led to the well-documented rapid decline in grey-

6
faced buzzard breeding population in Japan (Kawakami and Higuchi 2003, Ueta et
al. 2006).
The Philippine serpent eagle is a common resident of the Philippines which is
endemic to the main islands of the archipelago (Ferguson-Lees and Christie 2001).
There currently are poor data to support any accurate population estimate for this
species, but it is believed that there are about 10,000 breeding individuals in the
country. Movements of these birds are almost completely unknown and it is in fact,
one of the least known raptors in the world (Meyburg 1986, Ferguson-Lees and
Christie 2001).
The Philippine serpent eagle occupies habitat with over 50% canopy cover and
hunts above the forest (Gamauf et al. 1998). Although primarily found in forests, it
may also occupy “edge” habitats, wooded foothills and open country with scattered
trees (Ferguson-Lees and Christie 2001). Foraging ecology of the Philippine serpent
eagle is believed to be comparable with crested serpent eagle sub-species, preying
mostly on reptiles, small mammals, and birds.
OBJECTIVES
My research objective was to link movement behavior to seasonal movement and
distribution. Understanding this link will help predict how disturbance and habitat
change may alter biodiversity and ecology in these heavily fragmented tropical
ecosystems.
The main questions my research answered were:
1. How do external factors shape movement behavior?
2. How does the inherent capacities of the species to move influence the
“movement phase” when confronted with ecological barriers?

7
3. How does the individual internal state direct movement steps and associated
behavior?
Studying two species of birds of prey whose movement ecology differs allowed me
to evaluate comprehensively their conservation status as well as the impacts of
human disturbance and land-use change on these two important components of the
Philippine raptor community.
To address my first research question, I specifically aimed (1) to quantify external
factors (e.g., weather) that influence grey-faced buzzard migratory performance;
and (2) to identify landcover characteristics that render areas suitable as Philippine
serpent eagle territory.
To address my second research question, I built spatial models to predict grey-faced
buzzard migration routes and bottlenecks across the Philippines.
To address my third research question, I presented notes on Philippine serpent
eagle breeding behavior as well as grey-faced buzzard wintering distribution.
METHODS
Study area My research took me to different islands of the Philippines. I made the remote town
of Basco in the province of Batanes, and Cape San Agustin in the province of Davao
Oriental as the center of my grey-faced buzzard research (Figure 1). Basco is at the
northernmost tip of the country, perfect for monitoring the passage of birds using
the East-Asian Oceanic Flyway as they cross 180 km of ocean from Taiwan to the
Philippines. Cape San Agustin is at the southeastern tip of the island of Mindanao,
allowing for monitoring of migrant birds as they cross 170 km of ocean to presumed
destinations in Indonesia.

8
I targeted five sites in the south of the country, on the island of Mindanao, for
studying the resident Philippine serpent eagle (Figure 1). These areas were
identified according to their varying habitats (in terms of forest type, disturbance
and elevation), as follows:
Lantapan, Bukidnon (a near-pristine, high elevation montane forest);
Arakan, North Cotabato (a severely disturbed, high elevation montane
forest);
Davao City (a moderately disturbed, high elevation montane forest) ;
San Isidro, Davao Oriental (a near-pristine, low elevation Dipterocarp forest);
and
Governor Generoso, Davao Oriental (a moderately disturbed low elevation
Dipterocarp forest)
These areas belong to different biogeographic regions, but their land cover is
broadly representative of the Philippines as a whole. In the north, in Batanes,
habitats are coastal areas and lowland old-growth and secondary evergreen forests.
The island is dominated by hills and mountains and peaks at around 1,000 meters
above sea level. The province experiences subtropical, Type II climate, with no dry
season and a marked rainy season peak from December to February (DOST-PAGASA
2004).
Mindanao habitat ranges from lowland rainforests to high elevation montane
forests. Lowland rainforests has been highly degraded by logging. The highest point
on the island of Mindanao reaches 2,954 meters. The study sites range from coastal
hills to inland mountain ranges. Mindanao has mostly Type IV tropical climate with
rainfall more or less evenly distributed through the year (DOST-PAGASA 2004).

9
Data collection
Question 1. How do external factors shape movement behavior?
I answered this question by assessing how the grey-faced buzzard’s migratory
movement phase was influenced by external factors. A migratory movement phase
for the grey-faced buzzard is a sequence of steps and stops in seeking a safe place to
spend winter. External factors expected to influence movement phases of Philippine
birds of prey are landscape properties and meteorological agents. Landscape
properties were defined by combining land cover and land use information.
I used the established technique of monitoring the visible migration of birds at
migration watchsites to study how the grey-faced buzzard used the Philippine
landscape. My project was the first to use full-season, bird of prey migration
monitoring in autumn in the Philippines. Movement data collected via direct
observation was then connected to datasets on weather (wind speed and direction
are critical to ocean crossings by most species) and on land-use.
Counts at a single watchsite occurred from August through November, during
daylight hours from 0600 to 1700h, as weather permitted (Bildstein et al. 2007). I
stopped data collection in the event of strong rains or typhoon. Locations and
directions of flight were determined using a GPS and compass.
I spotted migrating raptors by methodically using binoculars, field scopes and the
unaided eye to scan the sky in the direction the migrants were expected. Single
individuals or flocks were followed until identified and, for each group of birds, I
recorded the time, counted the number and established the species and direction of
travel. I recorded migration and weather data on datasheets I patterned after the
Hawk Migration Association of North America. Weather data were logged hourly
and recorded using a handheld anemometer or weather station.
I used migration data to assess how weather influenced the grey-faced buzzard’s
movement phase. The decision to migrate, and to cross open ocean, were then
statistically correlated to weather conditions that the birds encounter. This allowed

10
me to predict expected migration flights given a set of weather conditions as I
establish and assess other hawkwatches in the future.
Similarly, I answered this question by assessing how the Philippine serpent eagle’s
movement phases are influenced by the Philippine landscape. A movement phase of
an adult serpent eagle is a sequence of steps and stops in seeking either a safe place
to reproduce or, in the case of immatures, a safe place to establish a territory for
immature birds. To understand distribution and habitat associations, I successively
visited each of the five study sites at the beginning of the breeding season
(November) and conducted time constrained surveys. With the aid of binoculars, I
conducted road transects to census for bird abundance, counting from a vehicle at
an approximate speed between 25 to 40 km/h (Andersen et al. 1985, Viñuela 1997).
I covered 10 km in each site, looping through habitat types (forests and open areas).
For one of my survey years, I supplemented this with surveys from fixed
observation posts located on ridge tops, cleared hills and near logging roads that
would offer a vantage of the forest and forest edges. Locations of the road transects
and observation posts were determined using a GPS. I recorded observations on
datasheet I patterned after the Hawk Migration Association of North America.
I used population survey and mark-resight analysis to estimate occupancy and
detection. I linked these with movement behavior based on habitat associations.
Question 2: How does the inherent capacities of the species to move influence the
“movement phase” when confronted with ecological barriers?
I established how the ocean, an important ecological barrier, influenced movement
phases by studying the grey-faced buzzard, one of the world’s most oceanic raptor
migrants. As previously mentioned, to reach the Philippines, the grey-faced buzzard
crosses the Bashi Channel, a 180-km stretch of the Pacific Ocean found between
Taiwan and the Philippines.
Ecological barriers considered in this study are not necessarily complete barriers to
movement. Instead, I define them as landscape features that penalize movement
11
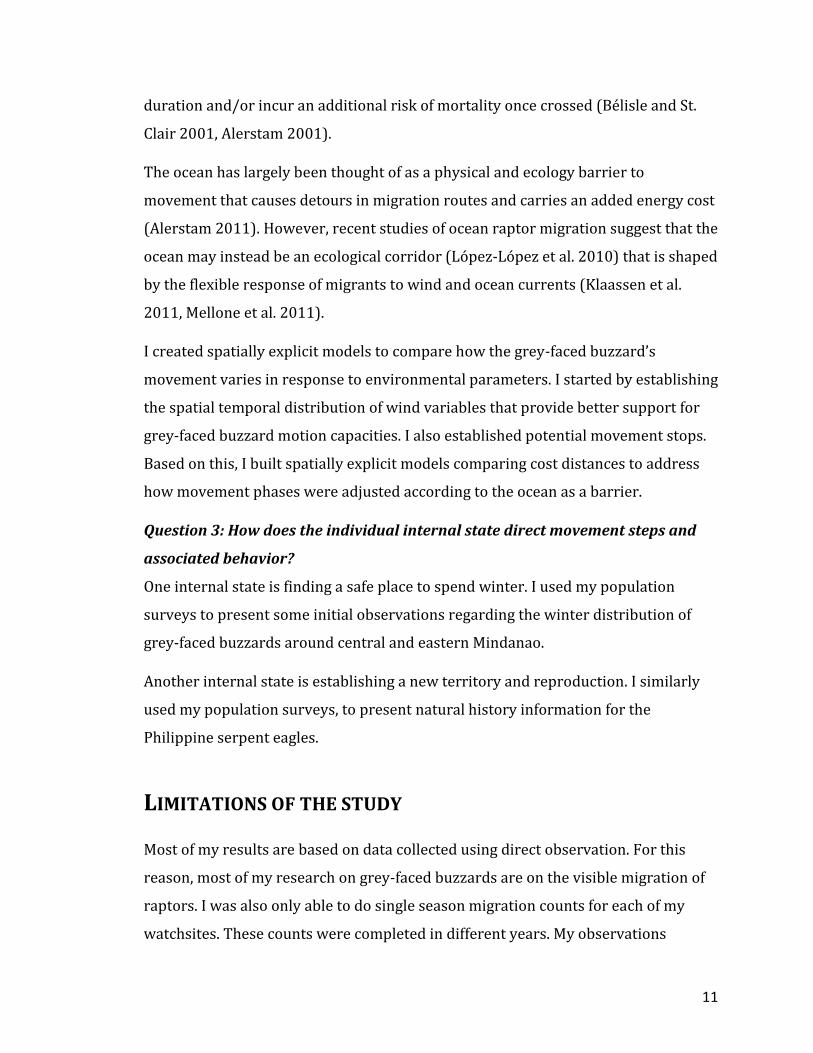
duration and/or incur an additional risk of mortality once crossed (Bélisle and St.
Clair 2001, Alerstam 2001).
The ocean has largely been thought of as a physical and ecology barrier to
movement that causes detours in migration routes and carries an added energy cost
(Alerstam 2011). However, recent studies of ocean raptor migration suggest that the
ocean may instead be an ecological corridor (López-López et al. 2010) that is shaped
by the flexible response of migrants to wind and ocean currents (Klaassen et al.
2011, Mellone et al. 2011).
I created spatially explicit models to compare how the grey-faced buzzard’s
movement varies in response to environmental parameters. I started by establishing
the spatial temporal distribution of wind variables that provide better support for
grey-faced buzzard motion capacities. I also established potential movement stops.
Based on this, I built spatially explicit models comparing cost distances to address
how movement phases were adjusted according to the ocean as a barrier.
Question 3: How does the individual internal state direct movement steps and
associated behavior?
One internal state is finding a safe place to spend winter. I used my population
surveys to present some initial observations regarding the winter distribution of
grey-faced buzzards around central and eastern Mindanao.
Another internal state is establishing a new territory and reproduction. I similarly
used my population surveys, to present natural history information for the
Philippine serpent eagles.
LIMITATIONS OF THE STUDY
Most of my results are based on data collected using direct observation. For this
reason, most of my research on grey-faced buzzards are on the visible migration of
raptors. I was also only able to do single season migration counts for each of my
watchsites. These counts were completed in different years. My observations

12
though, remain particularly important because so few over-water crossings have
been studied outside of Europe.
I was able to establish a fruitful relationship with indigenous trappers, experienced
in capturing grey-faced buzzards. However, the birds we got in hand had
compromised wings, and were not fit for telemetry. This prevented me from testing
hypotheses from my spatial models.
Further, all my attempts at capturing Philippine serpent eagles failed. Despite this, I
conducted three years of road surveys along the same transects. This provided me
with good quality data that was useful for answering one of my research questions.
The road surveys were also useful in helping build natural history information for
the Philippine serpent eagle.
NATURAL HISTORY INFORMATION
As mentioned, there have been few attempts at studying birds of prey in the
Philippines. Even basic natural history information is lacking for most of these
species. For example, it was my road surveys that established the beginning of the
breeding season for Philippine serpent eagles (question # 3). I first observed
Philippine serpent eagles in courtship display in October of 2014. The following
year, in November, I observed a pair in mutual flight, with one adult carrying nesting
material. This information is new to science. Unfortunately, I had limited field time
and was not able to find an active Philippine serpent eagle nest.
Road surveys were also useful for gathering initial information on wintering
habitats for grey-faced buzzards (questions # 3). I found grey-faced buzzards to
occupy a wide range of habitats, both open areas and forests, and near-pristine to
severely disturbed landcover. Grey-faced buzzards were also found in both low
elevation and high elevation forests. Unfortunately, I did not have enough
observations of grey-faced buzzards to estimate either wintering survival or
occupancy correlates.

13
CONTENTS OF THE DISSERTATION
My dissertation comprises five chapters. This first chapter provides a brief
introduction to the study, goals and objectives, research approach and limitations. It
also provides notes from observations in the field that do not completely answer
any of my research questions but are relevant towards answering them in the future
with further investigation.
Chapter 2 provides the context for studying birds of prey in the Philippines by
examining the conservation threats and status of birds of prey found in Asia first. In
this chapter, I describe how birds of prey in Asia are faring relative than birds of
prey elsewhere in the world. I identified the Philippines as one of the most speciose
countries and one of the countries that has the most threatened species.
In Chapter 3, I use hawk migration data to assess how external factors (i.e. weather
correlates) influence the movement behaviors of grey-faced buzzards (question #
1). I first described the overall patterns of migration as hawks complete and begin
their oceanic crossings in the Philippines. I then compared migration behavior of
grey-faced buzzards with migration behavior of Accipiters. These two species were
the most common migrants observed using the East Asian Oceanic Flyway.
In Chapter 4, I used road survey data to determine habitat associations of Philippine
serpent eagle distribution across central and eastern Mindanao (question #1). I put
my findings in context by looking at raptor abundance, and comparing the
correlates of Philippines serpent eagle distribution (habitat specialist) with the
correlates of distribution of a habitat generalist.
Finally, in Chapter 5, I created spatial models to understand how grey-faced
buzzards overcome movement barriers (question # 2). I created models to explain
the optimal migration strategy of hypothetical grey-faced buzzards as they
repeatedly face the decision of completing, delaying, or foregoing over-water travel.

14
REFERENCES
Afan, D. S., J. C. Ibanez, G. B. Ibanez, G. L. Bueser, K. M. Gatil, and H. C. Miranda Jr.
2000. Notes on movement and behavior of a post-fledging Philippine Eagle at
Mt. Sinaka, Mindanao Island. SYLVATROP, The Technical Journal of the
Philippine Ecosystems and Natural Resources 10:59–69.
Bankoff, G. 2007. One island too many: reappraising the extent of deforestation in
the Philippines prior to 1946. Journal of Historical Geography 33:314–334.
Bartholomé, E., and A. S. Belward. 2005. GLC2000: a new approach to global land
cover mapping from Earth observation data. International Journal of Remote
Sensing 26:1959–1977.
Bennetts, R. E., and W. M. Kitchens. 2000. Factors influencing movement
probabilities of a nomadic food specialist: proximate foraging benefits or
ultimate gains from exploration? Oikos 91:459–467.
Bildstein, K. L. 2006. Migrating raptors of the world: Their ecology and conservation.
Cornell University Press, Ithaca, New York.
BirdLife International. 2001. Threatened birds of Asia: the BirdLife International
Red Data Book. BirdLife International, Cambridge, UK.
Cagnacci, F., L. Boitani, R. A. Powell, and M. S. Boyce. 2010. Animal ecology meets
GPS-based radiotelemetry: A perfect storm of opportunities and challenges.
Philosophical transactions of the Royal Society of London. Series B, Biological
sciences 365:2157–62.
Catibog-Sinha, C., and L. R. Heaney. 2006. Philippine biodiversity: Principles and
practice. Haribon Foundation for the Conservation of Natural Resources, Inc.,
Quezon City.
Ferguson-Lees, J., and D. A. Christie. 2001. Raptors of the world. Houghton Mifflin
Company, New York.
Gamauf, A., M. Preleuthner, and H. Winkler. 1998. Philippine birds of prey:
Interrelations among habitat, morphology, and behavior. The Auk 75:713–726.
Gonzales, R. B. 1968. A study of the breeding biology and ecology of the monkey-
eating eagle. Silliman Journal 15:461–491.

15
Hannah, L., M. Ikegami, D. G. Hole, C. Seo, S. H. M. Butchart, A. T. Peterson, and P. R.
Roehrdanz. 2013. Global climate change adaptation priorities for biodiversity
and food security. PloS one 8:e72590.
Hansen, M. C. C., P. V Potapov, R. Moore, M. Hancher, S. A. a Turubanova, A.
Tyukavina, D. Thau, S. V. V Stehman, S. J. J. Goetz, T. R. R. Loveland, A.
Kommareddy, A. Egorov, L. Chini, C. O. O. Justice, J. R. G. R. G. Townshend, P. V.
Patapov, R. Moore, M. Hancher, S. A. a Turubanova, A. Tyukavina, D. Thau, S. V. V
Stehman, S. J. J. Goetz, T. R. R. Loveland, A. Kommaredy, A. Egorov, L. Chini, C. O.
O. Justice, and J. R. G. R. G. Townshend. 2013. High-resolution global maps of
21st-century forest cover change. Science 342:850–854.
Inger, R., and S. Bearhop. 2008. Applications of stable isotope analyses to avian
ecology. Ibis 150:447–461.
Jeltsch, F., D. Bonte, G. Pe’er, B. Reineking, P. Leimgruber, N. Balkenhol, B. Schröder,
C. M. Buchmann, T. Mueller, N. Blaum, D. Zurell, K. Böhning-Gaese, T. Wiegand, J.
a Eccard, H. Hofer, J. Reeg, U. Eggers, and S. Bauer. 2013. Integrating movement
ecology with biodiversity research - exploring new avenues to address
spatiotemporal biodiversity dynamics. Movement Ecology 1:6.
Kadowaki, S., T. Murayama, and Y. Kojima. 2007. Differences in utilization of
cultivated and uncultivated paddy fields as hunting grounds by the grey-faced
buzzard-eagle, <i>Butastur indicus. Journal of Yamashina Institue for
Ornithology 39:19–26.
Kawakami, K., and H. Higuchi. 2003. Population trend estimation of three threatened
bird species in Japanese rural forests: the Japanese Night-Heron Gorsachius
goisagi, Goshawk Accipiter gentilis and Grey-faced Buzzard Butastur indicus.
Journal of the Yamashina Institute for Ornithology 35:19–29.
Kendall, W. L., and J. D. Nichols. 2004. On the estimation of dispersal and movement
of birds. The Condor 106:720–731.
Kennedy, R. S. 1981. Saving the Philippine Eagle. National Geographic
Magazine:843–856.
Kennedy, R. S., P. C. Gonzales, E. C. Dickinson, H. C. J. Miranda, and T. H. Fisher. 2000.
A guide to the birds of the Philippines. Oxford University Press, New York.
16
Lasco, R. D., and F. B. Pulhin. 2000. Forest land use change in the Philippines and
climate change mitigation. Mitigation and Adaptation Strategies for Global
Change 5:81–97.
Lin, W. H., and L. L. Severinghaus. 1998. Raptor migration and conservation in
Taiwan. Pages 631–639in R. D. Chancellor, B.-U. Meyburg, and J. J. Ferrero,
editors.Holarctic birds of prey. ADENEX and World Working Group of Birds of
Prey, Merida, Spain.
Mandel, J. T., K. L. Bildstein, G. Bohrer, and D. W. Winkler. 2008. Movement ecology
of migration in turkey vultures. Proceedings of the National Academy of
Sciences of the United States of America 105:19102–19107.
Matsuura, T., M. Yokohair, and A. Azuma. 2005. Identification of potential habitats of
gray-faced buzzard in Yatsu landscapes by using digital elevation model and
digitized vegetation data. Landscape and Urban Planning 70:231–243.
Meyburg, B. 1986. Threatened and near-threatened diurnal birds of prey of the
world. Birds of Prey Bulletin 3:1–12.
Morales, J. M., P. R. Moorcroft, J. Matthiopoulos, J. L. Frair, J. G. Kie, R. a Powell, E. H.
Merrill, and D. T. Haydon. 2010. Building the bridge between animal movement
and population dynamics. Philosophical transactions of the Royal Society of
London. Series B, Biological sciences 365:2289–301.
Myers, N., R. A. Mittermeier, C. G. Mittermeier, G. A. B. da Fonseca, and J. Kent. 2000.
Biodiversity hotspots for conservation priorities. Nature 403:853–858.
Nathan, R. 2008. An emerging movement ecology paradigm. Proceedings of the
National Academy of Sciences 105:19050–19051.
Nathan, R., W. M. Getz, E. Revilla, M. Holyoak, R. Kadmon, D. Saltz, and P. E. Smouse.
2008. A movement ecology paradigm for unifying organismal movement
research. Proceedings of the National Academy of Sciences 105:19052–19059.
Patterson, T. a, L. Thomas, C. Wilcox, O. Ovaskainen, and J. Matthiopoulos. 2008.
State-space models of individual animal movement. Trends in ecology &
evolution 23:87–94.
Rolstad, J. 1991. Consequences of forest fragmentation for the dynamics of bird
populations: conceptual issues and the evidence. Biological Journal of Linnean

17
Society 42:149–163.
Rubenstein, D. R., and K. a Hobson. 2004. From birds to butterflies: animal
movement patterns and stable isotopes. Trends in ecology & evolution 19:256–
63.
Sakai, S., N. Yamaguchi, H. Momose, and H. Higuchi. 2011. Seasonal shifts in foraging
site and prey of grey-faced buzzards (Butastur indicus), breeding in Satoyama
habitat of Central Japan. Ornithological Science 10:51–60.
Salvador, D. I., and J. C. Ibanez. 2006. Ecology and conservation of Philippine Eagles.
Ornithological Science 5:171–176.
Schick, R. S., S. R. Loarie, F. Colchero, B. D. Best, A. Boustany, D. a Conde, P. N. Halpin,
L. N. Joppa, C. M. McClellan, and J. S. Clark. 2008. Understanding movement data
and movement processes: current and emerging directions. Ecology letters
11:1338–50.
Shiu, H.-J., K. Tokita, E. Morishita, E. Hiraoka, Y. Wu, H. Nakamura, and H. Higuchi.
2006. Route and site fidelity of two migratory raptors: Grey-faced Buzzards
Butastur indicus and Honey-buzzards <i>Pernis apivorus. Ornithological
Science 5:151–156.
Sunde, P., K. Thorup, L. B. Jacobsen, and C. Rahbek. 2014. Weather conditions drive
dynamic habitat selection in a generalist predator. PloS one 9:e88221.
Ueta, M., R. Kurosawa, and H. Matsuno. 2006. Habitat loss and the decline of Grey-
faced Buzzards (Butastur indicus). Journal of Raptor Research 40:52–56.
Van Wilgenburg, S. L., and K. a Hobson. 2011. Combining stable-isotope (deltaD) and
band recovery data to improve probabilistic assignment of migratory birds to
origin. Ecological applications : a publication of the Ecological Society of
America 21:1340–51.
Wu, Y., G. Fujita, and H. Higuchi. 2006. What landscape elements are correlated with
the distribution of wintering Grey-faced Buzzards Butastur indicus in the
Sakishima Islands, southwestern Japan? Ornithological Science 5:157–163.

18
Figure 1. Geographic locations of study areas around the Philippines. Left inset shows the entire Philippines. Figure part (A) shows the location of the watchsite () at Basco and part of Taiwan, which is 180 km north, and mainland Luzon of the Philippines, 280 km south. Top right map (B) shows the location of the watchsite () at Cape San Agustin found in the island

19
of Mindanao, as well as the northernmost islands of Indonesia (Sulawesi), 170 km south. Bottom inset (C) shows the distribution of areas where 10-km road transects ( ) where surveyed. Areas shaded grey in c have at least 50% tree cover and are from Bartholomé and Belward (2005) and Hansen et al (2013). Outlines in c show town boundaries of study sites.
Polylines

20
CHAPTER 2
Conservation threats and priorities for raptors across Asia
Camille B. Concepcion1, Keith L. Bildstein2, and Nigel J. Collar3, Todd E. Katzner1,4,5
1Division of Forestry & Natural Resources, West Virginia University, Morgantown
WV 26506 USA
2Hawk Mountain Sanctuary, 1700 Hawk Mountain Rd., Kempton, PA 19527 USA
3BirdLife International, Wellbrook Court, Girton Road, Cambridge CB3 0NA, United
Kingdom
4United States Department of Agriculture, Forest Service, Timber and Watershed
Laboratory, Parsons, West Virginia 26287, USA
5U.S. Geological Survey, Forest & Rangeland Ecosystem Science Center, 970 Lusk St.,
Boise, ID 83706 USA
In review: in Birds of prey: biology and conservation in the XXI century
21
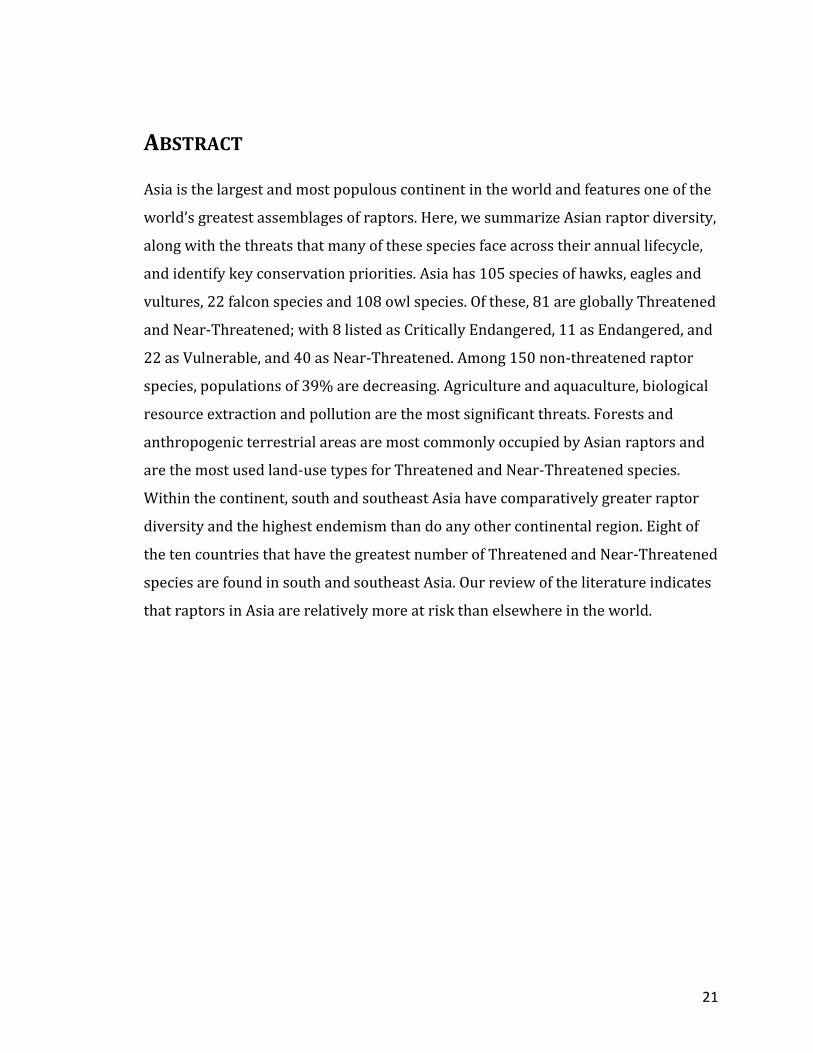
ABSTRACT
Asia is the largest and most populous continent in the world and features one of the
world’s greatest assemblages of raptors. Here, we summarize Asian raptor diversity,
along with the threats that many of these species face across their annual lifecycle,
and identify key conservation priorities. Asia has 105 species of hawks, eagles and
vultures, 22 falcon species and 108 owl species. Of these, 81 are globally Threatened
and Near-Threatened; with 8 listed as Critically Endangered, 11 as Endangered, and
22 as Vulnerable, and 40 as Near-Threatened. Among 150 non-threatened raptor
species, populations of 39% are decreasing. Agriculture and aquaculture, biological
resource extraction and pollution are the most significant threats. Forests and
anthropogenic terrestrial areas are most commonly occupied by Asian raptors and
are the most used land-use types for Threatened and Near-Threatened species.
Within the continent, south and southeast Asia have comparatively greater raptor
diversity and the highest endemism than do any other continental region. Eight of
the ten countries that have the greatest number of Threatened and Near-Threatened
species are found in south and southeast Asia. Our review of the literature indicates
that raptors in Asia are relatively more at risk than elsewhere in the world.

22
INTRODUCTION
With long coastlines and some of the world’s most important rivers, mountain
ranges, high-altitude plateaus, and islands, Asia is the largest and most populous
continent in the world (Lyde 1904, Spencer 1954, Population Reference Bureau
2016). Asia supports all major terrestrial ecosystems and all major climatic types
(Galloway et al. 1998, Braimoh and Huang 2015). These include barren icefields and
taigas in north Asia, boreal forests and cold deserts in west, central and east Asia,
temperate and tropical forests (wet and dry) in east and southeast Asia, and
grasslands in central and south Asia (Udvardy 1975, Braimoh and Huang 2015).
Together, the ecoregions of Asia foster some of the greatest biodiversity on Earth,
including six (24%) of 25 global biodiversity hotspots (Myers et al. 2000).
With 47% of the world’s Threatened and Near-Threatened raptor species (Table 1),
Asia is home to 42% of the world’s diurnal and nocturnal raptor species, including
30% of all migratory species, and 51% of all endemic species. With the exception of
work on raptors in tropical Asia (i.e. southeast Asia; Thiollay 1985, 1998, Bildstein
1998), the Gyps vultures of south Asia (Prakash et al. 2003, 2012, Gilbert et al. 2004,
Shultz et al. 2004, Acharya et al. 2009, Hall et al. 2011, 2015) and a few other
country-level studies, the population status of the vast majority of these species has
gone largely unstudied. The raptors of south and southeast Asia provide a useful
umbrella for conservation because the survival of their populations continue to be
threatened by land-use change, direct human persecution and environmental
contaminants (Bildstein 1998, Thiollay 1998). These threats rarely act in isolation
and are directly or indirectly caused by human activities. Raptors are especially
vulnerable to these threats because of their life history traits, and because they
occur at relatively low population densities and in relatively large home ranges
(Newton 1979, 1998, Real and Mañosa 1997, Hall et al. 2015).

23
Threats to Asian raptors Of the threats that Asia’s raptors face, land-use change is most significant.
Agriculture has modified natural landscapes more than any other human activity
and among the most rapidly expanding agricultural industries are oil palm Elaeis
guineensis and rubber Hevea brasiliensis (Clay 2004). The conversion of natural
landscapes greatly reduces species richness and diversity (Aratrakorn et al. 2006,
Beukema et al. 2007, Fitzherbert et al. 2008, Sodhi et al. 2010). Loss of raptor
habitats can also drive spatial and temporal changes in avian populations by
affecting territory size and dispersal (Rolstad 1991).
Land-use change also can carry over to loss of habitat of prey species and the
consequent reduction in prey abundance. Declines in prey abundance could result in
decreases in nesting density and reproductive success of predatory avian
populations (Andersson 1978, Newton 1980, Terraube et al. 2011). Decline in prey
abundance also can cause conflict with humans if domestic animals are taken as
alternative prey (Carrete et al. 2007).
Land-use change magnifies the threat of human persecution as encounters with
people increase in fragmented and human-impacted landscapes. Humans have long
intentionally destroyed nests, and shot and poisoned raptors they consider as pests
(Newton 1979, 1998, Bildstein 2001). Human persecution has resulted in raptor
population declines by reducing reproductive rates and pre-adult and adult survival
(Whitfield et al. 2004a, 2004b, Tenan et al. 2012), and has caused range retractions
and local extinctions of raptor populations (Newton 1998, Smart et al. 2010).
Environmental contaminants and secondary poisoning also severely impact Asian
raptor populations (Newton 1979, 1998, Sheffield 1997, Oaks et al. 2004a, Shultz et
al. 2004). Pesticides (Ratcliffe 1970, Mineau et al. 1999, Jagannath et al. 2008), and
heavy metals (Solonen and Lodenius 1984, Wallin 1984, Lourenço et al. 2011) are
known to reduce survivorship or impair raptor reproductive success. Anticoagulant
rodenticides (Stone et al. 2003, Lambert et al. 2007), pharmaceuticals (Oaks et al.
2004a), and lead (Kramer and Redig 1997, Fisher et al. 2006, Gangoso et al. 2009)
can weaken or directly kill individuals.

24
Below we summarize raptor diversity in mainland and oceanic Asia. We then
describe the threats that many of these species face, and identify priority species
and essential steps for their conservation. We close with a section on poorly known
species in Asia and opportunities to fill knowledge gaps that will benefit
conservation of raptors in this immense but poorly studied continent.
METHODS
We define Asia as the area that includes Asiatic Russia in the north, Indonesia in the
south (including West Papua, although the avifauna of New Guinea is predominantly
Australasian) and from Japan in the east to Uzbekistan, Turkmenistan, Afghanistan
and Pakistan in the west (Figure 1). Although the Middle East is, geographically, part
of Asia, its avifauna is composed predominantly of European and African species,
and we do not consider this area in our treatment of Asian raptors.
Distributions, conservation statuses, threats, raptor habitat and taxonomy were
based on BirdLife International (BirldLife International 2017). BirdLife
International provides the most extensive data on the world’s bird species and has
been compiling data on threatened bird species since 1966. They are the designated
Red List Authority for birds (IUCN 2017). BirdLife regularly assess species at a
global level and update their database based on published information and data
collected by 120 partner organizations worldwide (one partner for each country).
BirdLife provided us with a database of Asian raptor species including information
on Red list category, migratory status, and current population trend. The database
also includes country of occurrence and land cover types occupied (13 categories).
Threats (11 classifications) to globally threatened and near-threatened species are
also available.
We summarize the overall Asian raptor diversity and break down the information
according to threats, regions, and countries. Regions are also based on BirdLife
International (BirldLife International 2017). We look at overall population trends
and population trends per land cover type, again using BirdLife International (2017)

25
data. Subspecies are not differentiated in our summaries. We also consulted
Ferguson-Lees and Christie (2001) for distribution and population trends but
followed BirdLife’s taxonomic convention.
RESULTS
Asia is home to 235 raptor species (Table 1). In total, Asia has 8 Critically
Endangered raptor species (Table 2), 11 Endangered, 22 Vulnerable, and 40 Near-
Threatened species, with a majority of species (64%) listed as Least Concern.
Twenty-six percent of Asia’s raptors are migratory and 31% are endemic to a single
country (Table 1).
Of Asia’s raptors, 105 are hawks, eagles and vultures (Accipitriformes), distributed
among 30 genera (Table 1). Of these, 19% (n = 20) are globally Threatened and 13%
(n = 13) are Near-Threatened. Forty percent of Asia’s hawks, eagles and vultures are
migratory, and 18% are endemic to a single country. The continent is home to 22
falcon species, in 3 genera. Of these, 5% (n = 1) are globally Threatened and 23% (n
= 5) are Near-Threatened. Forty-five percent are migratory and 41% are endemic to
a single country. Asia is also home to 108 owl species, in 14 genera. Of these, 19% (n
= 20) are globally Threatened and 19% (n = 21) are Near-Threatened. About 7% are
migratory and 48% are endemic to a single country.
Overall, Asia’s raptors are faring slightly worse than average raptors elsewhere in
the world (Table 1). A greater proportion of Asia’s owls (19%) and migratory
species (12%) are Threatened compared to similar species elsewhere in the world
(owls: 18%, migratory species: 8%). There is also a greater proportion of Asia’s
owls (19%) and migratory species (8%) that are Near-Threatened compared to
species elsewhere in the world (owls: 11%, migratory species: 6%). Additionally, a
greater proportion of Asia’s falcons (23%) and endemic species (31%) are Near-
Threatened compared with falcons and endemic species elsewhere in the world
(falcons: 14%, endemic species: 22%).

26
Of the threats to Asian raptors, agriculture and aquaculture (e.g. livestock, wood and
non-timber crops, and freshwater and marine aquaculture) and biological resource
extraction (logging, hunting) are thought to be the greatest threats to Asia’s eagle,
hawk, vulture and owl species (Table 3). Pollution and biological resource
extraction are thought to be the greatest threats to Asian falcons. Secondary threats
to these taxa include these same forces as well as changes to land cover,
urbanization, and energy production.
Of Asia’s 235 raptor species, populations of 57% (n = 133) are decreasing (Figure 2).
This includes 97% (n = 33) of globally Threatened and Near-Threatened species of
hawks, eagles and vultures, all 6 globally Threatened and Near-Threatened falcon
species, and 88% (n = 36) of globally Threatened and Near-Threatened owl species.
Among the 150 non-threatened raptor species, populations of 46% (n = 32) eagles,
hawks and vultures, 31% (n = 5) of falcon species, and 33% (n = 21) of owl species
are decreasing.
Among the 13 land-use types, forest, man-made or anthropogenic terrestrial (e.g.
degraded forests, plantations, arable land, rural gardens and urban areas),
shrubland, grassland and wetlands were the most commonly occupied by Asian
raptors (Figure 3). Forests are most important for 86% (n = 202) of Asia’s raptor
species, and a disproportionately high number (36 of 41) of Asia’s globally
Threatened raptor species are found in forests. Additionally, although
anthropogenic terrestrial land use appears to be acceptable habitat for Least
Concern species, 44% (n = 18) of globally Threatened, and 54% (n =22) of Near-
Threatened species are found here as well. Finally, 21% (n = 17) of globally
Threatened and Near-Threatened species occupy shrubland, 20% (n = 16) occupy
grassland, and 16% (n = 13) occupy wetlands.
At a sub-continental (regional) scale, north Asia (Figure 1) has 61 raptor species,
80% of which migrate (Table 4). Although the region has no endemic raptors, its
ecosystems are important breeding areas for globally threatened species including
Steller’s Sea Eagle Haliaeetus pelagicus and Blakiston's Fish-owl Bubo blakistoni.

27
North Asia has no Critically Endangered species (Table 2), 4 Endangered, 4
Vulnerable, and 4 Near-Threatened species.
West and central Asia (Figure 1) have 59 raptor species, 75% of which migrate
(Table 4). The region has no endemic raptors, but includes important areas for
globally threatened and rare species, including Eastern Imperial Eagle Aquila
heliaca, Steppe Eagle Aquila nipalensis, Red-footed Falcon Falco vespertinus and
Saker Falcon Falco cherrug. West and central Asia has 2 Critically Endangered
species (Table 2), 3 Endangered, 3 Vulnerable, and 7 Near-Threatened species.
East Asia (Figure 1) has 96 raptor species (Table 4). There are no endemic species in
this region, and 59% of its raptors migrate. All of Asia’s migratory owls are in east
Asia. The region’s notable raptors include Steppe Eagle, Pallas’s Fish-eagle
Haliaeetus leucoryphus, Saker Falcon and Amur Falcon Falco amurensis. East Asia
has 2 Critically Endangered species (Table 2), 4 Endangered, 5 Vulnerable, and 7
Near-Threatened species.
South and southeast Asia has the greatest raptor diversity, with 219 species, only
20% of which migrate. Endemism is also highest in this region: 74 species are found
only in Asia. South and southeast Asia also has the highest number of globally
Threatened and Near-threatened species, including 8 Critically Endangered (Table
2), 10 Endangered, 21 Vulnerable and 39 Near-Threatened. Important species in
this region include the critically threatened vultures of the Indian subcontinent, as
well as two of the most evolutionarily distinct and globally threatened raptors in the
world, the Forest Owlet and the Philippine Eagle.
We identified ten Asian countries that have the most Threatened and Near-
Threatened species (Table 5). Among these countries, eight are in south and
southeast Asia and the remaining are in north and east Asia. These ten countries
have 231 of the 235 raptor species of Asia, including 72 of the 74 Asian endemics.
Because of the inclusion of China, Russia and India, they also include the vast
majority of the land mass of the continent. China, Russia and India also have the
highest number of migratory species (51, 48 and 46 species, respectively).
28
Indonesia and the Philippines have the highest number of endemics – 39 and 23,
respectively – 54% and 74% of which are globally Threatened and Near-
Threatened. Additionally, Indonesia (29%) and the Philippines (38%) also have the
highest proportion of globally Threatened and Near-Threatened species.
DISCUSSION
Overview Our review indicates that Asia’s raptors are faring slightly worse than average
raptors elsewhere in the world. Asia’s owls and migratory species are at greater risk
than similar raptors elsewhere in the world. Additionally, more falcons and endemic
species are close to qualifying for a threatened category in the near future than
falcons or endemic species elsewhere in the world.
Perhaps not surprisingly, forest is the most frequently used land type and a vast
majority of Threatened and Near-Threatened species are found here. What is
surprising is that anthropogenic landscapes such as degraded forests and forest
plantations appear to be the second most frequently used land type for Threatened
and Near-Threatened species. Forests are also the most used by most of Asia’s
endemic species, and once again artificial landscapes, the second most important.
Largely treeless ecosystems, like shrublands and grasslands, and inland wetlands
are also frequently used by Asia’s raptors. However, only a small proportion of
Threatened and Near-Threatened species are found in each of these land cover
types. Out of Asia’s endemic species, only four endemic owls are found here.
In all likelihood, this does not mean that degraded forests or plantations, for
example, are of equal quality to natural landscapes, such as forests. These
anthropogenic land-use types may be used, but are still of low quality for
reproduction or survival (Watson 1992, Donovan and Thompson 2001, Battin 2004,
Carrete et al. 2009). It is therefore important for researchers and conservation
practitioners to not just determine occupancy of individuals in different land cover
types, but to evaluate population structure as well, in order to ascertain whether the

29
use of these altered areas is a result of optimized selection or lack of choice (Van
Horne 1983).
Threats Agriculture and aquaculture, biological resource extraction, and pollution are the
most common threats to Asia’s raptors. Combined, the threats that raptors in Asia
face can be grouped into indirect effects and two kinds of direct effects on raptor
populations (threats that lead to unintentional fatalities and those that lead to
targeted removal of individuals from a population).
Indirect effects
Indirect effects of land-use change and disturbance are the most significant threat to
Asia’s raptors. Raptors may be relatively more impacted by habitat change than
other birds because they occur at relatively low densities, have relatively large
home ranges, and because they are often persecuted by humans (Newton 1979,
1998). For example, land use change reduces available suitable space and might
alter home range sizes (Andersson 1978). If degradation occurs on a large enough
scale, it can reduce breeding densities by birds that are forced to occupy larger
home ranges (Newton 1980, Amar et al. 2011). Fragmentation additionally creates
movement barriers for individuals and affect the movement of individuals among
suitable areas (Harrison and Emilio 1999, Bélisle and Desrochers 2002, Harris and
Reed 2002).
The effects of land-use change are likely to grow as Asia’s economy and
infrastructure grows, and those effects are difficult to reverse, especially in tropical
areas (Brooks et al. 2006). Agriculture, specifically, has been responsible for
converting ~13 million hectares of previously untouched forests to croplands
globally every year over the past 30 years (Clay 2004). Agriculture also remains the
most widespread occupation for Asian people and agricultural production has been
growing alongside industrial production (Galloway et al. 1998, The Association of
Academies of Sciences in Asia 2011). Looking forward, it is estimated that between

30
2000 and 2050, 10 billion hectares of natural landscapes in the world will be
converted to agriculture (Tilman et al. 2001).
In tropical Asia, for example, in the past 40 years oil palm plantations have
expanded faster than any other type of food or industrial agricultural crop (Clay
2004). Malaysia and Indonesia currently have over half of the world’s total oil palm
plantation area. In these two countries, although pre-existing croplands were
converted to oil palm plantations, over half of oil palm cultivated areas replaced
native forests (Koh and Wilcove 2008). Further, between 1910 and 1940, rubber
plantations in Indonesia increased ten-fold (Burger and Smit 2001). Seventy percent
of all rubber tree plantations are currently in Malaysia, Indonesia and Thailand
(Clay 2004). By the year 2024, the expansion of rubber plantations is expected to
continue and it is estimated that 4.3 to 8.5 million hectares of forests and swidden
land would be needed to answer the global rubber demand (Warren-Thomas et al.
2015).
The expansion of agriculture has also impacted natural grasslands. Grasslands are
heavily used by certain raptor speciesand are one of the most endangered
terrestrial ecosystems (Hoekstra et al. 2005). West and central Asia, in particular, is
a global stronghold for natural grasslands (Hoekstra et al. 2005), and, as a result of
the region’s low densities of human populations, until the mid-1900s central Asian
ecosystems were largely pristine (Zlotin 2002). However, steppe was targeted by
the Virgin Lands project of the USSR and between 1953 and 1963 an estimated 23 to
25 million hectares of semi-desert grasslands were ploughed and converted to
agriculture (Kamp et al. 2011, Kraemer et al. 2015) which has had negative
consequences for raptor populations (BirdLife International 2001, Sánchez-Zapata
et al. 2003).
Direct effects – Targeted removal of individuals
Consumptive uses of a few species, particularly falconry and the pet trade, are
thought to drive trajectories of some raptor populations. For example, Saker Falcons
are an Endangered species whose population has been reduced to a tenth of its

31
former abundance (BirdLife International 2001, Kenward 2009). As many as 1,000
Saker individuals (~8% of global population) were estimated to have been taken
illegally from west and central Asia, particularly Kazakhstan, between 1994 and
1996 (Levin 2011). Small numbers of Sakers have always been traded in west and
central Asia, but illegal trading only flourished in 1992 after the fall of the Soviet
Union. This geopolitical event opened west and central Asia’s borders and increased
foreign access to its Saker population (Kenward 2009). In east Asia, especially
Mongolia, populations of the Endangered Saker Falcon are over-trapped (Fox 2001,
Zahler et al. 2004). Between 1997 and 2010 alone, an average of 286 Saker Falcons
were traded annually (Dixon et al. 2011). Unfortunately, although local policies are
in place to protect Saker Falcons, it is often difficult to enforce those regulations.
Steppe Eagles, Imperial Eagles, and 27 other species, are also sold in markets in
China (Yi-Ming et al. 2000, Zhang et al. 2008). Most are taken from the wild during
migration (Kenward 2009). More recently, birds are being traded online in south
and southeast Asia. In 2015 alone, over 7,500 individuals from 22 diurnal raptor
species and 11 owl species were traded online in southeast Asia (Iqbal 2016).
There are also unique forms of consumptive uses in south and southeast Asia. In
India, for example, owls are important in witchcraft and believed to bring gambling
luck (Ahmed 2010, Jathar and Rahmani 2013). To answer the demand for
witchcraft, between 1992 to 2008, >1,000 individuals of 15 species of owls were
traded (Ahmed 2010). Another consumptive use occured in the Doyang Reservoir
region of Nagaland, northwestern India, where the mass killing of Amur Falcons for
human consumption was a major threat (Symes 2012, Dalvi and Haralu 2014).
These long-distance migrants form large communal roosts while migrating. During
peak migration, as many as 15,000 falcons were taken daily with mist nest, and
120,000—140,000 falcons were killed annually. Fortunately, since 2013, the killings
of Amur Falcons have been halted as a result of education campaigns and continued
population monitoring (NWBCT 2017).

32
Direct effects – Unintentional fatalities
The catastrophic collapse of the Gyps population in India is well documented, with
an estimated 92% population decline between 1993 and 2000 (Prakash et al. 2003)
and further declines since that time. As of 2012 only 0.1 – 3.2% of original
populations remained (Prakash et al. 2012). Similar declines were also recorded for
vulture populations in Nepal (Baral et al. 2004, Shultz et al. 2004) and in Pakistan
(Gilbert et al. 2004, Oaks et al. 2004b). The decline of Gyps vulture was put into
spotlight not just for its magnitude but also for the severe economic, cultural and
human health effects that followed (Prakash et al. 2004, Markandya et al. 2008).
This cataclysmic phenomenon was attributed to contamination of carcasses with the
veterinary drug, Diclofenac, that causes vultures to develop visceral gout and acute
kidney failure leading to death (Oaks et al. 2004a, 2004b).
In 2006, following the identification of the role of Diclofenac, India consequently
banned the drug from veterinary use (Taggart et al. 2007). Nepal and Pakistan
declared similar bans in 2006, and in 2010 while Bangladesh followed in 2010
(Prakash et al. 2012). This ban and the promotion of the Diclofenac-alternative,
Meloxicam (Swarup et al. 2007, Pain et al. 2008), has lowered, but not eliminated,
the Diclofenac’s impact (Prakash et al. 2012, Cuthbert et al. 2014, 2016, Galligan et
al. 2014). Captive care and breeding of Indian vultures, with a goal of eventual
release into the wild, is also currently ongoing (Prakash et al. 2004, Markandya et al.
2008). Vulture restaurants providing clean food likewise are a strategy used to
reduce the impacts of Diclofenac (Gilbert et al. 2007).
Migratory species may also encounter environmental contaminants in their
stopover and wintering areas. For example, Lake Baikal basin, a large steppe area,
once had the highest known north Asian concentration of Eastern Imperial Eagles
(Ryabtsev and Katzner 2007, Ryabtsev 2011). The population here has declined by
at least 80% in the past few decades possibly due to fatalities caused by
environmental contaminants in tropical wintering grounds in southeast Asia (Ueta
and Ryabtsev 2001, Ryabtsev and Katzner 2007). Unfortunately, the extent and
effects of environmental contaminants are not well studied in the tropics (Lacher

33
and Goldstein 1997). However, this is a highly plausible cause of population decline
given the potential environmental impacts of intensified agriculture in southeast
Asian countries (Tinker 1997, Mineau and Whiteside 2013). Another example is the
threat of contaminants to Steller’s Sea Eagles that breed on Sakhalin Island and
winter in Japan. In summer, Steller’s Sea Eagles typically feed on fish. However,
during harsh winters or during periods of overfishing, these birds shift feeding
habits and scavenge on sika deer Cervus nippon (Shiraki 2001). This has led to
increasing incidences of lead poisoning, when birds feed on hunter-killed, but
unrecovered, deer or offal (Urosawa 2000, Saito 2009).
Finally, Asia’s long-distance migratory species also may face pressures outside of
Asia. For example, Pallid Harriers Circus macrourus and Red-footed Falcons Falco
vespertinus breed in central Asia and their populations are complete migrants
(Galushin et al. 2003, Panuccio 2007, Brochet et al. 2016, Katzner et al. 2016). On
migration, far from their breeding or wintering grounds, these species pass through
geographic bottlenecks in Europe where shooting birds of prey is common.
Priority species Asia holds a third of the world’s Critically Endangered raptors, including two of the
most genetically distinct birds of prey, the Philippine Eagle and the Forest Owlet
(Jetz et al. 2014). These species, along with the Endangered Gyps species, are
endemic to the Asian continent and have undergone drastic population declines
making them among the highest regional priorities for conservation (BirdLife
International 2001).
The Philippine Eagle, whose wild population is estimated at 82 to 250 pairs (Bueser
et al. 2003, BirldLife International 2017), is emblematic of Asia’s raptor
conservation problems. The species is endemic to the Philippine archipelago
(Kennedy 1981, Kennedy et al. 2000) and occupies Philippine tropical forests
(Bueser et al. 2001), of which only 3% now remains (Myers et al. 2000). Beyond
land-use change, it faces threats from shooting, trade, electrocution, and
environmental contaminants. Extensive deforestation also reduced space for the

34
Philippine Eagle’s prey base (Kennedy 1985, Concepcion et al. 2006) and has
increased opportunities for human persecution. Although the Philippine Eagle
receives legislative protection (Salvador and Ibanez 2006), its current estimated
population decline remains at 2 — 10% per year (Ibañez et al. 2016).
Globally, no other continent has a higher proportion of migratory raptor species
than Asia (Bildstein 2006). Forty percent of all migratory raptors of Asia are
endemic to the Asian continent; these endemics include Pallas’s Fish-eagle, Steller’s
Sea Eagle and the Himalayan Griffon. Although a majority of Asia’s most threatened
raptors are not migratory, 15% are full migrants. Migratory raptors of Asia are also
faring considerably worse than average migratory raptors elsewhere. Further,
compared to their European and African counterparts, Asian populations of cross-
continental migrant species are largely unstudied (Kirby et al. 2008). As an example,
migrants using Asia’s Oceanic and Continental Flyways are poorly known and only
recently have studies been published on this flyway (Concepcion et al. in press,
Bildstein 2006). All of these factors make Asia’s migratory raptors high priority for
conservation and research.
Migratory species face unique threats in their breeding, stopover and wintering
habitats (Webster et al. 2002). For such species, especially species with large home
ranges, creation of protected areas for breeding sites alone often is not an efficient
conservation approach (BirdLife International 2001, Finch et al. 2017).
Comprehensive and actionable management plans would allow identification of
these unique threats across all these habitats and provide a framework for
addressing those threats.
Priority regions and countries Among regions, south and southeast Asia have the highest number of species
overall, the highest number of endemic species, and the highest number of globally
Threatened and Near-Threatened species. Sixty-two percent of Threatened species
and 56% of Near-Threatened are island endemics. As a result, raptors of south and
southeast Asia are more at risk than elsewhere in the continent. Eight of the 10 most

35
speciose Asian countries that also have the most Threatened and Near-Threatened
species are also found in this region. This diversity of raptors can be partly
attributed to the extent of tropical forests that once covered most of the region
(Olson and Dinerstein 2002, Laurance 2007). Unfortunately, tropical forests are
extremely vulnerable landscapes (Brooks et al. 2006) and those in southeast Asia
have experienced, and continue to experience, higher rates of conversion than
elsewhere in the world (Laurance 1999, Sodhi et al. 2004). This is to the detriment
of south and southeast Asia’s raptors that heavily use these forests.
There is a significant lack of information for tropical Asia’s raptors, especially of
island endemics (Thiollay 1985, McGowan et al. 1998, BirdLife International 2001).
With the exception of work on a few charismatic species such as the Philippine Eagle
and the Javan Hawk-eagle, most of the region’s raptors continue to be largely
unstudied. South and southeast Asia is a conservation and research priority region.
Protection of the region’s raptor species, especially of island endemics, intrinsically
has a disproportionately large impact on the global raptor population. There is
therefore a need to collect ecologically sound information to enable their protection.
Priority topics for research Without basic information on species biology and demography, it can be difficult to
properly direct conservation and management strategies for raptors (Collar 1997,
Van Balen et al. 2000, BirdLife International 2001, Mace and Collar 2002, Sutherland
et al. 2004, Katzner et al. 2011). For example, Pallas’s Fish-eagle is probably the
world’s most poorly studied Northern Hemisphere eagle (Katzner and Tingay
2010). It is classified as Vulnerable on the basis of reported population declines
(BirdLife International 2001, Ferguson-Lees and Christie 2005). Although its precise
distribution is poorly known, the main breeding populations of Pallas’s Fish-eagle
are thought to be in China, Mongolia and India (Ferguson-Lees and Christie 2005,
BirldLife International 2017), with lower-density populations in surrounding
countries. However, recent field work suggests that Mongolia never was a breeding
stronghold for the species (Gilbert et al. 2014), the implication being that
conservation action directed there may have little impact for this species. This

36
finding illustrates how a lack of knowledge can confound potential conservation
programs.
Apart from research on species biology and demography, there are other
overlapping research needs for Asia’s Threatened and Near-Threatened species
(BirdLife International 2001). There is also a need to identify specific threats to
populations and reasons for population declines. For migratory species, this extends
to describing the different pressures faced in summer, migratory and wintering
areas (Webster et al. 2002). Likewise, there is a need to study biology, demography
and threats of prey species on which raptors depend (BirdLife International 2001).
Finally, laboratory studies may also be important to identify disease and the
physiological effects of environmental contaminants (Lacher and Goldstein 1997,
BirdLife International 2001).
The effects to raptors of renewable energy and electrocution are also priority topics
for research, especially in Asian grassland and treeless ecosystems. As energy
development has rapidly grown in west and central Asia, electrocution has become
a growing concern for raptor populations (Kamp et al. 2016). Separate surveys in
Kazakhstan documented that as many as 21 raptor species died from electrocution,
including eight threatened and near-threatened species such as the Saker Falcon,
the Egyptian Vulture Neophron percnopterus and the Steppe Eagle (Karyakin 2008,
Lasch et al. 2010, Levin and Kurkin 2013, Pestov et al. 2015). In east Asia,
particularly in Mongolia, older, wood pole electrical structures are being replaced
with concrete poles with grounded metal crossarms. The energized parts of these
newer, concrete poles are closer to the ground than the older wood poles, which in
turn have increased electrocution of raptors (Harness et al. 2008). As many as 13
species, including 4 migrants, have been documented dying from electrocution in
this region (Dixon et al. 2013).
Research elsewhere suggests that new threats may emerge from development of
wind and solar energy. Collision with wind turbine blades, for example, can cause
trauma or death (Madders and Whitfield 2006, Smith and Dwyer 2016). Trauma and

37
death could also come from solar tower facilities as a result of collision with
infrastructure or exposure to concentrated solar energy or solar flux (Smith and
Dwyer 2016, Walston et al. 2016). There also are threats of collision, disturbance
and land use change even before these facilities are completed (Tsoutsos et al. 2005,
Smith and Dwyer 2016). Wind energy is particularly interesting because its direct
and indirect effects on raptor populations can alter demography (Katzner et al.
2013).
Poorly known species
Poorly known species are an important priority for research. Four out of six (67%)
of the world’s Data Deficient raptor species occur in Asia (Table 1; BirdLife
International 2017). These are the Chestnut-shouldered Goshawk Erythrotriorchis
buergersi, Papuan Boobook Uroglax dimorpha, Seram Masked Owl Tyto almae, and
the Nicobar Scops-Owl Otus alius of south and southeast Asia. All three owls are
island endemics.
Modern and updated identification literature is also key to the quality and reliability
of ecological studies (BirdLife International 2001). Establishing identification
literature is made more challenging because some Asian species are only now being
recognized (eg. Spizaetus philippinesis complex: Gamauf et al. 2005, Ninox
philippensis complex: Rasmussen et al. 2012). Accurate identification of species is
obviously crucial to conservation as unrecognized species may be lost due to lack of
protection (Gamauf et al. 2005). This is of particular concern in south and southeast
Asia where the range of landscapes available, the isolation of some of these
landscapes, and the geography of the region (i.e. islands of varying sizes and
distances to the mainland) contribute to a high level of endemism (Gentry 1992,
White and Kiff 2000).
CONCLUSIONS Raptors are more at risk in Asia than elsewhere in the world. Our summary of Asia’s
raptor diversity and human threats supports the need to continue cataloguing the
status, threats and needs, and understanding conservation priorities for these

38
species. Holding almost half of all the world’s raptor species, and half of all the
endemic species, the continued decline and potential loss of raptors in this region is
truly a global concern.
One of the things highlighted in our summary is the lack of information on Asia’s
raptor species. This lack of information is exemplified in the scarce literature
available for raptors of Asia. For example, compared to raptors of other tropical
regions, tropical Asia has the least published information (Kiff et al. 2007). There
also are instances when information is available but unavailable in international
abstracting services or unavailable in English (Kiff et al. 2007, Clavero 2010).
Similarly, researchers in Asia may have limited access to published information or
limited opportunities to publish in English journals (Salager-Meyer 2008).
Lack of information may also mean that actions will not be taken until some species
are lost. For example, data from long-term migration monitoring informed of the
population decline of several species in North America due to organochlorides
(Bednarz et al. 1990). The relatively early-warning provided ample time to
determine the cause of decline and to respond appropriately (eg. Bald Eagle: Grier
1982, Fraser et al. 1996, Watts et al. 2008). This and other types of monitoring are
lacking for most, if not all, of Asian species.
Conservation urgency presents opportunities for future work. The establishment of
the Asian Raptor Research Network (ARRCN) in 1998 has created a community for
researchers of Asian raptors (Kiff et al. 2007). The ARRCN is vital in sharing valuable
information through organizing symposia, promoting communication among
researchers and disseminating published abstracts. With access to training,
mentoring and funding, it is possible for current and rising raptor researchers in
Asia to begin systematically addressing threats and knowledge gaps. Like most
things in these contemporary times, international collaboration would be vital in
achieving these goals.
Simply put, much work remains to be done to elevate conservation efforts in the
continent to at least those of elsewhere in the world. The time to start is now, before

39
many common species decline to the status of conservation priority, and before less
common species become extinct.
ACKNOWLEDGMENTS
We thank Tris Allinson who generously compiled the BirdLife data we analyzed. We
also thank Tracy Maffett Prado and Medel Silvosa who helped prepare initial data
used to organize the manuscript. Statement of author contributions: TEK and CBC
organized the manuscript at the invitation of the editors; CBC organized published
data and led writing and all authors contributed to revisions of the manuscript. Any
use of trade, firm or product names is for descriptive purposes only and does not
imply endorsement by the U.S. Government.
REFERENCES
Acharya, R., R. Cuthbert, H. S. Baral, and K. B. Shah. 2009. Rapid population declines of Himalayan Griffon Gyps himalayensis in Upper Mustang, Nepal. Bird Conservation International 19:99–107.
Ahmed, A. 2010. Imperilled Custodians of the Night: A study on illegal trade trapping and use owls in India. Page (T. India/WWF-India, Ed.). New Delhi, India.
Amar, A., J. Davies, E. Meek, J. Williams, A. Knight, and S. Redpath. 2011. Long-term impact of changes in sheep Ovis aries densities on the breeding output of the hen harrier Circus cyaneus. Journal of Applied Ecology 48:220–227.
Andersson, M. 1978. Optimal foraging area: Size and allocation of search effort. Theoretical Population Biology 13:397–409.
Aratrakorn, S., S. Thunhikorn, and P. F. Donald. 2006. Changes in bird communities following conversion of lowland forest to oil palm and rubber plantations in southern Thailand. Bird Conservation International 16:71–82.
Van Balen, S., V. Nijman, and H. H. T. Prins. 2000. The Javan hawk-eagle: Misconceptions about rareness and threat. Biological Conservation 96:297–304.
Baral, H. S., J. B. Giri, and M. Z. Virani. 2004. On the decline of Oriental White-backed Vultures Gyps bengalensis in lowland Nepal. Pages 215–219in R. D. Chancellor and B.-U. Meyburg, editors.Raptors Worldwide: Proceedings of the 6th World Conference on Birds of Prey and Owls. WWGBP and MME/Birdlife Hungary,

40
Berlin, Germany and Budapest, Hungary.
Battin, J. 2004. When good animals love bad habitats: ecological traps and the conservation of animal populations. Conservation Biology 18:1482–1491.
Bednarz, J., D. Klem, L. J. Goodrich, and S. E. Senner. 1990. Migration counts of raptors at Hawk Mountain, Pennsylvania, as indicators of population trends, 1934-1986. The Auk 107:96–109.
Bélisle, M., and A. Desrochers. 2002. Gap-crossing decisions by forest birds: An empirical basis for parameterizing spatially-explicit, individual-based models. Landscape Ecology 17:219–231.
Beukema, H., F. Danielsen, G. Vincent, S. Hardiwinoto, and J. Van Andel. 2007. Plant and bird diversity in rubber agroforests in the lowlands of Sumatra, Indonesia. Agroforestry Systems 70:217–242.
Bildstein, K. L. 1998. Conservation status of tropical raptors. Journal of Raptor Research 32:3–18.
Bildstein, K. L. 2001. Raptors as vermin: A history of human attitudes toward Pennsylvania’s birds of prey. Endangered Species UPDATE 18:124–128.
Bildstein, K. L. 2006. Migrating raptors of the world: Their ecology and conservation. Cornell University Press, Ithaca, New York.
BirdLife International. 2001. Threatened birds of Asia: the BirdLife International Red Data Book. BirdLife International, Cambridge, UK.
BirldLife International. 2017. IUCN Red List for birds. http://www.birdlife.org.
Braimoh, A. K., and H. Q. Huang. 2015. Land systems vulnerability. Pages 1–7in A. K. Braimoh and H. Q. Huang, editors.Vulnerabitliy of Land Systems in Asia. John Wiley & Sons, Ltd., West Sussexx, UK.
Brochet, A.-L., W. Van Den Bosschen, S. Jbour, P. K. Ndang’ang’a, V. R. Jones, W. A. L. I. A. Abdou, A. R. Al-hmoud, N. G. Asswad, J. C. Atienza, I. Atrash, N. Barbara, K. Bensusan, T. Bino, C. Celada, S. I. Cherkaoui, J. Costa, B. Deceuninck, K. S. Etayeb, C. Feltrup-Azafzaf, J. Figelj, M. Gustin, P. Kmecl, V. Kocevski, M. Korbeti, D. Kotrošan, J. Mula Laguna, M. Lattuada, D. Leitão, P. Lopes, N. López-Jiménez, V. Lucić, T. Micol, A. Moali, Y. Perlman, N. Piludu, D. Portolou, K. Putilin, G. Quaintenne, G. Ramadan-Jaradi, M. Ružić, A. Sandor, N. Sarajli, D. Saveljic, R. D. Sheldon, T. Shialis, N. Tsiopelas, F. Vargas, C. Thompson, A. Brunner, R. Grimmett, and S. H. M. Butchart. 2016. Preliminary assessment of the scope and scale of illegal killing and taking of birds in the Mediterranean. Bird Conservation International 26:1–28.
Brooks, T. M., R. A. Mittermeier, G. A. B. da Fonseca, J. Gerlach, M. Hoffmann, J. F. Lamoreux, C. G. Mittermeier, J. D. Pilgrimd, and A. S. L. Rodrigues. 2006. Global biodiversity conservation priorities. Science 313:58–61.
Bueser, G. L., K. G. Bueser, D. S. Afan, D. I. Salvador, J. W. Grier, R. S. Kennedy, and H. C. Miranda Jr. 2003. Distribution and nesting density of the Philippine Ealge

41
Pithecophaga jeffreyi on Mindanao Island, Philippines: what do we know after 100 years? Ibis 145:130–135.
Burger, K., and H. P. Smit. 2001. International market responses to the Asian Crisis for rubber, cocoa and coffee. Pages 31–48in F. Gérard and F. Ruf, editors.Agriculture in crisis: People, Commodities and natural resources in Indonesia, 1996-2000. Curzon Press, Montpellier.
Carrete, M., J. L. Tella, G. Blanco, and M. Bertellotti. 2009. Effects of habitat degradation on the abundance, richness and diversity of raptors across Neotropical biomes. Biological Conservation 142:2002–2011.
Clavero, M. 2010. “Awkward wording. Rephrase”: Linguistic injustice in ecological journals. Trends in Ecology and Evolution 25:552–553.
Clay, J. 2004. World agriculture and the environment: A commodity-by-commodity guide to impacts and practices. Island Press, Washington, DC.
Collar, N. J. 1997. Species survival versus perpetuation of myth: The case of the Philippine Eagle. Oryx 31:4–7.
Concepcion, C. B., P. T. Dumandan, M. R. Silvosa, K. L. Bildstein, and T. E. Katzner. (n.d.). Species composition, timing and meteorological correlates of autumn open-water crossings by raptors migrating along the East-Asian Oceanic Flyway. Journal of Raptor Research.
Concepcion, C. B., M. Sulapas, and J. C. Ibanez. 2006. Food habits and breeding behavior at a Philippine Eagle nest in Mount Apo Natural Park, Mindanao, Philippines. Banwa 3:91–105.
Cuthbert, R. J., M. A. Taggart, V. Prakash, S. Chakraborty, P. Deori, T. Galligan, M. Kulkarni, S. Ranade, M. Saini, A. K. Sharma, R. Shringarpure, and R. E. Green. 2014. Avian scavengers and the threat from veterinary pharmaceuticals. Phil. Trans. R. Soc. B 369: 369:574.
Cuthbert, R. J., M. A. Taggart, M. Saini, A. Sharma, A. Das, M. D. Kulkarni, P. Deori, S. Ranade, R. N. Shringarpure, T. H. Galligan, and R. E. Green. 2016. Continuing mortality of vultures in India associated with illegal veterinary use of diclofenac and a potential threat from nimesulide. Oryx 50:104–112.
Dalvi, S., and B. Haralu. 2014. Doyang Reservoir: A potential IBA in Nagaland. Mistnet 15:24–28.
Dixon, A., N. Batbayar, G. Purev-Ochir, and N. Fox. 2011. Developing a sustainable harvest of saker falcons (Falco cherrug) for falconry in Mongolia. Pages 363–372in R. T. Watson, T. Cade, M. Fuller, G. Hunt, and E. Potapov, editors.Gyrfalcons and Ptarmigan in a changing world. The Peregrine Fund, Boise, ID.
Dixon, A., R. Maming, A. Gunga, G. Purev-Ochir, and N. Batbayar. 2013. The problem of raptor electrocution in Asia: Case studies from Mongolia and China. Bird Conservation International 23:520–529.

42
Donovan, T. M., and F. R. Thompson. 2001. Modeling the ecological trap hypothesis: A habitat and demographic analysis for migrant songbirds. Ecological Applications 11:871–882.
Ferguson-Lees, J., and D. Christie. 2005. Raptors fo the world: A field guide. Princeton University Press.
Ferguson-Lees, J., and D. A. Christie. 2001. Raptors of the world. Houghton Mifflin Company, New York.
Finch, T., S. Butler, A. Franco, and W. Cresswell. 2017. Low migratory connectivity is common in long-distance migrant birds. Journal of Animal Ecology.
Fisher, I. J., D. J. Pain, and V. G. Thomas. 2006. A review of lead poisoning from ammunition sources in terrestrial birds. Biological Conservation 131:421–432.
Fitzherbert, E. B., M. J. Struebig, A. Morel, F. Danielsen, C. A. Br??hl, P. F. Donald, and B. Phalan. 2008. How will oil palm expansion affect biodiversity? Trends in Ecology and Evolution 23:538–545.
Fox, N. 2001. Future trends, captive breeding, trade controls or market forces? Pages 212–214in E. Potapov, S. Banzragch, N. Fox, and N. Barton, editors.Saker Falcon in Mongolia: Research and conservation. Mongolian Academy of Sciences, Ulanbaatar, Mongolia.
Fraser, J. D., S. K. Chandler, D. A. Buehler, and J. K. D. Seegar. 1996. The decline, recovery and future of the bald eagle population of the Chesapeake Bay, U.S.A. Pages 181–187in B.-U. Meyburg and R. D. Chancellor, editors.Eagle studies. WWBGBP, Berlin.
Fravel, M. T. 2015. Territorial and maritime boundary disputes in Asia. Pages 524–546in S. M. Pekkanen, J. Ravenhill, and R. Foot, editors.Oxford handbook of international relations in Asia. Oxford University Press, New York.
Galligan, T. H., T. Amano, V. M. Prakash, M. Kulkarni, R. Shringarpure, N. Prakash, S. Ranade, R. E. Green, and R. J. Cuthbert. 2014. Have population declines in Egyptian Vulture and Red-headed Vulture in India slowed since the 2006 ban on veterinary diclofenac? Bird Conservation International 24:272–281.
Galloway, J. N., D. S. Ojima, and J. M. Melillo. 1998. Asian change in the context of global change: An overview. Pages 1–17in J. N. Galloway and J. M. Melillo, editors.Asian Change in the Context of Global Climate Change: Impact of natural and anthropogenic changes in Asia on global biogeochemistry. Cambridge University Press, Cambridge, UK.
Galushin, V., R. Clarke, and A. Davygora. 2003. International action plan for the Pallid Harrier (Circus macrourus). Birdlife International, Strasbourg, France.
Gamauf, A., J.-O. Gjershaug, N. Røv, K. Kvaløy, and E. Haring. 2005. Species or subspecies? The dilemma of taxonomic ranking of some South-East Asian hawk-eagles (genus Spizaetus). Bird Conservation International 15:99–117.
Gangoso, L., P. Álvarez-Lloret, A. A. B. Rodríguez-Navarro, R. Mateo, F. Hiraldo, and J.

43
A. Donázar. 2009. Long-term effects of lead poisoning on bone mineralization in vultures exposed to ammunition sources. Environmental Pollution 157:569–574.
Gentry, A. H. 1992. Tropical forest biodiversity: Distributional patterns and their conservational significance. Oikos 63:19–28.
Gilbert, M., J. L. Oaks, M. Z. Virani, R. T. Watson, S. Ahmed, M. J. I. Chaudhry, M. Arshad, S. Mahmood, A. Ali, R. M. Khattak, and A. A. Khan. 2004. The status and decline of vultures in the provinces of Punjab and Sind, Pakistan: A 2003 update. Pages 221–234in R. D. Chancellor and B.-U. Meyburg, editors.Raptors Worldwide: Proceedings of the 6th World Conference on Birds of Prey and Owls. WWGBP and MME/Birdlife Hungary, Berlin, Germany and Budapest, Hungary.
Gilbert, M., R. Tingay, L. Jambal, N. Sureda, C. Gilbert, B. Davaasuren, and G. Sundev. 2014. Distribution and status of the Pallas’s Fish Eagle Haliaeetus leucoryphus in Mongolia: A cause for conservation concern? Bird Conservation International 24:379–388.
Gilbert, M., R. T. Watson, S. Ahmed, M. Asim, and J. A. Johnson. 2007. Vulture restaurants and their role in reducing diclofenac exposure in Asian vultures. Bird Conservation International 17:63–77.
Grier, J. W. 1982. Ban of DDT and subsequent recovery of reproduction in bald eagles. Science 218:1232–1235.
Hall, J. C., A. K. Chhangani, T. A. Waite, and I. M. Hamilton. 2011. The impacts of La Niña-induced drought on Indian Vulture Gyps indicus populations in Western Rajasthan. Bird Conservation International 2003:1–13.
Hall, J. C., A. K. Chhangani, and T. A. Warner. 2015. Spatial characteristics of nest sites of Critically Endangered Indian Vultures (Gyps indicus) in Rajasthan, India. The Indian Forester 141:1–5.
Harness, R., S. Gombobaatar, and R. Yosef. 2008. Mongolian distribution power lines and raptor electrocutions. Page C1.1-C1.6 Rural Electric Power Conference, April 27-30, Charleston, South Carolina. Institude of Electrical and Electronics Engineer, Washington, D.C.
Harris, R. J., and J. M. Reed. 2002. Behavioral barriers to non-migratory movements of birds. Annales Zoologici Fennici 39:275–290.
Harrison, S., and B. Emilio. 1999. Habitat fragmentation and large-scale conservation: What do we know for sure? Ecography 22:225–232.
Hoekstra, J. M., T. M. Boucher, T. H. Ricketts, and C. Roberts. 2005. Confronting a biome crisis: Global disparities of habitat loss and protection. Ecology Letters 8:23–29.
Van Horne, B. 1983. Density as a misleading indicator of habitat quality. The Journal of Wildlife Management 47:893–901.

44
Ibañez, J. C., A. M. T. Sumaya, G. Tampos, and D. J. I. Salvador. 2016. Preventing Philippine Eagle hunting: What are we missing? Journal of Threatened Taxa 8:9505–9511.
Iqbal, M. 2016. Predators become prey! Can Indonesian raptors survive online bird trading? BirdingASIA 25:30–35.
IUCN. 2017. The IUCN Red List of Threatened Species. Version 2016-3. www.iucnredlist.org.
Jagannath, A., R. F. Shore, L. A. Walker, P. N. Ferns, and A. G. Gosler. 2008. Eggshell pigmentation indicates pesticide contamination. Journal of Applied Ecology 45:133–140.
Jathar, G., and A. Rahmani. 2013. Ecology of the critically endangered Forest Owlet Heteroglaux blewitti. Pages 101–112in N. Singaravelan, editor.Rare animals of India. Bentham Science Publishers, Sharjah, U.A.E.
Jetz, W., G. H. Thomas, J. B. Joy, D. W. Redding, K. Hartmann, and A. O. Mooers. 2014. Global distribution and conservation of evolutionary distinctness in birds. Current Biology 24:919–930.
Kamp, J., M. A. Koshkin, T. M. Bragina, T. E. Katzner, E. J. Milner-Gulland, D. Schreiber, R. Sheldon, A. Shmalenko, I. Smelansky, J. Terraube, and R. Urazaliev. 2016. Persistent and novel threats to the biodiversity of Kazakhstan’s steppes and semi-deserts. Biodiversity and Conservation 25:2521–2541.
Kamp, J., R. Urazaliev, P. F. Donald, and N. Hölzel. 2011. Post-Soviet agricultural change predicts future declines after recent recovery in Eurasian steppe bird populations. Biological Conservation 144:2607–2614.
Karyakin, I. V. 2008. Lines-killers continue to harvest the mortal crop in Kazakhstan. Raptors Conservation 11:14–21.
Katzner, T. E., E. A. Bragin, A. E. Bragin, M. McGrady, T. A. Miller, and K. L. Bildstein. 2016. Unusual clockwise loop migration lengthens travel distances and increases potential risks for a central Asian, long distance, trans-equatorial migrant, the Red-footed Falcon Falco vespertinus. Bird Study 63:406–412.
Katzner, T. E., J. A. R. Ivy, E. A. Bragin, E. J. Milner-Gulland, and J. A. Dewoody. 2011. Conservation implications of inaccurate estimation of cryptic population size. Animal Conservation 14:328–332.
Katzner, T. E., and R. E. Tingay. 2010. Eagle diversity, ecology and conservation. Pages 1–25in R. E. Tingay and T. E. Katzner, editors.The eagle watchers. Cornell University Press, New York, USA.
Katzner, T., J. A. Johnson, D. M. Evans, T. W. J. Garner, M. E. Gompper, R. Altwegg, T. A. Branch, I. J. Gordon, and N. Pettorelli. 2013. Challenges and opportunities for animal conservation from renewable energy development. Animal Conservation 16:367–369.
Kennedy, R. S. 1981. Saving the Philippine Eagle. National Geographic

45
Magazine:843–856.
Kennedy, R. S. 1985. Conservation research on the Philippine Eagle. Natl Geogr Soc Res Rep 18:401–414.
Kennedy, R. S., P. C. Gonzales, E. C. Dickinson, H. C. J. Miranda, and T. H. Fisher. 2000. A guide to the birds of the Philippines. Oxford University Press, New York.
Kenward, R. E. 2009. Conservation values from falconry. Pages 179–196in B. Dickson, J. Hutton, and W. M. Adams, editors.Recreational Hunting, Conservation and Rural Livelihoods: Science and Practice. Wiley-Blackwell, London, UK.
Kiff, L. F., R. G. Bijlsma, L. L. Severinghaus, and J. Shergalin. 2007. The raptor literature. Pages 11–46in D. M. Bird and K. L. Bildstein, editors.Raptor research and management techniques. Hancock House Publishers, Surrey, B.C. and Blane, W.A.
Kirby, J. S., A. J. Stattersfield, S. H. M. Butchart, M. I. Evans, R. F. a. Grimmett, V. R. Jones, J. O’Sullivan, G. M. Tucker, and I. Newton. 2008. Key conservation issues for migratory land- and waterbird species on the world’s major flyways. Bird Conservation International 18:S49–S73.
Koh, L. P., and D. S. Wilcove. 2008. Is oil palm agriculture really destroying tropical biodiversity? Conservation Letters 1:60–64.
Kraemer, R., A. V. Prishchepov, D. Müller, T. Kuemmerle, V. C. Radeloff, A. Dara, A. Terekhov, and M. Frühauf. 2015. Long-term agricultural land-cover change and potential for cropland expansion in the former Virgin Lands area of Kazakhstan. Environmental Research Letters 10:54012.
Kramer, J. L., and P. T. Redig. 1997. Sixteen years of lead poisoning in eagles, 1980-95: An epizootiologic view. Journal of Raptor Research 31:327–332.
Lacher, T. E., and M. I. Goldstein. 1997. Tropical ecotoxicology : Status and needs. Environmental Toxicology and Chemistry 16:100–111.
Lambert, O., H. Pouliquen, M. Larhantec, C. Thorin, and M. L’Hostis. 2007. Exposure of raptors and waterbirds to anticoagulant rodenticides (difenacoum, bromadiolone, coumatetralyl, coumafen, brodifacoum): Epidemiological survey in Loire Atlantique (France). Bulletin of Environmental Contamination and Toxicology 79:91–94.
Lasch, U., S. Zerbe, and M. Lenk. 2010. Electrocution of raptors at power lines in Central Kazakhstan. Waldökologie, Landschaftsforschung und Naturschutz 9:95–100.
Laurance, W. F. 1999. Reflections on the tropical deforestation crisis. Biological Conservation 91:109–117.
Laurance, W. F. 2007. Forest destruction in tropical Asia. Current Science 93:1544–1550.
Levin, A. 2011. Illegal trade and decrease in numbers of the Saker Falcon in

46
Kazakhstan. Raptors Conservation 23:64–73.
Levin, A. S., and G. A. Kurkin. 2013. The scope of death of eagles on powerlines in western Kazakhstan. Raptors Conservation 27:240–244.
Lourenço, R., P. C. Tavares, M. Del Mar Delgado, J. E. Rabaça, and V. Penteriani. 2011. Superpredation increases mercury levels in a generalist top predator, the eagle owl. Ecotoxicology 20:635–642.
Lyde, L. W. 1904. A Geography of Asia including the East Indies. Adam and Charles Black, London, UK.
Mace, G. M., and N. J. Collar. 2002. Priority-setting in species conservation. Pages 61–73in K. Norris and D. J. Pain, editors.Conserving Bird Biodiversity: General principles and their application. Cambridge University Press (Conservation Biology Series No. 7), Cambridge, UK.
Madders, M., and D. P. Whitfield. 2006. Upland raptors and the assessment of wind farm impacts. Ibis 148:43–56.
Markandya, A., T. Taylor, A. Longo, M. N. Murty, S. Murty, and K. Dhavala. 2008. Counting the cost of vulture decline-An appraisal of the human health and other benefits of vultures in India. Ecological Economics 67:194–204.
McGowan, P., M. Gillman, and M. Dodd. 1998. Assessing the status of poorly known species: Lessons from partridges and pheasants of Southeast Asia. Biological Conservation 83:1–7.
Mineau, P., M. R. Fletcher, L. C. Glaser, N. j. Thomas, C. Brassard, L. K. Wilson, L. A. Lyon, C. J. Henny, T. Bollinger, and S. L. Porter. 1999. Poisoning of raptors with organophosphorus and carbamate pesticides with emphasis on Canada, U.S. and U.K. Journal of Raptor Research 33:1–37.
Mineau, P., and M. Whiteside. 2013. Pesticide acute toxicity is a better correlate of U.S. grassland bird declines than agricultural intensification. PLoS ONE 8:e57457.
Myers, N., R. A. Mittermeier, C. G. Mittermeier, G. A. B. da Fonseca, and J. Kent. 2000. Biodiversity hotspots for conservation priorities. Nature 403:853–858.
Newton, I. 1979. Population ecology of raptors. T & AD Poyser, Berkhamsted.
Newton, I. 1980. The role of food in limiting bird numbers. Ardrea 68:11–30.
Newton, I. 1998. Population limitation in birds. Academic Press, Inc., London.
NWBCT. 2017. Amur Falcon conservation in Nagaland, India. https://medium.com/@NWBCT/amur-falcon-conservation-in-nagaland-india-29259f793ef#.3kyrrndpx.
Oaks, J. L., M. Gilbert, M. Z. Virani, R. T. Watson, C. U. Meteyer, B. a Rideout, H. L. Shivaprasad, S. Ahmed, M. J. I. Chaudhry, M. Arshad, S. Mahmood, A. Ali, and A. A. Khan. 2004a. Diclofenac residues as the cause of vulture population decline in Pakistan. Nature 427:630–633.

47
Oaks, J. L., C. U. Meteyer, B. A. Rideout, H. L. Shivaprasad, M. Gilbert, M. Virani, R. T. Watson, and A. A. Khan. 2004b. Diagnostic investigation of vulture mortality: The anti-inflammatory drug Diclofenac is associated with visceral gout. Pages 241–243in R. D. Chancellor and B.-U. Meyburg, editors.Raptors Worldwide: Proceedings of the 6th World Conference on Birds of Prey and Owls. WWGBP and MME/Birdlife Hungary, Berlin, Germany and Budapest, Hungary.
Olson, D. M., and E. Dinerstein. 2002. The Global 200: Priority ecoregions for global conservation. Annals of the Missouri Botanical Garden 89:199–224.
Pain, D. J., C. G. R. Bowden, A. A. Cunningham, D. Das, M. Gilbert, R. D. Jakati, Y. Jhala, A. A. Khan, V. Naidoo, A. Rahmani, S. P. Ranade, H. S. Baral, K. R. Senacha, S. Saravanan, N. Shah, G. Swan, D. Swarup, M. A. Taggart, R. T. Watson, M. Z. Virani, K. Wolter, and R. Green E. 2008. The race to prevent the extinction of south Asian vultures. Bird Conservation International 18:S30–S48.
Panuccio, M. 2007. Protection of migratory raptors in the Mediterranean. Sustainable Mediterranean:13–14.
Pestov, M. V., F. A. Saraev, V. A. Terentiev, and Z. E. Nurmuhambetov. 2015. The Project Outcome “Assessment of the impact of medium voltage power lines on avifauna in Mangistau Region (Kazakhstan).” Raptors Conservation 31:64–74.
Population Reference Bureau. 2016. 2016 world population data sheet. http://www.prb.org/pdf16/prb-wpds2016-web-2016.pdf.
Prakash, V., M. C. Bishwakarma, A. Chaudhary, R. Cuthbert, R. Dave, M. Kulkarni, S. Kumar, K. Paudel, S. Ranade, R. Shringarpure, and R. E. Green. 2012. The population decline of Gyps vultures in India and Nepal has slowed since veterinary use of diclofenac was banned. PLoS ONE 7:e49118.
Prakash, V., D. J. Pain, A. A. Cunningham, P. F. Donald, N. Prakash, A. Verma, R. Gargi, S. Sivakumar, and A. R. Rahmani. 2003. Catastrophic collapse of Indian White-backed Gyps bengalensis and Long-billed Gyps indicus Vulture populations. Biological Conservation 109:381–390.
Prakash, V., D. J. Pain, S. Shultz, and A. Cunningham. 2004. Saving Asia’s Gyps Vultures : The “Vulture Rescue” Team’ s conservation programme. Pages 245–255in R. D. Chancellor and B.-U. Meyburg, editors.Raptors Worldwide: Proceedings of the 6th World Conference on Birds of Prey and Owls. WWGBP and MME/Birdlife Hungary, Berlin, Germany and Budapest, Hungary.
Rasmussen, P. C., D. N. S. Allen, N. J. Collar, B. Demeulemeester, R. O. Hutchinson, P. G. C. Jakosalem, R. S. Kennedy, F. R. Lambert, and L. M. Paguntalan. 2012. Vocal divergence and new species in the Philippine Hawk Owl Ninox philippensis complex. Forktail 28:1–20.
Ratcliffe, D. A. 1970. Changes attributable to pesticides in egg breakage frequency and eggshell thickness in some British birds. Journal of Applied Ecology 7:67–115.
Real, J., and S. Mañosa. 1997. Demography and conservation of Western European
48
Bonelli’s eagle Hieraaetus fasciatus populations. Biological Conservation 79:59–66.
Rolstad, J. 1991. Consequences of forest fragmentation for the dynamics of bird populations : conceptual issues and the evidence. Biological Journal of Linnean Society 42:149–163.
Ryabtsev, V. V. 2011. Easternmost eastern Imperial Eagle population in crisis. Acta Zoologica Bulgarica 63:29–36.
Ryabtsev, V. V., and T. E. Katzner. 2007. Severe declines of Eastern Imperial Eagle Aquila heliaca populations in the Baikal region, Russia: A modern and historical perspective. Bird Conservation International 17:197–209.
Saito, K. 2009. Lead Poisoning of Steller’s Sea Eagle (Haliaeetus pelagicus) and White-tailed Eagle (Haliaeetus albicilla) caused by the ingestion of lead bullets and slugs, in Hokkaido, Japan. Pages 302–309Ingestion of Lead from Spent Ammunition: Implications for Wildlife and Humans. The Peregrine Fund, Boise, ID.
Salager-Meyer, F. 2008. Scientific publishing in developing countries: Challenges for the future. Journal of English for Academic Purposes 7:121–132.
Salvador, D. I., and J. C. Ibanez. 2006. Ecology and conservation of Philippine Eagles. Ornithological Science 5:171–176.
Sánchez-Zapata, J. A., M. Carrete, A. Gravilov, S. Sklyarenko, O. Ceballos, J. A. Donázar, and F. Hiraldo. 2003. Land use changes and raptor conservation in steppe habitats of Eastern Kazakhstan. Biological Conservation 111:71–77.
Sheffield, S. 1997. Owls as biomonitors of environmental contamination. Pages 383–398United States department of Agriculture Forest Service General Technical report NC.
Shiraki, S. 2001. Foraging habitats of Steller’s sea-eagles during the wintering season in Hokkaido, Japan. Journal of Raptor Research 35:91–97.
Shultz, S., H. S. Baral, S. Charman, A. a Cunningham, D. Das, G. R. Ghalsasi, M. S. Goudar, R. E. Green, A. Jones, P. Nighot, D. J. Pain, and V. Prakash. 2004. Diclofenac poisoning is widespread in declining vulture populations across the Indian subcontinent. Proceedings of the Royal Society B 271:S458–S460.
Smart, J., A. Amar, I. M. W. Sim, B. Etheridge, D. Cameron, G. Christie, and J. D. Wilson. 2010. Illegal killing slows population recovery of a re-introduced raptor of high conservation concern - The red kite Milvus milvus. Biological Conservation 143:1278–1286.
Smith, J. A., and J. F. Dwyer. 2016. Avian interactions with renewable energy infrastructure: An update. The Condor 118:411–423.
Sodhi, N. S., L. P. Koh, B. W. Brook, and P. K. L. Ng. 2004. Southeast Asian biodiversity: An impending disaster. TRENDS in Ecology and Evolution 19:654–660.

49
Sodhi, N. S., L. P. Koh, R. Clements, T. C. Wanger, J. K. Hill, K. C. Hamer, Y. Clough, T. Tscharntke, M. R. C. Posa, and T. M. Lee. 2010. Conserving Southeast Asian forest biodiversity in human-modified landscapes. Biological Conservation 143:2375–2384.
Solonen, T., and M. Lodenius. 1984. Mercury in Finnish sparrowhawks Accipiter nisus. Ornis Fennica 61:58–63.
Spencer, J. E. 1954. Asia, east by south. John Wiley & Sons, Ltd., New York.
Stone, W. B., J. C. Okoniewski, and J. R. Stedelin. 2003. Anticoagulant rodenticides and raptors: Recent findings from New York, 1998-2001. Bulletin of Environmental Contamination and Toxicology 70:34–40.
Sutherland, W. J., A. S. Pullin, P. M. Dolman, and T. M. Knight. 2004. The need for evidence-based conservation. TRENDS in Ecology and Evolution 19:305–308.
Swarup, D., R. C. Patra, V. Prakash, R. Cuthbert, D. Das, P. Avari, D. J. Pain, R. E. Green, A. K. Sharma, M. Saini, D. Das, and M. Taggart. 2007. Safety of meloxicam to critically endangered Gyps vultures and other scavenging birds in India. Animal Conservation 10:192–198.
Symes, C. T. 2012. Amur Falcon Falco amurensis slaughter in Nagaland, India. Gabar 23:69–73.
Taggart, M. A., K. R. Senacha, R. E. Green, Y. V. Jhala, B. Raghavan, A. R. Rahmani, R. Cuthbert, D. J. Pain, and A. A. Meharg. 2007. Diclofenac residues in carcasses of domestic ungulates available to vultures in India. Environment International 33:759–765.
Tenan, S., J. Adrover, A. Muñoz Navarro, F. Sergio, and G. Tavecchia. 2012. Demographic consequences of poison-related mortality in a threatened bird of prey. PLoS ONE 7:e49187.
The Association of Academies of Sciences in Asia. 2011. Towards a sustainable Asia: Environment and climate change. Springer/Science Press, Heidelberg and Beijing.
Thiollay, J.-M. 1985. The tropical rainforest raptors: State of knowledge, world situation and conservation strategy. ICBP Technical Publication 5:223–225.
Thiollay, J. M. 1998. Current status and conservation of falconiformes in tropical Asia. Journal of Raptor Research 32:40–55.
Tilman, D., J. Fargione, B. Wolff, C. D’Antonio, A. Dobson, R. Howarth, D. Schindler, W. H. Schlesinger, D. Simberloff, and D. Swackhamer. 2001. Forecasting agriculturally driven global environmental change. Science 292:281–284.
Tinker, P. B. 1997. The environmental implications of intensified land use in developing countries. Philosophical Transactions of the Royal Society of London - Series B: Biological Sciences 352:1023–1033.
Tsoutsos, T., N. Frantzeskaki, and V. Gekas. 2005. Environmental impacts from the solar energy technologies. Energy Policy 33:289–296.
50
Udvardy, M. D. F. 1975. A classification of the biogeographical provinces of the world. Occasional. International Union of Conservation of Nature and Natural Resources, Morges, Switzerland.
Ueta, M., and V. V. Ryabtsev. 2001. Migration routes of four juvenile Imperial Eagles Aquila heliaca from the Baikal region of eastern Russia. Bird Conservation International 11:93–99.
Urosawa, N. K. 2000. Lead poisoning in Steller’s Sea Eagles and White-tailed Sea Eagles. Pages 107–109in M. Ueta and M. J. McGrady, editors.First Symposium on Steller’s And White-tailed Sea Eagles in East asia. Wild Bird Society of Japan, Tokyo.
Wallin, K. 1984. Decrease and recovery patterns of some raptors in relation to the introduction and ban of alkyl-mercury and DDT in Sweden. Ambio 13:263–265.
Walston, L. J., K. E. Rollins, K. E. LaGory, K. P. Smith, and S. A. Meyers. 2016. A preliminary assessment of avian mortality at utility-scale solar energy facilities in the United States. Renewable Energy 92:405–414.
Warren-Thomas, E., P. M. Dolman, and D. P. Edwards. 2015. Increasing demand for natural rubber necessitates a robust sustainability initiative to mitigate impacts on tropical biodiversity. Conservation Letters 8:230–241.
Watson, J. 1992. Nesting ecology of the Seychelles Kestrel Falco araea on Mahé, Seychelles. Ibis 134:259–267.
Watts, B. D., G. D. Therres, and M. A. Byrd. 2008. Recovery of the Chesapeake Bay Bald Eagle nesting population. The Journal of Wildlife Management 72:152–158.
Webster, M. S., P. P. Marra, S. M. Haig, S. Bensch, and R. T. Holmes. 2002. Links between worlds: Unraveling migratory connectivity. Trends in Ecology & Evolution 17:76–83.
White, C. M., and L. F. Kiff. 2000. Biodiversity, island raptors and species concepts. Pages 633–652in R. D. Chancellor and B.-U. Meyburg, editors.Raptors at risk. World Working Group on Birds of Prey and Hancock House, Blaine, Washington, USA,.
Whitfield, D. P., A. H. Fielding, D. R. A. Mcleod, and P. F. Haworth. 2004a. Modelling the effects of persecution on the population dynamics of golden eagles in Scotland. Biological Conservation 119:319–333.
Whitfield, D. P., A. H. Fielding, D. R. A. McLeod, and P. F. Haworth. 2004b. The effects of persecution on age of breeding and territory occupation in golden eagles in Scotland. Biological Conservation 118:249–259.
Yi-Ming, L., G. Zenxiang, L. Xinhai, W. Sung, and J. Niemelä. 2000. Illegal wildlife trade in the Himalayan region of China. Biodiversity and Conservation 9:901–918.
Zahler, P., B. Lhagvasuren, R. P. Reading, J. R. Wingard, S. Amgalanbaatar, S. Gombobaatar, N. Barton, and Y. Onon. 2004. Illegal and unsustainable wildlife

51
hunting and trade in Mongolia. Mongolian Journal of Biological Sciences 2:23–31.
Zhang, L., N. Hua, and S. Sun. 2008. Wildlife trade, consumption and conservation awareness in southwest China. Biodiversity and Conservation 17:1493–1516.
Zlotin, R. 2002. Biodiversity and productivity of ecosystems. Pages 169–190in M. Shahgedanova, editor.The physical geography of Northern Eurasia. Oxford University Press, Oxford, UK.

52
Table 1. Distribution and conservation status of raptors in the world and in Asia based on BirdLife International (2017). Migratory species include species with a significant portion of populations that make seasonal, cyclical and predictable movements. Endemic species are species that breed in a single country.
Accipitriformes Falconiformes Strigiformes
World Asia World Asia World Asia
Total 251 105 66 22 241 108
Migratory 165 42 15 10 17 8
Endemic 52 20 8 2 86 52
Extinct 1 0 2 0 5 0 Critically Endangered 14 6 0 0 7 2
Endangered 14 5 2 1 9 5
Vulnerable 25 9 4 0 27 13
Near Threatened 33 14 9 5 27 21
Least Concern 163 70 49 16 161 64
Data Deficient 1 1 0 0 5 3

53
Table 2. Asia’s Critically Endangered (CR) and Endangered (EN) raptor species based on BirdLife International (2017). Migratory species include species with a significant portion of populations that make seasonal, cyclical and predictable movements. Endemic species are species that breed in a single country.
Asian Region
Species Common Name Category Migratory Endemic North West & Central East
South & Southeast
Accipitriformes
Aquila nipalensis Steppe Eagle EN Y N x x x x
Gyps bengalensis White-rumped Vulture
CR N N x x
Gyps indicus Indian Vulture CR N N x
Gyps tenuirostris Slender-billed Vulture
CR N N x
Neophron percnopterus
Egyptian Vulture EN Y N x
Nisaetus bartelsi Javan Hawk-eagle EN N Y x Nisaetus floris Flores Hawk-eagle CR N Y x
Nisaetus philippensis North Philippine Hawk-eagle
EN N Y x
Nisaetus pinskeri South Philippine Hawk-eagle
EN N Y x
Pithecophaga jefferyi Philippine Eagle CR N Y x Sarcogyps calvus Red-headed Vulture CR N N x x
Falconiformes
Falco cherrug Saker Falcon EN Y N x x x x
Strigiformes
Bubo blakistoni Blakiston's Fish-owl EN N N x x
Heteroglaux blewitti Forest Owlet CR N Y x

54
Asian Region
Species Common Name Category Migratory Endemic North West & Central East
South & Southeast
Ninox leventisi Camiguin Boobook EN N Y x Ninox rumseyi Cebu Boobook EN N Y x Otus alfredi Flores Scops-owl EN N Y x Otus siaoensis Siau Scops-owl CR N Y x Otus thilohoffmanni Serendib Scops-owl EN N Y x
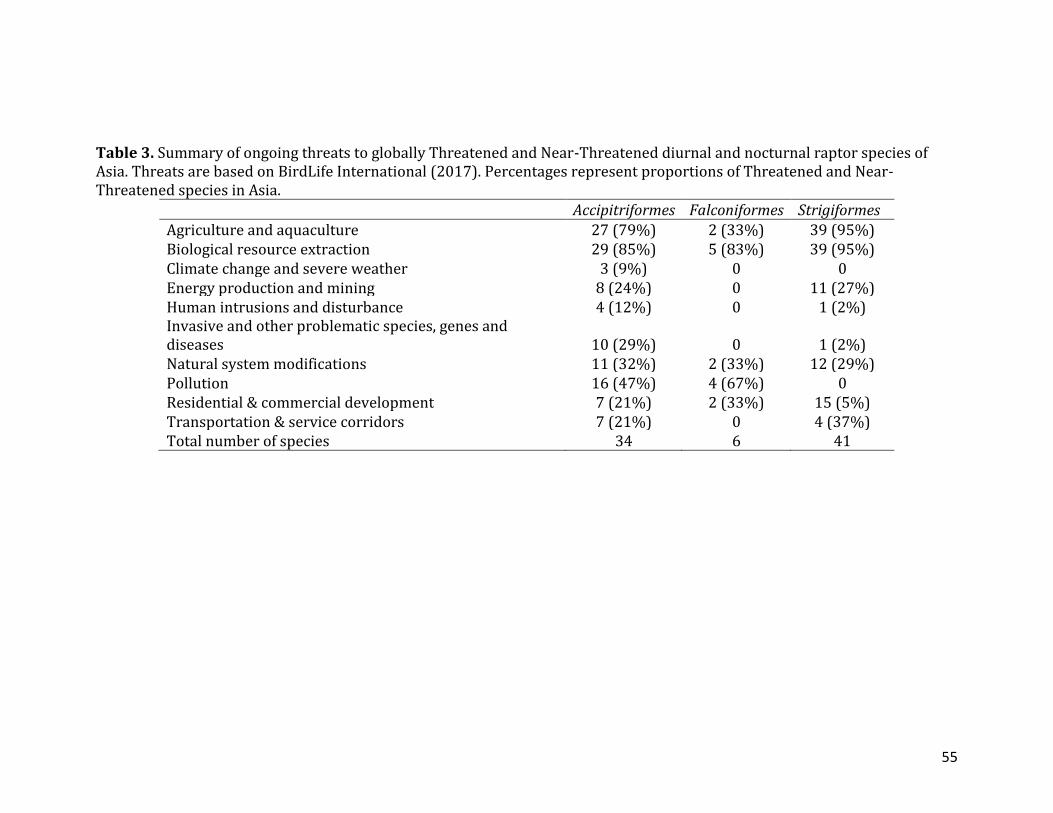
55
Table 3. Summary of ongoing threats to globally Threatened and Near-Threatened diurnal and nocturnal raptor species of Asia. Threats are based on BirdLife International (2017). Percentages represent proportions of Threatened and Near-Threatened species in Asia.
Accipitriformes Falconiformes Strigiformes Agriculture and aquaculture 27 (79%) 2 (33%) 39 (95%) Biological resource extraction 29 (85%) 5 (83%) 39 (95%) Climate change and severe weather 3 (9%) 0 0 Energy production and mining 8 (24%) 0 11 (27%) Human intrusions and disturbance 4 (12%) 0 1 (2%) Invasive and other problematic species, genes and diseases 10 (29%) 0 1 (2%) Natural system modifications 11 (32%) 2 (33%) 12 (29%) Pollution 16 (47%) 4 (67%) 0 Residential & commercial development 7 (21%) 2 (33%) 15 (5%) Transportation & service corridors 7 (21%) 0 4 (37%) Total number of species 34 6 41

56
Table 4. Summary of distribution and conservation status of raptors in according to regions of Asia based on BirdLife International (2017). Migratory species include species with a significant portion of populations that make seasonal, cyclical and predictable movements. Endemic species are species that breed in a single country. Percentages indicate proportion of Threatened and Near-Threatened migratory and endemic species.
North Asia
West and Central Asia
East Asia South and Southeast
Asia Total 61 59 96 219 Migratory 49 (20%) 44 (25%) 52 (21%) 51 (20%) Endemic 0 0 0 74 (64%) Critically Endangered 0 2 2 8 Endangered 4 3 4 10 Vulnerable 4 3 5 21 Near Threatened 4 7 7 39 Least Concern 49 44 78 137 Data Deficient 0 0 0 4

57
Table 5. Summary of distribution and conservation status of raptors in ten Asian countries with the most Threatened and Near-Threatened raptor species based on BirdLife International (2017). Migratory species include species with a significant portion of populations that make seasonal, cyclical and predictable movements. Endemic species are species that breed in a single country. Percentages indicate proportion of Threatened and Near-Threatened migratory and endemic species.
Indonesia India
Russian Federation
Philippines Myanmar
Total 133 102 102 55 88
Migratory 24 (4%) 46
(22%) 48 (21%) 14 (0%) 39 (21%) Endemic 39 (54%) 9 (67%) 0 23 (74%) 0 Critically
Endangered 3 5 0 1 3
Endangered 3 3 6 4 2 Vulnerable 12 5 7 6 6 Near Threatened 20 13 8 10 8 Least Concern 92 75 81 34 69 Data Deficient 3 1 0 0 0
Nepal Bangladesh Malaysia China Thailand
Total 83 77 67 94 76
Migratory 39
(26%) 33 (27%) 28
(21%) 51
(22%) 32
(19%)
Endemic 0 0 1
(100%) 0 0 Critically
Endangered 3 3 3 2 3
Endangered 3 3 1 4 1 Vulnerable 4 4 5 4 5

58
Nepal Bangladesh Malaysia China Thailand Near Threatened 9 8 8 6 6 Least Concern 64 59 50 78 61 Data Deficient 0 0 0 0 0

59
Figure 1. Regional Asia. Country boundaries are from the Global Administrative Areas database (www.dabm.org) and, in some regions (e.g., borders of India with Pakistan and China), are not fixed owing to on-going territorial disputes (Fravel 2015). The Middle East is not included.

60
Figure 2. Population trends of Asian raptors. Population trends are based on BirdLife International (2017). Population trend is either directly estimated or suspected based on existing threats and other factors. Population estimates were not taken in the same year and global population sizes have been estimated between 1999 to 2016.

61
Figure 3. Species status of Asian raptors found in the five most occupied land types. Conservation status and land types are based on BirdLife International (2017).

62
CHAPTER 3
Species composition, timing, and weather correlates of autumn open-water crossings by raptors migrating along the East-
Asian Oceanic Flyway
Camille B. Concepcion1*, Patricia T. Dumandan2, Medel R. Silvosa2, Keith L. Bildstein3, Todd E. Katzner1,4,5
1Division of Forestry & Natural Resources, West Virginia University, Morgantown WV
26506 USA
2Davao City, Philippines
3Hawk Mountain Sanctuary, 1700 Hawk Mountain Rd., Kempton, PA 19527 USA
4 United States Department of Agriculture, Forest Service, Timber and Watershed
Laboratory, Parsons, West Virginia 26287, USA
5 U.S. Geological Survey, Forest & Rangeland Ecosystem Science Center, 970 Lusk St.,
Boise, ID 83706 USA
Published: Concepcion, C. B., P. T. Dumandan, M. R. Silvosa, K. L. Bildstein, and T. E. Katzner (2017). Species composition, timing and meteorological correlates of autumn open-water crossings by raptors migrating along the East-Asian Oceanic Flyway. Journal of Raptor Research 51:25–37.

63
ABSTRACT. --Raptor migration rarely involves long-distance movements across open
oceans. One exception occurs along the East-Asian Oceanic Flyway. We collected
migration data at two terrestrial hawkwatch sites along this flyway to better understand
open-ocean movements along this largely overwater corridor. At the northern end of the
Philippines, at Basco on the island of Batan, we recorded 7587 migratory raptors in
autumn 2014. Near the southern end of the Philippines, at Cape San Agustin on the island
of Mindanao, we recorded 27,399 raptors migrating in autumn 2012. Chinese
Sparrowhawks (Accipiter soloensis) were the most common species observed, making up
approximately 89% and 92% of total records for Basco and Cape San Agustin,
respectively. The Grey-faced Buzzard (Butastur indicus) was the second most common
raptor migrant, accounting for 8% of the total counts at both watch sites. The migration
period was about 1–2 wk earlier at Basco, the more northerly site, than at Cape San
Agustin. Overwater flights at Basco peaked in both the morning and late afternoon,
whereas at Cape San Agustin there was only a morning peak. In general, the rate of
migration passage at both sites was highest with clear skies when winds were blowing
from the northwest. However, we observed interspecific differences in migration
behavior at both sites, with Accipiters more likely to be observed with tailwinds and
eastward winds and Grey-faced Buzzards more likely observed with headwinds. These
results help to characterize poorly known aspects of raptor biology and to identify
potential migratory bottlenecks or key sites for raptor conservation in little-studied
Philippine tropical ecosystems.
KEY WORDS: Chinese Sparrowhawk; Accipiter soloensis; Grey-faced Buzzard; Butastur
indicus; East-Asian Oceanic Flyway; migration; overwater crossing; Philippines

64
Understanding animal movement is central to conservation planning and
ecological knowledge (Nathan 2008). For migratory birds, determining patterns of
migratory connectivity and identifying flyway bottlenecks are important parts of
interpreting animal movement. For raptors, counts at migration watchsites globally have
documented these patterns, especially over land (Bildstein 2006). Oceanic crossings by
raptors are less well studied, but they do have important effects of funneling populations
(Meyer et al. 2000, 2003, Panuccio et al. 2005), limiting demography (Germi et al. 2009,
Panuccio et al. 2012, Oppel et al. 2015) and affecting ecology (Kerlinger 1985, Panuccio
et al. 2005, Bildstein 2006, López-López et al. 2010).
In spite of the potential negative consequences of ocean crossings for raptors,
recent studies indicate that for some species, oceans also may be significant ecological
corridors (López-López et al. 2010), the forms of which are shaped by the flexible
response of migrants to predominant wind and water currents (Klaassen et al. 2011,
Mellone et al. 2011). In some cases, overwater crossings may even have benefits for
raptors. In particular, they can provide both shorter and more direct routes to destinations
(Meyer et al. 2003), and they can offer the potential to avoid unfavorable weather
conditions (Yamaguchi et al. 2011), pathogens, and parasites (Gill et al. 2009). However,
environmental correlates of oceanic crossings are generally poorly understood, making it
difficult to identify why some birds may choose to cross the open ocean.
The East-Asian Oceanic Flyway is the world’s most heavily travelled oceanic
raptor migration corridor (Bildstein 2006). Birds traveling this route use seasonal
monsoon winds, trade winds, and sea thermals (sensu Augstein 1980) to complete their
migration. During autumn, raptors leave southern Taiwan and cross at least 180 km of

65
ocean to reach the northernmost islands of the Philippines. Most of these birds then
island-hop across the Philippines, with some wintering in-country and others continuing
their journeys further south. Those that continue south often depart from the southern
Philippine island of Mindanao to presumed destinations in Indonesia that are at least 170
km away (Fig. 1).
We conducted exploratory migration research along the East-Asian Oceanic
Flyway to quantify the magnitudes of the flights along this corridor. We then used these
data to assess correlates of migration behavior as a basis for an initial attempt at
understanding the factors associated with ocean crossings. We focused our effort on birds
entering and exiting the Philippine archipelago, between Taiwan and Luzon in the north
and between Mindanao and the Sulawesi archipelago of Indonesia in the south (Fig. 1).
We used data collected during two full-season counts (one count for each of two sites) to
evaluate four questions about raptor migration into and out of the Philippines: (1) when,
during the migration season and during the day, do oceanic crossings occur?; (2) in what
directions do observed migrants fly?; (3) what are the weather conditions under which
birds initiate and complete oceanic crossings?; and (4) are there among-species
differences in timing and meteorological correlates of oceanic crossings along this route?
We interpret these findings in the context of hypotheses describing the potential value of
the oceanic crossings birds make and the evolutionary forces that may shape these
behavioral patterns.

66
METHODS
Study Areas. We counted migrating hawks at a northern entry point to the
Philippines (Basco) and a southern exit from the archipelago (Cape San Agustin). Basco
is on Batan Island, at the northernmost tip of the Philippines (Fig. 1). The island belongs
to a small archipelago located between the Bashi Channel, south of Taiwan, and the
Balintang Channel north of Luzon Island. Grasslands dominate the local ground cover.
Batan has subtropical climate, with average monthly temperatures of 22–28°C. Rainfall
averages 2.8 m annually and is uniformly distributed among months. Cool winds are
characteristic, especially during December, January and February, when the northeasterly
trade winds pass through the islands.
Cape San Agustin on the island of Mindanao separates the Celebes Sea to the east
from the Davao Gulf to the west (Fig. 1). Land cover in the region includes natural forest,
primarily mangrove (Rhizopora spp.), along the intertidal zone, and coconut (Cocos
nucifera) plantations and farmlands in the coastal plain and upland hillsides. The climate
of the peninsula is greatly influenced by monsoonal and trade winds. From June to
October a monsoonal wind blows from the southwest. Starting in November, that
southwest monsoon transitions into a northeast monsoon. The average monthly
temperature is 22–33°C with little seasonal variation. Average rainfall is about 1.2 m
annually.
We conducted counts from locations with good views on both islands. At Basco
this was the 20-m-tall Naidi Lighthouse (20°27’5”N 121°57’51”E). The lighthouse has a
panoramic view of the northern part of Batan Island, as well as of parts of several islands
directly adjacent to Batan Island. We conducted the count at Cape San Agustin

67
approximately 2 km north of the tip of the peninsula (6°16’47”N 126°11’30”E). The
count site was a 4.5-m-tall bamboo tower we built in a coconut plantation. Despite the
elevated post, coconut trees partially obstructed our view to the south.
Survey Techniques. Counts at Basco were conducted by two or three observers
(CBC, PTD, and MRS) working together between 25 August and 19 October 2014. The
period during which we conducted counts was based on reported dates of departure of
Grey-faced Buzzards (Butastur indicus) and Chinese Sparrowhawks (Accipiter soloensis)
from southern Taiwan (Lin and Severinghaus 1998). Counts at Cape San Agustin were
conducted by one observer (CBC) between 12 September and 30 October 2012. Timing
of this count was estimated based on known arrivals of birds for the Indonesian island of
Sangihe 280 km to the south (Germi et al. 2009).
We recorded migration and weather data hourly on a daily data sheet derived
from a template produced by the Hawk Migration Association of North America (see
Bildstein et al. 2007). We counted migrating raptors according to standardized migration
watchsite count protocols (Bildstein et al. 2007). We conducted observations from 0530
H to 1730 H (Basco) and from 0600 H to 1530 H (Cape San Agustin). We methodically
scanned the horizon using binoculars (10×) and unaided eyes to ensure consistent
coverage, and visually tracked single individuals or flocks until we identified them and
were able to determine their direction of travel. We classified flight direction as either
expected flight direction (i.e., passage on a northern to southern axis) or unexpected flight
direction (i.e., passage on a southern to northern axis or to a west to east axis). We
classified altitude of flight as either low (i.e. below eye level to about 30 meters above
ground) or high (i.e. more than 30 meters above ground). We counted most passing

68
migrants individually but, in instances of large flocks (>100 individuals) or when the
birds had already passed us, we counted birds in groups of 2, 5 or 10. If the birds were
first spotted soaring in groups, we waited until we could count them individually or as
groups streamed north-to-south across the count site. To ensure accuracy, we repeated
and averaged counts of groups whenever possible, especially when flocks were larger
than 100.
We measured temperature and wind speed at Basco using a Kestrel 4000 Weather
Meter (The Nielsen-Kellerman Company, Birmingham, MI 48009 USA) and at Cape San
Agustin using an Anemometer HT816 (Long Term Inc., Ningbo Shi, Zhejiang Sheng
315000, China). Wind speed was recorded in m/s and converted into U and V
components using the following equations (Wallace and Hobbs 2006):
𝑈 𝐶𝑜𝑚𝑝𝑜𝑛𝑒𝑛𝑡 = −𝑤𝑖𝑛𝑑 𝑠𝑝𝑒𝑒𝑑 ∗ sin (𝑤𝑖𝑛𝑑 𝑑𝑖𝑟𝑒𝑐𝑡𝑖𝑜𝑛 ∗ 𝜋
180)
𝑉 𝐶𝑜𝑚𝑝𝑜𝑛𝑒𝑛𝑡 = −𝑤𝑖𝑛𝑑 𝑠𝑝𝑒𝑒𝑑 ∗ cos (𝑤𝑖𝑛𝑑 𝑑𝑖𝑟𝑒𝑐𝑡𝑖𝑜𝑛 ∗ 𝜋
180)
We used a compass to determine wind direction (i.e., N, SE, NE) and converted estimates
into azimuth degrees for these equations, for example where south wind was 180° and
west wind was 270°. We estimated cloud cover as the percent of sky with background
cloud cover.
Data Analysis. We used a paired Wilcoxon signed-rank test to compare within-
season timing of flights at the northernmost and southernmost extent of the Philippines
(question #1). The input data for these tests were the proportion of total flights observed
on each observation day (proportion of the total number of birds counted for the season
on Day 1, Day 2, etc.). For analytical purposes we designated Day 1 as 25 August for
both years. We used the Fligner-Killeen (median) test to evaluate variability of the

69
number of birds observed per day between the sites (Fligner and Killeen 1976). To
evaluate within-day patterns between the two count sites, we used another Wilcoxon
signed-rank test to compare the proportion of flights per hour, from 0600 H to 15000 H.
We used Nemenyi test for post-hoc analyses (Nemenyi 1969).
We described the most commonly observed migration characteristics
(directionality, flight altitude) of raptors at each watch site (question # 2). We evaluated,
with a binomial generalized linear model, the association of weather parameters (U wind,
V wind and percent cloud cover) with the likelihood of observing either a large (≥ 100
migrants/hr) or a small flock (<100 migrants/hr; i.e., the weather conditions under which
birds initiate or complete oceanic crossings; question #3). Finally, we used paired
Wilcoxon signed-rank tests and Kruskal-Wallis tests to compare timing of passage of the
two principal species at each site, by day of year and by hour of day, and binomial
generalized linear models (as before) to compare meteorological covariates of their
oceanic crossings (question #4). We again used a Nemenyi test for post-hoc analyses. We
conducted statistical analyses with R statistical software, using the ‘stats’ package
(wilcox.test, kruskal.test, posthoc.kruskal.nemenyi.test, fligner.test and glm (R
Development Core Team 2013).
RESULTS
Timing of Migration. We observed 7587 migratory raptors of seven species
during 50 d of counting at Basco (Fig. 2a, Table 1). Chinese Sparrowhawk was the most
common species recorded, representing 88.8% of the total count. Grey-faced Buzzard
was the second most common species at 7.5%, and the remaining migrants were Osprey
(Pandion haliaetus), Japanese Sparrowhawk (A. gularis), Eurasian Kestrel (Falco

70
tinnunculus), Peregrine Falcon (F. peregrinus calidus) and Common Buzzard (Buteo
buteo; Table 1). Unidentified raptors made up 2.9% of the total. We observed the largest
flight of 3653 individuals, which consisted only of Accipiter spp., on 9 September 2014
(Fig. 2a). The count from this single day made up 48.1% of the season total. We counted
at least 100 raptors on 18% of the count days, but we observed no birds on 24% of the
days.
We observed 27,399 migratory raptors of seven species during 47 d of count at
Cape San Agustin (Fig. 2b, Table 1). As at Basco, the Chinese Sparrowhawk was the
most common species recorded, representing 91.7% of the total count. The Grey-faced
Buzzard was the second most common at 7.9%; the remaining migrants were Osprey,
Pied Harrier (Circus melanoleucos), Japanese Sparrowhawk, Eurasian Kestrel, and
Peregrine Falcon (Table 1). Unidentified raptors made up 0.2% of the total. We observed
a maximum flight of 2588 individuals, consisting only of Accipiter spp., on 28 September
2012 (Fig. 2b), a count that made up 9.4% of the season total. We counted at least 100
birds were counted on 70.2% of the days, with counts of more than 1000 raptors on 5 d.
There were no days on which we observed no birds.
Within-season distribution of flights. There was a statistical difference in the
within-season distribution of migration, with the majority of individuals passing Basco
earlier in the year than that at Cape San Agustin (V = 1165.5, P < 0.001; Fig. 2).
Although the average daily proportion of flights was the same in Basco (2% of total
flights a day) and at Cape San Agustin (2%), the variability in number of birds observed
per day was much greater at Basco (SD = 7.42%) than at Cape San Agustin (SD = 2.16%;
χ2 = 12.76, P < 0.0001).

71
Within-day distribution of flights. Migration at Basco began as early as 0530 H,
just after local sunrise (Fig. 3). Although we saw sizeable flights between 0700 H to 0800
H (n = 1095 individuals), daily passage rates peaked much later in the day, between 1600
H and 1700 H (n = 1676) and 1700 H and 1800 H (n = 1895), about 30 – 90 min before
local sundown. We commonly observed Grey-faced Buzzards searching for and landing
at roosting sites during late afternoon.
On most days at Cape San Agustin, migration began at 0700 H –0800 H (Fig. 3),
or about 90 min after local sunrise. Flights then peaked between 0800 H to 0900 H (n =
4334) and 0900 H to 1000 H (n = 4531). Few birds were tallied after 1500 H, and
departures from the Cape generally ended before 1430 H, or 180 min before local
sundown. Differences in within-day timing of flights between Basco (later in the day) and
Cape San Agustin (earlier in the day) were statistically significant (V = 45, P = 0.042).
Direction of Migration. Most raptors, 94.5%, passed through Basco in a
southerly direction. The majority of birds at Basco (72.3%) approached the coastline at a
low altitude.
At Cape San Agustin, 99.6% of birds passed in a southerly direction. Most of the
birds migrating past Cape San Agustin (94.6%) departed the coastline at a high altitude
Migration and Weather. At Basco, the winds were from the northeast 41.6% of
the time, with hourly wind speeds averaging 4.6 m/sec and reaching a maximum of up to
15.3 m/sec. It was typical to experience such winds in September and October, especially
as trade winds and cool northeasterly winds, replaced the southwesterly monsoonal
winds. However, passage rate was highest on northwest winds, during which 57.9% of
the flights occurred (Fig. 4a). About 9.8% of the flights were into headwinds (southerly

72
winds), and the only species that we observed flying into headwinds were Accipiters.
Likewise, 10.9% of flights were in northeast winds, 10.8% in westerly winds, 8.5% in
easterly winds, 0.8% in north winds, 1% with no wind and 0.2% in variable winds.
At Cape San Agustin, winds were predominantly from the northwest (44.7% of
the time) with average hourly wind speeds of 2.5 m/sec and reaching a maximum of 7.8
m/sec. As at Basco, the passage rate at the Cape was highest with northwest winds, when
56.3% of the flights occurred (Fig. 4a). About 11.2% of the flights were into headwinds
(southerly winds), nearly all by Accipiters; 13.4% of flights occurred with no wind,
11.2% in north winds, 7.2% in variable winds, and 0.2% each in northeast winds, west
winds and east winds.
At both sites, passage rate was highest when winds were relatively low. At Basco,
winds were usually breezes of 3.4 – 5.5 m/sec (26.6% of the time), but 65.3% of the
flights occurred with lighter breezes of 1.6–3.3 m/sec (Fig. 4b). Thus, migration occurred
at below-average wind speeds at Basco. At the Cape, hourly wind speeds were mostly
very light at 0.3–1.5 m/sec (46.0% of the time) and 42.8% of flights occurred with these
winds. Thus, response to wind speed differed between the two sites (W = 2, P = 0.008).
The odds of observing a large migratory flock (≥ 100 migrants in an hour) of
birds into and out of the Philippines decreased with increasing north winds and, to a small
degree, with increasing cloud cover. When all other predictors were held constant, the
odds of observing large flocks migrating into Basco changed by a factor of 0.65 (i.e., the
odds decreased) for every 1 m/sec increase in V winds (a 1 m/sec increase in V wind is a
headwind; Fig. 5). Likewise, the odds of observing large flocks changed by a factor of
0.96 for every 1% increase in cloud cover. As at Basco, when all other predictors were

73
held constant, the odds of observing large flocks departing Cape San Agustin changed by
a factor of 0.57 for every 1 m/sec increase of V winds; they changed by a factor of 0.99
for every 1% increase in cloud cover (Fig. 5).
Among-species Differences in Behavior. Seasonality of the flights. At Basco, we
observed Accipiters on 36% of the count days, and Grey-faced Buzzards on 32% of the
count days. Accipiters and Grey-faced Buzzards had statistically different within-season
timing of flights (V = 136, P = 0.017) but similar within-day timing of flights (V = 23, P
= 0.233). Further, Accipiter passage (Kruskal-Wallis, χ2 = 49.02, df = 12, P < 0.001) and
Grey-faced Buzzard passage (Kruskal-Wallis, χ2 = 44.71, df = 12, P < 0.001) were not
evenly distributed throughout all hours of the day. Post-hoc tests showed that Accipiters
and Grey-faced Buzzards were more likely to pass by the count site in the early morning
or afternoon than during mid-day.
At Cape San Agustin, we observed Accipiters on 91.5% of the count days, and
Grey-faced Buzzards on 42.5% of the count days. Accipiters and Grey-faced Buzzards
had statistically different within-season timings (V = 694, P = 0.047) and within-day
timings (V = 0, P = 0.002). Additionally, Accipiter passage (Kruskal-Wallis, χ2 = 75.75,
df = 9, P < 0.001) and Grey-faced Buzzard passage (Kruskal-Wallis, χ2 = 44.71, df = 12,
P < 0.001) were not evenly distributed throughout all hours of the day. Post-hoc tests
showed that Accipiters were more likely to pass in early morning or midday than in the
afternoon. Grey-faced Buzzards were more likely to pass during midday or afternoon
than in early morning.
Weather. There were among-species differences in correlations of wind speed
with migration at both sites. At Basco, 70.6% of Accipiters observed passed during light

74
breezes of 1.6–3.3 m/sec, but 66.4% of Grey-faced Buzzard flights occurred during much
stronger winds of 3.4–10.7 m/sec. In contrast, at the Cape, 69.2% of Accipiters passed
during light wind of 0.3–3.3 m/sec, but 82.1% of Grey-faced Buzzards migrated during
calmer conditions with winds of <0.3–1.5 m/sec.
At Basco, the odds of observing Accipiters increased with tailwinds and eastward
winds (Fig. 6a). In contrast, the odds of observing Grey-faced Buzzards increased with
headwinds and westward winds (Fig. 6a).
At Cape San Agustin, the odds of observing Accipiters increased with tailwinds
and eastward winds, and decreased with cloud cover (Fig. 6b). In contrast, the odds of
observing Grey-faced Buzzard passage increased with headwinds and cloud cover (Fig.
6b).
DISCUSSION
Our analysis characterizes overwater flight behavior as birds approached and
departed coastal areas along an oceanic migration route. Although our data did not allow
us to separate year and site effects, the environmental correlates of migration we identify
are a useful starting point for understanding the context for open-water crossing by these
birds and as a framework for generating hypotheses testable with more detailed count
data.
Timing of Flights. Overwater flights started in mornings or midday and ended
either early in the morning or late in the day. Although our two seasonal counts were not
conducted during exactly the same periods, the pattern we observed was consistent with
previous data suggesting that the within-day distribution of raptor flights overwater

75
responds to hourly thermal availability and atmospheric conditions (Spaar 1997, 1999,
Meyer et al. 2000, Bildstein et al. 2009, Panuccio et al. 2013). We observed some
evidence of successful nighttime migration with a few birds arriving at Basco before or
just after local sunrise. Likewise, Germi et al. (2009) and Sun et al. (2010) found little
evidence of night flights and believed nocturnal migration to be uncommon along this
oceanic route.
Migrants are thought to choose carefully when to initiate overwater crossings and
ideally to wait for favorable conditions (Meyer et al. 2000, Liechti 2006, Bildstein et al.
2009, Sjöberg et al. 2015). With favorable conditions (i.e., strong tailwinds or weak
headwinds) birds traveling in the Philippines likely start migration early in the day and
take about 3 hr to cross the ocean. We suspect that afternoon arrivals into Basco were
probably of migrants that were delayed in leaving the southern tip of Taiwan or took
longer than anticipated to cross the ocean. Kerlinger and Gauthreaux. (1984) and
Panuccio et al. (2013) suggest that afternoon completion of water crossings may be
intentional behavior by migrants that intend to roost on the islands. On Basco, this
appears to be the case as we observed large roosting assemblages on the island (C
Concepcion and K. Bildstein unpubl. data).
Meteorological and Behavioral Correlates of Ocean Crossing Flights. The
migration we observed by birds approaching and departing the Philippines was generally
southward (i.e., expected flight direction). Reversed or unexpected flight directions were
uncommon in the Philippines, although it is a common occurrence at many other sites
(Alerstam 1978, Åkesson et al. 1996, Nilsson and Sjöberg 2015). Migrants may fly in
other directions when they are hesitant to cross a barrier (such as the open ocean from

76
Cape San Agustin), when fuel reserves are low, or when weather conditions encountered
are unfavorable.
The raptor migration we observed through and out of the Philippines coincided
with certain meteorological patterns. In particular, the odds of observing migrants
showed a positive relationship to tailwinds (lower headwinds) and were slightly
negatively correlated to cloud cover. Cloud cover at the coast is likely important because
it may reduce thermal availability (Spaar 1999). Cloud cover may also have caused us to
miss birds, especially those flying above the clouds (Richardson 1978, Kahlert et al.
2012). Tailwinds are likely to speed up overwater crossings (Alerstam 1990, Meyer et al.
2000, 2003). In the Philippines (see Fig. 1), migrants undertaking lengthy overwater
crossings are believed to use northeasterly Trade Wind Zone tail winds to help complete
their passage (Bildstein 2006). Northeasterly winds along this flyway peak between July
and October and extend from 5° to 30° N. However, these winds are particularly strong
between 15° and 20° N, a latitudinal band that includes the Basco watchsite but not the
Cape San Agustin watch site (Wyrtki and Meyers 1975). Thus the migrants we observed
at Basco likely benefitted more from trade tail winds than the migrants we observed at
Cape San Agustin. The migrants we counted at Cape San Agustin instead may rely on
seasonal winds and sea thermals to subsidize their overwater migratory flights (Bildstein
2006). Sea thermals, in particular, occur in tropical and subtropical waters between 5° to
30° north and south of the equator (Augstein 1980) and would be available for migrants
observed at both Basco and at Cape San Agustin.
Although tailwinds favored migration at our sites and also in Sangihe, Sulawesi,
Indonesia (Germi et al. 2009), Grey-faced Buzzards we observed often flew into
77
headwinds. The decision to fly into headwinds may result in higher-than-normal
energetic expenditures (Meyer et al. 2000). Thus, it may be that these Grey-faced
Buzzards may have been forced to migrate to avoid still worse weather conditions (cf.
Liechti et al. 2013) or they may be travelling short enough distances that the additional
energy expended in headwinds may be of relatively little consequence (Germi et al.
2009).
Species Differences in Flight Behavior. We recorded interspecific differences in
timing and weather correlates of overwater crossings. Explanations for among-species
differences such as these include variation in flight mechanics (Mendelsohn et al. 1989,
Hedenström 1993) and individually based strategies in response to the environment
(Spaar 1997, 1999, Meyer et al. 2000). In general, smaller raptors with longer, narrower
wings are more adapted to flapping flight than are larger raptors. Such birds are also more
likely to cross large water bodies (Kerlinger 1985, Meyer et al. 2000). This difference
might explain why the relatively small, and long, narrow-winged Accipiters and Grey-
faced Buzzards we observed make up the bulk of migrants using the East-Asian Oceanic
Flyway. Individuals of these species would be able to easily switch between soaring and
flapping flights in response to local variation in weather.
Overwater Crossing as an Influence on Raptor Migration. When birds make
mistakes overwater, they often are not easily corrected and many times are fatal
(Bildstein 2006, Bildstein et al. 2009, Oppel et al. 2015). Young birds are relatively more
likely to make such mistakes and so survival of their maiden voyages across the ocean
may depend on following the lead of experienced adults (Agostini et al. 2010, Panuccio
et al. 2012, Oppel et al. 2015). For example, when the number of adults in the population

78
declined, only 1 in 10 young Egyptian Vultures (Neophron percnopterus) survived their
first migration across the Mediterranean Sea (Oppel et al. 2015). We frequently
observed large flocks of migrants and it may be that these were composed of
knowledgeable adults being followed by inexperienced juveniles. Further insight into this
question may come from comparison of flock size and adult: subadult ratios among
populations of raptors that do and do not make oceanic crossings.
Our study is one of a few that has focused on understanding migratory strategies
across the world’s only “true” large-scale oceanic flyway (Bildstein 2006). Our findings
are preliminary and suggest the hypothesis that similar general meteorological conditions
favor initiation and completion of overwater crossings during autumn migration. These
observations are particularly important because so few overwater crossings have been
studied, especially outside the European Baltic and Mediterranean regions and more data
would be valuable to more fully test these initial hypotheses.
In addition, it would be useful to replicate our study during spring migration along
this corridor. In spring, northeast trade winds remain strong north of the equator, starting
from about 5° N. However, south from 5° N, southeast trade winds are strong (Wyrtki
and Meyers 1975). This means migrants would face strong headwinds as they cross from
Indonesia to the south of the Philippines and would likely encounter such headwinds until
they pass the southern tip of the Ryukyu Islands of Japan, roughly around 30° N. Given
these realities, migrants may therefore abandon the oceanic flyway and instead follow a
loop migration pattern via the East-Asian Continental Flyway, where the southeast trade
winds would actually assist their return migration. Count data from southern Taiwan

79
seem to support this prediction (Lin and Severinghaus 1998). Future studies using
telemetry will be important for understanding these patterns.
ACKNOWLEDGMENTS
This study was funded by the Project Soar Grant from Hawk Mountain Sanctuary
(U.S.A.) and The Sperry Fund Scholars in Raptor Conservation Science. We wish to
thank the local government of Governor Generoso, Davao Oriental through Mayor
Vicente Orencia and Punong Barangay Roland G. Tan of Lavigan who kindly admitted
us onto their site; local government of Basco, Batanes, through Governor Vicente Gato,
Mayor Demetrius Paul Narag, and Ms. Hegel Ruiz-Valones, who granted us permission
to use the Naidi Lighthouse; Joey Gamao for assistance in the field in 2012 and Perfecto
Balicao for assistance in 2014; Coligado Family of Brgy. Lavigan for hosting C.B.
Concepcion throughout the 2012 fieldwork; Adam Duerr for comments on model
interpretation. This is Scientific Article No. 3285 of the West Virginia Agricultural and
Forestry Experiment Station, Morgantown, WV. Any use of trade, product, or firm names
is for descriptive purposes only and does not imply endorsement by the U.S.
Government. This paper is conservation science contribution number 268 from Hawk
Mountain Sanctuary.

80
LITERATURE CITED
AGOSTINI, N., G. PREMUDA, U. MELLONE, M. PANUCCIO, D. LOGOZZO, E. BASSI, AND L.
COCCHI. 2010. Crossing the sea en route to Africa: Autumn migration of some
Accipitriformes over two Central Mediterranean islands. Ring 26:71–78.
ÅKESSON, S., L. KARLSSON, G. WALINDER, AND T. ALERSTAM. 1996. Bimodal orientation
and the occurrence of temporary reverse bird migration during autumn in South
Scandinavia. Behavioral Ecology and Sociobiology 38:293–302.
ALERSTAM, T. 1978. Reoriented bird migration in coastal areas: Dispersal to suitable
nesting grounds? Oikos 30:405–408.
------. 1990. Optimal bird migration: The relative importance of time, energy, and safety.
Pages 331–351in E. Gwinner [ED]. Bird migration: Physiology and ecophysiology.
Springer Verlag, Berlin.
AUGSTEIN, E. 1980. The atmospheric boundary layer over tropical oceans. Pages 73–104
in D. B. Shaw [EDS]. Meteorology over tropical oceans. Royal Meteorological
Society, Bracknell, UK.
BILDSTEIN, K.L. 2006. Migrating raptors of the world: Their ecology and conservation.
Cornell University Press, Ithaca, New York.
------, M.J. BECHARD, C. FARMER, AND L. NEWCOMB. 2009. Narrow sea crossings present
major obstacles to migrating Griffon Vultures Gyps fulvus. Ibis 151:382–391.
------, J.P. SMITH, AND R. YOSEF. 2007. Migration counts and monitoring. Pages 101–115
in D.M. Bird and K.L. Bildstein [EDS.]. Raptor research and management
techniques. Raptor Research Foundation/Hancock House Publishers, USA.

81
FLIGNER, M.A., AND T.J. KILLEEN. 1976. Distribution-free two-sample tests for scale.
Journal of the American Statistical Association 71:210–213.
GERMI, F., G.S. YOUNG, A. SALIM, W. PANGIMANGEN, AND M. SCHELLEKENS. 2009.
Over-ocean raptor migration in a monsoon regime: Spring and autumn 2007 on
Sangihe, North Sulawesi, Indonesia. Forktail 25:104–116.
GILL, R.E., T.L. TIBBITTS, D.C. DOUGLAS, C.M. HANDEL, D.M. MULCAHY, J.C.
GOTTSCHALCK, N. WARNOCK, B.J. MCCAFFERY, P.F. BATTLEY, AND T. PIERSMA.
2009. Extreme endurance flights by landbirds crossing the Pacific Ocean:
ecological corridor rather than barrier? Proceedings of the Royal Society B:
Biological Sciences 276:447–57.
HEDENSTRÖM, A. 1993. Migration by soaring or flapping flight in birds: The relative
importance of energy cost and speed. Philosophical Transactions of the Royal
Society B: Biological Sciences 342:353–361.
KAHLERT, J., A. LEITO, B. LAUBEK, L. LUIGUJÕE, A. KURESOO, K. AAEN, AND A. LUUD.
2012. Factors affecting the flight altitude of migrating waterbirds in Western
Estonia. Ornis Fennica 89:241–253.
KERLINGER, P. 1985. Water-crossing behavior of raptors during migration. Wilson
Bulletin 97:109–113.
------, AND S.A. GAUTHREAUX, JR. 1984. Flight behaviour of sharp-shinned hawks during
migration. I: Over land. Animal Behaviour 32:1021–1028.
KLAASSEN, R.H.G., M. HAKE, R. STRANDBERG, AND T. ALERSTAM. 2011. Geographical
and temporal flexibility in the response to crosswinds by migrating raptors.
Proceedings of the Royal Society B: Biological Sciences 278:1339–46.

82
LIECHTI, F. 2006. Birds: Blowin’ by the wind? Journal of Ornithology 147:202–211.
------, M. KLAASSEN, AND B. BRUDERER. 2013. Predicting migratory flight altitudes by
physiological migration models. Auk 117:205–214.
LIN, W.H., AND L.L. SEVERINGHAUS. 1998. Raptor migration and conservation in Taiwan.
Pages 631–639 in R.D. Chancellor, B.U. Meyburg, and J.J. Ferrero [EDS].
Holarctic birds of prey. ADENEX and World Working Group of Birds of Prey,
Merida, Spain.
LÓPEZ-LÓPEZ, P., R. LIMIÑANA, U. MELLONE, AND V. URIOS. 2010. From the
Mediterranean Sea to Madagascar: Are there ecological barriers for the long-
distance migrant Eleonora’s falcon? Landscape Ecology 25:803–813.
MELLONE, U., P. LÓPEZ-LÓPEZ, R. LIMIÑANA, AND V. URIOS. 2011. Weather conditions
promote route flexibility during open ocean crossing in a long-distance migratory
raptor. International Journal of Biometeorology 55:463–468.
MENDELSOHN, J., A. KEMP, AND H. BIGGS. 1989. Wing areas, wing loadings and wing
spans of 66 species of African raptors. Ostrich 60:35–42.
MEYER, S.K., R. SPAAR, AND B. BRUDERER. 2000. To cross the sea or to follow the coast?
Flight directions and behaviour of migrating raptors approaching the
Mediterranean Sea in autumn. Behaviour 137:379–399.
------ 2003. Sea crossing behaviour of falcons and harriers at the southern Mediterranean
coast of Spain. Avian Science 3:153–162.
NATHAN, R. 2008. An emerging movement ecology paradigm. Proceedings of the
National Academy of Sciences 105:19050–19051.

83
NEMENYI, P. 1969. Variances: An elementary proof and a nearly distribution-free test.
American Statistician 23:35–37.
NILSSON, C., AND S. SJÖBERG. 2015. Causes and characteristics of reverse bird migration:
An analysis based on radar, radio tracking and ringing at Falsterbo, Sweden. Journal
of Avian Biology 47:354–362.
OPPEL, S., V. DOBREV, V. ARKUMAREV, V. SARAVIA, A. BOUNAS, E. KRET, M. VELEVSKI,
S. STOYCHEV, AND S.C. NIKOLOV. 2015. High juvenile mortality during migration
in a declining population of a long-distance migratory raptor. Ibis 157:545-557.
PANUCCIO, M., N. AGOSTINI, AND U. MELLONE. 2005. Autumn migration strategies of
Honey Buzzards, Black Kites, Marsh and Montagu’s harriers over land and over
water in the Central Mediterranean. Avocetta 29:27–32.
------, N. AGOSTINI, AND G. PREMUDA. 2012. Ecological barriers promote risk
minimisation and social learning in migrating short-toed snake eagles. Ethology
Ecology and Evolution 24:74–80.
------, G. CHIATANTE, AND D. TARINI. 2013. Two different migration strategies in
response to an ecological barrier: Western Marsh Harriers and juvenile European
Honey Buzzards crossing the central-eastern Mediterranean in autumn. Journal of
Biological Research 19:10–18.
R DEVELOPMENT CORE TEAM. 2013. R: A language and environment for statistical
computing. R Foundation for Statistical Computing, Vienna, Austria.
http://www.r-project.org.
RICHARDSON, W.J. 1978. Timing and amount of bird migration in relation to weather: A
review. Oikos 30:224–272.

84
SJÖBERG, S., T. ALERSTAM, S. ÅKESSON, A. SCHULZ, A. WEIDAUER, T. COPPACK, AND R.
MUHEIM. 2015. Weather and fuel reserves determine departure and flight
decisions in passerines migrating across the Baltic Sea. Animal Behaviour
104:59–68.
SPAAR, R. 1997. Flight strategies of migrating raptors; a comparative study of
interspecific variation in flight characteristics. Ibis 139:523–535.
------. 1999. Flight behaviour of migrating raptors under varying environmental
conditions. Pages 1844–1862 in N. Adams and R. Slotow [EDS]. Proc. 22 Int.
Ornithol. Congr. Durban. University of Natal, Durban.
SUN, Y.H., T.W. DENG, C.Y. LAN, AND C.C. CHEN. 2010. Spring Migration of Chinese
Goshawks (Accipiter soloensis) in Taiwan. Journal of Raptor Research 44:188–
195.
WALLACE, J.M., AND P.V. HOBBS. 2006. Atmospheric science: An introductory survey.
2nd edition. Burlington, MA.
WYRTKI, K., AND G. MEYERS. 1975. The trade winds over the Pacific Ocean. Journal of
Applied Meteorology 15:698–704.
YAMAGUCHI, N.M., Y. ARISAWA, Y. SHIMADA, AND H. HIGUCHI. 2011. Real-time weather
analysis reveals the adaptability of direct sea-crossing by raptors. Journal of
Ethology 30:1–10.

85
Table 1. Migratory raptors counted at Basco (25 August – 19 October 2014) and Cape San Agustin (12 September – 30 October
2012), Philippines.
COMMON NAME SCIENTIFIC NAME BASCO CAPE SAN AGUSTIN
Osprey Pandion haliaetus 7 2
Pied Harrier Circus melanoleucos 1
Japanese Sparrowhawk Accipiter gularis 14 17
Chinese Sparrowhawk A. soloensis 6737 25,126
Grey-faced Buzzard Butastur indicus 571 2176
Eurasian Kestrel Falco tinnunculus 18 6
Peregrine Falcon F. peregrinus calidus 9 16
Common Buzzard Buteo buteo 5
Unidentified accipiter Accipiter spp. 178 24
Unidentified falcon Falco spp. 1 2
Unidentified raptors 47 29
TOTAL 7587 27,399

86
Figure 1. Geographic locations of watchsites in the Philippines where migration counts were conducted in 2012 (Cape San Agustin)
and 2014 (Basco). Map on the left shows the entire Philippines with the location of watchsites (). The top right inset (a) shows the
location of the watchsite at Basco and part of Taiwan, which is 180 km north, and mainland Luzon of the Philippines, 280 km south.
The bottom right map (b) shows the location of the watchsite at Cape San Agustin found in the island of Mindanao, as well as the
northernmost islands of Indonesia (Sulawesi), 170 km south.

87
Figure 2. Within-season distribution of autumn migration flights observed at (a) Basco
(25 August – 19 October 2014) and (b) Cape San Agustin (12 September – 30 October
2012), Philippines. Vertical dashed line shows the first day that migration was observed.
Asterisks show the first and last days of count. These data did not allow us to assess
interannual variation in migration behavior. Because sampling periods were not identical,
the start and end of some seasonal distributions may not be represented in these data.

88
Figure 3. Time of day of autumn migration flights observed at Basco (25 August – 19
October 2014) and Cape San Agustin (12 September – 30 October 2012), Philippines.
Migration flights were observed from 0530 H to 1730 H (Basco) and 0600 H to 1530 H
(Cape San Agustin).

89
Figure 4. Average passage rates of all raptors counted per hour during different (a) wind
directions and (b) wind speeds (m/sec) during autumn migration at Basco (25 August –
19 October 2014) and Cape San Agustin (12 September – 30 October 2012), Philippines.
Standardized categories for wind speeds were based on the Beaufort scale (Hasse 2015).

90
Figure 5. Coefficient estimates for generalized linear mixed models for weather
conditions associated with hourly autumn passage rates for Basco (25 August – 19
October 2014) and Cape San Agustin (12 September – 30 October 2014), Philippines. U
and V wind components were measured using handheld, digital anemometer. Cloud
cover was the estimated percent of sky with background cloud cover. Bars represent 95%
confidence intervals. Statistical significance indicated by number of asterisks: * indicates
P <0.05, ** indicates P <0.01, *** indicates P <0.001)

91
Figure 6. Coefficient estimates for generalized linear model for weather conditions
associated with Accipiter and Grey-faced Buzzard hourly autumn passage rates for (a)
Basco (25 August – 19 October 2014) and (b) Cape San Agustin (12 September – 30
October 2012), Philippines. U and v wind components were measured using handheld,
digital anemometer. Cloud cover was the estimated percent of sky with background cloud
cover. Bars represent 95% confidence intervals. Statistical significance indicated by
number of asterisks: * indicates P <0.05, ** indicates P <0.01, *** indicates P <0.001).

92
CHAPTER 4
Abundance of island avian predators in a heavily impacted tropical forest suggests that endemics face greatest risk from
landscape changes
Camille B. Concepcion1*, Adam E. Duerr1,2, Keith L. Bildstein3, Petra B. Wood4, Todd E. Katzner1,5,6
1Division of Forestry & Natural Resources, West Virginia University, Morgantown
WV 26506 USA
2Bloom Biological, Inc., 13611 Hewes Ave. Santa Ana, 92705 USA
3Hawk Mountain Sanctuary, 1700 Hawk Mountain Rd., Kempton, PA 19527 USA
4U.S. Geological Survey, West Virginia Cooperative Fish and Wildlife Research Unit,
West Virginia University, Morgantown, West Virginia 26506, USA
5United States Department of Agriculture, Forest Service, Timber and Watershed
Laboratory, Parsons, West Virginia 26287, USA
6U.S. Geological Survey, Forest & Rangeland Ecosystem Science Center, 970 Lusk St.,
Boise, ID 83706 USA

93
ABSTRACT
Anthropogenic land cover change is among the largest threats to biodiversity, and island
endemics and habitat specialists are especially vulnerable to these changes. We used
road surveys and occupancy modeling to determine the distribution of birds of prey in
the southern Philippine island of Mindanao and to assess the land cover characteristics
that influence this distribution. During winter field surveys between 2014 and 2016, we
observed 13 of the 27 birds of prey species present on Mindanao and we counted 1,656
individuals. The Brahminy Kite (Haliastur indus) and the Philippine Serpent Eagle
(Spilornis holospilus) were the most commonly observed species. Our models suggest
that on average, detection probability was 86% for all raptors combined, 50% for
Brahminy Kites, and 35% for Philippine Serpent Eagles. Our models also predict that the
probability of occupancy by Brahminy Kites (a purported habitat generalist with a large
distribution) was positively correlated with forest disturbance while probability of
occupancy by Philippine Serpent Eagles (an endemic and purported forest specialist)
was highest in near-pristine forests. Further, we observed fewer island endemics and
more non-endemic residents than predicted by our models. These suggest that the
anthropogenic changes in central and eastern Mindanao are more consequential to
endemics than expected and that endemics are more vulnerable to these changes than
are more widespread species.

94
INTRODUCTION
Anthropogenic landscape change is among the greatest threats to global
biodiversity. The expansion and intensification of agriculture, in particular, have
been predominant drivers of this process (Matson et al. 1997, Clay 2004). Land
cover change leads to the loss of natural environments, alters structure and function
of ecosystems (Vitousek et al. 1997, Foley et al. 2005), and removes, reduces, or
isolates suitable habitats (Fahrig 2003). Altogether, these changes can decrease the
capacity of the environment to support biodiversity (Gaston et al. 2003). As a result,
although species and community response to land cover change is highly context-
specific (Hansen et al. 2001), human-modified environments almost always support
smaller populations of lower species diversity than do unmodified environments
(Rapport et al. 1985, Gardner et al. 2008).
For birds, habitat fragmentation can influence spatial and temporal changes in
populations by affecting territory size and dispersal (Rolstad 1991). As predators,
raptors have smaller populations than most other avian species, they occur at lower
densities, they are dependent on movements of their prey, and they are often a focus
of persecution by humans (Newton 1979, 1998, Thiollay and Meyburg 1988, Hall et
al. 2015). As a consequence, raptors, particularly forest raptors, often are especially
vulnerable to landscape changes (Jullien and Thiollay 1996, Thiollay 2007).
These patterns are especially true for raptor communities in islands, where
endemism is high (Gentry 1992, White and Kiff 2000), and species occur in naturally
constrained ranges (i.e. limited to the size of the island) and have restricted
potential to disperse (Thiollay and Meyburg 1988, Virani and Watson 1998,
Blackburn and Gaston 2002). As a result of anthropogenic landscape changes,
tropical island endemics are among the most globally threatened raptors in the
world (Concepcion et al. 2017).
The Philippines has one of the planet’s richest and most threatened areas of
biodiversity (Myers et al. 2000, Hannah et al. 2013). The archipelago has such high
rates of deforestation (Lasco and Pulhin 2000, Bankoff 2007) that only 3% of its

95
original primary forest remains (Myers et al. 2000). Deforestation affects many of
the country’s 29 species of diurnal birds of prey, 15 of which tend to occupy habitats
with more than 50% forest cover (Gamauf et al. 1998, Kennedy et al. 2000). Among
Asian countries, the Philippines also has among the highest number of endemics and
globally threatened species make up a disproportionately large proportion of the
species present (Concepcion et al. 2017).
To understand the effects of changes in land cover on tropical raptor communities
and species, we surveyed raptors and land cover types in central and eastern areas
of the Philippine island of Mindanao. We used these data to identify the distribution
of birds of prey present and to assess how land cover characteristics has influenced
this distribution. Our specific objectives were to (1) evaluate patterns in raw count
data to understand how road surveys compare to other survey techniques that have
been used, (2) describe the abundance of raptor and habitat relationships of raptor
communities within central and eastern Mindanao, and (3) characterize among-
species (forest specialist vs habitat generalist) differences in landcover correlates of
occupancy.
METHODS
Study area
The Philippines is a tropical, southeast Asian archipelago made up of over 7,000
islands with an area of 300,000 km2. Its land cover is a mosaic of rainforests,
croplands and plantations (Catibog-Sinha and Heaney 2006). The few remaining
forests that have not been cleared for agriculture are found mostly on the islands of
Palawan, Mindanao, and the northern and southern parts of Luzon. These forests
are one of three types, low-elevation dipterocarp, high elevation montane, or
mangrove. Low elevation dipterocarp forests are usually found from sea level up to
700 meters above sea level (ASL; Heaney 1998, Catibog-Sinha and Heaney 2006),
although in Mindanao, dipterocarp forests sometimes extend up to 1,500 meters
ASL. Dipterocarp forests are dominated by large trees in the family

96
Dipterocarpaceae that have massive supporting buttresses, and can grow up to
three meters in diameter and 60 meters tall. Lianas (woody vines), other vines and
strangler fig trees (Ficus spp.) are common. High elevation montane forests on
Mindanao are usually found at 700 - 2,300 meters ASL. Montane forests are
dominated by oak (Quercus spp.) and laurels (Lauraceae family) that grow up to 25
meters tall. These trees are covered in moss and epiphytes, such as pitcher plants
(Nepenthes spp.), orchids (Orchidaceae family), and palm (Freycinetia spp.).
Mangrove forests are exclusively coastal in distribution.
We surveyed for raptors in representative portions of land controlled by five towns
of the island of Mindanao (Figure 1). These areas were selected because they were
accessible (parts of Mindanao are contested and not safe for travel) and represented
a diversity of forest types, disturbance regimes, and elevations (Ong et al. 2002,
Conservation International - Philippines et al. 2006). They are:
Lantapan, in the Province of Bukidnon, has near-pristine, high elevation
montane forests located within the Mount Kitanglad Range (312 km2). The
forests there are surrounded by a matrix of agricultural and open lands.
Mount Kitangland Range has national protected status.
Arakan, in the Province of North Cotabato, has severely disturbed, high
elevation montane forest, confined to the slopes of Mt. Sinaka (17 km2).
Similar to Lantapan, the forest in Arakan is surrounded by a matrix of
agricultural and open lands.
Davao City, in the Province of Davao del Sur, has moderately disturbed, high
elevation montane forest. The 41 km2 of forests here are surrounded by open
and agricultural lands and are located within the Marilog Forest Reserve.
San Isidro and Governor Generoso, both in the Province of Davao Oriental, are
neighboring towns and share 319 km2 of contiguous, low elevation
Dipterocarp forests found within the protected Mt. Hamiguitan Range
Wildlife Sanctuary. The forest we surveyed near San Isidro is near-pristine,

97
while the forest we surveyed near Governor Generoso is moderately
disturbed.
Survey techniques
In each town, we surveyed for raptors at 11 point counts distributed at 1-km
intervals along a fixed, 10-km transect. Each transect was established along existing
roads and we used GoogleEarth and local information to select those roads that
crossed or ran adjacent to forest for the longest distance. We began the transect
where the road dead-ended.
Surveys were completed in November to December of 2014, 2015, and 2016. Each
year, the five routes were sampled five times over a three-day period. Surveys
occurred up to twice per day, starting as early as 0900H and finishing at or before
1600H, approximately the period during the day when rain forest birds are most
likely to soar and perform territorial or display flights (Thiollay 1989). Due to
logistical constraints, we did not have equal numbers of morning and afternoon
surveys. We drove each of the five 10-km transects five times in each of three years,
covering a total of 750 km.
At each point count location, four observers exited the car, fanned out along the
point, and surveyed for raptors for 10 minutes. We spotted raptors by using
binoculars, field scopes and the unaided eye to methodically scan the sky and trees.
For each bird sighted, we recorded the route, observer location, species, time of
sighting, straight line distance from observers, activity (flighted, perching) and the
land cover type where the bird was detected (forest, forest edge, open, agricultural).
We assumed that flight activity was for territorial display. Whenever possible, we
estimated the age of the individual as either immature or adult. Observers shared
information and any bird spotted was only recorded once.
Finally, at each point count, we noted the forest type (dipterocarp or montane), and
level of disturbance (low, moderate, severe). Disturbance was characterized based
on logging history, area of forest remaining, and human activity surrounding the
remaining forest. In general, low disturbance sites were unlogged and were rarely

98
used by humans. Moderately disturbed sites had been logged on the periphery and
had some agricultural activity around the remaining forest. Severely disturbed sites
had been heavily logged and remaining forest fragments were surrounded by
extensive agriculture. We did not have access to a severely disturbed, dipterocarp
forest.
Data analysis
We used our observations at point counts to build year-specific encounter histories.
We then used N-mixture models for spatially repeated counts (Royle 2004) within
Program MARK (Version 6.2, Dec. 2016; White and Burnham 1999) to estimate
detection and occupancy probabilities of the raptors we counted. These models
estimate, through a logit likelihood function, the binomial sampling probability that
a particular individual is detected (r), and the Poisson intensity parameter of
occupancy (λ) at each point (Royle and Nichols 2003, Royle 2004). Intensity
parameter estimates the number of individuals at each point count. Global detection
and transect-specific occupancy probabilities were calculated from these
parameters.
In our models, we set the intensity (λ) and individual detection probability (r)
parameters to be either constant or we allowed them to vary among the three
survey years. Our model set included four models, with all possible combinations of
individual detection and intensity parameters, as follows:
r and λ constant over time
r constant over time and λ time-varying
r time-varying and λ constant over time; and
r and λ time-varying.
In all our models, we allowed λ to be influenced by forest type and level of
disturbance. To reduce deviances, we applied a global optimization with simulated
annealing (Goffe et al. 1992). We model averaged across all models in each set
99
(Doherty et al. 2012) to estimate model parameters (Buckland et al. 1997, Burnham
and Anderson 2002).
To evaluate patterns in raw count data (for objective #1), we used Kruskal-Wallis
test and Wilcoxon signed-rank tests, within R statistical software (R Development
Core Team 2013) to compare between years, times of day (0900—1200H vs 1300—
1400H), and forest types, the raw count data on numbers of raptors counted on
surveys at each survey point. To describe where we detected raptors and how those
detections were distributed in our survey areas (objective #2), we adjusted those
raw count data with region-specific model averaged detection and occupancy
probabilities. Because we observed relatively few birds of most species, we could
not model detection and occupancy probabilities for each species individually.
Instead, to describe the general patterns for this guild, we estimated detection and
occupancy probabilities (as described above) for all raptors combined (Duerr et al.
2015). We then use these detection and occupancy estimates to evaluate among-
forest differences in patterns of raptor occupancy.
To identify differences among occupancy patterns for the two most-commonly
observed species (objective #3), again we first used Wilcoxon signed-rank tests to
compare between survey years, time of day (AM vs PM), and forest types, the raw
count data on numbers of individuals. We then again adjusted those raw count data
with model averaged detection and occupancy probabilities. Finally, we used these
detection and occupancy estimates to evaluate among-forest differences in patterns
of occupancy of those two species.
RESULTS
Raptor communities within central and eastern Mindanao
Between 2014 and 2016, we observed 13 species of birds of prey and 1,656
individual raptors (Table 1). Four species were Philippine endemics, three were
migrants that do not breed in the Philippines, five species were habitat generalists,

100
and five were forest specialists (Table 1). The Brahminy Kite (Haliastur indus) and
Philippine Serpent Eagle (Spilornis holospilus) were the most common species
observed. The majority (95%; n = 1,567) of raptors observed were in flight. We
observed no inter-annual variation in the number of birds we detected (Kruskal-
Wallis, χ2 = 0.57, df = 2, p = 0.75), but we observed more raptors during morning
surveys (x ̅ = 3.03, SD = 1.03) than during afternoon surveys on the same routes (x ̅ =
2.42, SD = 0.94; W = 930, p = 0.01). Further, we observed no variation in the number
of raptors we counted among the different forest types (Figure 2, W = 731, p = 0.55).
In general, individual detection probabilities for all raptors were low and intensity
of occupancy parameters were high. Global detection probabilities were generally
high (0.84 – 0.87) and occupancy probabilities always were approximately 1. For all
raptors considered together, there was less support for models that described
detection and occupancy probabilities varying among the three survey years
(detection: ΣAICc weight = 0.36, occupancy: ΣAICc weight = 0.24) than for models
where these remained constant among the years (detection: ΣAICc weight = 0.64,
occupancy: ΣAICc weight = 0.76; Table 2, Table 3).
Our model estimated that for every point count within the landcover type the model
used as reference (dipterocarp forest with low to moderate disturbance), 12 raptors
were present and average detection rates for those raptors were 86%. These models
also suggested that within both forest types, disturbance reduced abundance of
raptors within forests (Table 4). That said, when disturbance was similar,
abundance of raptors was greatest in high elevation montane forests and lower in
low elevation dipterocarp forest.
Among-species differences in detection and occupancy
We observed no inter-annual or diel variation in the numbers of Brahminy Kites
(year: Kruskal-Wallis, χ2 = 0.67, df = 2, p = 0.73; time of day: W = 744, p = 0.46) and
Philippine Serpent Eagles (year: Kruskal-Wallis, χ2 = 2.41, df = 2, p = 0.33; time of
day: W = 585.5, p = 0.37) that we counted. We observed more Brahminy Kites
during surveys around montane forests (x ̅ = 2.38, SD = 0.97) than during surveys

101
around dipterocarp forests (x ̅ = 1.47, SD = 0.37; W = 224, p < 0.001, Figure 2). On
the other hand, we observed more serpent eagles during surveys around
dipterocarp forests (x ̅ = 2.09, SD = 0.88) than during surveys around montane
forests (x ̅ = 1.50, SD = 0.58; W = 732.5, p = 0.004, Figure 2).
Our model estimated that at every point count around the reference landcover,
there were 6 Brahminy Kites of which 60% were detected. For Brahminy Kites,
detection probabilities were relatively high and there was more support for models
where this varied among survey years (ΣAICc weight = 0.73) than for models where
detection was constant (ΣAICc weight = 0.27; Table 2, Table 3). There was more
support for models that described occupancy probability as constant across years
(ΣAICc weight = 0.62) than for models where it varied among the years (ΣAICc
weight = 0.38;). If disturbance was similar, kites were more likely to occupy
dipterocarp forests, than montane forests (Table 4). However, within both forest
types, there were 2-3 times more kites in moderately disturbed forests than the
other sites.
For Philippine Serpent Eagles, detection probabilities were relatively low and there
was more support for models where detection varied among survey years (ΣAICc
weight = 0.54) than for models where it was constant among years (ΣAICc weight =
0.46; Table 2, Table 3). There was more support for models where occupancy was
constant (ΣAICc weight = 0.57) than models where occupancy varied among the
years (ΣAICc weight = 0.43). Based on our model, when disturbance is similar,
serpent eagles were more likely to occupy low elevation dipterocarp forests, than
montane forests (Table 4). That said, within both forest types, disturbance reduced
abundance of serpent eagles within forests. Our model estimated that at every point
count around the reference landcover, 8 Philippine serpent eagles were present of
which 35% were detected.

102
DISCUSSION
Understanding the impacts of habitat fragmentation and loss on biodiversity is
essential to conserving wildlife populations. To do this, it is crucial to understand
how species respond to landscape changes. Our study is among the first to use the
combination of road surveys and occupancy modeling to describe communities of
birds of prey in either the tropics or the Philippines. More broadly, it also illustrates
how island endemics may be relatively more vulnerable to land-use changes than
more broadly distributed non-endemic species.
In the course of our surveys, we observed 45% of the total diversity of species of
diurnal birds of prey regularly observed in the Philippines. Although detection rates
were high, the majority of the birds we observed were in soaring flight and it is
likely that we missed species that do not soar. For example, Besras (Accipiter
virgatus) are known to stay in forests or in the understory and we did not count any
of them in our surveys (Gamauf et al. 1998). We also observed more birds during
our morning surveys, possibly demonstrating time-of-day patterns in territorial and
foraging flight activities (Wakeley 1978, Newton 1979, Ballam 1984).
In the tropics, there are typically more species found in low elevation than high
elevation areas (Goodman and Gonzales 1990, Peterson et al. 2000). However, our
models suggested the opposite - that few birds occupied low elevation forests.
Human population density in the Philippines is greater at low elevations and the
patterns we observed likely reflect the greater magnitude of anthropogenic changes
at low, as opposed to high, elevation forests (Vester et al. 2007, Nogués-Bravo et al.
2008). In fact, we observed up to 150% more raptors than our model estimated at a
high elevation field site (i.e. Davao City). This was unexpected because this site was
not only high elevation, but also had moderately disturbed forests. We encountered
similar numbers of birds of prey here as we did in a site which had near-pristine,
low elevation forest (i.e. San Isidro).
Overall, we observed fewer forest specialists and more habitat generalists than our
models predicted. In our study, forest specialists were represented by Philippine

103
Serpent Eagles which typically occupy dipterocarp forests with over 50% canopy
cover (Gamauf et al. 1998, Kennedy et al. 2000, Ferguson-Lees and Christie 2001).
Habitat generalists were represented by Brahminy Kites, a species that occupies
open cover types. The low numbers of forest specialists and high numbers of habitat
generalists may mean one of at least two things. One, forest specialists are forest
interior species and road surveys, which use transects that do not always cross the
forest, are not an appropriate method to survey for them. Two, our road surveys
accurately captured the status of the raptor population, and the remaining forests
are highly degraded and therefore, less suitable for forest specialists.
We can test the first of these two hypotheses (that our results are driven by bias
induced by the type of survey we conducted) by comparing trends in our data with
those from other surveys conducted differently. For example, the most commonly
used method for surveying birds of prey in the Philippines is to count birds from a
fixed observation point on a ridgetop. Such vantage points provide better views of
forested areas than do road surveys. If our survey methods are driving our results,
we would expect to observe relatively more forest specialists during surveys from
those ridge-top observation posts. However, when concurrent observations from
fixed posts and road surveys are conducted, fewer raptors, forest specialists or
otherwise, are observed from fixed observation posts (CBConcepcion unpubl. data).
Thus, it seems unlikely that survey type is driving the trend we observed.
We can test the second hypothesis (that remaining forests are less suitable for forest
specialists) by comparing the numbers of birds of each type that we counted. Based
on our detection probabilities and the estimated number of individuals present at
each point, we have recorded only 86% of serpent eagles, but 242% of the Brahminy
Kites estimated. As these species have opposite landcover needs, these data seem to
support our second hypothesis. This finding is especially significant because the
Philippine Serpent Eagle is an endemic species, and our results would coincide with
Ferrer-Sánchez and Rodríguez-Estrella (2015) who found that “[island] endemics
do not cope well with habitat changes.” Several other studies have found this to be
true for island species (Thiollay and Meyburg 1988, Jullien and Thiollay 1996,

104
Bildstein 1998, Thiollay 1998, Virani and Watson 1998, Sodhi et al. 2004, 2008,
2010). These species may therefore be more vulnerable than are more widespread,
generalist species and, if deforestation continues at its current rate, their
conservation status, which is currently “Least Concern”, may need to be
reconsidered.
Our study shows that conducting relatively inexpensive, and statistically robust
surveys can be used to assess the impact of anthropogenic land-use change on
Philippine wildlife. Although responses to these changes are species-specific
(Hansen et al. 2001), our data illustrate that loss of natural environments impacts
endemic species. This is directly relevant not just for the Philippine Serpent Eagle,
but for the other endemic diurnal raptor species we observed as well. The
Philippine Eagle (Pithecophaga jefferyi), the Philippine Honey-buzzard (Pernis
stereei), and the South Philippine Hawk-eagle (Nisaetus pinskeri), are all forest
specialists. We also found that endemics and habitat specialists, no matter how
common, became limited to natural or less disturbed areas. Further investigation
will help identify the demographic responses of these species to the continued
landscape changes occurring in an already degraded forest areas.
ACKNOWLEDGEMENTS
This study was funded by the Project Soar Grant from Hawk Mountain Sanctuary
(U.S.A.) and The Sperry Fund Scholars in Raptor Conservation Science. Additional
funding also came from the Lewis and Clark Exploration Fund, the William A.
Burnham Memorial Fund, and the Peregrine Fund. We thank the local government
of Lantapan, Arakan, Davao City, San Isidro and Governor Generoso who kindly
admitted us onto land they controlled; Biodiversity Management Bureau and the
relevant regional and municipal offices of the Department of Environment and
Natural Resources for granting permits for our study; Joey Gamao, Emeliano
“Blacky” Lumiston, Lando Luatan for assistance in the field; Medel R. Silvosa,
Patricia T. Dumandan, Tracy Maffett B. Prado, Marvin Tancio and Perfecto Balicao

105
for assisting in data collection. This is Scientific Article No. xxxx of the West Virginia
Agricultural and Forestry Experiment Station, Morgantown, WV. Any use of trade,
product, or firm names is for descriptive purposes only and does not imply
endorsement by the U.S. Government. This paper is conservation science
contribution number yyyy from Hawk Mountain Sanctuary.
REFERENCES
Ballam, J. M. 1984. The use of soaring by the red-tailed hawk (Buteo jamaicensis).
The Auk 101:519–524.
Bankoff, G. 2007. One island too many: reappraising the extent of deforestation in
the Philippines prior to 1946. Journal of Historical Geography 33:314–334.
Bartholomé, E., and A. S. Belward. 2005. GLC2000: a new approach to global land
cover mapping from Earth observation data. International Journal of Remote
Sensing 26:1959–1977.
Bildstein, K. L. 1998. Conservation status of tropical raptors. Journal of Raptor
Research 32:3–18.
BirldLife International. 2017. IUCN Red List for birds. http://www.birdlife.org.
Blackburn, T., and K. Gaston. 2002. Extrinsic factors and the population sizes of
threatened birds. Ecology Letters 5:568–576.
Buckland, S. T., K. P. Burnham, and N. H. Augustin. 1997. Model selection: An integral
part of inference. Biometrics 53:603–618.
Burnham, K. P., and D. R. Anderson. 2002. Model selection and multimodel
inference: a practical information-theoretic approach. 2nd edition. Springer,
New York.
Catibog-Sinha, C., and L. R. Heaney. 2006. Philippine biodiversity: Principles and
practice. Haribon Foundation for the Conservation of Natural Resources, Inc.,
Quezon City.
Clay, J. 2004. World agriculture and the environment: A commodity-by-commodity
guide to impacts and practices. Island Press, Washington, DC.
Concepcion, C. B., K. L. Bildstein, N. J. Collar, and T. E. Katzner. 2017. Conservation

106
threats and priorities for raptors across Asia. Pages 20–61 Movement ecology
of Philippine birds of prey [Doctoral dissertation]. West Virginia University,
Morgantown.
Conservation International - Philippines, Department of Environment and Natural
Resources-Protected Areas and Wildlife Bureau, and Haribon Foundation.
2006. Priority sites for conservation in the Philippines: Key biodiversity areas.
Quaon City, Philippines.
Doherty, P. F., G. C. White, and K. P. Burnham. 2012. Comparison of model building
and selection strategies. Journal of Ornithology 152:317–323.
Duerr, A. E., T. A. Miller, K. L. Cornell Duerr, M. J. Lanzone, A. Fesnock, and T. E.
Katzner. 2015. Landscape-scale distribution and density of raptor populations
wintering in anthropogenic-dominated desert landscapes. Biodiversity and
Conservation 24:2365–2381.
Fahrig, L. 2003. Effects of habitat fragmentation on biodiversity. Annu Rev Ecol Evol
Syst 34:487–515.
Ferguson-Lees, J., and D. A. Christie. 2001. Raptors of the world. Houghton Mifflin
Company, New York.
Ferrer-Sánchez, Y., and R. Rodríguez-Estrella. 2015. Man-made environments
relationships with island raptors: Endemics do not cope with habitat changes,
the case of the island of Cuba. Biodiversity and Conservation 24:407–425.
Foley, J. A., R. Defries, G. P. Asner, C. Barford, G. Bonan, S. R. Carpenter, F. S. Chapin,
M. T. Coe, G. C. Daily, H. K. Gibbs, J. H. Helkowski, T. Holloway, E. a Howard, C. J.
Kucharik, C. Monfreda, J. a Patz, I. C. Prentice, N. Ramankutty, and P. K. Snyder.
2005. Global consequences of land use. Science 309:570–4.
Gamauf, A., M. Preleuthner, and H. Winkler. 1998. Philippine birds of prey:
Interrelations among habitat, morphology, and behavior. The Auk 75:713–726.
Gardner, T. A., M. I. M. Hernández, J. Barlow, and C. A. Peres. 2008. Understanding
the biodiversity consequences of habitat change: The value of secondary and
plantation forests for neotropical dung beetles. Journal of Applied Ecology
45:883–893.
Gaston, K. J., T. M. Blackburn, and K. Klein Goldewijk. 2003. Habitat conversion and
107
global avian biodiversity loss. Proceedings. Biological sciences / The Royal
Society 270:1293–300.
Gentry, A. H. 1992. Tropical forest biodiversity: Distributional patterns and their
conservational significance. Oikos 63:19–28.
Goffe, W. L., G. D. Ferrier, and J. Rogers. 1992. Global optimization of statistical
functions with simmulated annealing. Journal of Econometrics 60:65–99.
Goodman, S. M., and P. C. Gonzales. 1990. The birds of Mt. Isarog National Park,
southern Luzon, Philippines, with particular reference to altitudinal
distribution. Fieldiana 60:1–39.
Hall, J. C., A. K. Chhangani, and T. A. Warner. 2015. Spatial characteristics of nest
sites of Critically Endangered Indian Vultures (Gyps indicus) in Rajasthan,
India. The Indian Forester 141:1–5.
Hannah, L., M. Ikegami, D. G. Hole, C. Seo, S. H. M. Butchart, A. T. Peterson, and P. R.
Roehrdanz. 2013. Global climate change adaptation priorities for biodiversity
and food security. PloS one 8:e72590.
Hansen, A. J., R. P. Neilson, V. H. Dale, C. H. Flather, L. R. Iverson, D. J. Currie, S. Shafer,
R. Cook, and P. J. Bartlein. 2001. Global change in forests: Responses of species,
communities, and biomes. BioScience 51:765.
Hansen, M. C. C., P. V Potapov, R. Moore, M. Hancher, S. A. a Turubanova, A.
Tyukavina, D. Thau, S. V. V Stehman, S. J. J. Goetz, T. R. R. Loveland, A.
Kommareddy, A. Egorov, L. Chini, C. O. O. Justice, J. R. G. R. G. Townshend, P. V.
Patapov, R. Moore, M. Hancher, S. A. a Turubanova, A. Tyukavina, D. Thau, S. V. V
Stehman, S. J. J. Goetz, T. R. R. Loveland, A. Kommaredy, A. Egorov, L. Chini, C. O.
O. Justice, and J. R. G. R. G. Townshend. 2013. High-resolution global maps of
21st-century forest cover change. Science 342:850–854.
Heaney, L. R. 1998. Vanishing treasures of the Philippine rain forest. The Field
Museum, Chicago.
Jullien, M., and J.-M. Thiollay. 1996. Effects of rain forest disturbance and
fragmentation: Comparative of the raptor and human-made changes
community along natural gradients in French Guiana. Journal of Biogeography
23:7–25.

108
Kennedy, R. S., P. C. Gonzales, E. C. Dickinson, H. C. J. Miranda, and T. H. Fisher. 2000.
A guide to the birds of the Philippines. Oxford University Press, New York.
Lasco, R. D., and F. B. Pulhin. 2000. Forest land use change in the Philippines and
climate change mitigation. Mitigation and Adaptation Strategies for Global
Change 5:81–97.
Matson, P. A., W. J. Parton, A. G. Power, and M. J. Swift. 1997. Agricultural
intensification and ecosystem properties. Science 277:504–509.
Myers, N., R. A. Mittermeier, C. G. Mittermeier, G. A. B. da Fonseca, and J. Kent. 2000.
Biodiversity hotspots for conservation priorities. Nature 403:853–858.
Newton, I. 1979. Population ecology of raptors. T & AD Poyser, Berkhamsted.
Newton, I. 1998. Population limitation in birds. Academic Press, Inc., London.
Nogués-Bravo, D., M. B. Araujo, T. Romdal, and C. Rahbek. 2008. Scale effects and
human impact on the elevational species richness gradients. Nature 453:216–
219.
Ong, P. S., L. E. Afuang, and R. G. Rosell-Ambal. 2002. Philippine biodiversity
conservation priorities: A second iteration of the National biodiversity strategy
and action plan. Department of Environment and Natural Resources-Protected
Areas and Wildlife Bureau, Conservation Internationol Philippines, Biodiversity
Conservation Program - University of the Philippines Center for Integrative and
Development Studies, and Foundation f, Quezon City, Philippines.
Peterson, A. T., L. G. Ball, and K. W. Brady. 2000. Distribution of the birds of the
Philippines: biogeography and conservation priorities. Bird Conservation
International 10:149–167.
R Development Core Team. 2013. R: A language and environment for statistical
computing. R Foundation for Statistical Computing, Vienna, Austria.
http://www.r-project.org.
Rapport, D. J., H. A. Regier, and T. C. Hutchinson. 1985. Ecosystem behavior under
stress. The American Naturalist 12:617–640.
Rolstad, J. 1991. Consequences of forest fragmentation for the dynamics of bird
populations: conceptual issues and the evidence. Biological Journal of Linnean
Society 42:149–163.

109
Royle, J. A. 2004. N-Mixture models for estimating population size from spatially
replicated counts. Biometrics 60:108–115.
Royle, J. A., and J. D. Nichols. 2003. Estimating abundance from repeated presence-
abscence data or point counts. Ecology 84:777–790.
Sodhi, N. S., L. H. Liow, and F. A. Bazzaz. 2004. Avian extinctions from tropical and
subtropical forests. Annual Review of Ecology, Evolution, and Systematics
35:323–345.
Sodhi, N. S., M. R. C. Posa, T. M. Lee, and I. G. Warketin. 2008. Effects of disturbance
or loss of tropical rainforest on birds. The Auk 125:511–519.
Sodhi, N. S., D. S. Wilcove, T. M. Lee, C. H. Sekercioglu, R. Subaraj, H. Bernard, D. L.
Yong, S. L. H. Lim, D. M. Prawiradilaga, and B. W. Brook. 2010. Deforestation and
avian extinction on tropical landbridge islands. Conservation Biology 24:1290–
1298.
Thiollay, J.-M. 1989. Censusing of diurnal raptors in a primary rain forest:
comparative methods and species detectability. Journal of Raptor Research
23:72–84.
Thiollay, J.-M. 1998. Distribution patterns and insular biogeography of South Asian
raptor communities. Journal of Biogeography 25:57–72.
Thiollay, J.-M. 2007. Raptor communities in French Guiana: distribution, habitat
selection, and conservation. Journal of Raptor Research 41:90–105.
Thiollay, J. M., and B. U. Meyburg. 1988. Forest fragmentation and the conservation
of raptors: A survey on the island of Java. Biological Conservation 44:229–250.
Vester, H., D. Lawrence, J. R. Eastman, B. L. Turner, S. Calme, R. Dickson, C. Pozo, and
F. Sangermano. 2007. Land change in the southern Yucatan and Calakmul
Biosphere Reserve: effects on habitat and biodiversity. Ecological Applications
17:989–1003.
Virani, M., and R. T. Watson. 1998. Raptors in East African tropics and western
Indian Ocean islands: state of ecological knowledge and conservation status.
Journal of Raptor Research 32:28–39.
Vitousek, P. M., H. a Mooney, J. Lubchenco, and J. M. Melillo. 1997. Human
domination of Earth’ s ecosystems. Science 277:494–499.
110
Wakeley, J. S. 1978. Hunting methods and factors affecting their use by ferruginous
hawks. The Condor 80:327–333.
White, C. M., and L. F. Kiff. 2000. Biodiversity, island raptors and species concepts.
Pages 633–652in R. D. Chancellor and B.-U. Meyburg, editors.Raptors at risk.
World Working Group on Birds of Prey and Hancock House, Blaine,
Washington, USA,.
White, G. C., and K. P. Burnham. 1999. Program MARK: survival estimation from
populations of marked animals. Bird Study 46:S120–S139.

111
Table 1. Number of birds of prey observed around central and eastern Mindanao, 2014-2016. Surveys were conducted between November and December each year. Standard deviations are provided. Conservation status are based on IUCN (BirldLife International 2017) and are either Least Concern (LC), Endangered (EN) or Critically Endangered (CR). Migratory status is either resident (R) or Migratory (M). Habitat specialists (S), habitat generalists (G), and “intermediate” species (I) are also identified.

112
Status Distribution
Migratory status
Habitat use
patterns
Number of individuals
2014 2015 2016 Total Mean Black-winged Kite Elanus caeruleus
LC Global R G 1 0 1 2 0.002 (0.001)
Brahminy Kite Haliastur indus
LC Asia R G 240 258 359 857 1.04 (1.68)
Chinese Sparrowhawk Accipiter soloensis
LC Asia M I 2 6 2 10 0.01 (0.12)
Crested Goshawk Accipiter trivirgatus
LC Asia R S 0 2 0 2 0.002 (0.05)
Grey-faced Buzzard Butastur indicus
LC Asia M G 34 48 26 108 0.13 (0.45)
Oriental Honey-buzzard Pernis ptilorhynchus
LC Asia M/R I 12 17 17 46 0.06 (0.34)
Osprey Pandion haliaetus
LC Global M G 0 2 2 4 0.005 (0.07)
Peregrine Falcon Falco peregrinus
LC Global M/R I 2 4 2 8 0.01 (0.10)
Philippine Eagle Pithecophaga jefferyi
CR Endemic R S 4 1 2 7 0.01 (0.09)
Philippine Honey-buzzard Pernis stereei
LC Endemic R S 0 4 18 22 0.03 (0.46)
Philippine Serpent Eagle Spilornis holospilus
LC Endemic R S 160 143 117 420 0.51 (1.05)
South Philippine Hawk-eagle Nisaetus pinskeri
EN Endemic R S 8 10 0 18 0.02 (0.20)
White-bellied Sea Eagle Haliaeetus leucogaster
LC Asia R G 4 4 14 22 0.03 (0.21)
Unidentified raptor 42 51 25 118
Totals 509 550 585 1644

113
Table 2. Model selection table describing detection probability and occupancy of birds of prey around central and eastern Mindanao. These models estimate intensity (λ) and individual detection probability (r) parameters. We set individual detection probability and occupancy to be either constant (rconstant or λconstant) or to vary among the three survey years (rtime or λtime). We allowed the intensity parameter to be influenced by forest type and level of disturbance. Models are ranked according to increasing AICc values. For all raptors, lowest AIC = 3421.65, for Brahminy Kites, AIC = 2397.66, and for Philippine Serpent Eagles, AIC = 1503.08.
Model ΔAICc AICc
Weights All raptors rconstant λconstant 0 0.45 rtime λconstant 0.72 0.31 rconstant λtime 1.69 0.19 rtime λtime 4.60 0.05
Brahminy Kite rtime λconstant 0 0.62 rconstant λtime 1.68 0.27 rtime λtime 3.46 0.11 rtime λconstant 13.20 0.00
Philippine Serpent Eagles
rtime λconstant 0 0.49 rconstant λtime 0.51 0.38 rconstant λconstant 3.69 0.08 rtime λtime 4.35 0.06

114
Table 3. Model averaged parameter estimates for models describing detection and occupancy probabilities of Brahminy Kites, Philippine Serpent Eagles and all raptors considered together. Our models estimated the binomial sampling probability that a particular individual is detected (r), and the Poisson intensity parameter of occupancy (λ) at each point. Global detection and transect-specific occupancy probability parameters were calculated from r and λ. Standard errors are provided.
Modeled individual parameter estimates
2014 2015 2016
Individual detection (r)
Intensity parameter
(λ) Individual
detection (r)
Intensity parameter
(λ) Individual
detection (r)
Intensity parameter
(λ) All raptors 0.15 (0.02) 12.09 (1.27) 0.16 (0.01) 12.15 (1.06) 0.17 (0.02) 12.17 (1.00) Brahminy Kite 0.14 (0.02) 5.6 (0.03) 0.13 (0.03) 6.20 (1.38) 0.18 (0.03) 6.35 (1.02) Philippine Serpent Eagle 0.06 (0.02) 8.50 (2.68) 0.06 (0.02) 8.12 (2.43) 0.05 (0.02) 7.52 (2.78)
Derived global detection and habitat-specific occupancy parameter estimates
2014 2015 2016
Detection probability
Occupancy probability
Detection probability
Occupancy probability
Detection probability
Occupancy probability
All raptors 0.84 (0.02)
1.00 (<0.001)
0.86 (0.01) 1.00
(<0.001) 0.87 (0.02)
1.00 (<0.001)
Brahminy Kite 0.54 (0.03) 1.00 (0.004) 0.56 (0.03) 1.00 (0.002) 0.68 (0.03) 1.00 (0.002) Philippine Serpent Eagle 0.40 (0.03) 1.00 (0.001) 0.36 (0.03) 1.00 (0.001) 0.30 (0.03) 1.00 (0.002)

115
Table 4. Study site-specific modeled estimates of numbers of Brahminy Kites, Philippine Serpent Eagles, and all raptors combined. We used the beta coefficients of intensity parameter (λ), and the influence of forest type and level of disturbance to estimate abundance or raptors in each location.
Estimated abundance or numbers of raptors
High elevation montane Low elevation dipterocarp
Near-pristine
Moderately disturbed
Severely disturbed
Near-pristine
Moderately disturbed
All raptors 16.49 12.84 8.03 13.92 10.83 Brahminy Kite 0.29 0.74 0.36 0.21 0.74 Philippine Serpent eagle 7.60 11.28 4.47 21.09 11.28

116
Figure 1. Distribution of areas surveyed around central and eastern Mindanao, Philippines. Inset on the top left shows the entire Philippines; island of Mindanao is shaded. Enlarged map of Mindanao shows the locations of the 5 study areas. Figure part (a) shows the fixed 10-km transect ( ) surveyed in Lantapan. Middle map (b) shows the fixed 10-km transect surveyed in Davao City and Arakan. Right map (c) shows the fixed 10-km transect surveyed in San Isidro and Governor Generoso. Areas shaded grey in a, b, and c have at least 50% tree cover and are from Bartholomé and Belward (2005) and Hansen et al (2013). Outlines in a, b and c show town boundaries. Forests nearest to study areas are identified.
Polylines

117
Figure 2. Number of individuals counted of Brahminy Kites, Philippine Serpent Eagles and all raptors combined according to forest type and level of disturbance. Forest type is either high elevation montane or low elevation dipterocarp forest. Level of disturbance is categorized as near-pristine (or low disturbance), moderate or severe.

118
CHAPTER 5
Modeled island hopping through the Philippines demonstrates trade-offs migrant birds face during oceanic crossings
Camille B. Concepcion1*, Keith L. Bildstein2, Todd E. Katzner1,3,4
1Division of Forestry & Natural Resources, West Virginia University, Morgantown
WV 26506 USA
2Hawk Mountain Sanctuary, 1700 Hawk Mountain Rd., Kempton, PA 19527 USA
3United States Department of Agriculture, Forest Service, Timber and Watershed
Laboratory, Parsons, West Virginia 26287, USA
4U.S. Geological Survey, Forest & Rangeland Ecosystem Science Center, 970 Lusk St.,
Boise, ID 83706 USA
Written in the style of: Bird Study

119
SUMMARY Capsule: Modeling trans-oceanic migration pathways demonstrates that birds face
trade-offs among use of stopover sites, duration of over-water travel, and wind
direction, and generates testable hypotheses for future study.
Aims: We evaluated the potential migratory responses of “oceanic”, island-hopping
Grey-faced Buzzards that encounter variation in landscape parameters and weather
as they move through and out of the Philippine archipelago.
Methods: We created spatial models and constrained the modeled routes to enter
the Philippine island chain at a single northern island, Batan, and to use one of 4
potential exits in the south, either Balabac Island, Bongao Island, Balut Island, or
Cape San Agustin on Mindanao Island. We included costs of all possible
combinations of our three external parameters (stopover sites, water and wind
direction) to model alternative migratory routes for each of the four exit points (n =
20 migratory routes) and we validated modeled routes with published migration
data.
Results: Modeled Grey-faced Buzzard migration routes were between 1,582 and
2,970 km and all repeatedly crossed water. Routes overlapped over eastern and
central Luzon, along a leading line created by the Sierra Madre Mountains and at
long and unavoidable over-water crossings between the islands of Mindoro and
Palawan, Negros and Zamboanga del Norte, and Leyte and Mindanao. Observational
data were closer than random points to modeled routes for two of the four possible
exit points.
Conclusion: Our models suggest that the optimal migratory strategy for these birds
is to find the shortest route to an exit point with the greatest possible access to
stopover habitats and fewest open-water crossings under wind resistance.
Understanding how each of the external factors affected the geography and
characteristics of the migratory routes generates testable hypotheses to evaluate
strategies of birds that face dangerous open-water crossings on migration.

120
INTRODUCTION Migration can be a costly period that can influence regulation of bird populations
through its consequences to survival and, in some cases, to reproduction (Newton
1998, 2004). Survival is lower during migration than during non-migratory periods
(Sillett and Holmes 2002, Klaassen et al. 2014) and may vary by sex (Sillett and
Holmes 2002) or age (Oppel et al. 2015). The consequences of low survival and
individual decisions made during migration and wintering in turn have important
carry over effects on sex ratio dynamics and reproductive success (Sillett et al. 2000,
Norris et al. 2004, Norris and Marra 2007, Dale and Leonard 2011). These effects of
migration often are influenced by the range of external conditions that migrants
encounter as they move back and forth between breeding grounds and wintering
grounds (Runge and Marra 2005, Newton 2006).
To account for these consequences, there is selective pressure to minimize costs
associated with energy, time and risk on migration (Alerstam and Hedenström
1998, Henningsson and Alerstam 2005). For example, although migration influences
the energy balance of birds (Tucker 1975, Alerstam et al. 2003), migrating raptors
are able to reduce energetic costs by using soaring flight (Bildstein 2006). Soaring is
fast (Duerr et al. 2012) and so energy efficient (Mandel et al. 2008) that soaring
migrants can cover long distances with little or no need to refuel (Kerlinger 1989,
Bildstein 2006).
Although soaring can help minimize energy and time, it does not however, reduce
safety costs, or risks, associated with over-water travel. When making over-water
crossings, the odds of success are much higher when weather conditions are
favorable (Meyer et al. 2000, Liechti 2006). Decision lapses over-water are highly
consequential because they may lead to fatigue and ultimately death (Bildstein et al.
2009, Oppel et al. 2015). Decision lapses also are especially common for young,
inexperienced birds who are still honing navigation and orientation abilities
(Thorup et al. 2003, Agostini 2004) and learning appropriate migratory responses
to weather and the landscape they encounter (Fagan et al. 2013, Harel et al. 2016).
As such, if young, inexperienced birds survive their first over-water crossings, they

121
sometimes do so in spite of being blown off course by wind drift (Thorup et al. 2003,
Agostini 2004), and following longer migration routes over extended migration
periods (Mellone et al. 2011, Crysler et al. 2016). Despite these challenges, over-
water routes are often shorter and, with the assistance of supporting winds and
appropriate soaring conditions (Alerstam 1979, Meyer et al. 2000, 2003), may be a
significant ecological corridor for birds adapted for such flight (Gill et al. 2009,
López-López et al. 2010).
The Grey-faced Buzzard, Butastur indicus, regularly completes long-distance, over-
water travel and is considered to be one of the most “oceanic” of raptor migrants
(Bildstein 2006). Every year, more than 10,000 Grey-faced Buzzards migrate across
Taiwan before crossing at least 180 km of open ocean to reach the Philippines (Lin
and Severinghaus 1998). Once within the Philippine Archipelago, nearly all of them
make multiple, short oceanic crossings while island-hopping through the country.
Although some of them over-winter in the Philippines, others make another large
ocean crossing, from the southern extent of the archipelago on Palawan and
Mindanao to Borneo and Indonesia, 120 km further south (Ferguson-Lees and
Christie 2001). Because their migration is both so oceanic and so observable at
these few points of land arrival and departure, this species is a good model for
understanding the causes and consequences of migration behavior over large
expanses of water.
We built spatial models to assess costs, consequences and potential migratory
responses of Grey-faced Buzzards to different external factors (e.g. weather
conditions and landscape characteristics) and to provide insight into migratory
strategies individuals may select along this East Asian Oceanic Flyway. Our models
addressed two specific research questions: (a) how may autumn migration routes
vary as a result of trade-offs in migratory response; and (b) how the choice of
migration strategy may influence which potential exit points would be used as
buzzards depart from the Philippines. We then interpret these outputs to provide
insight into the relative costs and benefits to each migratory strategy and to other
migrants that also make substantial ocean crossings.
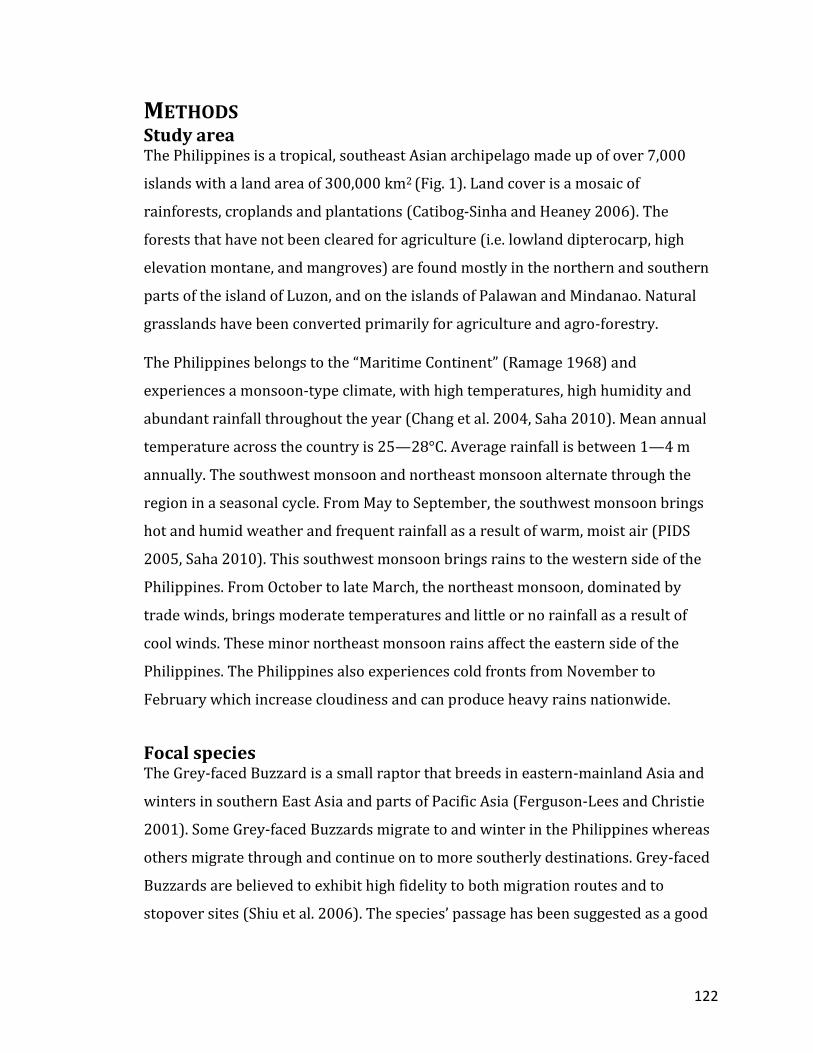
122
METHODS Study area The Philippines is a tropical, southeast Asian archipelago made up of over 7,000
islands with a land area of 300,000 km2 (Fig. 1). Land cover is a mosaic of
rainforests, croplands and plantations (Catibog-Sinha and Heaney 2006). The
forests that have not been cleared for agriculture (i.e. lowland dipterocarp, high
elevation montane, and mangroves) are found mostly in the northern and southern
parts of the island of Luzon, and on the islands of Palawan and Mindanao. Natural
grasslands have been converted primarily for agriculture and agro-forestry.
The Philippines belongs to the “Maritime Continent” (Ramage 1968) and
experiences a monsoon-type climate, with high temperatures, high humidity and
abundant rainfall throughout the year (Chang et al. 2004, Saha 2010). Mean annual
temperature across the country is 25—28°C. Average rainfall is between 1—4 m
annually. The southwest monsoon and northeast monsoon alternate through the
region in a seasonal cycle. From May to September, the southwest monsoon brings
hot and humid weather and frequent rainfall as a result of warm, moist air (PIDS
2005, Saha 2010). This southwest monsoon brings rains to the western side of the
Philippines. From October to late March, the northeast monsoon, dominated by
trade winds, brings moderate temperatures and little or no rainfall as a result of
cool winds. These minor northeast monsoon rains affect the eastern side of the
Philippines. The Philippines also experiences cold fronts from November to
February which increase cloudiness and can produce heavy rains nationwide.
Focal species The Grey-faced Buzzard is a small raptor that breeds in eastern-mainland Asia and
winters in southern East Asia and parts of Pacific Asia (Ferguson-Lees and Christie
2001). Some Grey-faced Buzzards migrate to and winter in the Philippines whereas
others migrate through and continue on to more southerly destinations. Grey-faced
Buzzards are believed to exhibit high fidelity to both migration routes and to
stopover sites (Shiu et al. 2006). The species’ passage has been suggested as a good

123
indicator to identify important raptor migration watchsites (Lin and Severinghaus
1998).
The Grey-faced Buzzard occupies open habitat (Gamauf et al. 1998, Sakai et al.
2011), favoring farmlands sharing edges with forests or wooded areas (Matsuura et
al. 2005, Wu et al. 2006). Although it may use a wide range of farmlands, the Grey-
faced Buzzard prefers to forage for frogs, lizards and grasshoppers in cultivated or
wet rice paddy fields during both breeding and wintering season (Momose et al.
2005, Kadowaki et al. 2007, Sakai et al. 2011). The wintering home range of Grey-
faced Buzzards is 0.25 to 0.75 km2 (Wu et al. 2006). Conversion of agricultural lands,
particularly the abandonment of rice paddy fields, has led to a well-documented and
rapid decline in Grey-faced Buzzard breeding population in Japan (Kawakami and
Higuchi 2003, Ueta et al. 2006a).
Modeling approach To provide a framework to understand why Grey-faced Buzzards take particular
migration routes, we used ArcGIS 10.2.2 (ESRI 2014) to create deterministic models
of Grey-faced Buzzard autumn migratory routes across the Philippines. We
completed this in three stages. First, we evaluated the “cost” of movement as a result
of landscape features (i.e., costs induced by distances between stopover sites on
land and costs induced by over-water travel) and weather conditions (i.e. costs
induced by changes in wind direction) buzzards encounter as they migrate through
the archipelago. These calculations were based on model input data and cost
estimates described below.
Second, we used accumulated cost surface methods (the value of a grid cell
represents the combined energetic and safety cost of moving from that grid cell to
an exit point; Eastman 1989, Douglas 1994, Collischonn and Pilar 2000) to
determine likely routes buzzards use to reach logical exit points in the south of the
country. The four exit points we used were Balabac Island, Bongao Island, Balut
Island, and Cape San Agustin on Mindanao Island (Fig. 1). Each of these exit points
are at a southernmost island tip and each is the closest point to either the island of

124
Borneo (shared by the countries of Malaysia, Brunei and Indonesia) or other
Indonesian islands. Finally, we evaluated characteristics of these potential
movement trajectories to determine the shortest and least costly routes buzzards
could follow to move from the northernmost tip of the Philippines (Batan Island) to
each exit point.
We used 1-km resolution as the standard processing cell size for our models.
Because this is close to the known winter home range size of the species, we
assumed that this would reasonably represent the scale at which Grey-faced
Buzzards use the landscape, especially during stopovers. We transformed all maps
from a geographic coordinate system (WGS 1984) to a projected coordinate system
(WGS 1984 UTM Zone 51N).
Model input data We used land cover and climate data for Philippine terrestrial habitat and all
surrounding marine habitat that were within 4°N (southernmost extent of latitude)
to 22°N (northernmost latitude), and 116°E (westernmost longitude) to 128°E
(easternmost longitude). Data sources are described below; all maps were scaled or
resampled to a 1-km grid cell size for modeling. Our Philippine boundary map was
downloaded from the Global Administrative Areas website (GADM 2011).
To describe land cover types that buzzards might encounter on migration, we used
the Global Land Cover (GLC) 2000 dataset which classified land cover in 17
categories (GLC 2003). Because Grey-faced Buzzards are known to use rice paddies
as foraging habitat, we supplemented land cover data with a ‘percent of rice planted
in an area’ dataset (Ellis et al. 2010).
To identify potential migration stopover sites for Grey-faced Buzzards, we followed
a two-step process. First, we used ArcGIS to create binary maps for habitat type. Our
binary map for rice fields identified all 1 km grid cells with rice fields as 1, and all
grid cells with other habitats as 0. Similarly, our binary map for wooded areas
identified all grid cells with closed-canopy forests, open-canopy forests or
plantations as 1, and all grid cells with other habitats as 0.

125
We then used the ‘Extract raster edge’ tool of the Geospatial Modelling Environment
(Beyer 2012) to identify rice fields adjacent to wooded areas, thought to be critical
habitats for Grey-faced Buzzards (Kawakami and Higuchi 2003, Ueta et al. 2006b).
We selected these areas because previous work (eg. Matsuura et al. 2005, Momose
et al. 2005, Wu et al. 2006) suggests that each ‘edge’ could be used as a stopover site.
We identified 60,442 km2 of rice fields and 79,250 km2 of wooded areas resulting in
6,567 potential 1- km2 stopover sites across the Philippines. Of these, 2,887 are in
Luzon, 1,111 in the Visayas and 2,569 in Mindanao.
To identify areas that would involve over-water travel, we created a binary map
identifying all grid cells of water bodies as 1, and all landforms as 0. To describe
weather that buzzards may encounter on migration, we used wind data measured at
50 m above the surface of the earth from the month of October (the primary month
of buzzard migration) and averaged over 22 years (1983—2005) (Stackhouse Jr.
2013).
Calculating movement costs To evaluate the cost of moving between stopover sites, we computed the straight-
line (Euclidian) distance between any given cell to the nearest 1- km2 potential
stopover site. In the resulting stopover distance cost map, each 1- km2 cell had a
stopover distance cost value ranging from 0 to 547 km, with mean 130 km (SD =
121 km).
To evaluate the cost of moving in winds of different directions, we reclassified wind
direction to make traveling in winds blowing from the north (tailwinds, 135°—
225°) 1.08x less costly than moving in crosswinds blowing from the northeast or the
northwest (crossing tailwinds, 90°—135° and 225°—270°) and 1.20x less costly
than moving in crosswinds blowing from the southeast or southwest (crossing
headwinds, 45°—90°). Thus, each km traveled with crossing tailwinds was
equivalent to traveling 1.08 km with tailwinds and each km traveled with crossing
headwinds was equivalent to traveling 1.2 km with tailwinds. These hypothetical
costs were based on estimates derived from wandering albatross (Diomedea
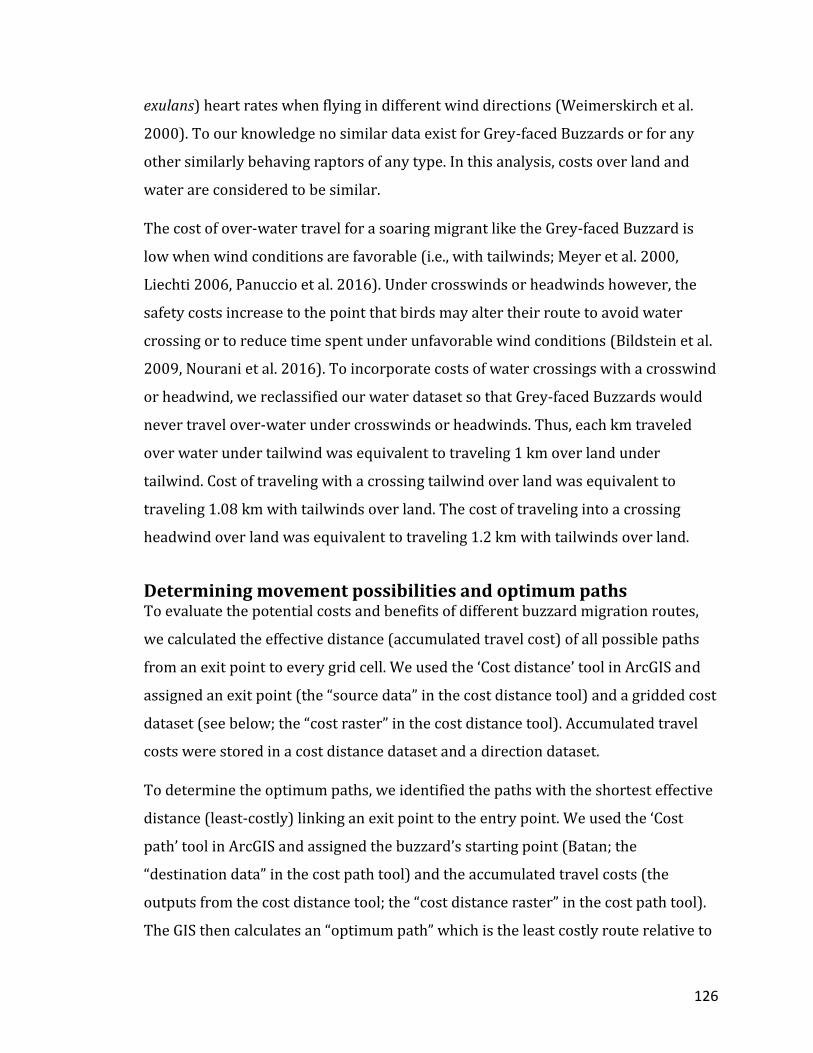
126
exulans) heart rates when flying in different wind directions (Weimerskirch et al.
2000). To our knowledge no similar data exist for Grey-faced Buzzards or for any
other similarly behaving raptors of any type. In this analysis, costs over land and
water are considered to be similar.
The cost of over-water travel for a soaring migrant like the Grey-faced Buzzard is
low when wind conditions are favorable (i.e., with tailwinds; Meyer et al. 2000,
Liechti 2006, Panuccio et al. 2016). Under crosswinds or headwinds however, the
safety costs increase to the point that birds may alter their route to avoid water
crossing or to reduce time spent under unfavorable wind conditions (Bildstein et al.
2009, Nourani et al. 2016). To incorporate costs of water crossings with a crosswind
or headwind, we reclassified our water dataset so that Grey-faced Buzzards would
never travel over-water under crosswinds or headwinds. Thus, each km traveled
over water under tailwind was equivalent to traveling 1 km over land under
tailwind. Cost of traveling with a crossing tailwind over land was equivalent to
traveling 1.08 km with tailwinds over land. The cost of traveling into a crossing
headwind over land was equivalent to traveling 1.2 km with tailwinds over land.
Determining movement possibilities and optimum paths To evaluate the potential costs and benefits of different buzzard migration routes,
we calculated the effective distance (accumulated travel cost) of all possible paths
from an exit point to every grid cell. We used the ‘Cost distance’ tool in ArcGIS and
assigned an exit point (the “source data” in the cost distance tool) and a gridded cost
dataset (see below; the “cost raster” in the cost distance tool). Accumulated travel
costs were stored in a cost distance dataset and a direction dataset.
To determine the optimum paths, we identified the paths with the shortest effective
distance (least-costly) linking an exit point to the entry point. We used the ‘Cost
path’ tool in ArcGIS and assigned the buzzard’s starting point (Batan; the
“destination data” in the cost path tool) and the accumulated travel costs (the
outputs from the cost distance tool; the “cost distance raster” in the cost path tool).
The GIS then calculates an “optimum path” which is the least costly route relative to

127
the exit point and to the cost dataset (the two inputs into the cost distance tool). The
cumulative route cost is unitless and thus is directly comparable among different
exit points that used the same gridded cost dataset. However, these route costs are
not useful for comparing alternatives when gridded cost datasets are not identical.
To understand how routes may vary as a result of trade-offs buzzards face (research
question #1), we prepared different gridded cost datasets based on all possible
combinations of our 3 parameters (n = 20 migratory routes). We combined cost
datasets by multiplying them. We could not consider over-water costs without
incorporating winds and models that required over-water costs only were not
considered. Our gridded cost datasets were based on the following:
• Cost of moving between stopover sites only (n = 4 migratory routes,
one to each endpoint)
• Cost of wind direction only (n = 4 migratory routes)
• Combined costs of stopover distances and wind direction ([Stopover
distances * Wind costs], n = 4 migratory routes)
• Combined costs of wind direction and over-water travel ([Wind costs
* Over-water costs], n = 4 migratory routes)
• Combined costs of stopover distances, over-water travel and wind
direction ([Wind costs * Over-water costs * Stopover distances], full
model, n = 4 migratory routes)
We used descriptive statistics to evaluate the different characteristics (route length,
distance between stopovers, over-water length, length with specific wind
directions) of our 20 migratory routes. As a sensitivity analysis, we compared
distance traveled (total distance, distance between stopovers, distance over water,
distance with specific wind directions) when we varied the cost datasets used in the
model. Finally, within each of the five alternatives above, we compared movement
costs (unitless), to determine which exit point we expected would be used
depending on the migration strategy the buzzards used (research question #2).

128
Movement cost is a better measure than distance traveled because it also captures
energetic and safety costs along each route (Etherington and Holland 2013).
Validation To check the viability of our modeled routes, we compared our modeled
migration routes to published (McClure 1974, 1998) citizen-science (eBird 2012,
Wild Bird Club of the Philippines 2015), and personal (CBC unpublished data)
observations of Grey-faced Buzzards during migration season (n = 29 individual
observations, Fig. 3). We assumed that if our migration routes reasonably represent
buzzard migration, then observations of buzzards should be located closer to
modeled migration routes than would random points. To test this assumption, we
created a distribution map of the 29 “observation points” and 87 random points. We
used the ‘Near’ tool in ArcGIS to determine the distance of each of our observation
and random points to each of our modeled route and we used a Mann-Whitney U-
test to compare, for each of the 20 routes, distances from routes to observation and
random points.
To test the effectiveness of the routes modeled for each of the 4 exit points,
we used a Kruskal Wallis test with a Nemenyi test for post-hoc analyses (Nemenyi
1969) to compare the average difference in observed and random point-to-route
distances according to exit point. Finally, we used a Kruskal Wallis test to test the
effectiveness of each of the 5 cost datasets used in modeling our routes by
comparing observed and random point-to-route distances according to cost dataset.
All statistical analyses were conducted with R statistical software, using the ‘stats’
package (lm, wilcox.test, kruskal.test,) and ‘PMCMR’ package
(posthoc.kruskal.nemenyi.test) (R Development Core Team 2013).
RESULTS Route variation and trade-offs in migratory response Our 20 modeled routes reflect the consequences of a hypothetical buzzard’s
migratory response to external parameters. These routes varied depending on the
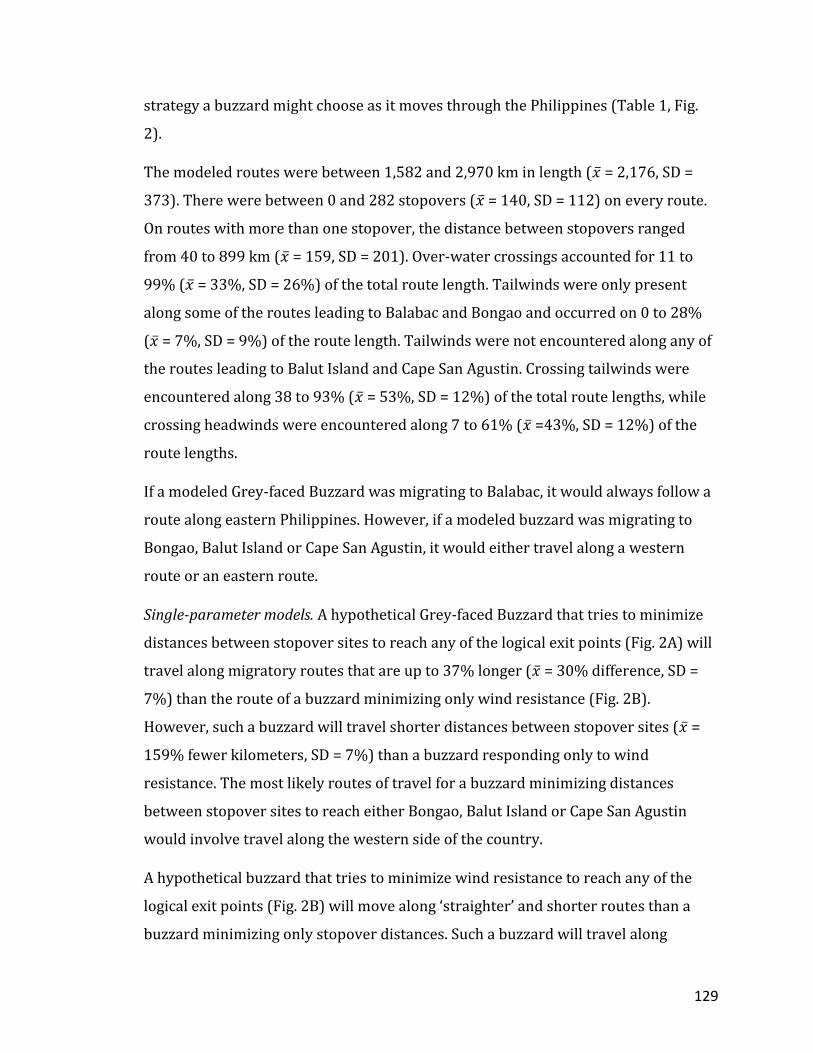
129
strategy a buzzard might choose as it moves through the Philippines (Table 1, Fig.
2).
The modeled routes were between 1,582 and 2,970 km in length (�̅� = 2,176, SD =
373). There were between 0 and 282 stopovers (�̅� = 140, SD = 112) on every route.
On routes with more than one stopover, the distance between stopovers ranged
from 40 to 899 km (�̅� = 159, SD = 201). Over-water crossings accounted for 11 to
99% (�̅� = 33%, SD = 26%) of the total route length. Tailwinds were only present
along some of the routes leading to Balabac and Bongao and occurred on 0 to 28%
(�̅� = 7%, SD = 9%) of the route length. Tailwinds were not encountered along any of
the routes leading to Balut Island and Cape San Agustin. Crossing tailwinds were
encountered along 38 to 93% (�̅� = 53%, SD = 12%) of the total route lengths, while
crossing headwinds were encountered along 7 to 61% (�̅� =43%, SD = 12%) of the
route lengths.
If a modeled Grey-faced Buzzard was migrating to Balabac, it would always follow a
route along eastern Philippines. However, if a modeled buzzard was migrating to
Bongao, Balut Island or Cape San Agustin, it would either travel along a western
route or an eastern route.
Single-parameter models. A hypothetical Grey-faced Buzzard that tries to minimize
distances between stopover sites to reach any of the logical exit points (Fig. 2A) will
travel along migratory routes that are up to 37% longer (�̅� = 30% difference, SD =
7%) than the route of a buzzard minimizing only wind resistance (Fig. 2B).
However, such a buzzard will travel shorter distances between stopover sites (�̅� =
159% fewer kilometers, SD = 7%) than a buzzard responding only to wind
resistance. The most likely routes of travel for a buzzard minimizing distances
between stopover sites to reach either Bongao, Balut Island or Cape San Agustin
would involve travel along the western side of the country.
A hypothetical buzzard that tries to minimize wind resistance to reach any of the
logical exit points (Fig. 2B) will move along ‘straighter’ and shorter routes than a
buzzard minimizing only stopover distances. Such a buzzard will travel along

130
migratory routes with longer over-water crossings (�̅� = 111%, SD = 9%) than a
buzzard responding only to stopover distances. A buzzard minimizing wind
resistance to reach Balabac will not have any access to stopover sites. A buzzard
minimizing wind resistance to reach either Balabac or Bongao would receive more
wind assistance from tailwinds than a buzzard heading towards any other exit point.
Multiple-parameter models. A hypothetical Grey-faced Buzzard that attempts to
minimize both distances between stopover sites and wind resistance to reach any of
the logical exit points (Fig. 2C) will travel along migratory routes that are up to 29%
longer (�̅� = 17%, SD = 9%) than would a buzzard minimizing both wind resistance
and over-water travel (Fig. 2D). Such a buzzard would travel shorter distances
between stopover sites (�̅� = 172%, SD = 4%) and encounter less resistance from
northward crosswinds (�̅� = 23%, SD = 17%) than would a buzzard responding to
both wind resistance and over-water travel. A buzzard minimizing both stopover
distances and wind resistance to reach Bongao would receive more wind assistance
from tailwinds than a buzzard heading towards any other exit point. A buzzard
minimizing both stopover distances and wind resistance to reach either Bongao,
Balut Island or Cape San Agustin would most likely migrate along the western part
of the country.
A hypothetical buzzard that attempts to minimize both wind resistance and over-
water travel (Fig. 2D) will travel along straighter and shorter routes than a buzzard
minimizing both stopover distances and wind resistance. Such a buzzard would
travel along migratory routes with shorter over-water crossings (�̅� = 32%, SD =
12%) than a buzzard responding to both stopover distances and wind resistance. A
buzzard minimizing both stopover distances and wind resistance to reach Bongao
would receive more wind assistance from tailwinds than a buzzard heading towards
any other exit point. A buzzard minimizing both stopover distances and wind
resistance to reach either Bongao, Balut Island or Cape San Agustin would migrate
along the eastern side of the country.

131
A hypothetical buzzard that responds to minimizing stopover distances, over-water
travel and wind resistance (Fig. 2E) will travel along routes that are up to 16%
shorter (�̅� = 8%, SD = 5%) than the route of a buzzard minimizing both stopover
distances and wind resistance (Fig. 2C) and routes that are up to 23% longer (�̅� =
21%, SD = 2%) than the route of a buzzard minimizing both wind resistance and
over-water travel (Fig. 2D). Such a buzzard will travel longer distances between
stopover sites (�̅� = 11%, SD = 8%) than a buzzard responding to stopover distances
and wind resistance and travel shorter distances between stopover sites (�̅� = 101%,
SD = 32%) than a buzzard responding to wind resistance and over-water travel.
Such a buzzard will take shorter over-water crossings (�̅� = 37%, SD = 18%) and
encounter more resistance from crossing headwinds over land (�̅� = 13%, SD = 16%)
than a buzzard responding to any other combination of parameters. A buzzard
minimizing stopover distances, wind resistance and over-water travel to reach
Bongao would receive more wind assistance from tailwinds than a buzzard heading
towards any other exit point. A buzzard minimizing stopover distances, wind
resistance and over-water travel to reach either Bongao, Balut Island or Cape San
Agustin would migrate along the eastern side of the country.
Possible autumn migratory routes and movement funnels To identify how destinations influenced movement costs, we identified the least
costly (in terms of movement costs) route alternatives from each of our gridded cost
datasets. In each case, these comparisons were for each of the five sets of conditions
laid out in the methods; this method does not allow us to compare costs from
models that started with different cost datasets. One of our least costly routes led to
Balabac (Wind costs only, Fig. 3B), two led to Balut Island (Stopover distances only,
Fig. 3A; and Stopover distances * Wind costs, Fig. 3C), and two led to Cape San
Agustin (Wind costs * Over-water costs, Fig. 3D; and Wind costs * Over-water costs *
Stopover distances, Fig. 3E).
We identified areas where our modeled routes overlapped or suggested relatively
long and unavoidable over-water crossings. Sixteen out of our 20 modeled routes
passed over eastern and central Luzon, along a leading line created by the Sierra

132
Madre Mountains, the longest mountain range in the country (Fig. 1.A). At the
southwest of Luzon, there is an unavoidable 70 km over-water crossing between
Mindoro and Palawan (Fig. 1.B). Birds migrating to Palawan or exiting the country
through Balabac would feed through this bottleneck. This crossing was in four of
five routes leading to Balabac. At the southwest of the Philippines, there is a 50 km
bottleneck over water between the islands of Negros and Zamboanga del Norte (Fig.
1.C). Birds wintering in Mindanao, or continuing on to presumed destinations in
Borneo and Indonesia through Bongao, Balut Island or Cape San Agustin would
encounter this water crossing. To reach this particular bottleneck, buzzards would
have to island hop across western Visayas, involving over-water crossings ranging
from 9 to 50 km. This funnel was in 7 of the 15 modeled routes for Bongao, Balut
Island and Cape San Agustin. Finally, at the southeast of the Philippines, there is an
unavoidable 20 km over-water crossing between Leyte and Surigao (Fig. 1.D). Birds
wintering in Mindanao, or continuing on to presumed destinations in Indonesia
through Bongao, Balut Island or Cape San Agustin would be forced through this
bottleneck. This water crossing was in six of the modeled routes leading to Bongao,
Balut and Cape San Agustin.
Model validation Observation points and random points were not randomly distributed with
regards to five routes modeled for the four exit points (Kruskal-Wallis, χ2 = 16.303,
df = 3, p = 0.001). Post hoc tests showed that observation points were closer than
random points to the modeled routes leading to Balut and Cape San Agustin than to
routes leading to Balabac and Bongao (Fig. 4). In addition, observation points were
significantly closer than random points to two out of five modeled routes leading to
Cape San Agustin (Table 2). Observation points and random points had similar
distances to route alternatives (one for each exit point) modeled according to our
five gridded cost datasets (Kruskal-Wallis, χ2 = 0.3286, df = 6, p = 0.9879).

133
DISCUSSION The spatial models we built assessed costs, consequences and potential migratory
responses by Grey-faced Buzzards to external factors and provided insight into
migratory strategies individual birds may select. These models showed how
migratory routes may vary as calculations for movement costs and targeted exit
points changed, Finally, they provide insight into trade-offs in migratory responses,
potential exit points used according to migration strategy, and potential optimal
migration strategies of buzzards and other birds facing open-water crossings.
Trade-offs in migratory response Our spatial models describe possible variation in migratory routes used by Grey-
faced Buzzards moving across the Philippine archipelago in response to landscape
parameters (stopover sites and water crossings) and weather conditions (wind
direction). These modeled routes allow us to examine the costs and consequences of
different migratory responses in the case when migrants have to repeatedly decide
between completing, delaying or foregoing over-water travel.
The general direction in which birds fly is believed to be either genetically inherited
or culturally learned (Berthold et al. 1992, Sutherland 1998, Gschweng et al. 2008).
Avian migratory routes are then adjusted by each individual through continual
assessment and reassessment of habitat and other factors they encounter (Hutto
1985, Vardanis et al. 2011). The ideal migratory route is thought to be one that
minimizes the costs of migration, as measured in terms of combinations of energy,
time, or risk (Hedenström and Alerstam 1997, Liechti and Bruderer 1998, Alerstam
et al. 2003, Alerstam 2011). The resulting characteristics of these routes thus reflect
the bird’s assessment of the potential costs and benefits of each route over time
(Hutto 1985).
In our models of migration through the Philippines, the cost of movement between
potential stopover sites was the factor that had the most influence on the
characteristics of the autumn migratory routes of Grey-faced Buzzards. In response
to availability of stopover sites, a hypothetical buzzard not only shortened distances

134
traveled between stopovers, it also had potential access to more stopover sites than
would a buzzard following a different strategy. However, responding to stopovers
resulted in migratory routes that were longer and more tortuous (less straight) than
necessary (Hake et al. 2003, Thorup et al. 2003, González-Solís et al. 2009). For a
buzzard behaving in this manner, an optimal migratory route therefore may be one
that first maximizes opportunity for stopovers and secondarily minimizes distance
traveled. The importance of stopover sites corresponds well with the known biology
of the species. In fact, stopover sites have been found to be important to Grey-faced
Buzzard migratory routes and buzzards exhibit high fidelity to some of these sites
(Shiu et al. 2006).
As Grey-faced Buzzards migrate, they complete long-distance, over-water travel
(Bildstein 2006). However, after Grey-faced Buzzards enter the Philippine
archipelago, they may still tend to select routes with fewer and shorter over-water
crossings whenever possible (Bildstein 2006, Shiu et al. 2006). Often, there are
limited options to minimizing the safety costs of over-water travel (i.e., there is only
one point in an island with the narrowest water crossing) and the routes of
individual buzzards will geographically converge around a common, population-
level route (La Sorte et al. 2016). This makes unavoidable over-water crossings,
such as those suggested between Mindoro and Palawan, Negros and Zamboanga del
Norte and Leyte and Surigao, potentially important funnel points for Grey-faced
Buzzard migration.
In our models of migration through the Philippines, minimizing the risks involved
with over-water travel altered the geography or location of migratory routes. When
trying to minimize over-water crossings, a hypothetical buzzard would travel
through an eastern route to reach either Bongao, Balut Island or Cape San Agustin. A
buzzard who does not respond to risk associated with over-water crossings would
travel a western route to reach either of these three exit points. This is because
eastern routes had greater distances with unfavorable, crossing headwinds over
land than did a western route. This illustrates the broadly-based trade-offs migrants
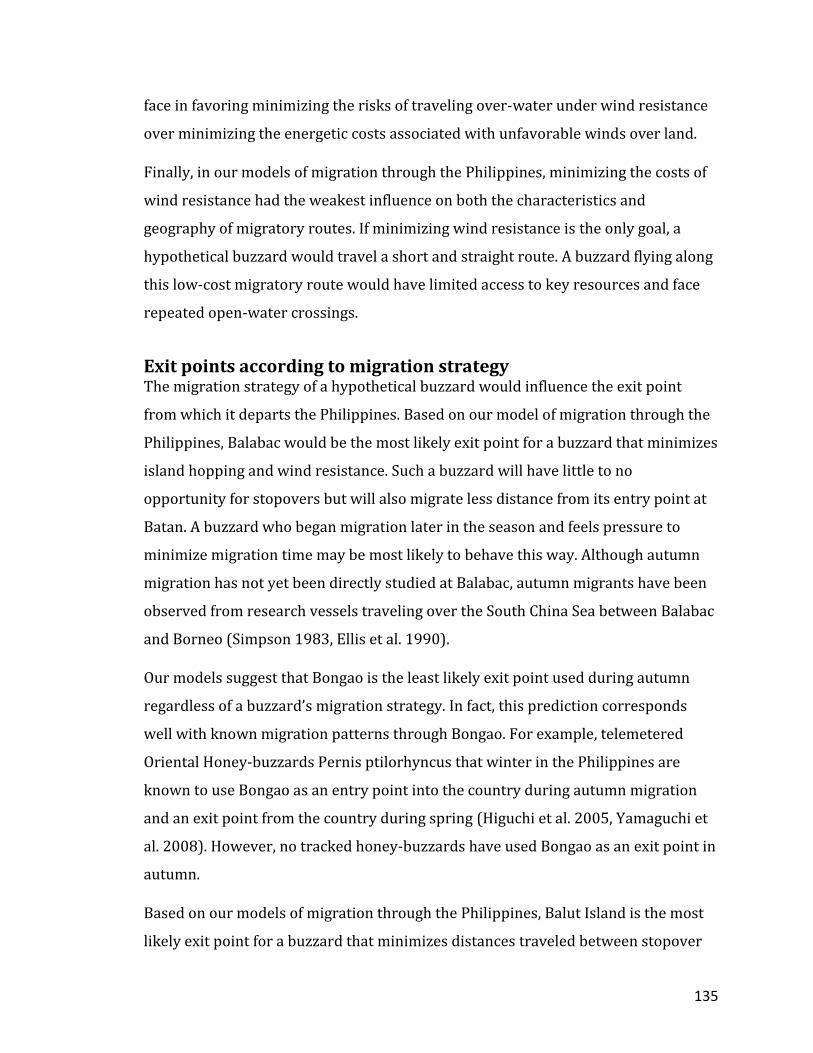
135
face in favoring minimizing the risks of traveling over-water under wind resistance
over minimizing the energetic costs associated with unfavorable winds over land.
Finally, in our models of migration through the Philippines, minimizing the costs of
wind resistance had the weakest influence on both the characteristics and
geography of migratory routes. If minimizing wind resistance is the only goal, a
hypothetical buzzard would travel a short and straight route. A buzzard flying along
this low-cost migratory route would have limited access to key resources and face
repeated open-water crossings.
Exit points according to migration strategy The migration strategy of a hypothetical buzzard would influence the exit point
from which it departs the Philippines. Based on our model of migration through the
Philippines, Balabac would be the most likely exit point for a buzzard that minimizes
island hopping and wind resistance. Such a buzzard will have little to no
opportunity for stopovers but will also migrate less distance from its entry point at
Batan. A buzzard who began migration later in the season and feels pressure to
minimize migration time may be most likely to behave this way. Although autumn
migration has not yet been directly studied at Balabac, autumn migrants have been
observed from research vessels traveling over the South China Sea between Balabac
and Borneo (Simpson 1983, Ellis et al. 1990).
Our models suggest that Bongao is the least likely exit point used during autumn
regardless of a buzzard’s migration strategy. In fact, this prediction corresponds
well with known migration patterns through Bongao. For example, telemetered
Oriental Honey-buzzards Pernis ptilorhyncus that winter in the Philippines are
known to use Bongao as an entry point into the country during autumn migration
and an exit point from the country during spring (Higuchi et al. 2005, Yamaguchi et
al. 2008). However, no tracked honey-buzzards have used Bongao as an exit point in
autumn.
Based on our models of migration through the Philippines, Balut Island is the most
likely exit point for a buzzard that minimizes distances traveled between stopover

136
sites and minimizes wind resistance. Such a buzzard would maximize opportunities
for stopovers along a western route where wind resistance is less prevalent. A
buzzard aiming to save energy in migration might behave this way as the wind
conditions of a western route may facilitate migration. Autumn migration has not
yet been directly studied at Balut Island although raptor migrants have been
monitored about 20 km northwest of Balut Island (Tiongco et al. 2014) and in
Sulawesi, Indonesia, almost 200 km south (Germi et al. 2009).
Finally, Cape San Agustin is the most likely exit point for a buzzard that minimizes
distances traveled between stopover sites, minimizes wind resistance, and
minimizes over-water crossings. Such a buzzard will maximize opportunities for
stopovers along an eastern route where there are few over-water crossings between
islands despite great wind resistance over land. A buzzard aiming to minimize risks
from over-water travel might behave this way. There is evidence that this strategy is
used and raptor migrants have been directly observed initiating autumn ocean
crossings from Cape San Agustin, heading towards the direction of Sulawesi-Talaud
(Indonesia) (Concepcion et al. 2017).
Optimal migration strategy Field data supported our models better when routes were evaluated according to
the exit point than when evaluated according to costs of movement. Although the
rate of correspondence between these field data and modeled data was not strong,
this is not unexpected given the nature of the field data available (there are no
systematic studies of this problem and only a few anecdotal observations are
reported in literature). Our modeled routes are similar to migration routes for a
similarly sized Accipiter using the same flyway. Nevertheless, the two exit points
that our models predict would be most used (Balut Island and Cape San Agustin)
had the best correspondence to the validation data and are likely the most used
routes by migrating raptors.
Examining specific migratory responses to each external factor allowed us to
identify possible optimal migration strategies for Grey-faced Buzzards when

137
navigating oceanic flyways through archipelagos. Our models suggest that the
optimal migratory strategy for these birds is to find the shortest route to an exit
point with the greatest possible access to stopover habitats and fewest open-water
crossings under wind resistance. Therefore, an optimally migrating bird might not
necessarily use the straightest and shortest routes (i.e., the modeled routes
produced using only the cost of wind direction). In fact, these straightest and
shortest routes seem unlikely pathways for experienced migrants. If experienced
buzzards indeed maximize refueling opportunities at stopovers and minimize risks
through fewer over-water crossings under wind resistance, they may generally be
energy-minimizers during autumn migration across the Philippines. This hypothesis
could be tested in two ways, one by evaluating if older, more experienced migrants
indeed choose these routes, or two, by using telemetry to evaluate if birds conform
more consistently with these modeled predictions as they gain experience.
Optimal migration strategies may vary by season. For example, if island crossings
and wind conditions have a strong influence on spring migratory routes, Grey-faced
Buzzards may be energy-minimizers during that season as well. In fact, the
distribution of favorable winds are drastically different between seasons (Wyrtki
and Meyers 1975) and during spring, strong resistance from southward winds
would intensify energetic and safety costs of crossing from Indonesian islands to the
Philippines. To minimize energy expenditure and risk, migrants would have to avoid
the Philippines during spring and fly northward following the East-Asian
Continental Flyway. In fact, this is the strategy that Oriental Honey-buzzards use
(Yamaguchi et al. 2011, Nourani et al. 2016). Using this route greatly reduces over-
water travel and allows migrants to benefit from wind support and convective
conditions over land. In contrast, Grey-faced Buzzards may be time minimizers
during spring and return along the same route they traveled southbound. By doing
this, the birds would expend energy compensating for southward winds but would
save migration time by avoiding a huge detour around the South China Sea.
Tracking data of birds captured in Japan and migrating within Japanese islands
indicates autumn and spring routes remain similar, although stopover sites used

138
were different (Shiu et al. 2006), suggesting that birds select for time minimization.
Migration monitoring at the Indonesia island of Sangihe are similarly supportive of a
time minimization hypothesis, revealing migrants regularly traveling over-water
under heavy opposing winds in spring (Germi et al. 2009). Likewise, spring
migration counts conducted in the northern coast of Luzon also support this concept
of time minimization via reverse migration (Wild Bird Club of the Philippines 2015),
although less strongly than would tracking data from the Philippines.
Raptor migration on oceanic flyways in general, through the Philippines in
particular, remains poorly understood. Our models of migration through the
Philippines were derived from somewhat limited existing natural history
information. Although relatively low in complexity, they allow us to better
understand the potential trade-offs between the costs and consequences of
migratory responses to landscape and weather conditions along an oceanic flyway.
They also serve as an important foundation by producing specific and testable
hypotheses about the evolution of this behavior in general and, specifically to the
Philippines, locations of potentially good count sites, about potential migration
tracks of these birds, and about the distribution of exit points birds may use as they
migrate across the Philippines.
ACKNOWLEDGEMENTS This study was funded by the Project Soar Award of Hawk Mountain Sanctuary
(USA) and The Sperry Fund Scholars in Raptor Conservation Science. We thank the
Wild Bird Club of the Philippines for granting us permission to use bird records
contributed by the following individuals and organizations: Adrian Constantino,
Alex Tiongco, Amado Bajarias, Andy Mears, Arne Jensen, Bird Quest, Birdtour Asia,
Carmela Balcazar, Cebu Biodiversity Conservation Foundation, Cristina Cinco, Des
Cambaliza, Desmond Allen, Eric Barnes, Felix Servita, Fergus Crystal, HARIBON
Foundation, Philippines, Herman Nuytemans, Ipat Luna, Ivan Sarenas, James
McCarthy, Jasmin Meren, Jayce Japlit, Jelaine Gan, John Mark de Leon, Jon Villasper,
Karen Ochavo, Kitty Arce, Leny Ledesma, Lisa Marie Paguntalan, Marc Ameels,
Marites Cervero, Mark Villa, Mark Wallbank, Mike Lu, Ned Livag, Nicky Icarangal,

139
Nikki Dyanne Realubit, Paul Bourdin, Pete Simpson, Peter Stevens, Randy Weisser,
Richard Ruiz, Sylvain Wamelink, Sylvia Ramos, Tim Fisher, Todd Pepper, Trinket
Canlas, Vincent Lao, and Yannie Valmero. We also thank Brenden McNeil for
suggestions on our modeling approach and Jinghong Lee for insights on Grey-faced
Buzzard movements across the Philippines. Reviews by Petra Wood, Jim Anderson
and Brenden McNeil improved the quality of the manuscript. This is Scientific
Article No. yyyy of the West Virginia Agricultural and Forestry Experiment Station,
Morgantown and Conservation Science Contribution number xxx from Hawk
Mountain Sanctuary. Any use of trade, product, or firm names is for descriptive
purposes only and does not imply endorsement by the U.S. Government.
REFERENCES Agostini, N. 2004. Additional observations of age-dependent migration behaviour in
Western Honey Buzzards Pernis apivorus. J. Avian Biol. 35:469–470.
Alerstam, T. 1979. Wind as selective agent in bird migration. Ornis Scand. 10:76–93.
Alerstam, T. 2011. Optimal bird migration revisited. J. Ornithol. 152:5–23.
Alerstam, T., & A. Hedenström. 1998. The development of bird migration theory. J. Avian Biol. 29:343–369.
Alerstam, T., A. Hedenström, & S. Åkesson. 2003. Long-distance migration: evolution and determinants. Oikos 103:247–260.
Berthold, P., A. J. Helbig, G. Mohr, & U. Querner. 1992. Rapid microevolution of migratory behaviour in a wild bird species. Nature 2:173–179.
Beyer, H. L. 2012. Geospatial modelling environment (Version 0.7.3.3). http://www.spatialecology.com/gme.
Bildstein, K. L. 2006. Migrating raptors of the world: Their ecology and conservation. Cornell University Press, Ithaca, New York.
Bildstein, K. L., M. J. Bechard, C. Farmer, & L. Newcomb. 2009. Narrow sea crossings present major obstacles to migrating Griffon Vultures Gyps fulvus. Ibis 151:382–391.
Catibog-Sinha, C., & L. R. Heaney. 2006. Philippine biodiversity: Principles and

140
practice. Haribon Foundation for the Conservation of Natural Resources, Inc., Quezon City.
Chang, C. P., P. A. Harr, J. McBride, & H.-H. Hsu. 2004. The Maritime Continent monsoon. Pages 107–150 in C. P. Chang, editor. East Asian monsoon. World Scientific Publishing, Hackensack, New Jersey.
Collischonn, W., & J. V. Pilar. 2000. A direction dependent least-cost-path algorithm for roads and canals. Int. J. Geogr. Inf. Sci. 14:397–406.
Concepcion, C. B., P. T. Dumandan, M. R. Silvosa, K. L. Bildstein, & T. E. Katzner. 2017. Species composition, timing and meteorological correlates of autumn open-water crossings by raptors migrating along the East-Asian Oceanic Flyway. J. Raptor Res. 51: 25-37.
Crysler, Z. J., R. A. Ronconi, & P. D. Taylor. 2016. Differential fall migratory routes of adult and juvenile Ipswich Sparrows (Passerculus sandwichensis princeps). Mov. Ecol. 4:3.
Dale, C. A., & M. L. Leonard. 2011. Reproductive consequences of migration decisions by Ipswich Sparrows (Passerculus sandwichensis princeps). Can. J. Zool. 89:100–108.
Douglas, D. H. 1994. Least-cost path in GIS using an accumulated cost surface and slopelines. Cartographica 31:37–51.
Duerr, A. E., T. a. Miller, M. Lanzone, D. Brandes, J. Cooper, K. O’Malley, C. Maisonneuve, J. Tremblay, & T. Katzner. 2012. Testing an emerging paradigm in migration ecology shows surprising differences in efficiency between flight modes. PLoS One 7:e35548.
Eastman, J. R. 1989. Pushbroom algorithms for calculating distances in raster grids. Pages 288–297 in E. Anderson, editor. Proceedings of the 9th International Symposium on Computer Assisted Cartography, Autocarto 9. Baltimore, MD.
eBird. 2012. eBird Basic Dataset. Version: EBD_relNov-2015. Nov 2015. Cornell Lab of Ornithology, Ithaca, New York.
Ellis, D. H., A. K. Kepler, & C. B. Kepler. 1990. Evidence for a fall raptor migration pathway across the South China Sea. J. Raptor Res. 24:12–18.
Ellis, E. C., K. Klein Goldewijk, S. Siebert, D. Lightman, & N. Ramankutty. 2010. Anthropogenic transformation of the biomes, 1700 to 2000. Glob. Ecol. Biogeogr. 19:589–606.

141
ESRI. 2014. ArcGIS Desktop: Release 10.2.2. Environmental Systems Research Institute, Redlands, CA.
Etherington, T. R., & E. P. Holland. 2013. Least-cost path length versus accumulated-cost as connectivity measures. Landsc. Ecol. 28:1223–1229.
Fagan, W. F., M. A. Lewis, M. Auger-Méthé, T. Avgar, S. Benhamou, G. Breed, L. Ladage, U. E. Schlägel, W. W. Tang, Y. P. Papastamatiou, J. Forester, & T. Mueller. 2013. Spatial memory and animal movement. Ecol. Lett. 16:1316–1329.
Ferguson-Lees, J., & D. A. Christie. 2001. Raptors of the world. Houghton Mifflin Company, New York.
GADM. 2011. Global Administrative Areas: Philippines. http://www.gadm.org/gadmcountry.
Gamauf, A., M. Preleuthner, & H. Winkler. 1998. Philippine birds of prey: Interrelations among habitat, morphology, and behavior. Auk 75:713–726.
Germi, F., G. S. Young, A. Salim, W. Pangimangen, & M. Schellekens. 2009. Over-ocean raptor migration in a monsoon regime: spring and autumn 2007 on Sangihe, North Sulawesi, Indonesia. Forktail 25:104–116.
Gill, R. E., T. L. Tibbitts, D. C. Douglas, C. M. Handel, D. M. Mulcahy, J. C. Gottschalck, N. Warnock, B. J. McCaffery, P. F. Battley, & T. Piersma. 2009. Extreme endurance flights by landbirds crossing the Pacific Ocean: ecological corridor rather than barrier? Proc. R. Soc. B Biol. Sci. 276:447–57.
GLC. 2003. Global Land Cover 2000 database. http://www.gvm.jrc.it/glc2000.
González-Solís, J., A. Felicísimo, J. W. Fox, V. Afanasyev, Y. Kolbeinsson, & J. Muñoz. 2009. Influence of sea surface winds on shearwater migration detours. Mar. Ecol. Prog. Ser. 391:221–230.
Gschweng, M., E. K. V. Kalko, U. Querner, W. Fiedler, & P. Berthold. 2008. All across Africa: highly individual migration routes of Eleonora’s Falcon. Proc. R. Soc. B-Biological Sci. 275:2887–2896.
Hake, M., N. Kjellen, & T. Alerstam. 2003. Age-dependent migration strategy in Honey Buzzards Pernis apivorus tracked by satellite. Oikos 103:385–396.
Harel, R., N. Horvitz, & R. Nathan. 2016. Adult vultures outperform juveniles in challenging thermal soaring conditions. Sci. Rep. 6:27865.

142
Hedenström, A., & T. Alerstam. 1997. Optimum fuel loads in migratory birds: Distinguishing between time and energy minimization. J. Theor. Biol. 189:227–234.
Henningsson, S. S., & T. Alerstam. 2005. Barriers and distances as determinants for the evolution of bird migration links: the arctic shorebird system. Proc. R. Soc. B 272:2251–2258.
Higuchi, H., H. Shiu, H. Nakamura, A. Uematsu, & K. Kuno. 2005. Migration of Honey-buzzards Pernis apivorus based on satellite tracking. Ornithol. Sci. 4:109–115.
Hutto, R. L. 1985. Habitat selection by nonbreeding, migratory land birds. Pages 455–476 in M. L. Cody, editor. Habitat Selection in Birds. Academic Press, Inc., Orlando, Florida.
Kadowaki, S., T. Murayama, & Y. Kojima. 2007. Differences in utilization of cultivated and uncultivated paddy fields as hunting grounds by the Grey-faced Buzzard-eagle, Butastur indicus. J. Yamashina Institue Ornithol. 39:19–26.
Kawakami, K., & H. Higuchi. 2003. Population trend estimation of three threatened bird species in Japanese rural forests: the Japanese Night-Heron Gorsachius goisagi, Goshawk Accipiter gentilis and Grey-faced Buzzard Butastur indicus. J. Yamashina Inst. Ornithol. 35:19–29.
Kerlinger, P. 1989. Flight strategies of migrating hawks. University of Chicago Press.
Klaassen, R. H. G., M. Hake, R. Strandberg, B. J. Koks, K. M. Exo, F. Bairlein, T. Alerstam, C. Trierweiler, K. M. Exo, F. Bairlein, & T. Alerstam. 2014. When and where does mortality occur in migratory birds? Direct evidence from long-term satellite tracking of raptors. J. Anim. Ecol. 83:176–184.
La Sorte, F. A., D. Fink, W. M. Hochachka, & S. Kelling. 2016. Convergence of broad-scale migration strategies in terrestrial birds. Proc. R. Soc. B 283: 20152588.
Liechti, F. 2006. Birds: Blowin’ by the wind? J. Ornithol. 147:202–211.
Liechti, F., & B. Bruderer. 1998. The relevance of wind for optimal migration theory. J. Avian Biol. 29:561–568.
Lin, W. H., & L. L. Severinghaus. 1998. Raptor migration and conservation in Taiwan. Pages 631–639 in R. D. Chancellor, B.-U. Meyburg, and J. J. Ferrero, editors. Holarctic birds of prey. ADENEX and World Working Group of Birds of

143
Prey, Merida, Spain.
López-López, P., R. Limiñana, U. Mellone, & V. Urios. 2010. From the Mediterranean Sea to Madagascar: Are there ecological barriers for the long-distance migrant Eleonora’s Falcon? Landsc. Ecol. 25:803–813.
Mandel, J. T., K. L. Bildstein, G. Bohrer, & D. W. Winkler. 2008. Movement ecology of migration in Turkey Vultures. Proc. Natl. Acad. Sci. U. S. A. 105:19102–19107.
Matsuura, T., M. Yokohair, & A. Azuma. 2005. Identification of potential habitats of Gray-faced Buzzard in Yatsu landscapes by using digital elevation model and digitized vegetation data. Landsc. Urban Plan. 70:231–243.
McClure, H. E. 1974. Migration and survival of the birds of Asia. U.S. Army Medical Component, SEATO Medical Project, Bangkok, Thailand.
McClure, H. E. 1998. Migration and survival of the birds of Asia. Revised Ed. White Lotus Press, Bangkok, Thailand.
Mellone, U., R. Limiñana, E. Mallia, & V. Urios. 2011. Extremely detoured migration in an inexperienced bird: interplay of transport costs and social interactions. J. Avian Biol. 42:468–472.
Meyer, S. K., R. Spaar, & B. Bruderer. 2000. To cross the sea or to follow the coast? Flight directions and behaviour of migrating raptors approaching the Mediterranean Sea in autumn. Behaviour 137:379–399.
Meyer, S. K., R. Spaar, & B. Bruderer. 2003. Sea crossing behaviour of falcons and harriers at the southern Mediterranean coast of Spain. Avian Sci. 3:153–162.
Momose, H., M. Ueta, N. Fujiwara, T. Uchiyama, T. Ishizaka, K. Morisaki, & M. Matsue. 2005. Factors affecting the number of breeding Grey-faced Buzzard-eagles Butastur indicus. J. Japanese Inst. Landsc. Archit. 68:555–558.
Nemenyi, P. 1969. Variances: An elementary proof and a nearly distribution-free test. Am. Stat. 23:35–37.
Newton, I. 1998. Population limitation in birds. Academic Press, Inc., London.
Newton, I. 2004. Population limitation in migrants. Ibis 146:197–226.
Newton, I. 2006. Can conditions experienced during migration limit the population levels of birds? J. Ornithol. 147:146–166.
Norris, D. R., & P. P. Marra. 2007. Seasonal interactions, habitat quality, and

144
population dynamics in migratory birds. Condor 109:535–547.
Norris, D. R., P. P. Marra, T. K. Kyser, T. W. Sherry, & L. M. Ratcliffe. 2004. Tropical winter habitat limits reproductive success on the temperate breeding grounds in a migratory bird. Proc. Biol. Sci. 271:59–64.
Nourani, E., N. M. Yamaguchi, A. Manda, & H. Higuchi. 2016. Wind conditions facilitate the seasonal water-crossing behaviour of Oriental Honey-buzzards Pernis ptilorhynchus over the East China Sea. Ibis 158:506–518.
Oppel, S., V. Dobrev, V. Arkumarev, V. Saravia, A. Bounas, E. Kret, M. Velevski, S. Stoychev, & S. C. Nikolov. 2015. High juvenile mortality during migration in a declining population of a long-distance migratory raptor. Ibis 157:545–557.
Panuccio, M., C. Barboutis, G. Chiantante, A. Evangelidis, & N. Agostini. 2016. Pushed by increasing air temperature and tailwind speed: Weather selectivity of raptors migrating across the Aegean Sea. Ornis Fenn. 93:159–171.
PIDS. 2005. Basics on Philippine climatology. Econ. Issue Day 5.
R Development Core Team. 2013. R: A language and environment for statistical computing. R Foundation for Statistical Computing, Vienna, Austria. http://www.r-project.org.
Ramage, C. S. 1968. Role of a tropical “Maritime Continent” in the atmospheric circulation 1. Mon. Weather Rev. 96:365–370.
Runge, M. C., & P. P. Marra. 2005. Modeling seasonal interactions in the population dynamics of migratory birds. Pages 375–390 in R. Greenberg and P. P. Marra, editors. Birds of two worlds: The ecology and evolution of migration. John Hopkins University Pressu, Baltimore, MD.
Saha, K. 2010. Tropical circulation systems and monsoons. Springer-Verlag, Berlin.
Sakai, S., N. Yamaguchi, H. Momose, & H. Higuchi. 2011. Seasonal shifts in foraging site and prey of Grey-faced Buzzards (Butastur indicus) breeding in Satoyama habitat of Central Japan. Ornithol. Sci. 10:51–60.
Shiu, H.-J., K. Tokita, E. Morishita, E. Hiraoka, Y. Wu, H. Nakamura, & H. Higuchi. 2006. Route and site fidelity of two migratory raptors: Grey-faced Buzzards Butastur indicus and Honey-buzzards Pernis apivorus. Ornithol. Sci. 5:151–156.
Sillett, T. S., & R. T. Holmes. 2002. Variation in survivorship of a migratory songbird throughout its annual cycle. J. Anim. Ecol. 71:296–308.

145
Sillett, T. S., R. T. Holmes, & T. W. Sherry. 2000. Impacts of a global climate cycle on population dynamics of a migratory songbird. Science 288:2040–2042.
Simpson, D. M. 1983. Autumn migration of landbirds off North Borneo in 1981. Sea Swallow 32:48–53.
Stackhouse Jr., P. W. 2013. NASA: Surface meteorology and solar energy (release 6.0). https://eosweb.larc.nasa.gov/sse/.
Sutherland, W. J. 1998. Evidence for flexibility and constraint in migration systems. J. Avian Biol. 29:441–446.
Thorup, K., T. Alerstam, M. Hake, & N. Kjellén. 2003. Bird orientation: compensation for wind drift in migrating raptors is age dependent. Proc. Biol. Sci. 270:S8-11.
Tiongco, A., M. T. A. Cervero, A. M. Constantino, & M. K. C. Constantino. 2014. Project Southern Crossing 2014: First observations of autumn raptor migration at Sarangani, Mindanao, Philippines. BirdingASIA 24:96–103.
Tucker, V. A. 1975. The energetic cost of moving about. Am. Sci. 63:413–419.
Ueta, M., R. Kurosawa, & H. Matsuno. 2006a. Habitat loss and the decline of Grey-faced Buzzards (Butastur indicus) in Tokyo, Japan. J. Raptor Res. 40:52–56.
Vardanis, Y., R. H. G. Klaassen, R. Strandberg, & T. Alerstam. 2011. Individuality in bird migration: routes and timing. Biol. Lett. 7:502–5.
Weimerskirch, H., T. Guionnet, J. Martin, S. A. Shaffer, & D. P. Costa. 2000. Fast and fuel efficient? Optimal use of wind by flying albatrosses. Proc. R. Soc. London Ser. B Biol. Sci. 267:1869–1874.
Wild Bird Club of the Philippines. 2015. Bird records, 2003-2013. http://birdwatch.ph/html/record/record.html.
Wu, Y., G. Fujita, & H. Higuchi. 2006. What landscape elements are correlated with the distribution of wintering Grey-faced Buzzards Butastur indicus in the Sakishima Islands, southwestern Japan? Ornithol. Sci. 5:157–163.
Wyrtki, K., & G. Meyers. 1975. The trade winds over the Pacific Ocean. J. Appl. Meteorol. 15:698–704.
Yamaguchi, N. M., Y. Arisawa, Y. Shimada, & H. Higuchi. 2011. Real-time weather analysis reveals the adaptability of direct sea-crossing by raptors. J. Ethol. 30:1–10.

146
Yamaguchi, N., K.-I. Tokita, A. Uematsu, K. Kuno, M. Saeki, E. Hiraoka, K. Uchida, M. Hotta, F. Nakayama, M. Takahashi, H. Nakamura, & H. Higuchi. 2008. The large-scale detoured migration route and the shifting pattern of migration in Oriental Honey-buzzards breeding in Japan. J. Zool. 276:54–62.

147
Table 1. Characteristics of 20 modeled Grey-faced Buzzard autumn migratory routes leading to four logical exit points in the south of the Philippines. These routes were modeled using 5 different cost raster datasets as follows: Stopover distances only; Wind costs only; Stopover distances * Wind costs; Wind costs * Over-water costs; and Wind costs * Over-water costs * Stopover distances. See text for additional details.

148
Length (km)
Number of
potential stopovers
Average distance between
stopovers
Proportion of route
over water, %
Wind direction, Proportion of route, % Movement
cost (unitless)
Tail-wind
Crossing tailwind
Crossing headwind
Stopover distances Balabac 1,923 158 90.17 25 1 58 41 36,615,570 Bongao 2,527 239 90.17 29 15 50 35 49,192,170 Balut 2,408 270 39.90 21 0 64 36 33,832,480 Cape San Agustin 2,536 282 42.19 20 0 58 42 34,255,860
Wind costs
Balabac 1,582 0 — 99 0 93 7 1,730 Bongao 1,798 1 898.95 83 28 38 34 1,945 Balut 1,810 15 279.65 74 0 52 48 2,043 Cape San Agustin 1,750 3 437.45 77 0 47 53 1,988
Stopover distances * Wind costs
Balabac 1,923 154 41.68 25 1 58 41 39,960 Bongao 2,527 243 87.32 29 15 50 35 52,390 Balut 2,410 270 39.90 21 0 63 37 37,056 Cape San Agustin 2,535 283 42.06 20 0 58 42 37,544
Wind costs * Over-water costs
Balabac 1,662 13 191.75 22 0 58 42 477,518 Bongao 2,419 17 152.59 22 15 47 38 478,997 Balut 1,981 24 163.75 13 0 43 57 428,461 Cape San Agustin 1,900 18 198.87 13 0 40 60 412,047

149
Length (km)
Number of
potential stopovers
Average distance between
stopovers
Proportion of route
over water, %
Wind direction, Proportion of route, %
Movement cost
(unitless) Tail-wind
Crossing tailwind
Crossing headwind
Wind costs * Over-water costs * Stopover distances Balabac 2,011 158 47.08 18 1 56 43 28,870,950 Bongao 2,970 223 91.82 17 13 48 39 27,677,460 Balut 2,506 223 50.89 11 0 42 58 25,996,470 Cape San Agustin 2,335 211 43.51 11 0 39 61 25,888,830

150
Table 2. Means and standard deviations (SD) of distance from modeled routes to 29 observations of Grey-faced Buzzards during migration season and to 87 random points. Also shown are results of Mann Whitney U tests to compare distances of observation points and of random points to each of the 20 modeled migratory routes using 5 different cost raster datasets as described in Table 1. Significant p-values are bold.
Observation
points Random points Mann Whitney
U
Mean SD Mean SD W p Stopover distances Balabac 213 304 198 248 1,189 0.6462 Bongao 108 123 104 104 1,202 0.7068 Balut 72 93 105 119 1,013 0.1138 Cape San Agustin 61 94 98 117 921 0.0302
Wind costs Balabac 387 291 376 244 1,337 0.6325 Bongao 213 218 202 190 1,275 0.9339 Balut 195 107 226 118 1,031 0.1425 Cape San Agustin 172 125 219 129 982 0.0753
Stopover distances * Wind costs Balabac 213 304 198 248 1,189 0.6462 Bongao 108 123 104 104 1,202 0.7068 Balut 72 93 105 119 1,013 0.1138 Cape San Agustin 61 94 98 117 921 0.0302
Wind costs * Over-water costs Balabac 219 304 209 249 1,189 0.6462 Bongao 97 98 93 92 1,276 0.9289 Balut 77 113 110 144 1,001 0.0974 Cape San Agustin 77 112 112 147 981 0.0742
Wind costs * Over-water costs * Stopover distances Balabac 200 252 198 250 1,163 0.5321 Bongao 86 102 76 88 1,239 0.8884 Balut 65 109 98 140 956 0.0518 Cape San Agustin 66 108 103 148 955 0.0511

151
Figure 1. Geographic locations of migratory entry () and exit points () in the Philippines. The Philippine archipelago is divided into three island groups: Luzon in the north, Visayas in the middle, and Mindanao in the south. The entry point of

152
Batan is 180 km south of Taiwan and 280 km north of mainland Luzon. The exit point of Balabac is 70 km north of Borneo, while Bongao is 60 km east of Borneo. Balut Island is 180 km north of Indonesia, while Cape San Agustin is 200 km north. Also shown are four potential migration funnels (shaded gray) that were identified based on modeled Grey-faced Buzzard migratory routes. (A) At eastern and central Luzon, a bottleneck passes along the Sierra Madre Mountains, the longest mountain range in the country. (B) An unavoidable 70 km over-water crossing exists between the islands of Mindoro and Palawan. (C) A bottleneck between the islands of Negros and Zamboanga del Norte includes a 50 km over-water crossing. (D) An unavoidable 20 km over-water crossing exists between the island of Leyte and Surigao on Mindanao Island.

153
Figure 2. Migratory routes of hypothetical Grey-faced Buzzards migrating through the Philippines modeled using 5 different cost of movement datasets and exiting the country at Balut Island (because of space considerations, modeled routes to four other exit points are shown in the SI). Modeled routes demonstrate trade-offs between response to external factors and were modeled using (A) costs of moving between stopover sites only (2,408 km); (B) cost of wind direction only (1,810 km); (C) combined costs of stopover distances and wind direction (2,410 km); (D) combined costs of wind direction and over-water travel (1,981 km); and (E) combined costs of distances between stopover sites, costs of wind direction and over-water travel (2,506 km).

154
Figure 3. Least costly (in terms of movement costs) migratory route alternatives based on different migration strategies of hypothetical Grey-faced Buzzards. Migration strategies considered (A) stopover distances only; (B) wind costs only; (C) stopover distances * wind costs; (D) wind costs * over-water costs; and (E) wind costs * over-water costs * stopover distances. Also shown is the distribution of observation points ( ) of Grey-faced Buzzards during migration. Observation points (n=29) were compiled from published, citizen-science and personal data and illustrate how modeled routes correspond to observed buzzard behavior.

155
Figure 4. Difference in distances of observations of Grey-faced Buzzards and random points to modeled routes grouped according to exit point. There are 5 modeled routes for each exit point. When observation points are closer on average to the routes, the difference is positive. When observation points are farther on average to the routes, the difference is negative.

156
Table A1. Land cover classifications according to the Global Land Cover (GLC) 2000 dataset (GLC 2003).
Cell value Description
0 Sea
1 Tree cover, broadleaved, evergreen, closed and closed to open
2 Mosaic: Tree cover / Other natural vegetation or cropland (including very degraded and open tree cover)
3 Tree cover, broadleaved, deciduous, mainly open (including dry Dipterocarpus)
4 Tree cover, regularly flooded; Mangrove
5 Tree cover, regularly flooded; Swamp
6 Mosaics and shrub cover, shrub component dominant, mainly evergreen
7 Mosaics and shrub cover, shrub component dominant, mainly deciduous
8 Shrub cover, mainly deciduous (Dry or burnt)
9 Mosaic of cropland / Other natural vegetation (Shifting cultivation in mountains)
10 Herbaceous cover (including alpine grassland)
12 Cultivated and managed, non-irrigated (mixed)
13 Cultivated and managed, irrigated (flooded, rice, shrimp farms)
15 Snow and ice
16 Artificial surfaces
17 Water bodies
18 No data
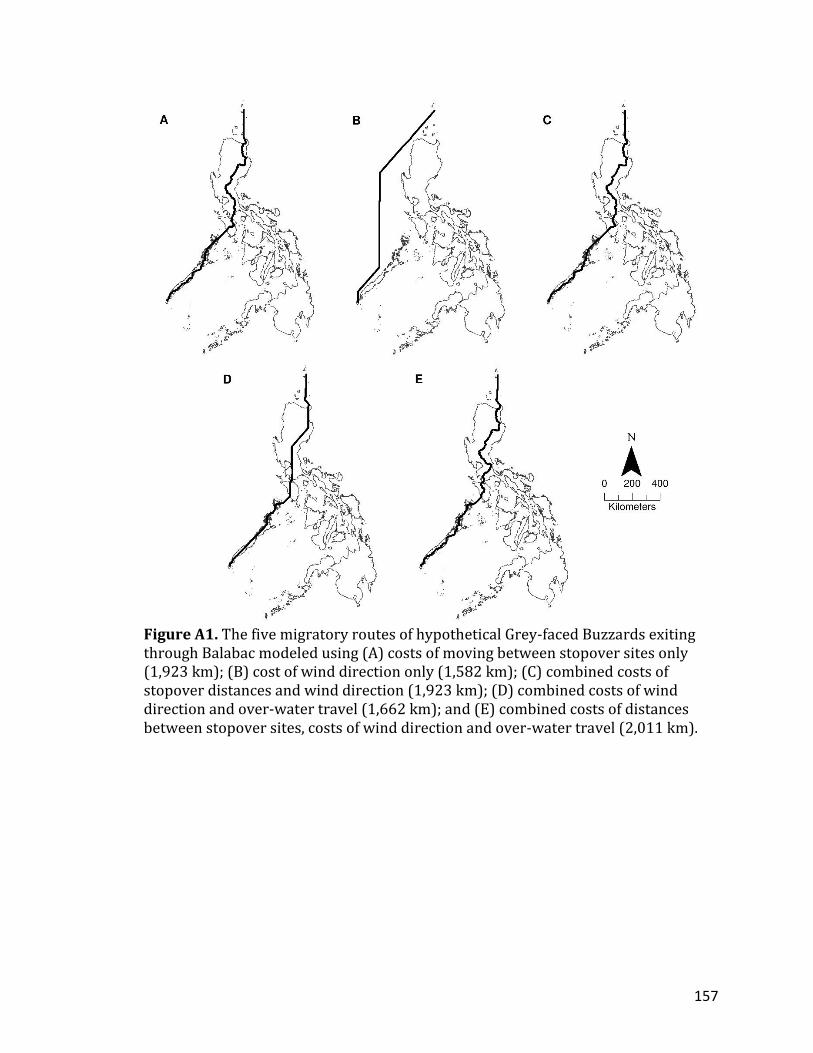
157
Figure A1. The five migratory routes of hypothetical Grey-faced Buzzards exiting through Balabac modeled using (A) costs of moving between stopover sites only (1,923 km); (B) cost of wind direction only (1,582 km); (C) combined costs of stopover distances and wind direction (1,923 km); (D) combined costs of wind direction and over-water travel (1,662 km); and (E) combined costs of distances between stopover sites, costs of wind direction and over-water travel (2,011 km).
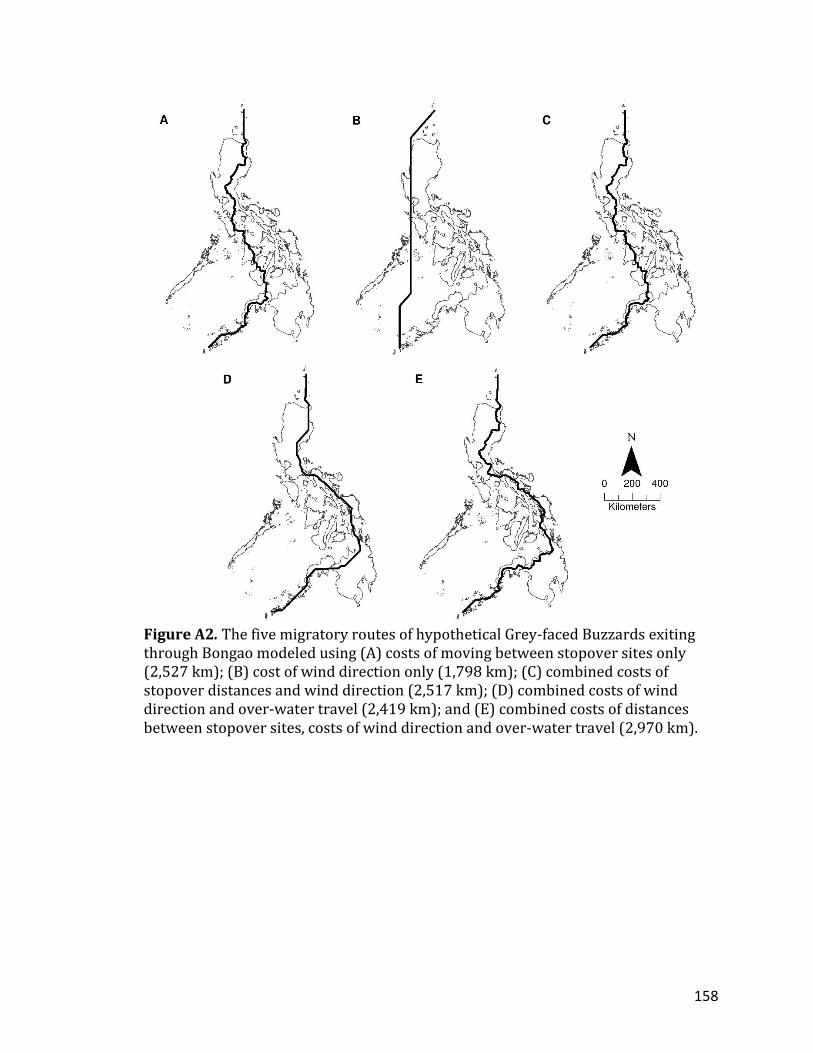
158
Figure A2. The five migratory routes of hypothetical Grey-faced Buzzards exiting through Bongao modeled using (A) costs of moving between stopover sites only (2,527 km); (B) cost of wind direction only (1,798 km); (C) combined costs of stopover distances and wind direction (2,517 km); (D) combined costs of wind direction and over-water travel (2,419 km); and (E) combined costs of distances between stopover sites, costs of wind direction and over-water travel (2,970 km).

159
Figure A3. The five migratory routes of hypothetical Grey-faced Buzzards exiting through Cape San Agustin modeled using (A) costs of moving between stopover sites only (2,536 km); (B) cost of wind direction only (1,750 km); (C) combined costs of stopover distances and wind direction (2,535 km); (D) combined costs of wind direction and over-water travel (1,900 km); and (E) combined costs of distances between stopover sites, costs of wind direction and over-water travel (2,355 km).