moussa thesis
DESCRIPTION
xxcTRANSCRIPT

Moussa 1
Nanoscience and Nanotechnology Applied to Art Conservation: Improved Oddy Test Using Silver Nanoparticle Sensor
Honors Undergraduate Thesis Submitted to:
The Mellon College of Science Chemistry Honors Committee Mellon College of Science
5000 Forbes Avenue The Carnegie Mellon University
By:
Laura Moussa Department of Chemistry
Spring 2007
Approved by:
Dr. Paul Whitmore, Advisor Art Conservation Research Center

Moussa 2
Acknowledgements
I would like to thank Dr. Paul Whitmore and Dr. Hannah Morris for providing me the
opportunity to work in the Art Conservation Research Center located at the Pittsburgh
Technology Center. I also greatly appreciate the help I received from my mentor Dr. Rui Chen
with her support and help all throughout my project, Dr. Rongchao Jin and Dr. Alexander
Ryabov for their teachings and answering any questions I had, and Joseph Suhan for obtaining
the TEM images. I would also like to thank Karen Stump for her support and guidance through
my years as a student at Carnegie Mellon University and finally the Art Conservation Research
Group for providing such a wonderful work environment. Without the aforementioned people,
this project would not have been possible.

Moussa 3
Abstract
Damage to metal artifacts from the materials used for display and storage cases is of great
concern to art museums. The current technology used, the “three in one” Oddy Test, tests for the
suitability of these construction materials by placing silver, copper, and lead metal coupons in
one container along with the material at 60°C and 100% relative humidity. After a 28-day period
the metal coupons are assessed for any visual changes. There are many shortcomings to this
simple test. It is time consuming, irreproducible, slow, hard to evaluate and most importantly
gives no quantitation. A new way to test for the suitability of these materials using a silver
nanoparticle sensor is described here. Two types of silver nanoparticle shapes, spherical and
triangular, were self-assembled using polyethylenimine (PEI) onto a glass coverslip to produce
two different sensors. The spherical nanoparticle sensor gave a yellow color and when evaluated
for its sensitivity to hydrogen sulfide gas changed colors from yellow to colorless. The
triangular nanoparticle sensor gave a blue color and when evaluated for its sensitivity to
hydrogen sulfide gas changed colors from blue to colorless. Color changes were followed
through UV-Vis spectrophotometry, which showed a decrease in absorption of the initial
characteristic peak after exposure to hydrogen sulfide. Kinetic studies were performed on the
spherical and triangular nanoparticles, and the reaction rates were determined to be first-order
with k = 0.0002 for the triangular nanoparticles and k = 0.0001 for the spherical nanoparticles.
When compared to the Oddy Test, both the spherical and triangular silver nanoparticle sensors
reacted fully by showing the characteristic color change before the 28-day period of the test. The
nanoparticle sensor will allow for high sensitivity, easy evaluation, and quantitative analysis for
corrosive gases that would react with silver.

Moussa 4
Contents
Chapter 1-Introduction 6
1.1 Current Methodology………………………………………………………...………6
1.1.1 Oddy Test ……………………………………………………………….....6
1.1.2 Other Tests……………………………………………………………..…..7
1.2 Principles of Operations……………………………………………………………..8
1.2.1 Color Theory…………………………………………………………..…..8
1.2.2 Reaction with hydrogen sulfide gas………………………………………11
Chapter 2- Sensor Fabrication 14
2.1 Synthesis of Metal Nanoparticles- A colloidal system………………………...……14
2.1.1 Spherical Ag nanoparticles from aqueous solution………………………16
2.1.2 Ag spherical nanoparticle synthesis in organic solvent……………………….…18
2.1.3 Triangular Ag nanoparticles from aqueous solution………………….…19
2.2 Self-Assembly…………………………………………………………………...…20
2.2.1 Silane coupling agents……………………………………………………21
2.2.1.1 Acid Washing Procedure………………………………….……21
2.2.1.2 Monolayers assembly…………………………………………..21
2.2.1.3 Multilayer assembly …………………………………………...22
2.2.1.4 Results and Discussion…………………………………………23
2.2.2 PEI-Coupling……………………………………………………………..25
2.2.2.1 Base Washing Procedure………………………………………25
2.2.2.2 Monolayer………………………………………………………25
2.2.2.3 Multilayer………………………………………………………26

Moussa 5
2.2.2.4 Results & Discussion…………………………………………26
2.3 Summary………………………………………………………………………. …29
Chapter 3-Sensitivity of Nanoparticles to Hydrogen Sulfide 30
3.1 Products and Kinetics……………………………………………………….………33
3.1.1 Verification of products…………………………………………….………33
3.1.2 Kinetic Studies…………………………………………...…………………37
Chapter 4-Performance evaluation of Ag nanoparticle sensors
4.1 Stability………………………………………………………………..……………42
4.1.1 Silane-Coupled Sensors……………………………………………………43
4.1.2 PEI-coupled sensors………………………………………………….…….46
4.1.3 Summary…………………………………………………..………………..53
4.2 Comparison to conventional Oddy Test…………………………………...………..54
Chapter 5- Conclusion and future work 59
References 61

Moussa 6
Chapter 1-Introduction
1.1 Current Methodology
Damage to metal artifacts from the environment is of great concern to art museums.
Everything from the carpeting on the floor to the paint on the wall can possibly produce
corrosive vapors that will destroy these artifacts. For this reason, all materials with which the
artwork may be in contact must be tested.
1.1.1 Oddy Test
Currently, the “three in one” Oddy Test is the method most commonly used in museums
to assess the effects of materials on metal artifacts. Andrew Oddy, Keeper of Conservation at
the British Museum, developed the original Oddy Test in 19731. The original Oddy Test tested
for gases hazardous to copper, silver, and lead using three different set ups for each type of metal
coupon. Each set up enclosed the construction material to be tested along with a coupon of the
metal in a sealed glass vessel. Moistened cotton placed in a small vial would be added to the
vessel to produce 100% relative humidity conditions. The whole set up would then be sealed
and placed in an oven at 60ºC for four weeks. At the end of the time period the metal coupons
are checked for evidence of corrosion based on any observed changes in color, texture, or luster.
With these observations and a comparison to control vessels, the material tested would be
grouped into one of three categories: Permanent use, Temporary use, or Unsuitable use.
To further improve the Oddy Test, the “three in one” Oddy Test2, 3 was introduced and is
the current technology in use. The procedure simplified the original Oddy Test by placing all
three metal coupons in the same container and using a different sealing method to keep the vials
airtight, preventing loss of water vapor or other gasses that might be released (Figure 1).

Moussa 7
Metal Coupons (Silver, Lead, Copper)
Figure 1: Variant Oddy Test Set-Up with all three metal coupons and the material to be tested
Both the original and variant Oddy tests are very easy to use and the set up is not
complicated. The 28-day time period also gives a good indication of what can be expected to
occur to the artifacts from several months to years. However, along with the advantages to this
simple test there are also many shortcomings. One disadvantage is how time consuming and
slow the test is; sometimes museums need answers within a few weeks and cannot wait a month
to find out whether or not a material is suitable. The Oddy Test is also irreproducible and hard to
evaluate; glassware variations and any slight variation in the set up itself can cause different test
results. The main disadvantage is that the Oddy test provides only qualitative information based
on a subjective visual analysis leading to discrepancies in the results.
1.1.2 Other Tests
Material to be tested
Water

Moussa 8
Many other visual and chemical methods to test for corrosive gas emission have been
mentioned in conservation literature, but are not widely used due to their irreproducibility. The
Iodide-Azide Test4 is a spot-test that detects the presence of reducible sulfides in materials.
Measurements of pH are also used to give an idea about acid content of materials5. A
Chromotropic Acid Test tests for the presence of aldehydes (formaldehyde) and the Iodide-
Iodate sensor tests for the presence of volatile acids6. These two tests are known as timesaving
options to the Oddy Test. Many others are also used but they all have disadvantages due to their
limitation in only detecting a specific type corrosive agent.
1.2 Principles of Operations
1.2.1 Color Theory
To improve upon the disadvantages of the current methodology, the use of metal
nanoparticles developed as sensors to detect off-gassing of display materials was explored.
These sensors were compared against current methodology to determine if they had improved
sensitivity, allowed for quantitative analysis and allowed easy visual analysis. The use of metal
nanoparticles, specifically silver nanoparticles, will be explored here in developing a metal-based
nanoparticle sensor that will test for the suitability of materials in art museums. Silver is
tarnished by sulfur containing gases and much research has already been performed behind both
the synthesis and assembly of silver nanoparticles. Metal nanoparticles are extremely interesting
in that they do not show exactly the same characteristics as bulk materials. For one, they show
characteristic color changes depending on the size and shape of the metal nanoparticle7. These
optical properties of nanoparticles offer the prospects for easy, quantitative evaluation, and thus
as a basis for a gas sensor.

Moussa 9
The color of these nanoparticles is determined by the surface plasmon resonance8. The
surface plasmon resonance is the frequency at which conduction electrons are displaced relative
to the nuclei in response to the alternating electric field. The electric field induces a dipole in the
nanoparticle and in effect a unique resonance wavelength is seen. Silver is an example of a
metal that contains plasmon resonances in the visible spectrum. The visible spectrum can
roughly be taken as a sum of blue, green and red. For spherical Ag nanoparticles, they absorb at
~400 nm, which is blue light. Therefore, when one looks at the colloids or a glass slide with Ag
nanoparticles, only the complementary light (Green + Red) is seen by the eye. In the spherical
silver nanoparticle case the color is yellow (Green + R = yellow). Similarly, triangular Ag
nanoparticles mainly absorb in the red, ~700 nm, so Green + Blue = Cyan, which is close to blue.
The Drude model9 of free electrons describes the mechanics of the electrons inside a
metal, which are considered free and independent. It states that the motion of a whole cloud
equals the sum of the motion of the individual electrons, which is most perfect embodiment of
plasmon absorption (Figure 2). The coupling between the electrons is considered as a maximum
with the electrons all acting in phase.
Figure29: The displacement of the conduction electron cloud relative to the nuclei due to the electromagnetic wave.
Electric Field Metal Spheres
Force of electron
Force of electron

Moussa 10
The Mie Theory is the simplest theoretical explanation for predicting the optical
properties of nanoparticles. It is a solution of Maxwell’s equations for the scattering of light by
spherical particles. The Mie theory takes on the assumptions that the material is linear,
homogeneous, and isotropic. In the equation below10:
!
E(") =24# 2
a3$m
32
" ln(10)
$i(")
($r
+ %$m)2
+ $i
2
&
' (
)
* +
Eqn 1: Mie Theory equation
E(λ) is the extinction (viz., sum of absorption and scattering) magnitude, a is the radius of the
metallic nanosphere, εm is the dielectric constant of the medium surrounding the metallic
nanosphere (assumed to be a positive, wavelength independent, real number), λ is the
wavelength of the absorbing radiation, εi is the imaginary portion of the metallic nanosphere’s -
dielectric function, εr is the real portion of the metallic nanosphere’s dielectric function, and χ is
the term that describes the aspect ratio of the polycrystalline domains. For spherical
nanoparticles χ = 2, but χ increases as the aspect ratio of the nanoparticle increases. The surface
plasmon resonance occurs when the denominator of the term in the brackets approaches zero.
When εI is small and εr = -2εm, the long λ absorption by the bulk metal is condensed into a single
surface plasmon band. For nonspherical nanoparticles the wavelength occurs when εr = -χεm.
The different values inserted into equation 1 will change the surface plasmon resonance
frequency; hence, different sizes and shapes should result in different colors. The Mie theory
exhibits a size dependence of the intensity of the surface plasmon band with changes to the
radius of the metallic nanosphere. The radius has an intrinsic effect on the dielectric constant of
the metal, which in effect causes a position and bandwidth shift. The affect of different shapes
Moussa 11
on the surface plasmon band has yet to be fully explained due to its intrinsic complexity.
Thin films of nanoparticles also show optical properties. The dipole-dipole interactions
between neighboring nanoparticles affect the frequency of a central particle and therefore the
Mie theory cannot be used to explain the optical properties. Effective medium theories11 by
Maxwell-Garnett can account for the optical properties of multi-layered or thin film
nanoparticles. The theory equation of the optical effect does not depend on the size or shape of
the nanoparticles but rather the volume of the nanoparticles and the surrounding medium they are
in. The effective medium theory gives an expression of the dielectric constant within a matrix
containing small metallic spheres. However, these assemblies can become very complex
resulting in multiple colors due to strong nanoparticle-to-nanoparticle interaction when they are
close to each other, resulting in additional absorption peak(s).
Metal nanoparticles and assembled layers will have intrinsic color according to the
theories above. Reaction with gases should change these intrinsic optical properties, and perhaps
size and shape, which would alter the color. These color changes should provide sensitive
quantitative measurements of the extent of reaction.
1.2.2 Reaction with hydrogen sulfide gas
Hydrogen sulfide gas is known to tarnish silver, and for this reason it was used to
examine the effects a corrosive gas would have on assembled silver nanoparticle sensors. When
the corrosion of silver nanoparticles takes place in a closed system, the sulfidation mechanism
reaction would be:
2Ag + H2S Ag2S + H2
Eqn 3: Sulfidation mechanism in a closed system

Moussa 12
In the presence of oxygen, the reaction of the sulfidation mechanism is:
2Ag + H2S + ½ O2 Ag2S + H2O
Eqn 4: Sulfidation mechanism in the presence of oxygen
Wool is composed of many amino acids including cystine, which contains one of the
largest sulfur-containing side groups, and was therefore chosen as the construction material in
the Oddy Tests performed. In the protein chain of wool, cystine linked with tyrosine undergoes
free radical processes (Figure 3). An oxidation reaction occurs between the two, which produces
sulfur radicals. In the presences of moisture in the air, the sulfur radicals form sulphenic acid
side groups and thiol side groups. Upon further exposure to atmospheric moisture, the sulphenic
acid side groups leave, resulting in a cysteine side group and aldehyde side group. During this
process hydrogen sulfide is produced.

Moussa 13
Figure 3: Formation of Hydrogen Sulfide by wool under atmospheric moisture12
It is important to note that the sulfidation reaction is also dependent on the amount of
water on the silver surface since the moisture provides the proper medium for the reaction to
occur with silver13. Therefore, at high humidity the reaction is accelerated.
Figure 4: Schematic diagram of atmospheric corrosion process of silver exposed to H2S environments14
Experiments on the kinetics of hydrogen sulfide with triangular and spherical silver nanoparticles
and on their reaction to wool in the Oddy Test will give light to their sensitivities.
Moussa 14
Chapter 2- Sensor Fabrication
2.1 Synthesis of Metal Nanoparticles- A colloidal system
The current focus is on replacing the silver metal coupon with a silver nanoparticle
sensor. A variety of synthesis routes for silver nanoparticles exist to give various shapes, which
may provide differences in reactivity and ease of detecting color changes. Only spherical and
triangular shapes were evaluated in this study.
Two methods exist for the synthesis of metal nanoparticles, a top down and a bottom up
approach. The top down method is a physical method that utilizes thermal evaporation, laser
ablation, or mechanical grounding. The bottom up approach is a chemical method and is the
method of choice in our synthesis. The reaction to produce colloidal silver is a reduction of the
metal salt silver nitrate, AgNO3, using reducing agent sodium borohydride, NaBH4 (eqn 5).
Another form of preparation of nanoparticles is to use a seeded-growth method,15 which involves
using metal seeds that have already been reduced to grow larger particles. This method allows
for better control of particle size, which could affect sensitivity of the nanoparticles. We have
used the sodium borohydride reduction for making the silver nanoparticles in this study.
Ag+ + e- → Ag0
BH4 - e- → ½H2 + ½B2H6
AgNO3 + NaBH4 → Ag0 + ½H2 + ½B2H6 + NaNO3
Eqn(5): The two half reactions for the reduction of Ag+ using sodium borohydride to give the overall equation

Moussa 15
There are two important stages in colloid synthesis of nanoparticles, which are described
by the LaMer diagram16: Nucleation and Growth (Figure 5). These two stages are responsible
for the size of the metal nanoparticles produced. After reduction of the metal salt, nucleation and
growth begin to produce the nanoparticle. Several factors control the size of nanoparticles
during their growth such as the reducing agent, reaction temperature, glassware, etc. To produce
smaller metal nanoparticles a strong reducing agent is utilized, which allows for a larger number
of nuclei and more stabilizing agent to prevent aggregation.
Figure 5: LaMer Diagram where part I is reduction of metal salt part II is nucleation and part III is growth
The main idea in synthesizing metal nanoparticles is to have a reducing agent along with
a stabilizer and a metal salt. In solution phase nanoparticles, the stabilizers are used to prevent
the particles from aggregating. Three types of stabilizers exist: ions, large molecules, and
ligands. The most commonly used ion stabilizer is trisodium citrate, giving citrate ions. Large
molecules are those such as polymers or surfactants and can be natural or synthetic. Natural
large molecules in synthesis include starch or gelatin. Synthetic large molecules include
polyvinylpyrrolidone (PVP), polyvinyl alcohol and copolymers. An example of a surfactant

Moussa 16
stabalizer is sulfonated triphenylphosphine. Ligand stabilizers include alkanethiol, phosphines,
and amines. These systems provide an electrostatic stabilization, preventing aggregation by
charge repulsion, or steric stabilization, preventing close approach of the nanoparticle with bulky
coating layers.
Controlling the shape of the nanoparticles is very important because different shapes
create different colors. Silver metals are face centered cubic structures whose important crystal
planes are shown in the figure 6 below. The shape of the nanocrystal is mostly dependent on the
rate of growth along <100> and that of <111> plane, the two most stable planes. Capping
molecules such as stabilizers play an important role in determining the direction in which growth
of the nanocrystal occurs. For example PVP will have a more distinct effect on the <100> facets
than on <111> facets17 whereas trisodium citrate can promote growth along the <111> facet18.
Therefore, the combination of stabilizers determines the shape of the nanoparticle. Other factors
that control shape include the reaction temperature or the pH of the solution and the types of seed
used if synthesis is followed using the seeded growth method.
Figure 6: Important crystal planes of fcc nanocrystal shaded in red.
2.1.1 Spherical Ag nanoparticles from aqueous solution

Moussa 17
Spherical Ag nanoparticles were synthesized19 using trisodium citrate as a stabilizer and
sodium borohydride as a strong reducing agent. Using a 250 mL 3-neck round bottom flask,
HPLC grade water (47.5 ml) was deoxygenated by bubbling with nitrogen gas for 30 min. Then,
an aqueous solution of trisodium citrate (0.5 mL, 30mM) and an aqueous solution of AgNO3 (1
mL, 5 mM) were added. Freshly prepared NaBH4 (0.5 mL, 50 mM) was quickly added and the
suspension immediately turned a light yellow color. After 30 seconds, an aqueous solution of
PVP (0.5 mL, 5 mg/mL, Mw= 55,000) was added. The suspension changed to a darker yellow
color after reaction had proceeded for another 30 min. Vigorous stirring took place at ~1200
rpm during the entire process. The as-synthesized dispersion of Ag nanoparticles suspension was
characterized by UV-Vis spectrophotometry in transmittance mode. The absorption band at
~388 nm was assigned to the surface plasmon resonance of the Ag nanoparticles20. A high-
resolution transmission electron microscopy (HRTEM) image of the spherical particles was also
taken and revealed the particle size to be 10 ± 4 nm.
a b c
d

Moussa 18
Figure 7: (a) UV-Vis spectrum of (b) synthesized spherical silver nanoparticles and (c) TEM image. Black bar in TEM image is 10 nm. (d) Histogram data of spherical silver nanoparticles, x-axis is size (nm). 2.1.2 Ag spherical nanoparticle synthesis in organic solvent
To make more concentrated Ag nanoparticle suspensions syntheses were performed in
organic solvents21. Stirring occurred at ~1200 rpm into a 300 mL three-neck round bottom flask.
HPLC grade methanol (25 mL) was injected into the flask immersed in an ice bath, in which
nitrogen gas slowly flowed during the synthesis. PVP (1 mL, 66mg/ml, Mw= 55,000) was added
quickly to the solution. The solution mixed for a couple of minutes before AgNO3 solution in
methanol (2mL, 6.8 mg, 20 mM) was added dropwise into the flask. After 10 minutes NaBH4 in
ice-cold methanol (20.2 mg, 2.5 mL) was added. The suspension was allowed to react for about
15 minutes in the dark. The suspension turned from colorless to a dark red/brown. The
suspension was then aged overnight while stirring in the dark. After the reaction was complete
the suspension was centrifuged twice at max speed for 20 minutes to isolate the nanoparticles.
UV-Vis transmittance spectra of the nanoparticle suspension was measured, and the absorption
band at ~408 nm was assigned to the surface plasmon resonance of the Ag nanoparticles. The
size distribution of the nanoparticles was found through analysis of HRTEM images of particles
distributed on carbon coated copper grids. Histogram data revealed the particle size to be about
28 ± 9 nm.

Moussa 19
Figure 8: (a) UV-Vis spectrum of (b) concentrated spherical Ag nanoparticles in methanol and (c) TEM image along with (d) histogram data, x-axis is size (nm)
2.1.3 Triangular Ag nanoparticles from aqueous solution
For comparison to sensitivity of the spherical nanoparticles, triangular Ag nanoparticles
were also synthesized22. HPLC grade water (50 mL) was added to a 300 mL three-neck round
bottom flask. Stirring at 1200 rpm, trisodium citrate (3 mL, 30 mM) was added and allowed to
mix for about 10 minutes. AgNO3 (1 mL, 5 mM) was added dropwise followed by PVP (3 mL,
16 mg/ 1.5 mL, Mw= 55,000), which was added quickly. H2O2 (120 µL) was then added
followed by freshly prepared NaBH4 (0.5 mL, 100 mM). The reaction took place in the dark.
The suspension changed from a faint yellow color to a light blue indigo color after 20 minutes.
The reaction was allowed to continue for 5 hours. The absorption band at ~626 nm was assigned
to the in-plane dipole surface plasmon resonance and the band at ~330nm was assigned to the
a
b
c
d

Moussa 20
out-of-plane quadrupole resonance of the Ag nanoparticles. The size distribution of the
nanoparticles was found through analysis of HRTEM images of particles distributed on carbon
coated copper grids. A histogram of the data revealed the triangles to be 36 ± 9 nm in size.
Figure 9: (a) UV-Vis spectrum of (b) concentrated triangular Ag nanoparticles synthesized and (c) TEM along with (d) histogram data, x-axis of histogram is size (nm)
2.2 Self-Assembly
The silver nanoparticles were immobilized in layers on glass cover slips using chemical
self-assembly23 methods. Self-assembly is a spontaneous formation of ordered aggregates or
networks of nanoparticles. Electrostatic and chemical self-assembly are the most commonly
a
b
c
c

Moussa 21
used techniques to form both monolayer and multilayer assemblies. Ionic forces govern
electrostatic self-assemblies whereas chemical self-assemblies use covalent bonds between
molecules and nanoparticles. Because chemical self-assembly utilizes stronger interactions
between the glass substrate and the nanoparticles, this technique leads to a more stable structure,
and more robust sensor. Different coupling agents were evaluated to make single and multiple
layers.
2.2.1 Silane coupling agents
2.2.1.1 Acid Washing Procedure
Microscope cover glass slides (No. 2, 18 mm square, Corning) were first cleaned using a
piranha solution (3:1 sulfuric acid: hydrogen peroxide) for 20-30 minutes. They were then
washed three times using methanol and ultrasonicating for 15-20 minutes. The pH of the
methanol solution was then tested to make sure no more acid was present on the glass slides.
The clean glass cover slides could then be stored in the methanol until used.
2.2.1.2 Monolayers assembly
The assembly was accomplished by activating the glass cover slides by ultrasonicating in
methanol for 10 minutes. Then the clean glass slide was placed in a 3-
aminopropyltrimethylsilane (APTMS) (1% v/v in methanol)24 for 24 hours. After the overnight
conditioning of the glass slides, they were removed from the APTMS, rinsed with HPLC grade
water and placed in a water bath for 2 hrs. After the two hours the glass slide was rinsed again
with fresh HPLC grade water. The layer of nanoparticles was then deposited by immersing the
functionalized cover glass slide in the silver nanoparticle suspension overnight. A monolayer of
the spherical silver nanoparticles gave a very slight tint of yellow on the glass substrate and a
very slight tint of blue for the triangular silver nanoparticles.

Moussa 22
2.2.1.3 Multilayer assembly
Multilayers were also analyzed to see if a deeper color on the glass coverslips could be
achieved to allow for an easier visual analysis. The covalent layer-by-layer assembly of the
nanoparticles to produce a multilayer consisted of repetitive dips of the functionalized cover
glass into the nanoparticle suspension and a bifunctional linker, β-mercaptoethanol25. The glass
slide was conditioned with APTMS (10% v/v in methanol) for 1.5 hours and then washed with
methanol for about two minutes followed by water for another two minutes. The slide was then
allowed to soak in a water bath for 2 hours. The slide was removed and rinsed with fresh water
and placed in the silver nanoparticle suspension overnight. Once the first layer of nanoparticles
was assembled, the slide was immersed in solution of 2-mercaptoethanol (BME) for 10 minutes.
BME acts as a coupling agnet and allows for the attachment of a second layer of nanoparticles
onto the first layer. The glass slide was then washed with water for two minutes and then soaked
in a water bath for one hour and placed in the silver nanoparticle suspension again. When the
BME process was repeated along with copious rinsing between immersions, multilayers of the
nanoparticles were achieved giving rise to different colors on the glass slides depending on the
number of layers of nanoparticles assembled.
Figure 10: 13-layers spherical Ag nanoparticles suspended in water self-assembled onto a cover glass slide giving blue-green color

Moussa 23
2.2.1.4 Results and Discussion
The cleaning process using the piranha solution leaves the coverslip surface hydrophilic
and hydroxylised and therefore appropriate for organosilane deposition. During surface
attachment, APTMS reacts with the glass substrate allowing to the alkoxy groups of APTMS to
leave and allowing the amino terminus of APTMS to interact with the silver nanoparticles
leading to the formation of a monolayer. To form additional covalent layer-by-layer assembly,
BME is used as the bilinker between silver nanoparticles.
Figure: Chemical structure of (a) 3-aminopropyltrimethoxysilane (APTMS) and (b) 2-Mercaptoethanol (BME)
An effective sensor would easily allow for determination of a gas reaction occurring
between the sensor and the display material based on an intense color change of the film. A
monolayer assembly provides a minimal amount of color by visual inspection and was difficult
to use. Absorbance in the UV-Vis was very low, and peaked around 0.025 absorbance. Such low
absorbance is accounted for by the fact that organosilane itself is very sensitive to moisture
which causes silane to polymerize and thus lose its useful functional groups for the assembly26
leading to just a few nanoparticles attaching to the glass coverslip. Also it was found that piranha
cleaning method for glass slips was not efficient and reproducible films were hard to make with
this method.
a b

Moussa 24
Figure 11: UV-VIS of monolayer assembly of (a) spherical nanoparticles and (b) triangular nanoparticles
The multilayer on the other hand gives a deep color but only achieved this deep color after
multiple assemblies, which is very time consuming and difficult to keep a uniform assembly
each time. Since the color on the glass coverslip is so dark, a different method of the UV-Vis
must be utilized in which % reflectance is measured. The UV-Vis spectrum below shows a %R
of the multilayer to be around 11.5 %R.
Figure 12: UV-Vis spectrum in reflectance mode of 13-layer assembly of Ag spherical
nanoparticles synthesized in water
a
b a

Moussa 25
2.2.2 PEI-Coupling
Another assembly method using a polymer, polyethylenimine (PEI), was tried next to see
if any improvement could be done on the challenges of using the silane-assembly method. For
example silane assembly required coupling of silver nanoparticles by sulfur-containing
molecules, which could cause problems in determining whether or not the sensors were reacting
to the coupling agent or the sulfur gases in the surroundings. Also, PEI does not polymerize in
the presence of water or lose its functional groups, so its efficiency in coupling silver
nanoparticles to class coverslips would not be compromised.
2.2.2.1 Base Washing Procedure
Glass coverslips were first cleaned using a cotton swab, sparkleen soapy water and
distilled water. Then the glass coverslips were placed in a staining jar (peolco international, 17
mm x 23 mm x 30 mm height) filled with NaOH/ethanol solution (7 g NaOH, 28 mL HPLC
water, 42 mL ethanol). The jar was agitated for two hours in a wrist-action shaker. The
NaOH/ethanol solution was poured out and the glass coverslips were rinsed once with HPLC
grade water. The coverslips continued to be ultrasonicated with HPLC water for four times with
20 minutes each time. The coverslips were then stored in HPLC water until use but sonicated
with fresh HPLC water for 20 minutes before using.
2.2.2.2 Monolayer
To assemble the monolayer of silver nanoparticles on the glass coverslips, the coverslips
were soaked in 1% polyethylenimine (PEI)27 aqueous solution for an allotted time and then
washed with HPLC water bath. The coverslips were then immersed into the Ag nanoparticles
after thoroughly rinsing with water and then methanol only if the nanoparticles were dispersed in

Moussa 26
methanol. The film was then taken out of the nanoparticle suspension and washed again and
allowed to air dry.
2.2.2.3 Multilayer
To obtain a mutilayer, the same procedure was used as the monolayer except the
coverslips were immersed in PEI and the silver nanoparticle suspension alternately with
thorough washing with water for the triangular nanoparticles and both water and methanol for
the spherical nanoparticles.
Figure 13: Multilayer assembly with the polyanion being silver nanoparticles and the polycation being PEI in part B. Part A, 1 is PEI, 2 is HPLC water wash, 3 is Ag nanoparticle suspension, 4 is HPLC water wash. 2.2.2.4 Results & Discussion
The structure of polyethylenimine is shown below. Hydrogen bonding interactions
between the amino groups and the hydroxylised surface of the glass coverslip allow for
attachment of PEI. The amino groups then react with the negatively charged Ag nanoparticles
through electrostatic or ligand donation stabilization to achieve assembly.

Moussa 27
Figure 14: Chemical structure of polyethylenimine (PEI)
Monolayer assemblies using PEI were very efficient and allowed absorbances measured
with UV-Vis as high as 0.36 absorbance. One layer of spherical nanoparticles synthesized in
methanol gave a yellow color when first taken out of the silver suspension but after washing and
drying the color turned to a yellow color with a pink hue. Two absorbance peaks are seen in the
UV-Vis spectrum, one at ~400 nm and one broad one at ~550 nm (Figure 15a). One layer of
triangular nanoparticles created using PEI gave a blue color and an absorbance maximum in the
near IR at ~750 nm (Figure 15b).
Figure 15: UV-Vis spectrum in transmittance mode of a single layer silver nanoparticle assembly using PEI of (a) spherical nanoparticles and (b) of triangular nanoparticles
a
b a

Moussa 28
A two-layer assembly of spherical nanoparticles synthesized in methanol using PEI gives
a yellow color when taken out of the Ag nanoparticle suspension but after washing and drying
turns to a purple color. In addition to the absorption peak at 400 nm, the second peak at ~550 nm
is more prominent in the UV-Vis spectrum (Figure 16a). This colloidal silver suspension was
very concentrated, and stacking of layers could exist on parts of the film. The small broad peak
seen in the monolayer could therefore be due to stacking of nanoparticles, which is why the same
peak is at higher intensities in the 2-layer film. This phenomenon could be improved by diluting
the suspension. A two-layer assembly of triangular nanoparticles gives the same blue color as
the one-layer assembly but a little deeper. The UV-Vis spectrum shows a similar absorbance
peak to the one-layer assembly, however it is a little wider (Figure 16b). After the second
exposure of the glass coverslip to PEI, the glass coverslip looked a fainter color after washing.
This trend was seen in both the spherical and triangular assemblies, but the color of the glass
coverslip was refreshed after the second dipping in the silver suspension to achieve the next
layer.
Figure 16: UV-Vis spectrum of a (a) 2-layer Ag nanoparticle assembly using PEI of (a) spherical nanoparticles and of (b) triangular nanoparticles
a b

Moussa 29
2.3 Summary
The self-assembly of Ag nanoparticles onto glass coverslips to give a deep color was very
successful with the PEI. PEI coupling allowed an easier visual of the assembled silver
nanoparticles with only a monolayer, unlike the silane coupling which required a multilayer to
get a better visual analysis. PEI also did not contain any sulfur functional groups that might have
reacted with the silver nanoparticles after assembly and the functional groups do not polymerize
in the presence of water preventing them from efficient coupling. In fact, PEI-coupling only
took a few hours, whereas silane-coupling required over night treatments. The color of the
triangular Ag nanoparticles gave a blue colored sensor in both the silane and PEI coupling. The
spherical Ag nanoparticles gave a yellow/pink sensor for a monolayer and a purple sensor for
two –layer coupling using PEI and a yellow sensor for silane coupling.

Moussa 30
Chapter 3-Sensitivity of Nanoparticles to Hydrogen Sulfide
Once the self-assembled silver nanoparticle sensors had been made, their performance
was tested in exposures to hydrogen sulfide to determine how the reaction affected the film
color. Both static and dynamic exposures of H2S were utilized. The set-up scheme is shown in
Figure 17. A static exposure consists of a steady exposure of H2S for a certain amount of time
where the valve to the bubbler was be closed. The dynamic exposure consisted of the same gas
handling system with the H2S constantly flowing through the set-up below and escaping through
the bubbler.
Figure 17: Scheme for exposure to H2S gas
For exposure, the silver sensor produced through self–assembly was placed into an
exposure chamber, which was then flushed with nitrogen and evacuated all under a closed
system. Once this was completed, either pure or 100 ppm H2S gas was released into the system

Moussa 31
with the bubbler closed. The monolayer was exposed to a 100 ppm concentration of H2S and the
multilayer was exposed to pure H2S for a prescribed amount of time (Table 1). The 1-layer
silane-coupled sensors were exposed to both static and dynamic conditions of 100 ppm hydrogen
sulfide at various times. The multi-layer silane-assembled sensor and PEI-assembled sensor was
exposed to a static condition of pure hydrogen sulfide gas.
H2S Exposure
Spherical Ag NPs/H2O Silane-coupled
Triangular Ag NPs/H2O PEI- Coupled
Spherical Ag NPs/MeOH PEI-coupled
Monolayer Multilayer Multi Mono Dynamic-100 ppm
1) 35 min
Static-100 ppm
1) 30 min 2) 1.75 hr
Static-pure
1) 40 min 1) 45 min 1) 30 min
Table 1: Exposure times of sensors to pure or 100 ppm H2S gas at static or dynamic conditions
After exposure to hydrogen sulfide, the sensor was analyzed for any changes due to the
reaction. The UV-Vis absorption spectrum was recorded to measure a before and after
absorption of the sensor. As seen in the figure 18, the original peak validating that the
nanoparticles are assembled onto the glass slide is reduced in intensity after exposure to H2S.
This demonstrates that the sensors are reacting with the H2S gas.

Moussa 32
Figure 18: UV-Vis spectra in transmittance mode of silane-coupled monolayers spherical Ag NPs synthesized in water sensors exposed to hydrogen sulfide gas for (a) 30 minutes static (b) 35 min dynamic and (c) 1.75 hrs static. UV-Vis spectra in reflectance mode for a (d) ~13 layer multilayer spherical Ag nanoparticle sensor exposed to pure hydrogen sulfide gas for 40 min.
Figure 19: (a) UV-Vis spectrum in transmittance mode of PEI-coupled monolayer of spherical Ag nanoparticles synthesized in methanol sensor exposed to hydrogen sulfide gas for 30 min static. (b) UV-Vis spectrum in transmittance mode of PEI-coupled monolayer triangular Ag nanoparticle sensor exposed to hydrogen sulfide gas for 45 min static.
b
c
b a
d
a
a

Moussa 33
Reduction of the characteristic peak shows sensors are sensitive to corrosive gas. The
resulting UV-Vis spectrum of the sensor after being exposed to hydrogen sulfide gas and fully
reacting (red color in spectra of Figures 18c -19a) showed a characteristic rise in the spectrum
near the blue region, which is consistent with the optical absorption spectra of silver sulfide28. A
color change in the sensors was also seen, in which both the one-layer yellow spherical Ag
nanoparticle sensor and the one-layer blue triangular Ag nanoparticle sensor turned colorless
after exposure. The multi-layer spherical Ag in water sensor turned from a blue-green to a
grayish color after exposure.
Figure 20: Multi-layer spherical silane assembly (a) Pre-exposure to pure hydrogen sulfide and (b-c) post-exposure to pure hydrogen sulfide for 40 minutes at different angles. 3.1 Products and Kinetics 3.1.1 Verification of products To better understand the reaction of silver nanoparticles with hydrogen sulfide, further
analysis was completed. Energy Dispersive X-ray spectroscopy analysis (EDX) was run to
verify the sulfur reaction and kinetic studies were performed to examine the nature of the surface
reaction. Samples for transmission electron microscopy (TEM) were prepared on formvar/carbon
copper grids with the same PEI-assembly procedure as making films on glass coverclips. The
samples on copper grids were exposed to H2S gas for the same time as the films treated.
Morphological details and was performed on a high-resolution transmission electron
microscope (HRTEM), operating at 200 kV. In the STEM mode, a focused electron beam is
a b c

Moussa 34
scanned over a selected sample area. STEM images were recorded with a high-angle annular
dark field (HAADF) detector. An energy-dispersive X-ray (EDX) spectrometer attached to the
TEM performs elemental analyses at spots selected in the HADDF dark field STEM images,
with a spot size of 1 nm.
HRTEM images showed a blurring of the edges of the nanoparticles indicating a layer of
reaction product had formed (Figure 21 1a vs. 1b). This blurring of the edges could be due to
small clustering of Ag2S on the nanoparticle surface indicating that the silver nanoparticles did
not react uniformly, but rather in areas of low PVP coverage29. This could be due to variable
concentrations of PVP covering the areas of the nanoparticle. Alternatively, the Ag-Ag2S
attractive forces are weak, and the surface energy causes the Ag2S to form small clumps rather
than a thin uniform film30.

Moussa 35
1. 2. Figure 21: (1a) High resolution TEM image of spherical Ag NPs, showing sharp outlines of nanoparticles. (1b) High resolution scanning TEM image of spherical Ag NPs. (2a) High resolution TEM image of reacted Ag NPs with H2S, showing blurred edges. (2b) High resolution dark field scanning TEM image of reacted Ag NPs with H2S, showing blurred edges.

Moussa 36
Figure 22: (a) EDX spectrum of spherical nanoparticles. The C signal comes from both the TEM grid and PVP surrounding the nanoparticles; O comes from the PVP. (b) EDX spectrum of reacted Ag NPs with H2S showing sulfur at about half the intensity of silver.
Silver with no signs of Sulfur
Silver and Sulfur peaks seen after exposure

Moussa 37
Looking at the initial EDX data (Figure 22a), the Cu comes form the TEM grid and the
silver is the spherical silver nanoparticles. In figure 22b, the Ag peak has decreased and a sulfur
peaked has appeared indicating the reaction with hydrogen sulfide had occurred. The intensity
of the sulfur seems to be about half of the intensity of the silver, which is the correct atomic
proportion of silver compared to sulfur in Ag2S. Because sulfur is present in the Ag particles
after reaction, it indicates the reaction occurred and color changes in the sensor were due to the
reaction with hydrogen sulfide and not impurities.
3.1.2 Kinetic Studies
To determine the reactivity of the triangular and spherical silver nanoparticle sensors to
hydrogen sulfide gas, kinetic studies were performed. One-layer of the nanoparticles was self-
assembled onto the inner surfaces of a glass cuvette using the same PEI method used on the glass
coverslips. The cuvette was allowed to dry overnight. The cuvette was then attached to the
hydrogen sulfide system, flushed with nitrogen gas and vacuumed. Then, pure hydrogen sulfide
gas was flushed into the cuvette at a pressure of 2psi, in which the cuvette was then closed off
and removed for further analysis using the UV-Vis, taking consecutive spectrums over time. The
formation of silver sulfide was monitored by measuring the change in absorbance of the
triangular silver nanoparticles at 750 nm and the spherical silver nanoparticles at 400 nm.
To analyze how the concentration of silver nanoparticles changed as the reaction
progressed, characteristic kinetic plots were made simulating zero, first and second order
reactions. A zero order is the plot of the concentration of Ag (absorbance) against time with the
differential rate law being –d[Ag] / dt = k and therefore the integrated rate law is [Ag] = -kt.
First order plots ln ([Ag]/ [Ag]0) against time and so –d[Ag] / dt = k[Ag] resulting in [Ag] =
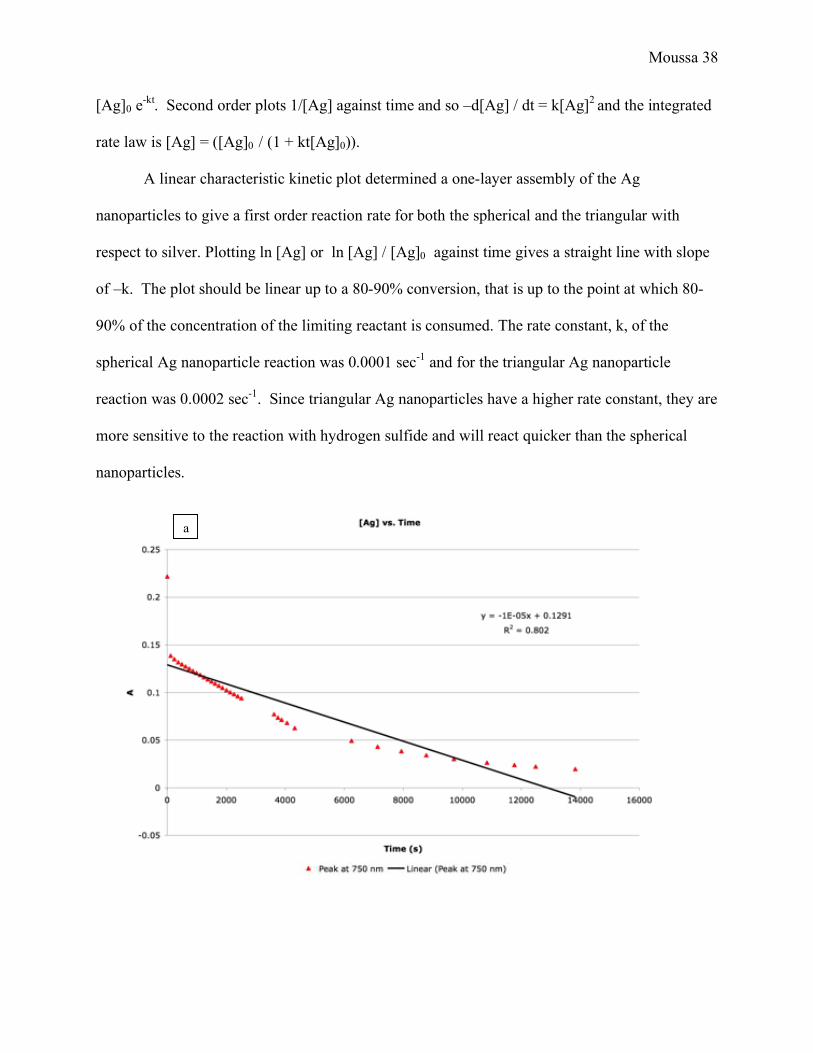
Moussa 38
[Ag]0 e-kt. Second order plots 1/[Ag] against time and so –d[Ag] / dt = k[Ag]2 and the integrated
rate law is [Ag] = ([Ag]0 / (1 + kt[Ag]0)).
A linear characteristic kinetic plot determined a one-layer assembly of the Ag
nanoparticles to give a first order reaction rate for both the spherical and the triangular with
respect to silver. Plotting ln [Ag] or ln [Ag] / [Ag]0 against time gives a straight line with slope
of –k. The plot should be linear up to a 80-90% conversion, that is up to the point at which 80-
90% of the concentration of the limiting reactant is consumed. The rate constant, k, of the
spherical Ag nanoparticle reaction was 0.0001 sec-1 and for the triangular Ag nanoparticle
reaction was 0.0002 sec-1. Since triangular Ag nanoparticles have a higher rate constant, they are
more sensitive to the reaction with hydrogen sulfide and will react quicker than the spherical
nanoparticles.
a

Moussa 39
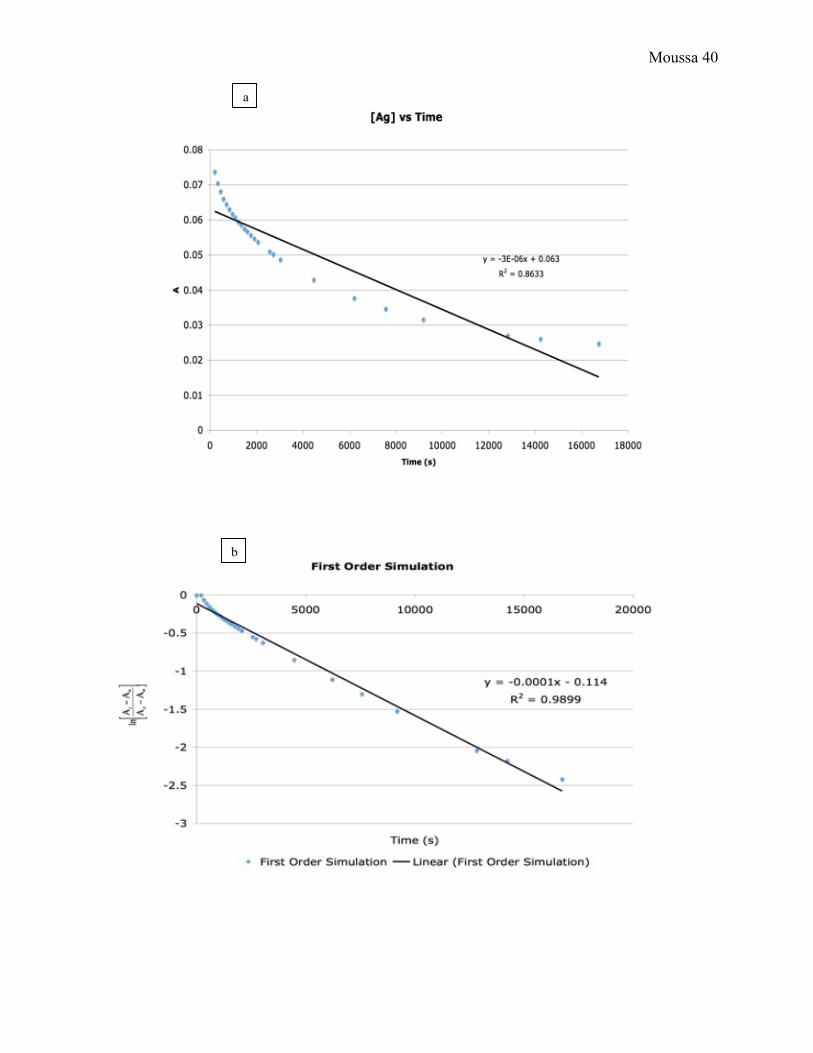
Figure 23: 1/2 hr PEI-assembly of triangular Ag nanoparticles on a cuvette exposed to pure hydrogen sulfide gas (a) Zero-Order simulation (b) First-Order simulation (c) Second-Order Simulation
b
c
Moussa 40
a
b

Moussa 41
Figure 24: 1/2 hr PEI-assembly of spherical Ag nanoparticles in methanol exposed to pure hydrogen sulfide gas (a) Zero-Order simulation (b) First-Order simulation (c) Second-Order Simulation
The sensitivity of the triangular Ag nanoparticles over the spherical Ag nanoparticles
could be due to the chemical stability of spherical nanoparticles, which is greater than the
triangular. It could also be the fact that the spherical nanoparticles were synthesized in methanol
which reduces the amount of water on the silver surface and does not allow the gas to react as
quickly. To further investigate the kinetics, dose response experiments should be performed
where the pressure of the H2S gas is varied and one can evaluate the if the reaction is still linear
with first order.
c

Moussa 42
Chapter 4-Performance evaluation of Ag nanoparticle sensors
4.1 Stability
Once the Ag nanoparticle sensors had been demonstrated to react to the target gas (H2S),
they were then tested for their stability under Oddy Test conditions of 100% relative humidity
and 60°C, without harmful material as a control. The sensors were also kept in a jar with 10 mL
of DI water at room temperature to determine their stability when not exposed to high
temperatures.
The jars used to perform the stability testing were glass, with stainless steel caps having a
teflon face liners. The sensors were placed in a holder and then in a 20 mL beaker, which was
placed inside the jar. Different holders were used to determine the best one. The first holder
tried was made of glass slides and the sensor was glued on using a glue gun. The second holder
used was two pieces of Teflon with a square cut inside. The Teflon pieces were held together by
aluminum foil when placed inside the jar. The last holder consisted of a small, square Teflon
piece with three slits cut across so the sensor could stand up vertically.
Figure 25: (a) glass slide holder (b) two-piece Teflon holder (c) square-piece Teflon holder
a b c

Moussa 43
4.1.1 Silane-Coupled Sensors
To prepare for the Oddy test set up, all containers were cleaned using piranha solution for
20-30 minutes, then rinsed with deionized water twice and washed again with water two more
times while ultrasonicating, then checked for a neutral pH. A fresh silane-assembled, one-layer
silver nanoparticle film was glued onto the glass slide holder and set inside the small beaker.
About 10 mL of deionized water were added to the jar and the beaker was placed inside the jar,
which was then capped, tightened and placed in the 60°C oven. After one hour, the cap to the jar
was retightened to ensure gases would not escape.
UV-Vis spectra of the sensor was taken pre-exposure to determine the absorbance at
initial time. Maximum absorbance using silane-assembly of spherical nanoparticles synthesized
in water only reached around 0.025, which is very low. After exposing the spherical
nanoparticle sensor to control Oddy conditions (inside jar with only water placed in 60°C oven),
a big decrease in absorbance of the spectra occurred after only a few days and continued to
decrease throughout the 28 days period. The exponential time dependence for the decrease was
consistent with the first-order reaction kinetics for this process, indicating a gas reaction of some
sort.

Moussa 44
Figure 26: (a) UV-Vis spectrum of a 1-Layer silane assembly of spherical nanoparticles synthesized in water exposed to Oddy Test conditions without harmful material over a 28-day period in a 60° oven (b) Peak absorbance at 410 nm versus the number of days the sensor was exposed to controlled Oddy Test conditions in a 60° oven
Another monolayer silane-coupled assembly of spherical nanoparticles synthesized in
water was placed in controlled Oddy Test conditions, however this time the jar was placed at
room temperature instead of in the oven. The sensor was placed in the two-piece Teflon holder
and UV-Vis spectrums were taken over a period of 26 days. The same trend in decrease of
absorbance was also observed after only five days.
Figure 27: (a) UV-Vis spectrum of a 1-Layer silane assembly of spherical nanoparticles synthesized in water exposed to Oddy Test conditions without harmful material over a 28-day period at room temperature (b) Peak absorbance at 410 nm versus the number of days the sensor was exposed to controlled Oddy Test conditions at room temperature
a
a b
a b

Moussa 45
A monolayer silane-coupled assembly of triangular nanoparticle synthesized in water was
tested at room temperature. The UV-Vis max absorbance of the sensor was only .0045 A to start
with and a decrease was also seen within three days. Another interesting observation of the
triangle one-layer assembly included a blue shift of the spectra when placed in controlled Oddy
conditions. This phenomenon will later be explained.
Figure 28: (a) UV-Vis spectrum of a 1-Layer silane assembly of triangular nanoparticles synthesized in water exposed to Oddy Test conditions without harmful material over a 28-day period at room temperature (b) Peak absorbance versus the number of days the sensor was exposed to controlled Oddy Test conditions at room temperature
One-layer silane-coupled sensors came with a lot of challenges to be resolved. The
stability of the nanoparticles was poor, both in Oddy Conditions in the oven andin ambient room
temperature conditions. Also, once the silver nanoparticles were assembled, the color of the
sensors was very faint and hard to see. The faint color was shown in the low absorbance of UV-
Vis spectra. These factors made the silane-coupled sensors unsuitable for replacing the silver
coupon in the Oddy Test, and therefore no further studies were conducted utilizing the silane-
coupled nanoparticle sensors. Out of the three types of holders used, the square Teflon holder
was the best and was the method of choice for the rest of the studies conducted.
a
b a

Moussa 46
4.1.2 PEI-coupled sensors
PEI-coupled nanoparticle sensors were also first tested for their stability in Oddy
conditions. To prepare for the Oddy test set up, all containers were cleaned using
NOCHROMIX, then rinsed with deionized water twice and allowed to sit in fresh water
overnight. The glass was then removed and rinsed with fresh water along with scrubbing using a
cotton swab. The glass was again left to sit in fresh water overnight.
A fresh PEI-coupled monolayer assembly of spherical Ag nanoparticles synthesized in
methanol was placed in the square Teflon holder and placed inside the small beaker. About 10
mL of deionized water were added to the jar and the beaker was placed inside the jar, which was
then capped, and placed in the 60°C oven. After one hour, the cap to the jar was retightened to
ensure gases would not escape.
A UV-Vis spectrum of the sensor was taken before exposure. Absorbance of the PEI-
coupled spherical nanoparticles can be adjusted as high as 0.3, much higher than the silane-
coupled assembly. In the Oddy test conditions, a one-layer spherical assembly starting with 0.12
absorbance showed two peaks in the spectrum turning into one peak at 410 nm with a higher
absorbance than the initial spectrum indicating a thermal-induced rearrangement of the silver
nanoparticles. The one-layer spherical assembly was measured for 77 days and showed to be
stable over the time period with only slight deviations in the max absorbance of the spectrum.
a

Moussa 47
Figure 29: (a) UV-Vis spectrum of a 1-Layer PEI-assembly of spherical nanoparticles
synthesized in methanol exposed to Oddy Test conditions without harmful material over a 77-day period in the 60°C oven (b) Peak absorbance at 410 nm versus the number of days the sensor was exposed to controlled Oddy Test conditions in the 60°C oven (initial peak absorbance at Day 0 omitted)
A 2-layer PEI-coupled assembly of spherical nanoparticles synthesized in methanol was
tested under controlled Oddy conditions over a 28-day period in a 60°C oven, and only slight
deviations were observed in the max absorbance of the spectra, with the peaks still absorbing
above 0.3 at 420 nm. The two absorbance peaks turned into one peak, again indicating thermal-
induced rearrangement of the silver nanoparticles.
b a

Moussa 48
Figure 30: (a) UV-Vis spectrum of a 2-Layer PEI-coupled assembly of spherical nanoparticles synthesized in methanol exposed to Oddy Test conditions without harmful material over a 28-day period in the 60°C oven (b) Peak absorbance at 420 nm versus the number of days the sensor was exposed to controlled Oddy Test conditions in the 60°C oven
PEI-coupled triangular two-layer and one-layer sensors were also tested for their stability
in controlled Oddy conditions. The one-layer PEI-assembly of triangular silver nanoparticles
started with 0.26 absorbance of the peak at ~715 nm and then started to decrease and blue shift
and another peak ~ 410 nm started to form. Once the peak at 700 nm was completely fully react
around day 14, the peak at ~410 nm was very stable and showed slight deviations throughout the
test period. These changes in the UV-Vis spectra were also observed visually as the blue sensor
started to form deep yellow spots until eventually the whole sensor was yellow. This yellow
color stayed stable even after 77 days.
a
b
b

Moussa 49
Figure 31: (a) UV-Vis spectrum of a 1-layer PEI-assembly of triangular nanoparticles synthesized in water exposed to Oddy Test conditions without harmful material over a 77-day period in the 60°C oven (b) Peak absorbance versus the number of days the sensor was exposed to controlled Oddy Test conditions in the 60°C oven
The one-layer PEI-assembly of triangular silver nanoparticles was also tested in
controlled Oddy conditions at room temperature. Similar observations were seen in this test as
the one done at 60° C. The peak at ~735 nm started to decrease but stabilized in absorbance
from day 7 to 35. The blue shift phenomena was observed again and the peak ~410 nm did not
appear until after 67 days.
Figure 32: (a) UV-Vis spectrum of a monolayer PEI-assembly of triangular nanoparticles synthesized in water exposed to Oddy Test conditions without harmful material over a 67-day period at room temperature (b) Peak absorbance versus the number of days the sensor was exposed to controlled Oddy Test conditions at room temperature
a
b
a b
a
Moussa 50
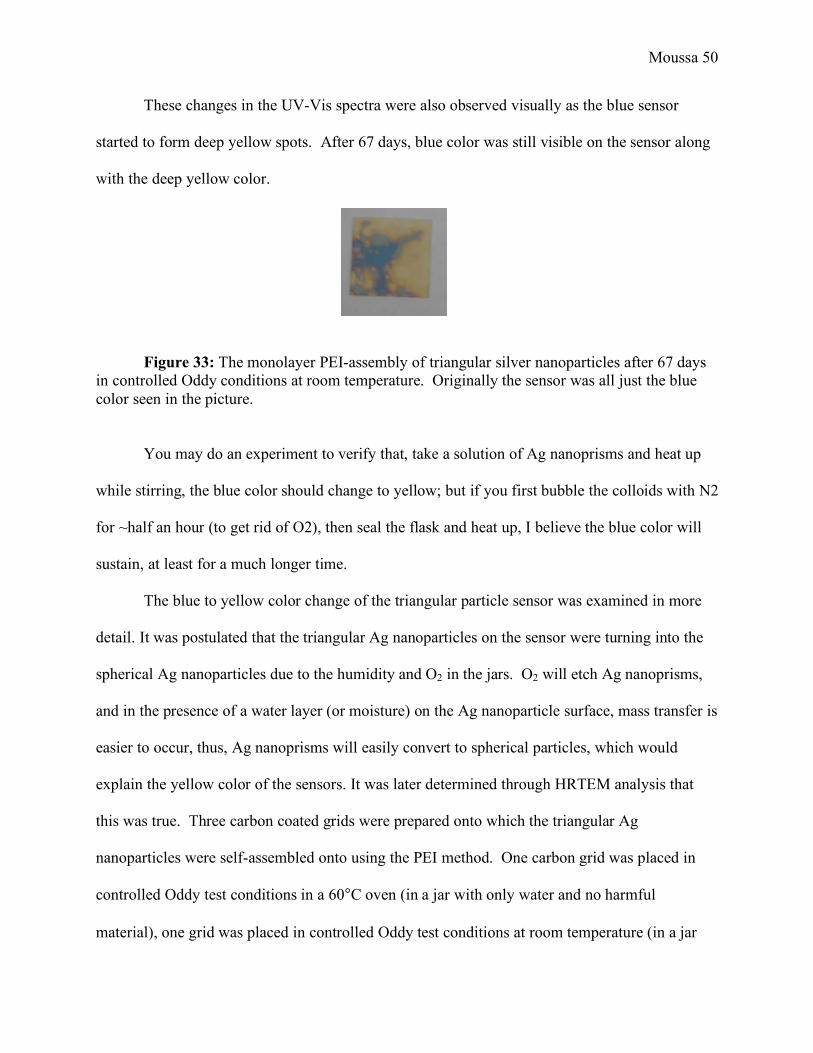
These changes in the UV-Vis spectra were also observed visually as the blue sensor
started to form deep yellow spots. After 67 days, blue color was still visible on the sensor along
with the deep yellow color.
Figure 33: The monolayer PEI-assembly of triangular silver nanoparticles after 67 days in controlled Oddy conditions at room temperature. Originally the sensor was all just the blue color seen in the picture.
You may do an experiment to verify that, take a solution of Ag nanoprisms and heat up
while stirring, the blue color should change to yellow; but if you first bubble the colloids with N2
for ~half an hour (to get rid of O2), then seal the flask and heat up, I believe the blue color will
sustain, at least for a much longer time.
The blue to yellow color change of the triangular particle sensor was examined in more
detail. It was postulated that the triangular Ag nanoparticles on the sensor were turning into the
spherical Ag nanoparticles due to the humidity and O2 in the jars. O2 will etch Ag nanoprisms,
and in the presence of a water layer (or moisture) on the Ag nanoparticle surface, mass transfer is
easier to occur, thus, Ag nanoprisms will easily convert to spherical particles, which would
explain the yellow color of the sensors. It was later determined through HRTEM analysis that
this was true. Three carbon coated grids were prepared onto which the triangular Ag
nanoparticles were self-assembled onto using the PEI method. One carbon grid was placed in
controlled Oddy test conditions in a 60°C oven (in a jar with only water and no harmful
material), one grid was placed in controlled Oddy test conditions at room temperature (in a jar

Moussa 51
with just water and no harmful material), and one grid was placed in a sealed container away
from moisture as a control. TEM images of the copper grid placed in the oven show spherical
nanoparticles whereas the control is mostly triangular nanoparticles, confirming the change from
triangular to spherical due to humidity in the air.
Figure 34: TEM images of triangular Ag nanoparticles assembled on carbon grid using PEI method (a) control (b) placed in Oddy conditions at room temperature (c) placed in Oddy conditions in 60° C oven.
For the two-layer PEI-coupled assembly of triangular Ag nanoparticles, a slight decrease
in the absorbance spectrum was observed along with a remarkable blue shift from 780 nm to ~
410 nm. The two-layer assembly started with an absorption of 0.32 and took ~14 days to reach
~410 nm. The sensor showed only slight deviations in absorbance for the first 17 days. Then, a
slight decrease in absorbance occurred and from day 17 to 21, but from day 21 to 77 the
absorbance did not vary much. Visually, color could still be seen on the sensor for up to 77 days,
with absorbance near 0.19.
a b c

Moussa 52
Figure 35: (a) UV-Vis spectrum of a 2-Layer PEI-assembly of triangular nanoparticles synthesized in water exposed to Oddy Test conditions without harmful material over a 77-day period in the 60°C oven (b) Peak absorbance versus the number of days the sensor was exposed to controlled Oddy Test conditions in the 60°C oven
The two-layer PEI-coupled assembly of triangular silver nanoparticles was also tested in
controlled Oddy conditions at room temperature. The peak at ~710 nm decreased and blue
shifted as a peak at ~410 nm appeared, which started to increase in intensity. The peak at ~410
nm did not appear until after 16 days, and the peak at ~710 nm disappeared after 35 days.
Figure 36: (a) UV-Vis spectrum of a 2-Layer PEI-assembly of triangular nanoparticles synthesized in water exposed to Oddy Test conditions without harmful material over a 67-day period at room temperature (b) Peak absorbance versus the number of days the sensor was exposed to controlled Oddy Test conditions at room temperature
a b
a
a b

Moussa 53
These changes in the UV-Vis spectra were also observed visually as the blue sensor
started to form deep yellow spots. After 67 days, blue color was not visible on the sensor, which
had turned to a yellow color.
Figure 37: 2-Layer PEI-assembly of triangular silver nanoparticles after 67 days of being exposed to controlled Oddy conditions at room temperature.
The sensors also showed stability when placed inside a sealed plastic bag. No changes
were seen in the UV-Vis spectrum of these sensors even after 12 days, which showed that the
sensors could be mass-produced and used at a later time. Since both the monolayer and 2-layer
assemblies gave good visual color on the glass coverslip, it was decided to use the monolayers
for Oddy testing with harmful material. This would allow one surface to interact with the
corrosive gas instead of having to permeate through two layers. Originally, the only reason why
2-layers was looked into was for visual analysis reasons.
4.1.3 Summary
Overall, the monolayer PEI-coupled sensors were most stable. The monolayer PEI-
coupled spherical Ag nanoparticle sensors showed stability for over one month and were the
most stable in visual color. The monolayer triangular PEI-coupled Ag nanoparticle sensors
showed a transition from nanoprisms to spherical nanoparticles under the presence of moisture
and oxygen. When the nanoprisms did however make the final transition over to spherical
shape, they showed stability with little changes in the UV-Vis absorption spectra at ~410 nm,
showing deep color for over one month.

Moussa 54
4.2 Comparison to conventional Oddy Test
Since the PEI-coupled sensors showed stability for over one month in Oddy test
conditions, the next tests incorporated wool to a jar having a silver coupon to monitor the effects
of the harmful gasses emitted from the wool. The wool was placed in a shell vial and the silver
coupon was hung from the side of the beaker (Figure 38). The wool used in the Oddy Test was
N/500 wool galoon fabric from Testfabrics, Inc.
Figure 38: Jar setup for Oddy test with wool in shell vial and square Teflon holder
When the Oddy Test has been completed, the silver coupon starts to show signs of tarnish after 3
days in the oven with wool and makes it impossible to quantify partial reaction.
Figure 39: Silver coupons exposed to Oddy Conditions with 1 cm x 1 cm wool after (a) 1 day (b) 2 days (c) 3 days (d) 4 days (e) 5 days. Picture taken at two different angles.
a b c d e

Moussa 55
When the PEI-coupled one-layer triangular Ag nanoparticle sensor was exposed to Oddy
Test conditions with wool, the number of days it took for the sensor to fully react depended on
the concentration of nanoparticles on the sensor and the amount of the wool in the test.
Figure 40: Analysis of the number of days it took various concentrations of triangular Ag nanoparticles exposed to Oddy Test conditions with wool to react fully. For the one-layer triangular nanoparticle PEI-assembly, an assembly time of 10 minutes
allowing for UV-Vis absorption of the sensor around 0.18 was the optimal condition.
This sensor reacted within one day showing a dissapearance of the characteristic peak at 780 nm
before the silver coupon showed signs of tarnish from a 1 cm x 1 cm piece of wool. It took the
silver coupon about 3 days to show signs of tarnish. The visual analysis of the sensor showed a
change from the blue color to a colorless glass coverslip.

Moussa 56
Figure 41: (a) UV-Vis spectrum of optimal one-layer triangular Ag nanoparticle sensor pre and
post exposure to Oddy Test conditions with wool. One-layer triangular nanoparticle PEI-
assembled sensor (b) before and (c) after exposure to Oddy Test conditions with wool.
When the one-layer spherical/methanol nanoparticle PEI- assembly was exposed to Oddy
Test conditions with wool, the number of days it took for the sensor to fully react also depended
on the concentration of nanoparticles. However, when compared to the triangular nanoparticle
sensor, the spherical/methanol sensor was not as sensitive, taking three days to react fully to
Oddy Test conditions with wool at a very low absorbance of 0.0638. These results are consistent
with the kinetic studies performed showing the triangular nanoparticles are more sensitive than
the spherical shape. Visual analysis at this absorbance of spherical nanoparticles is very hard,
since only a light tint of yellow is produced on the glass slide.
a b c

Moussa 57
Figure 42: (a) Analysis of the number of days it took various concentrations of spherical/methanol Ag nanoparticles exposed to Oddy Test conditions with wool to react fully.
The resulting UV-Vis spectrum of the sensor after fully reacting with the wool in the
Oddy test conditions did show a characteristic rise in the spectrum near the blue region which is
consistent with the optical absorption spectra of silver sulfide and similar to the results seen in
the triangular nanoparticle sensor (Figure 43, red line).
Figure 43: UV-Vis of optimal one-layer spherical/methanol Ag nanoparticle sensor pre and post exposure to Oddy Test conditions with wool.

Moussa 58
Pieces of wool that were already used in the Oddy Test were reused again in other tests to
act as less harsh off-gassing materials. This slowed down the reaction of the sensor during the
Oddy Test and the reaction progress was followed through UV-Vis. This allowed a quantitative
way of determining the effect of the material on the silver nanoparticle sensors as opposed to just
a visual analysis with the tarnishing of the metal coupon. Therefore, along with following the
changes in color of the sensors as a visual analysis, decrease in UV-Vis spectra absorbance
(Figure 44) showed how far along the reaction was, and one could tell at what point the reaction
was half way done.
Figure 44: UV-Vis spectrum showing reaction progress a reused piece of wool using a (a) monolayer PEI-coupled spherical Ag NPs in methanol sensor and (b) a 2-layer PEI-coupled triangular Ag NPs in water sensor. The spherical silver nanoparticle sensor showed color changes in a decrease in intensity of the
yellow color until it reached colorless. The triangular silver nanoparticle sensor showed color
changes from blue to purple to colorless, purple being the midpoint of the reaction.
a a

Moussa 59
Chapter 5- Conclusion and future work
The research shows that the replacement of the silver coupon in the original Oddy Test
with a silver nanoparticle sensor is very promising. Both triangular and spherical sensors allow
for analysis visually through color changes and quantitatively through UV-Vis spectroscopy
when reacted with corrosive gas. Both sensors showed stability in controlled Oddy conditions
without any harmful material when placed in the oven. The blue triangular sensor turned to a
deep yellow color indicating shape transformation and the spherical sensor retained its yellow
color. The shape transformation of the triangular nanoparticles could be accounted for by the O2
in the air in the presence of humidity oxidizing the triangles and turning them into spheres. This
process was accelerated at high temperatures.
Kinetic studies revealed that the triangular nanoparticle sensors are more sensitive than
the spherical sensors, which was seen in the Oddy Test when the triangular sensors gave results
before the silver coupon. This could be due to the chemical stability of spherical nanoparticles,
which is greater than the triangular. It could also be the fact that the spherical nanoparticles were
synthesized in methanol which reduces the amount of water on the silver surface and does not
allow the gas to react as quickly. To further investigate the kinetics, dose response experiments
should be performed where the pressure of the H2S gas is varied and one can evaluate the if the
reaction is still linear with first order.
The PEI-coupled triangular Ag nanoparticle sensor reacted within one day with a starting
UV-Vis absorbance peak around 0.18. Visual analysis was dramatic in which the sensor turned
from blue to colorless. However, the color shift during the reaction due to the oxidation process
by O2, can make it hard to evaluate intermediate reactions. Until the triangular nanoparticles can
be made stable on the glass coverslips, their use in Oddy conditions would only be suitable

Moussa 60
before the shape transformation to prevent misinterpretations. However, visual analysis can still
be followed as the sensor changes from blue to purple and finally to colorless to indicate reaction
with corrosive gas, or from blue to yellow to indicate transformation of shape and no signs of
corrosion.
The PEI-coupled spherical Ag nanoparticle sensor also showed color changes to give a
visual analysis from yellow to colorless, which is not as easy to see as the blue. The starting
absorbance of the UV-Vis peak at 0.064 of the spherical sensor took 3 days to react fully
showing the spherical Ag nanoparticle sensor was not as reactive as the triangular Ag
nanoparticle sensor. UV-Vis analysis by following the decrease in the absorbance of the
characteristic peak at ~400 nm was easier to evaluate in the spherical sensor than in the
triangular sensor because the spherical sensor’s peak did not shift during the reaction.
Spectroscopic analysis allows for quantitative evaluations of partially reacted sensors.
The extent of the corrosive gas reaction on metal coupons is hard to follow and almost
impossible to quantify how much the silver coupon has tarnished. By following the decrease in
absorption of the characteristic peak of the sensors through UV-Vis, one can know exactly how
far along in the process is.
In the future, there will be hopes to try to replace the copper and lead metal coupons with
respective nanoparticles. This will however take time since not much research has been put into
synthesizing copper and lead nanoparticles. Copper does have surface plasmon resonances in the
visible field (~580 nm), but they are not prominent for spherical shapes so it would be hard to
develop a sensor allowing UV-Vis spectroscopy for quantification. If one can make Cu nanorods
or other nonspherical nanoparticles, a similar colorimetric detection scheme could be developed.
Pb has unfortunately no surface plasmon resonance, so it would be difficult to develop a sensor.

Moussa 61
References
1 W. A. Oddy, "An Unsuspected Danger in Display," Museums Journal, 73, (1973), 27-28. 2 Joseph A. Bamberger, et al. “A Variant Oddy Test Procedure for Evaluating Materials used in Storage and Display Cases,” Studies in Conservation, 44, (1999), 86-90. 3 L.R. Green and D. Thickett, “Testing Materials for use in the Storage and Display of Antiquities-a Revised Methodology,” Studies in Conservation, 40, (1995), 145-152. 4 V. Daniels & S. Ward, “A Rapid Test for the Detection of Substances which will tarnish Silver,” Studies in Conservation, 27, 1982, 58-60. 5 Jean Tetrault, “Measuring the Acidity of Volatile Products,” Journal of the International Institute for Conservation-Canadian Group (IIC-CG), 17, 1992, 17-25. 6 Jinping Zhang, David Thichett & Lorna Green, "Two Tests for the Detection of Volatile Organic Acids and Formaldehyde," Journal of the American Institute for Conservation, 33, 1994, 47-53. 7 Amanda J. Haes and Richard P. Van Duyne, “A unified view of propagating and localized surface plasmon resonance biosensors”, Anal Bioanal Chem, 379, 2004, 920-930. 8 Luis M. Liz-Marzan, “Nanometals: formation and color”, Materials Today, 2004, 26-31. 9 Audrey Moores and Fréréric Goettmann, “The plasmon band in noble metal nanoparticles: an introduction to theory and applications”, New J. Chem., 30, 2006, 1121-1132. 10 Adam D. McFarland and Richard P. Van Duyne, “Single Silver Nanoparticles as Real-Time Optical Sensors with Zeptomole Sensitivity”, Nano Letters, 3, 2003, 1057-1062. 11 Serge Berthier, “Anisotropic effective medium theories”, J. Phys. 1. France, 4, 1994, 303-318. 12 Ágnes Timár-Balázsy and Dinah Eastop Butterworth-Heinemann, Chemical Principles of Textile Conservation (Butterworth - Heinemann Series in Conservation and Museology). Oxford: Butterworth-Heinemann, 2002. 13 Jose Luis Elechiguerra, et. al, “Corrosion at the Nanoscale: The case of silver nanowires and nanoparticles”, American Chemical Society, 17, 2005, 6042-6052. 14 H. Kim, “Corrosion process of silver in environments containing 0.1 ppm H2S and 1.2 ppm NO2”, Materials and Corrosion, 54, 2003, 243–250.
Moussa 62
15 S. Schneider, P. Halbig, H. Grau, and U. nickel, “Reproducible preparation of silver sols with uniform particle size for application in surface-enhanced Raman spectroscopy”, Photochem. Photobiol. 60, 2004, 605-610. 16 Victor K. LaMer and Robert H. Dinega, “Theory, Production and Mechanism of Formation of Monodispersed Hydrosols”, Journal of the American Chemical Society, 72, 1950, 4847-4854. 17 Y. Sun, B. Mayers, T. Herricks, Y. Xia, “Polyol Synthesis of Uniform Silver Nanowires: A Plausible Growth Mechanism and the Supporting Evidence”, Nano Letters, 3, 2003, 955-960. 18 Benjamin Wiley, Yugang Sun, Brian Mayers, and Younan Xia, “Shape-Controlled Synthesis of Metal Nanostructures: The Case of Silver”, Chemistry European Journal, 11, 2005, 454-463. 19 Brian L. Cushing, et. al, “Recent Advances in the Liquid-Phase Syntheses of Inorganic Nanoparticles”. Chem. Rev., 104, 2004, 3893-3946. 20 A. Henglein and M. Giersig, “Formation of Colloidal Silver Nanoparticles: Capping Action of Citrate”, J. Phys. Chem. B, 103, 1999, 9533. 21 Encai Hao and Tianquan Lian. “A hydrogen-bonding based approach to fabricate polymer/inorganic nanoparticle multilayer film”, Material Research Society Symposium Process, 648, 2001, 6171-6176. 22 Gabriella S. Métraux and Chad A. Mirkin, “Rapid thermal synthesis of silver nanoprisms with chemically tailorable thickness”, Advanced Materials, 17, 2005, 412-415. 23 Jiyum C. Huie, “Guided molecular self-sssembly: a review of recent efforts”, Smart Mater. Struct., 12, 2003, 264-271. 24 Nicola E. Cant, Kevin Critchley, Hao-Li Zhang, Stephen D. Evans, “Surface functionalisation for the self-assembly of nanoparticle/polymer multilayer films”, Thin Solid Films, 426, 2003, 31-39. 25 Lakshmi Supriya and Richard O. Claus, “Colloidal Au/Linker Molecule Multilayer Films: Low-Temperature Thermal Coalescence and Resistance Changes”, Chem. Mater., 17, 2005, 4325-4334. 26 Nicola E. Cant, Kevin Critchley, Hao-Li Zhang and Stephen D. Evans, “Surface functionalisation for the self-assembly of nanoparticle/polymer multilayer films”, 426, 2003, 31-39. 27 V. Shakila and K. Pandian, “Preparation of gold nanoislands on various functionalized polymer-modified glass and ITO for electrochemical characterization of monolayer assembly of alkanethiols”, J Solid State Electrochem, 11, 2007, 296–302.

Moussa 63
28 Kensuke Akamatsu, et. al, “Preparation and characterization of polymer thin films containing silver and silver sulfide nanoparticles”, Thin Solid Films, 359, 2000, 55-60. 29 Navina Mehan and Bhai Mansingh, “Study of tarnished films formed on silver by exposure to H2S with the surface-plasmon resonance technique”, Applied Optics, 39, 2000, 5214-5220. 30 H. E. Bennett, “Formation and Growth of Tarnish on Evaporated Silver Films”, Journal of Applied Physics, 40, 3351-3360.