motivations, team dynamics, development practices and how
TRANSCRIPT
University of Denver University of Denver
Digital Commons @ DU Digital Commons @ DU
Electronic Theses and Dissertations Graduate Studies
1-1-2018
Motivations, Team Dynamics, Development Practices and How Motivations, Team Dynamics, Development Practices and How
They Impact the Success of Open Source Software: A Study of They Impact the Success of Open Source Software: A Study of
Projects of Code for America Brigades Projects of Code for America Brigades
Le Chang University of Denver
Follow this and additional works at: https://digitalcommons.du.edu/etd
Part of the Interpersonal and Small Group Communication Commons, Performance Management
Commons, and the Software Engineering Commons
Recommended Citation Recommended Citation Chang, Le, "Motivations, Team Dynamics, Development Practices and How They Impact the Success of Open Source Software: A Study of Projects of Code for America Brigades" (2018). Electronic Theses and Dissertations. 1528. https://digitalcommons.du.edu/etd/1528
This Thesis is brought to you for free and open access by the Graduate Studies at Digital Commons @ DU. It has been accepted for inclusion in Electronic Theses and Dissertations by an authorized administrator of Digital Commons @ DU. For more information, please contact [email protected],[email protected].
Motivations, Team Dynamics, Development Practices and How They
Impact the Success of Civic Open Source Software—A Study of Projects of
Code for America Brigades
__________
A Thesis
Presented to
the Faculty of the Daniel Felix Ritchie School of Engineering and Computer Science
University of Denver
__________
In Partial Fulfillment
of the Requirements for the Degree
Master of Science
__________
by
Le Chang
November 2018
Advisor: Dr. Matthew Rutherford
ii
Author: Le Chang Title: Motivations, Team Dynamics, Development Practices and How They Impact the Success of Civic Open Source Software—A Study of Projects of Code for America Brigades Advisor: Dr. Matthew Rutherford Degree Date: November 2018
Abstract
Open data movement has nurtured the growth of civic open source software
(OSS) in the recent decade. This emerging phenomenon has demonstrated a way that a
community can collectively utilize technology to solve its problems.
This study is based on software projects in brigades of Code for America, which
is a network of organizations that group volunteers to create digital solutions to
community problems. In this study, we analyze the software engineering practices of
current civic open source software development, participants’ motivations and
perceptions of the projects, and provide insights on the antecedents of success of the
application development.
A conceptual model is developed to capture potential correlated factors and
determinants of the success of civic OSS. We find that leadership, team member’s
identification as a core team member, and his/her perception of the public benefit level of
the project are predictors for his/her satisfaction level. Additionally, we find that
compared to team members who are very uninterested in the technologies used in the
projects, those who have strong interests in the technologies experience an increase in the
odds of stronger willingness to continue in the projects.

iii
Acknowledgements
I would first like to thank my thesis advisors Dr. Matthew Rutherford, Dr.
Susanne Sherba, and Dr. Cathy Durso. They provide me with guidance from the very
beginning of my thesis idea formation, to survey design, and to data analysis and writing.
Dr. Matthew Rutherford set high standards for my thesis. He not only showed great
insights into steering the directions of my work, but also provided practical suggestions
on survey design details. Dr. Susanne Sherba, an expert in Software Engineering field,
inspired my thesis idea when I took her class. Her enthusiasm and solid software
engineering knowledge was the anchor of my work. Dr. Cathy Durso taught me the
statistics knowledge and skills essential to analyzing my thesis data. Her abundant
experience in survey design and data analysis helped me gain more insights out of the
data and enhanced my thesis quality.
I would also thank members of Code for Denver, Code for Boulder, staff of Code
for America and a lot of other brigade members. They helped test my pilot survey,
publicize my survey, and provided me with incredible resource and support of this
research.
Finally, I would like to thank my mother, my in-laws, and my husband for their
unfailing support throughout my entire graduate program, including this thesis. Without
their constant encouragement, none of my accomplishments would be possible.
iv
Table of Contents
Chapter One: Introduction ................................................................................................... 11.1 Research question .............................................................................................. 31.2 Major contributions ........................................................................................... 41.3 Thesis outline ..................................................................................................... 4
Chapter Two: Literature Review ......................................................................................... 52.1 Open source software ........................................................................................ 62.2 Open data and civic open source software ........................................................ 7
2.2.1 Open data ............................................................................................ 72.2.2 Civic open source software ................................................................ 82.2.3 Code for America ............................................................................... 9
2.3 Motivations ...................................................................................................... 112.4 Team dynamics ................................................................................................ 12
2.4.1 Communication and coordination .................................................... 122.4.2 Development centrality .................................................................... 132.4.3 Task assignment ............................................................................... 14
2.5 Project features ................................................................................................ 152.5.1 End users .......................................................................................... 152.5.2 Project leaders .................................................................................. 152.5.3 Partnerships ...................................................................................... 162.5.4 Team size .......................................................................................... 17
2.6 Requirement engineering ................................................................................. 172.7 Development process ....................................................................................... 192.8 Success measures ............................................................................................. 202.9 Determinants of success .................................................................................. 21
2.9.1 End user ............................................................................................ 212.9.2 “Onion” team structure ..................................................................... 212.9.3 Partnership, life cycle phase, and activity level ............................... 21
Chapter Three: Research Method ...................................................................................... 233.1 Survey distribution and respondents ............................................................... 233.2 Survey questionnaire ....................................................................................... 243.3 Data analysis method ....................................................................................... 27
Chapter Four: Findings and Results .................................................................................. 304.1 Demographics and context-related information .............................................. 31
4.1.1 Brigade locations .............................................................................. 314.1.2 Gender and roles ............................................................................... 324.1.3 Length of involvement and participation frequency ........................ 344.1.4 Core team member ........................................................................... 354.1.5 Interest in the technology ................................................................. 354.1.6 Motivations ....................................................................................... 36
4.2 Project features ................................................................................................ 384.2.1 End user ............................................................................................ 38
v
4.2.2 Project phase ..................................................................................... 394.2.3 Project leadership ............................................................................. 404.2.4 Project partner .................................................................................. 414.2.5 Project MVP ..................................................................................... 42
4.3 Team dynamics ................................................................................................ 424.3.1 Core and non-core team size ............................................................ 424.3.2 Team gender composition ................................................................ 474.3.3 Team communication ....................................................................... 48
4.4 Software engineering practices ........................................................................ 504.4.1 Team-partner/user communication ................................................... 504.4.2 Requirement elicitation .................................................................... 524.4.3 Partner’s involvement ....................................................................... 534.4.4 Software design ................................................................................ 554.4.5 Task assignment ............................................................................... 574.4.6 Development centrality .................................................................... 584.4.7 Project progress rate ......................................................................... 59
4.5 Conceptual model, hypothesis test and prediction model ............................... 604.5.1 Variables and conceptual model ....................................................... 604.5.2 Hypothesis ........................................................................................ 614.5.3 Logistic regression model ................................................................. 70
Chapter Five: Limitations and Discussions ....................................................................... 795.1 Response bias .................................................................................................. 79
5.1.1 Sample size ....................................................................................... 795.1.2 Representativeness ........................................................................... 79
5.2 Accountability ................................................................................................. 815.3 Logistic regression model ................................................................................ 825.4 Success measures ............................................................................................. 83
Chapter Six: Conclusion and Future Work ....................................................................... 846.1 Conclusion ....................................................................................................... 846.2 Future work ..................................................................................................... 86
References ......................................................................................................................... 88
Appendix: Survey questionnaire ....................................................................................... 93

vi
List of Figures
Chapter Two
Figure 1: OSS Team Structure (adapted from [16]) .................................................. 14
Chapter Four Figure 2: Brigades ..................................................................................................... 31Figure 3: Primary Role and All Roles ....................................................................... 32Figure 4: Length of Involvement ............................................................................... 34Figure 5: Motivations ................................................................................................ 36Figure 6: Reasons for Leaving .................................................................................. 37Figure 7: End User ..................................................................................................... 38Figure 8: Existence of a Government/Community Partner ....................................... 41Figure 9: MVP Completion ....................................................................................... 42Figure 10: Core Team Size ........................................................................................ 43Figure 11: Non-core Team Size ................................................................................ 44Figure 12: Female Number vs. Male Number ........................................................... 47Figure 13: Primary Team Communication Means .................................................... 48Figure 14: Team Communication Effectiveness ....................................................... 49Figure 15: Team-Partner Communication Effectiveness .......................................... 50Figure 16: Team-User Communication Frequency ................................................... 51Figure 17: Requirement Elicitation Methods ............................................................ 52Figure 18: Systematic Architecture and Component Design .................................... 55Figure 19: Task Assignment ...................................................................................... 57Figure 20: Development Centrality ........................................................................... 58Figure 21: Progress Rate of Project ........................................................................... 59Figure 22: Conceptual Model of Variables ............................................................... 61Figure 23: Relationship between “End.user” and “Participation.level” .................... 63Figure 24: Relationship between “End.user” and “Willingness.to.continue” ........... 63Figure 25: Relationship between “Core.team.member” and “Satisfaction” ............. 64Figure 26: Relationship between “Core.team.member” and
“Willingness.to.continue” .................................................................................. 65Figure 27: Relationship between “Partner.present” and “Will.be.completed” .......... 66Figure 28: Relationship between “Partner.present” and “Will.be.used” ................... 66Figure 29: Satisfaction Level ..................................................................................... 71Figure 30: Willingness to Continue ........................................................................... 75
vii
List of Tables
Chapter Three
Table 1: Missingness of Variables ............................................................................. 28
Chapter Four Table 2: Project Phase When Initially Joining It ....................................................... 40Table 3: Core vs. Non-core Team Size ..................................................................... 45Table 4: Partner's Involvement Frequency ................................................................ 54Table 5: Developers' Knowledge of the Architecture and Component Design ......... 55Table 6: Results of Initial Regression for Satisfaction .............................................. 72Table 7: Results of Refined Regression for Satisfaction ........................................... 73Table 8: Odds Ratios of Regression for Satisfaction ................................................. 74Table 9: Results of Initial Regression for Willingness to Continue .......................... 76Table 10: Results of Refined Regression for Willingness to Continue ..................... 77Table 11: Odds Ratios of Regression for Willingness to continue ........................... 77Table 12: Results of Initial Regression for Progress Rate ......................................... 78

1
Chapter One: Introduction
Technology is developing unprecedentedly fast and penetrating our lives, making
them easier and better. However, when it comes to various problems facing every
community, technology still fails to play its part. Demand for more effective technical
civic services is increasingly rising. But government does not always have sufficient
resources to create timely technology solutions. Private sector does not see enough
business value in providing technology solutions to municipal services. That is how civic
open source software comes to the rescue.
Civic open source software (civic tech) is emerging and becoming increasingly
influential in all dimensions. With the fuel of the open data initiative and faster
application development technologies, there has been a civic tech movement in the last
ten years, which is a relatively new phenomenon that deserves our study.
We treat civic open source software as a special type of open source software
(OSS). Civic open source software helps significantly to enhance awareness of municipal
problems, engages citizens, improves governments, and facilitates wiser actions and
social change. Many of the projects have significant civic benefits. But more important
than providing a technical solution, civic tech use prototypes and temporary or sample
solutions to bring some civic challenges to the table and enable more people to get
involved and together find the best solution and take actions [23]. Civic tech might not be
the ultimate solution to some municipal problems, but it is definitely an important start to

2
address many problems or at least let people know that solutions are possible. There are
many successful civic open source software groups that develop solutions across the
world. But they are also facing challenges, such as how to deliver a solution that truly
benefits the public, truly improve citizen’s life quality, improve government efficiency,
and how to ensure ongoing engagement of volunteers to facilitate the development and
maintenance of civic OSS.
This study provides facts and analyses of the practices of current civic open
source software development, discovering the important factors that impact the vitality
and success of the projects. It provides insights for such organizations and volunteers to
understand the status quo and improve their software development practices.
Software applications being developed by Code for America (CFA)1 are analyzed
in this study. CFA was founded in 2009. It is a network of over 5000 people creating
technology solutions for the problems of over 100 local governments, NGOs, and
individuals [56]. The goal of Code for America is to make sure the services provided by
the governments are easy for both the governments and the users to use [51]. The reason
why CFA is chosen is that it is one of the most representative civic tech groups that
develop civic open source software and steer the civic tech direction. They have shipped
successful applications and the network is increasingly influential. As a volunteer in one
of the brigades, I am able to observe and study their practices. This study aims at
understanding the application development mechanisms and providing insights of how to
improve the practices.
1 https://www.codeforamerica.org
3
1.1 Research question
The software applications developed by brigades of CFA are what we define as
civic tech. They are local groups of developers, designers, activists, project managers, etc.
They collaborate to create open source software that helps the local communities address
pressing challenges. The types of applications they are developing are not confined to just
using open data. The source code of all applications is usually on github and everyone is
welcome to join and contribute. The development model of these applications is open
source software (OSS) development. But it is different than what we consider as
“conventional OSS”. The “conventional OSS” is developed by volunteers geographically
distributed all over the world. Volunteers barely meet. Almost all their communications
are through emails, version control systems and bug report systems. There is abundant
research revealing the development processes of “conventional OSS” and the developers’
motivations, how team coordinate, the quality of the software, and the determinants of
success. But for civic open source software created in CFA brigades, members are
usually co-located and meet regularly. Their development process is not exactly the same
as “conventional OSS”. The unique software development process of civic open source
software is not systematically studied in the literature. Specifically, we are interested in
the development practices of civic open source software, volunteers’ motivations, and
success determinants of civic applications. Therefore, in this study, the research questions
are:
What are the motivations of volunteers?
What are the team dynamics?
What is the development practice?
4
What factors impact the success?
1.2 Major contributions
The software development practices of civic open source software are still
evolving and facing uncertainties. A significant number of studies have been focused on
the practices and success of conventional open source software. There is, nonetheless,
very little research done on practices of civic open source software.
This study collects raw data from across the United States to get valuable insights
into how the volunteers work as a team, what the actual software requirement engineering
process, software design, and implementation practices are, and what the relationships
among those features are. Additionally, we also discover factors that attribute to the
participant’s satisfaction level and the project progress rate.
1.3 Thesis outline
The second chapter provides relevant literature review on open source software
and civic tech development practices, developers’ motivations, how teams coordinate the
work, what success measures are applicable and what factors impact their success. Next,
Chapter 3 introduces the research methods used in this study. Chapter 4 presents the
results of the analyses from the data we collected. Chapter 5 discusses the limitations and
the scope of this study. Finally, Chapter 6 summarizes the conclusions and suggests
future work.
5
Chapter Two: Literature Review
Open Source Software research has been done in different disciplines. In the
Software Engineering and Information Science fields, current OSS research focuses on
the following three topics: 1) OSS communities [1], including developers’ motivations
[2,3], barriers for newcomers [4], and social structure [5], 2) OSS development [1],
including development process [6,7,8,42], how the team assign tasks [8], core team size
[8], coordination mechanisms [9], and code ownership [8]. 3) OSS Characteristics [1],
which include the quality of the software and testing [10,11], defect density [8],
determinants of its success [12], success measures [13], and the bug repair interval [8].
The methods used in OOS research are diverse. Since most OSS are implemented
remotely, their source code repositories, email communications, bug reports system,
version control system, documentations and design artifacts are all online (hosted on
SourceForge.net or other websites) and easily accessible. Researchers are able to collect
large amounts and varieties of data [6]. According to the review of OSS research by
Klaas-Jan Stol et al. [1], case study, quantitative analysis, survey, grounded theory and
ethnography are being used in OSS research. Some research studies successful OSS such
as Linux, Apache server, and Mozilla Firefox browser [8,17,31,40,46], while others
collect a large quantity of OSS projects to analyze the overall characteristics [2,7,12,50].
6
2.1 Open source software
Open source software refers to the software that is released under an open source
license [15,16]. Anyone can modify and redistribute the software. Different than
traditional software development approach, this development model, with its source code
available to anyone [17], has made tremendous contribution to technology development
[18] and impacted everyone’s life. Sommerville [15] even claims open source software as
“the backbone of the Internet and software engineering”. Many open-source products are
highly widely used in various fields. The Linux operating system, Java and the Eclipse
IDE, MySQL, React.js framework, and Hadoop are just a few successful examples and
they all play an important role in today’s technology stack.
Because of the success of Apache server, Linux, and Mozilla, which all came out
in the 90s, open source software is perceived as a fundamentally new way to develop
software and even threatens commercial software. Take Apache web server as an
example. According to the Netcraft survey [53], although its market share decreases after
2014, it was the dominant web server between the year 1996 and 2014. As the number of
active websites queried by Netcraft grew from 7 million to 180 million in that period,
Apache kept hosting 40-70% of all the sites. The Mozilla browser, originating from a
commercial product, became open source in 1998. Mozilla Firefox 1.0 was released in
2004 and was a big success with over 100 million downloads in 2004, despite the fact
that in 2002, over 90% people use Internet Explorer browser [54].
Eric S. Raymond’s [17] famous metaphor—the “cathedral” model, which
represents the proprietary software, and the “bazaar” model, which represents the open

7
source software development such as Linux, contrasts the different characteristics of
software development models between open-source and proprietary software. In his view,
the open source software development model is like a bazaar of different approaches,
under which the developers proactively take on tasks and software is frequently released,
while the commercial software is “built like cathedrals, carefully crafted by individual
wizards working in splendid isolation” and only released when it is completed finished
[17]. Tasks of commercial software are assigned in a top-down manner. Eric S. Raymond
consciously lead an open source project, fetchmail, with the bazaar style to test the
theories about software engineering that are derived from the practices of Linux
development. He claims that it is a huge success and the best open source software adopts
the “bazaar model”.
Nikolai Bezroukov [19] critiques Raymond’s views on open source software. He
points out that the “bazaar” model described by Raymond gives a false illusion of it being
a “magic bullet” for almost all problems while it is actually facing some challenges and
has its limitations. He believes that OSS community is like scientific community, in
which people are motived by status and reputation and these motives may cause burnout
in leaders and harm the quality of the product.
2.2 Open data and civic open source software
2.2.1 Open data
The dawn of civic technology is significantly attributed to the open data
movement. In 2009, President Barack Obama signed the Open Government Initiative,

8
championing an unprecedented transparency in government. This means that government
must make efforts to make their data available to the public and the leaders are seeking
greater awareness and usage of this data among the citizens. They sought to involve
software developers to make sense of the data, turn it into meaningful information and
incorporate it into applications that improve public services and economy [20].
2.2.2 Civic open source software
“Civic open source software” is interchangeably used as “civic tech” in this study.
Nowadays, technology, cities and civic networks have been more and more interrelated.
We have heard the terms “e-gov”, “cyberdemocracy”, “digital democracy”, which all
provide some context or suggest important meanings of civic tech. There is not an exact
definition of civic tech. However, there are some features that characterize civic tech —
“the common good”, empowerment of citizens, justice and openness [21]. In short, civic
tech is technological solutions created by citizens for the public benefit [22].
Some activists believe that technology is a powerful democratizing force [23]. In
fact, the founder of the GNU project and also the early advocate of OSS, Richard
Stallman, has explicitly stated the political aspect of OSS, in the context of the Free
Software Movement since 1983. He believes that everyone should have freedom to
control any software, and proprietary software is a tool that is taken advantage of by the
people with unfair power [24]. Naturally, some researchers study civic tech from a social
movement point of view. They perceive civic tech or some open source software as a
platform to take collective action [25]. There is no doubt that civic tech helps increase
9
citizens’ participation in public life. In the United States, the civic apps movement
started in 2009 and the Obama administration has been supporting it ever since. Civic
apps become the bridge between citizens and government, as they are new tools of
information and communication [25].
A significant number of civic open source software is related to Internet or mobile
applications, which focus on some open datasets coming from local government or NGO
[21]. In our study, some applications created in Code for America do not necessarily use
open data. But as we reviewed in the literature, “public benefits” have multiple themes,
so civic applications comes in all kinds of types and representations. The development
practices of all these types of OSS in Code for America brigades are what we study in
this research.
2.2.3 Code for America
Code for America (CFA) is under the umbrella of Code for All2, a network of
organizations that use digital technology as new platforms for citizens to engage in the
public sphere more impactfully [26]. The civic tech movement is not something
happening just in United States, it is worldwide. There is Code for Japan, Germany,
Tanzania, and a number of other countries. Thousands of brigades comprising local
groups of volunteers and civic hackers utilize their technology, design, and project
management skills to tackle community problems.
2https://codeforall.org
10
Andrew Schrock makes an interesting metaphor of CFA brigade programs, saying
that the way they connect small teams of like-minded civic hackers with local
governments is just like the similar model of early firefighters [23]. This metaphor
vividly depicts how CFA encourages grassroots engagement, regardless of their skill sets,
to participate and solve community problems.
Two successful projects of CFA are GetCalFresh and the Detroit Water Project.
GetCalFresh is a mobile-friendly web application delivered by Code for America. It
provides a less than 10-minute efficient online SNAP (food stamps) application without
in-office visits and lengthy paperwork. It allows easy photograph or other document
uploading. As a result, it helps people get CalFresh (SNAP benefits in California)
efficiently, dramatically reducing the number of people who are eligible for food benefits
but have never applied [27]. This project partners with state governments, county offices
and other community groups to help together remove barriers for eligible residents.
The Detroit Water Project, originated from a website by Code for America fellow,
Tiffani Ashley Bell, is a web application that find donors to help families who do not
have running water. According to [28], the project has raised over $180000 donations in
direct payments to the Detroit Water Department on behalf of the residents who had their
water service cut off because they cannot afford it. Since 2014, about 1000 families in
Detroit and Baltimore have been connected to donors through the project to help pay their
water bills.
Both projects strengthen the relationship between governments and the
community. As Andrew Schrock [23] points out, even if technology could not solve all
11
the problems, the process of engaging people to collaborate is meaningful. The point of
civic tech is that it makes us think through problems, not rush to a solution.
2.3 Motivations
Motivation of developers is a central theme in OSS research. Only if we fully
understand participants’ motivations, can we know how to better manage OSS projects
and get the desired results. Motivations that have been discussed in literature include
sharing information and interest [2,20], self-realization [2], improving software for
personal needs [2,3], solving a problem that can not be solved by commercial software
[2], getting help in implementing an idea for software [2], enhancing career opportunities
[2,3,20], monetary rewards [2] (some OSS projects pay developers), a sense of joy and
accomplishment [3,29], altruism [30], and learning new skills [29,2]. Most of them can
be categorized into intrinsic and extrinsic motivations.
G. Hertel et al. [3] collected data from one of the most influential OSS, the Linux
kernel project. They conduct a survey based on two theoretical frameworks from social
science to get insights of the developers’ motivations. The first model is inspired by the
motives of people volunteering in community work and acting in social movements. The
second model specifies motivations of people working in teams [3]. R. Ghosh et al. find
that learning new skills is the top reason for nearly 80% of developers to start with OSS,
and half of them want to share knowledge through OSS [2]. Furthermore, they find that
sharing knowledge is more important to make developers continue in OSS development
[2].
12
These motivations are not independent. J. Roberts et al. [31] develop a theoretical
model explaining the relationships between developers’ intrinsic/extrinsic motivations,
participations and performances. They also find that developers’ motivations are
interrelated, and different motivations impact their participation differently.
2.4 Team dynamics
2.4.1 Communication and coordination
Team effectiveness is an important question in various subjects and industries.
How teams communicate and coordinate their work and expertise are especially
important in software engineering as software engineering is a human-centered activity.
Rising et al. [32] claim that scrum teams can cope with frequent changes in software
requirements. From research [33] in which team members are equipped with wearable
electronic sensors that gather data regarding their social behavior, Pentland finds that the
communication pattern is the most important explanatory factor of a team's success. He
believes that the communication pattern is as significant as the total effects of all other
factors— personality, skills and intelligence [33]. Additionally, in [34], Faraj et al. claim
that the expertise coordination among the team members is strongly related to the
performance of the team.
When it comes to teams communications specifically in open source software
development, a tremendous amount of research reveals how team coordinate and
communicate the work of “Conventional OSS.” “Conventional OSS”, as we define, is
developed by individuals dispersed worldwide. Some of them work in small teams [3].
13
Those teams are somewhat “virtual teams.” Developers rarely meet. Developers mostly
use electronic media to communicate, lacking spontaneous discussion [35]. However, the
success of many OSS with such distributed contributors is impressive. J. Herbsleb et al.
[36] analyze how distributed teams overcome the obstacles to informal communication.
Y. Yamauchi et al. [35] find that coordination after spontaneous work is effective and the
rational team culture helps resolve disagreements among members. Since developers
rarely meet, their communication tends to be more rational. Due to geographical
dispersion, they have to adopt computer-mediated communication, which has an
impersonal nature and is task-focused [35]. The asynchrony of email makes developers
communicate more logically with more reflections and little emotional factors. This
culture focuses on results, rather than vague ideas and discussions. [35]
2.4.2 Development centrality
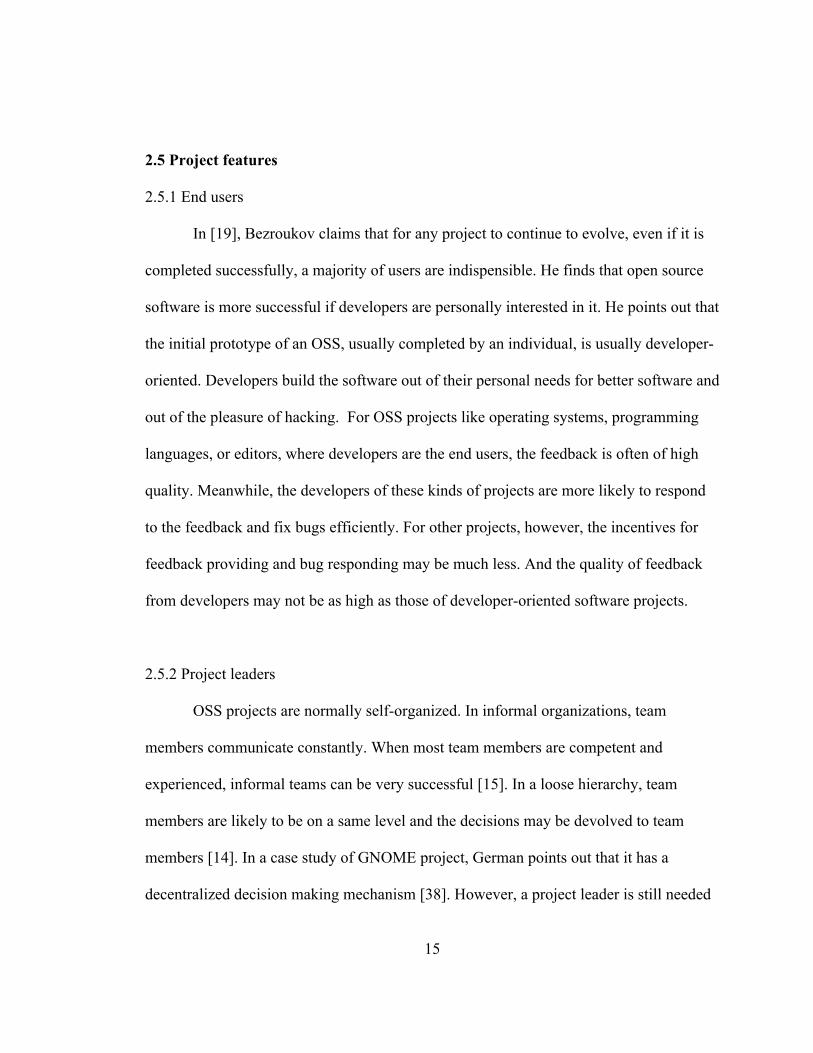
Most OSS teams are self-organized [16]. Team structure is like an onion [8], as
shown in Figure 1 (adapted from [16]). The most inner circle comprises the core
developers. Then the co-developers (the non-core team) make up the second layer. Then
outside co-developers are the active users. And the outermost and largest number of
actors are passive users.
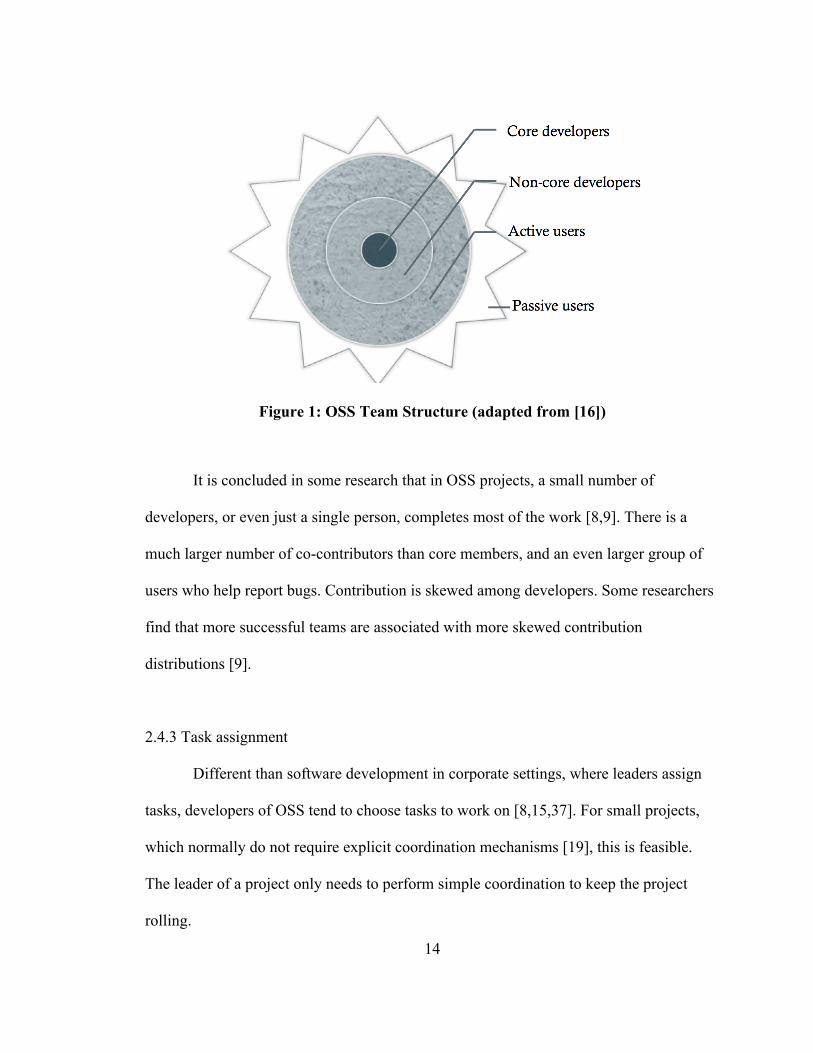
14
Figure 1: OSS Team Structure (adapted from [16])
It is concluded in some research that in OSS projects, a small number of
developers, or even just a single person, completes most of the work [8,9]. There is a
much larger number of co-contributors than core members, and an even larger group of
users who help report bugs. Contribution is skewed among developers. Some researchers
find that more successful teams are associated with more skewed contribution
distributions [9].
2.4.3 Task assignment
Different than software development in corporate settings, where leaders assign
tasks, developers of OSS tend to choose tasks to work on [8,15,37]. For small projects,
which normally do not require explicit coordination mechanisms [19], this is feasible.
The leader of a project only needs to perform simple coordination to keep the project
rolling.
15
2.5 Project features
2.5.1 End users
In [19], Bezroukov claims that for any project to continue to evolve, even if it is
completed successfully, a majority of users are indispensible. He finds that open source
software is more successful if developers are personally interested in it. He points out that
the initial prototype of an OSS, usually completed by an individual, is usually developer-
oriented. Developers build the software out of their personal needs for better software and
out of the pleasure of hacking. For OSS projects like operating systems, programming
languages, or editors, where developers are the end users, the feedback is often of high
quality. Meanwhile, the developers of these kinds of projects are more likely to respond
to the feedback and fix bugs efficiently. For other projects, however, the incentives for
feedback providing and bug responding may be much less. And the quality of feedback
from developers may not be as high as those of developer-oriented software projects.
2.5.2 Project leaders
OSS projects are normally self-organized. In informal organizations, team
members communicate constantly. When most team members are competent and
experienced, informal teams can be very successful [15]. In a loose hierarchy, team
members are likely to be on a same level and the decisions may be devolved to team
members [14]. In a case study of GNOME project, German points out that it has a
decentralized decision making mechanism [38]. However, a project leader is still needed

16
to make strategic decisions. As Bezroukov[19] claims, open source may look democratic,
but it is actually not. Linux itself is actually the best example. The creator of Linux, Linus
Torvalds, has the authorization of rejecting any patches. He controls the Linux kernel.
For any project to survive, particularly in its early stages, a determined and committed
leader is crucial [19]. As for how leaders are selected, studies show that they are
recognized if they are technologically outstanding. These leaders are emergent rather than
nominated [35].
2.5.3 Partnerships
A lot of civic open source software involves partnerships. Code for America
explicitly suggests that all brigades partner with the local governments and communities
[39].
Since civic open source software is for the public good, partnering with city
agencies, NGO or advocacy groups is a great way for civic technologist to know what
problems truly need to be addressed, how to better envision a solution and how to get
access to the best data. Also, partnerships help motivate volunteers of civic open source
software. If the partners exist, the applications they develop are more likely to be used
and publicized through partners.
However, as Lee et al. [20] suggest, within the city governments, there are many
barriers to perfect cooperation with the civic groups, such as the overworked employees,
susceptibility to scrutiny, and procurement legislations of the civic agencies.
Communications between governments and developers are limited. If city agencies are

17
restrained from involvement in the development phases, chances are they will not adopt
or further invest in the software applications [20].
2.5.4 Team size
Eric Raymond [17] claims that one important reason for good quality of OSS is
the number of developers and users—“given enough eyeballs, all bugs are shallow”. In
[8], Mockus et al. claim that the core team size of OSS is not larger than10-15 people.
And a much larger group of co-developers repair defects.
Klug et al. [9] find that although team success is not explained by team size alone,
team size is a significant predictor of team success. Teams of ten core team members are
300% more likely to succeed than teams of just one core team member.
2.6 Requirement engineering
The requirement engineering practices of Open source software radically contrast
the conventional requirement elicitation processes of proprietary software development.
In a case study of the Firefox web browser, John Noll [40] believes that in OSS
development, developers assert requirements instead of eliciting requirements from target
users. Some other research also reports the same phenomenon [41]. Apart from being
asserted based on developers’ personal experience or knowledge of the user needs,
requirements also derive from bug reports, requests for better usability, or competitions
of similar software [40,42]. According to the requirement gathering process of the
Mozilla project described in [42], decisions of including certain functionalities or changes
18
are based on discussion of bug reports. In the Mozilla project, anyone is welcome to
implement a desired change. And interestingly, it is almost certain that it will be accepted
to the code base once it is implemented.
Developers of OSS usually start with building software they need themselves
[43]. As they are the end users, they have strong domain knowledge of the software
requirements, which contributes significantly to the success of the project. But this is
only true for advanced OSS that target at developer users. When developing OSS for less
technical users, not using traditional requirement elicitation methods might pose risks of
poor usability [44]. End users might not understand the technical terminology or user
interface presented in the software by developers as a result of lack of user-centered
design expertise. In light of these problems, Henderson believes that many traditional
requirement elicitation methods could be adopted by OSS as a supplement [45].
In a series of interviews of developers of civic apps, Ermoshina [25] finds a
pattern for the way that civic apps are transformed from experience into apps. That is,
they normally begin with a personal problem. Then it is converted to an universal
solution, which can be implemented through an application. However, it might not
always be the case that these apps have a high civic benefit level [20]. Many challenges
truly facing the local governments or NGOs are unknown or neglected by developers.
Without thorough and effective communications between government agencies and the
developers, it is hard for the developers to come up with a solution that really helps
complement public services.
19
After several years of evolving of civic tech, developers, as Lee et al. [20]
indicate, are more exposed to civic needs and the civic agencies are involved earlier in
the software life cycle. Accurate problem descriptions of current challenges are presented
to developers. In addition, the data repositories and expected features that the software
would need are also provided. Developers are more informed when partnering with
governments, NGOs or other advocacy groups that the software targets[20].
2.7 Development process
A number of studies describe the OSS development process based on interviews
of core developers, email archives of their source code change history, bug tracking
systems or communications history [8,42,46].
Mockus et al. [8] describe the development process of the Apache server based on
a description drafted and fact-checked by core team members of the Apache server
project. They reveal a special development and decision-making process, including the
email lists and a quorum voting system. The Apache project has an Apache Group (AG),
an organization of core developers, who are identified and nominated among the
community. As the authors of [8] describe, each developer goes through the following
processes during the software development — identifying a problem, deciding who will
implement code to solve the problem, finding a solution, writing the code, requesting the
AG to review changes, and finally committing to the repository.
20
2.8 Success measures
To discover what makes an OSS project successful, we need to first define the
meaning of success in civic open source software. There is some research analyzing the
success measures for OSS and civic technology [47,12,9].
Success measurement for OSS is a multidimensional construct. It is used
according to the specific cases. Researchers have been focusing on the system process,
activity level and the impact on individuals [47]. Lee et al. [13] develop an OSS success
model drawing on the features of OSS and a classic information system success model.
They summarize five measures for OSS success—“Software quality”, “Community
service quality”, “OSS use”, “User satisfaction”, and “Individual net benefits” [13]. In
[12], researchers find that some success measures are inter-related.
Crowston et al. [47] examine the validity of applying the success measures used in
information systems research in the free/libre open source software (FLOSS) context.
After reviewing the success measures in literature and analyzing the different process
models of general information system and FLOSS, they provide a series of measures of
FLOSS effectiveness and suggestions on how to operationalize them. These measures
are: Project output, which has indicators such as progress of a project and developer
satisfaction; Process, which is indicated by the number of developers, activity level,
release cycle, and the time interval to implement features; Outcome for project members,
which has indicators including career opportunities and reputation gaining.
Gasser and Scacchi [6] provide a summary of characteristics of empirical OSS
studies. They identify the different objects of the studies, their corresponding success
21
measures and the drivers of the corresponding measures. The most relevant research
object they have identified is the software process, measured by project efficiency and
adaptability to changes.
2.9 Determinants of success
2.9.1 End user
If developers or other team members are end users of the software themselves, the
requirements engineering will be easier and more efficient as they know what they need
and can develop quickly with high quality [16]. The project itself, if is something used by
developers, suggests potential high quality of the OSS.
2.9.2 “Onion” team structure
Mockus et al. [8] have made a hypothesis that even for a project that has a strong
core team, if it cannot attract a large quantity of co-developers, the project will fail due to
the lack of people helping with bug fixing or implementations of small features. The
success of Apache server also shows that a magnitudinal larger number of users who help
find and report bugs are correlated with the quality of the software [8]. Therefore, the
team structure could be a factor that impacts the success of the project.
2.9.3 Partnership, life cycle phase, and activity level
Stewart and Ammeter find that sponsored projects are more popular (popularity
operationalized as the number of subscribers to the projects and the traffic level of the
22
project’s website) than non-sponsored projects, but project vitality is not affected by
sponsorship [7]. Wynn [48] finds that the level of fit between the project life cycle phase
and the project characteristics is another factor that affects the project success.
Subramaniam et al. [12] find that the current project activity levels influence the
subsequent activity levels. Stewart and Ammeter [7] find that projects in the alpha stage
show greater increases in popularity than those in mature stage.

23
Chapter Three: Research Method
We conduct an anonymous online survey to collect the data. Survey items
include demographics, features of civic open source software projects, team dynamics,
software engineering practices and volunteers’ perceptions of the projects. The survey is
distributed through anonymous links to all brigade members across the United States.
Data is collected in Jan 18th – Mar 27th 2018.
3.1 Survey distribution and respondents
The survey was sent out to all 63 brigades of CFA. We obtained the
comprehensive list of brigades of Code for America from the Code for America website.
And we got the contact information of brigade leaders, brigades’ Slack channels, and
their social media account names from a shared brigade contact directory and with the
help of CFA full-time staffs. The survey was posted in TWICT (this week in civic tech)
newsletter in February, which is maintained by CFA and subscribed by many brigade
members. The anonymous survey link was first sent via email to all brigades leaders
along with the request for them of helping send out the survey to their brigades. Then, to
publicize the survey as much as possible, it was posted in CFA and brigades’ Slack
channels (the main team communication tools used by most brigades), brigades’
Facebook pages, twitter accounts and meetup pages. Anyone who has ever participated in
24
the software application development projects, no matter they were active or not at the
time of seeing the survey, is welcome to fill it out.
Within an approximately two-month time frame, we got 143 responses. It is worth
noting that a non-response bias exists in our data, which limits the generalizability of the
results. The locations, roles of volunteers in the brigades, and brigades members’ limited
access to the survey are the major reasons for the non-response bias. We will discuss
these limitations in detail in Chapter 5. From all the responses we have got, we removed
responses for which the completeness is less than 50%. This left 115 observations.
Respondents of the survey include all actors in the civic open source software
ecosystem—brigade captains/co-captains, developers, designers, project managers, and
government or community partners. They are all integral parts of civic OSS and provide
important viewpoints for us to find the insights regarding our research questions.
3.2 Survey questionnaire
Questions in the survey are mostly multiple choices with options for free form
answers. The survey takes 8-10 minutes to complete.
Since members of brigades might have been involved in multiple projects or have
engaged in more than one brigade, respondents are asked to identify a project (a civic
open source software application) they have participated in and base their answers on that
project. Explicitly asking them to identify a certain brigade and a certain project helps
avoid repeated or noisy data.
25
The survey consists of five parts, which include motivations of volunteers, team
dynamics, software development practices, and their perceptions of the projects. In terms
of the inferential statistics analysis, the survey questions contain response variables
(willingness to continue his/her participation in the project, satisfaction level, and project
progress rate), and explanatory variables (demographics, team size, team partners, and a
number of other items) that could possibly explain the response variables.
The first part asks respondents about demographics, motivations and context-related
information:
• The brigade that they are volunteering in or have volunteered in
• Gender
• Current activeness status
• Length of their engagement
• Frequency of his/her participation in the project
• Roles in the project
• Primary role in the project
• Whether he/she is a core team member
• Interest in the technology
• Motivations
The second part is about the features of projects:
• Whether he/she is the target end user of the software application
• The initial status when he/she first joined the project
• Whether the project is well led
26
• Whether there is a government or community partner involved
• Whether the MVP (minimum viable product) is completed
The third part consists of questions about team dynamics. We ask:
• Size of core team and non-core team
• Number of male and female team members
• Communication frequency within team
• Primary team communication means
• Team communication effectiveness
The fourth part of the survey contains questions about the software engineering
practices:
• Team-partner communication effectiveness
• Requirement elicitation means
• Requirement elicitation frequency
• Requirement documentation
• How, when and how often partner is involved
• Systematic software architecture or component design
• Documented user interface
• Task assignment
• Development centrality (how contribution is distributed)
• Time interval for substantial project progress
The last part of the survey consists of questions regarding volunteers’ perceptions of
the project. We ask:
27
• Level of civic benefit
• Whether the software will be completed and used
• Self-efficacy
• Willingness to continue his/her participation (if he/she is active at the time of
taking this survey) or return to participate in the project (if he/she is not active at
the time of taking this survey)
• Reasons for leaving (we ask those who were not active in the brigades at the time
of taking the survey)
• Overall satisfaction level of the project.
Lastly, we ask the respondents an open question about their comments regarding
participating in the projects or the survey. The full survey questionnaire is listed in the
Appendix.
3.3 Data analysis method
After obtaining the raw data, data cleaning is conducted to prepare for analysis.
We check the accuracy of the data, change data format, and assign each question a
“variable” name to represent the item. All data cleaning, analyses and visualizations are
conducted using the R programming language and software environment (version 3.4.3).
In the analysis, descriptive statistics are used to provide a view of the data
features. Along with it, we use graphics to help with the visualization of the descriptive
data. We also use inferential statistics method to infer from the sample data the

28
associations between the project features, team dynamics and the success measures, and
discover the antecedents of the success of the project.
For inferential statistics analysis, we first use multiple imputation to handle the
missing values. Multiple imputation is an increasingly adopted method used in research
to help fully utilize the recorded data and avoid introducing a substantial amount of bias.
Among our 115 observations, 71.3% are complete. As for the percentage of missingness
in the variables (survey items) that are used in our inferential analyses, the results are
shown in Table 1.
Variable Missingness Partner.presence 0.9% Participation.frequency 0.9% Team.communication.frequency 6.1% Female.number 5.2% Core.team.size 6.1% Team.communication.means 8.7% Team.communication.effectiveness 8.7% Project.progress.efficiency 14.8% Interest.of.tech 1.7% Will.be.used 0.9% Self.efficacy 7.8% Willingness.to.continue 0.9% Satisfaction 3.5%
Table 1: Missingness of Variables
The MICE package for R is used in our study. In this package, to impute
categorical variables with more than 2 levels, “polyreg” (Bayesian polytomous
regression) is used. And to impute ordered categorical variables with more than 2 levels,
“polr” (Ordinal logistic regression) is used. We specify an imputation model for each
variable and impute data on a variable-by-variable basis. In total, we create 10
predictions for each missing value.

29
After we get the 10 fully imputed data sets, Spearman’s rank correlation test,
simple linear regression, and Fisher’s exact test are performed to test our hypothesis. In
our analysis process, if both variables are ordinal variables, we use Spearman’s rank
correlation coefficients and simple linear regression on the ranks of both variables to test
the correlations. If one of the variables is nominal but the other variable is ordinal, we
treat the ordinal variable as nominal variable and use Fisher’s Exact test to test the
independence of the two values. If both variables are nominal, we use Fisher’s Exact test.
To identify predictors of success of civic OSS, we use Ordinal logistic regression.
Ordinal logistic regression is an extension of binary logistic regression. It is used when
the dependent variable is an ordered categorical variable. This model fits our data and
research questions in that we want to discover what factors affect the success measures,
which are ordered categories in our case. After we conduct the analysis on 10 imputed
data sets separately, the results are combined using Rubin’s rule.
30
Chapter Four: Findings and Results
As we specified in Chapter 3, the inferences are limited by the non-response bias
and therefore should be used with caution. The descriptive results of the analysis are
presented in section 4.1- 4.4, where we report the results of the development practices
such as how teams communicate with partners, what the requirement elicitation process
is, and whether the project has systematic design and development centrality of the team
members. The results of inferential analysis are presented in section 4.5. In this section, a
conceptual model capturing groups of variables is presented. Our hypotheses are tested
and the predictors of the success measures are explored. (As there are some items that
allow more than one answers, we do not impute these items. Therefore, the results in
section 4.1-4.4 are based on the 115 observations without imputation. The results in
section 4.5 are combined results based on imputed data sets.)

31
4.1 Demographics and context-related information
4.1.1 Brigade locations
Figure 2: Brigades
The geographic locations that the respondents represent are quite dispersed, while
certain brigades provide more responses. Code for Denver, DC, Atlanta, and Boulder
have 22,11,7, and 6 responses respectively. This is partly due to the fact that we are based
in the Denver area. And the size of the brigades, the extent that the leaders promote the
survey and the activity level of brigades influence the survey response rate across
different brigades.

32
4.1.2 Gender and roles
Among the 115 observations, 63% are males, and 32% are females. 103 respondents
are currently active in the projects, while 12 are not.
Figure 3: Primary Role and All Roles
Figure 3 shows the distribution of respondents’ primary role and all roles they take.
33 respondents are brigade captains/co-captains. There are 19 front-end developers and
33
18 back-end developers respectively. 13 respondents are product managers and 10 are
government/community partners. A few respondents are UX designer or testers.
In CFA brigade projects, members may share multiple roles. As shown in Figure 3,
compared to the counts of each “Primary role”, the counts of “Roles” at least double
(except for “brigade captain/co-captain”), which means that most of them take on
multiple roles in the projects. Testing and documenting are the two roles that significantly
soar when respondents choose all roles they take. This indicates that testing and
documenting are mostly shared by team members.
As for the reason why the number of “brigade captain/co-captain” for “Roles” is less
than the number for “Primary Role”, we find that some respondents do not include
“brigade captain/co-captain” in their answers to “All Roles” even though they identify
“brigade captain/co-captain” as their primary role. It might be due to the gap of the
understanding of the questions between respondents and us as survey designers. This
accountability issue is also discussed in Chapter 5.

34
4.1.3 Length of involvement and participation frequency
Figure 4: Length of Involvement
Lengths of engagement vary from less than three months to more than five years, as is
shown in Figure 4. It is worth noting that the highest percentage of length is 3-5 years,
which might not represent the actual distribution of such length of involvement among
brigade members. This might be due to the fact that we sent survey directly to the brigade
captains and posted it in their slack channels. Brigade leaders usually are involved for a
relatively long time, and might be more interested in taking the survey.
As for the frequency of members’ participation, 37.9% come to the meetup once a
month and 40% once a week, which together account for 77.9% of all respondents. There
are 6% respondents who come to the meetup more than twice a week. We ask those

35
respondents how many hours per week they spend on the projects. 3 of them spend 6-15
hours, 3 of them spend 16-25 hours and 1 respondent, who is a brigade captain/co-
captain, spends even more than 25 hours every week.
4.1.4 Core team member
Among the respondents, 70.4% consider themselves as core team members, while
14.8% do not think so. 14.8% choose “maybe”, suggesting that they are not sure how
significant their work is to the whole project.
4.1.5 Interest in the technology
From our observations and what the literature has revealed, learning new skills
and sharing skills are important motives for developers to participate in the “conventional
OSS” and the civic OSS development. Therefore, we want to know if developers and
other team members are interested in the technology being used in the projects and how
this factor may affect the project.
We ask respondents their interest level using a 5-level Likert scale (ranges from
“very uninterested” to “very interested”). Among all the respondents, 37.4% are very
interested in the programming languages, frameworks or other technologies used by the
project, while 23.5% are interested, 18.3% are neutral, 10.4% are not very interested, and
6.1% are very uninterested. Specifically, we are interested in the results from just front-
end and back-end developers. Among all the developers, 83% of them are very interested

36
or interested in the technology being used. Only 5.1% are not interested or very
uninterested.
4.1.6 Motivations
Figure 5: Motivations
From the results, we can see that 88 out of 105(83.8%) respondents want to help their
local communities. And there are 28(26.7%) people who want to solve a problem that
cannot be solved by commercial product. This is a reflection of the motives found in the
voluntary actions in community work [3]. On the other hand, 54(51.4%) people want to
improve technical or management skills. And 40 (38.1%) respondents want to share their
knowledge and skills through volunteering in the projects. These two motives show their

37
strong motivations to work in teams. Some respondents also report that they are
motivated because they treat it as a social activity or want to make career advancements.
We also ask those who are not active in the projects at the time of taking the survey
why they have left the projects. 12 respondents are inactive and provide the reasons.
Results vary a lot. Limited time, skills mismatch/low self-efficacy, and poor project
vitality are the top reasons that discourage volunteers.
Figure 6: Reasons for Leaving

38
These responses shown in Figure 6 indicate that project features, such as
leadership, support from partner, vitality, and volunteers’ personal factors, such as self-
efficacy, are reasons that volunteers leave, and we can logically infer that, they are also
important candidates to be considered as the factors that affect project success.
4.2 Project features
4.2.1 End user
Researchers have revealed that the developers of “conventional OSS” are
normally end users of the software product, which is an important reason for their success
even though they do not practice rigorous requirement engineering process. Therefore,
we are interested in knowing whether the developers and other team members are the end
users of the civic OSS projects. We want to compare these projects with “conventional
OSS” and see if this could be a factor affecting the success of civic OSS.
Figure 7: End User

39
Figure 7 shows that among all respondents, 46% are not the end users, while 35%
are the end users. 19% say that they may be the end users. In particular, we want to know
the results among developers. Our results show that only 32% of the developers are target
users. This suggests that the majority of the civic OSS projects are not specifically
targeting at software developers or technical users.
Developers may be the end users of the software because it helps their personal
lives or because it is a software development tool (i.e. an operating system, a
programming language, or a web development framework) that they need in their
programming work. Good “conventional OSS” tends to be started by developers who
“scratch their personal itches” [55]. Our results show that few developers are the end
users of the civic tech that they participate in.
4.2.2 Project phase
CFA brigade projects adopt Agile software development methodology, where
software development phases are iterative and interwoven. We ask respondents to choose
the project phases (they can choose multiple answers in that a project can be under
multiple phases at the same time) when they initially joined it. As shown in Table 2, 79
out of the 115 (68.7%) respondents joined the project when it was under the initial
planning phase, or initial planning together with software design, implementation and
other phases. This is consistent with the literature and our observation that people are
more likely to be attracted to a project that is in its early phase. In the alpha phase of a
40
project, participants can get a greater sense of achievement and learn new skills fast since
a new project requires a lot of break-through work.
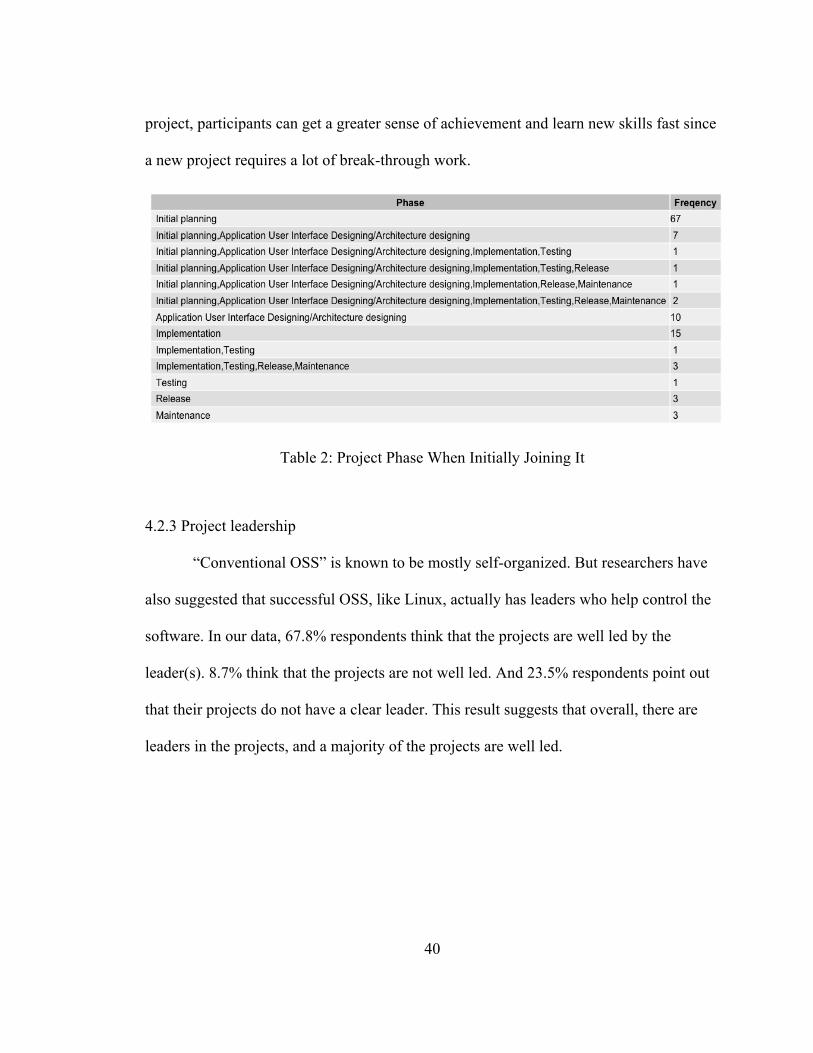
Table 2: Project Phase When Initially Joining It
4.2.3 Project leadership
“Conventional OSS” is known to be mostly self-organized. But researchers have
also suggested that successful OSS, like Linux, actually has leaders who help control the
software. In our data, 67.8% respondents think that the projects are well led by the
leader(s). 8.7% think that the projects are not well led. And 23.5% respondents point out
that their projects do not have a clear leader. This result suggests that overall, there are
leaders in the projects, and a majority of the projects are well led.

41
4.2.4 Project partner
Figure 8: Existence of a Government/Community Partner
We observe that 78.1% respondents’ projects have a government/community
partner. This is consistent with what CFA advocates—work with local government and
community organizations, from whom they will get access to more data and know the
major challenges facing the community. From our observations of the projects of Code
for America brigades, participants work with city servants and citizens affected by the
problems to gather requirements and form a solution. The existence of a
government/community partner not only provides requirements, but can also help team
members form a feel that their project will be used (Hypothesis 3). We will show the
result of the hypotheses tests in section 4.5.2.

42
4.2.5 Project MVP
From our observation, most CFA projects are ongoing. Minimum viable product
(MVP) is an important milestone for CFA projects to mark their achievements. Our data
shows that 57.3% of the respondents choose to report on a project that has already
reached its MVP milestone. 28.1% report that the MVP of the project that they choose
will soon be completed. Only 14.6% of the respondents say that the MVP of the project
of their choice is not completed or they do not know.
Figure 9: MVP Completion
4.3 Team dynamics
4.3.1 Core and non-core team size
As reviewd in the literature, successful OSS tend to have a core team of less than
or equal to 10-15 developers, who will create about 80% of the new functionalities. In
43
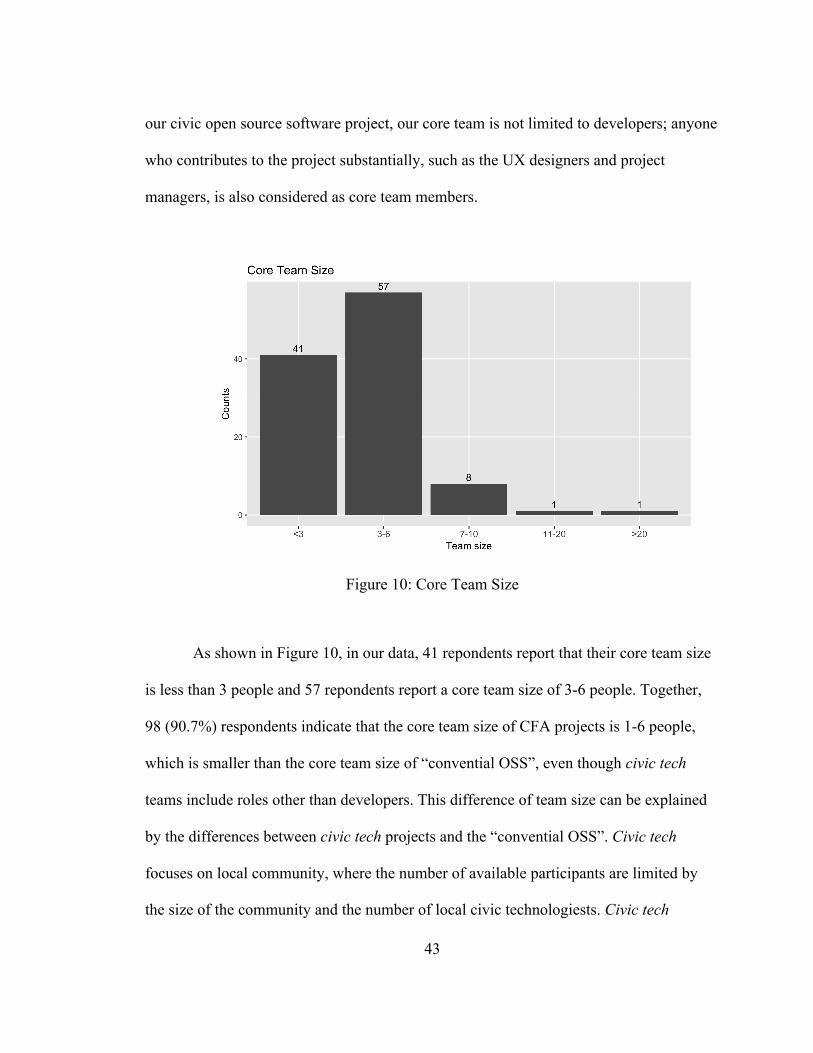
our civic open source software project, our core team is not limited to developers; anyone
who contributes to the project substantially, such as the UX designers and project
managers, is also considered as core team members.
Figure 10: Core Team Size
As shown in Figure 10, in our data, 41 repondents report that their core team size
is less than 3 people and 57 repondents report a core team size of 3-6 people. Together,
98 (90.7%) respondents indicate that the core team size of CFA projects is 1-6 people,
which is smaller than the core team size of “convential OSS”, even though civic tech
teams include roles other than developers. This difference of team size can be explained
by the differences between civic tech projects and the “convential OSS”. Civic tech
focuses on local community, where the number of available participants are limited by
the size of the community and the number of local civic technologiests. Civic tech
44
projects tend to focus on involving local people to volunteer, not attempting to get more
volunteers from other areas online, although the repository is public. And those outside
the certain community might not be interested enough to join the projects. Additionally,
with the help of new web and mobile development frameworks, most of the applications
developed in CFA brigades are light weight, not requiring much advanced technical
skills. Therefore, the team size can still be considered fit and effective although they are
relatively small.
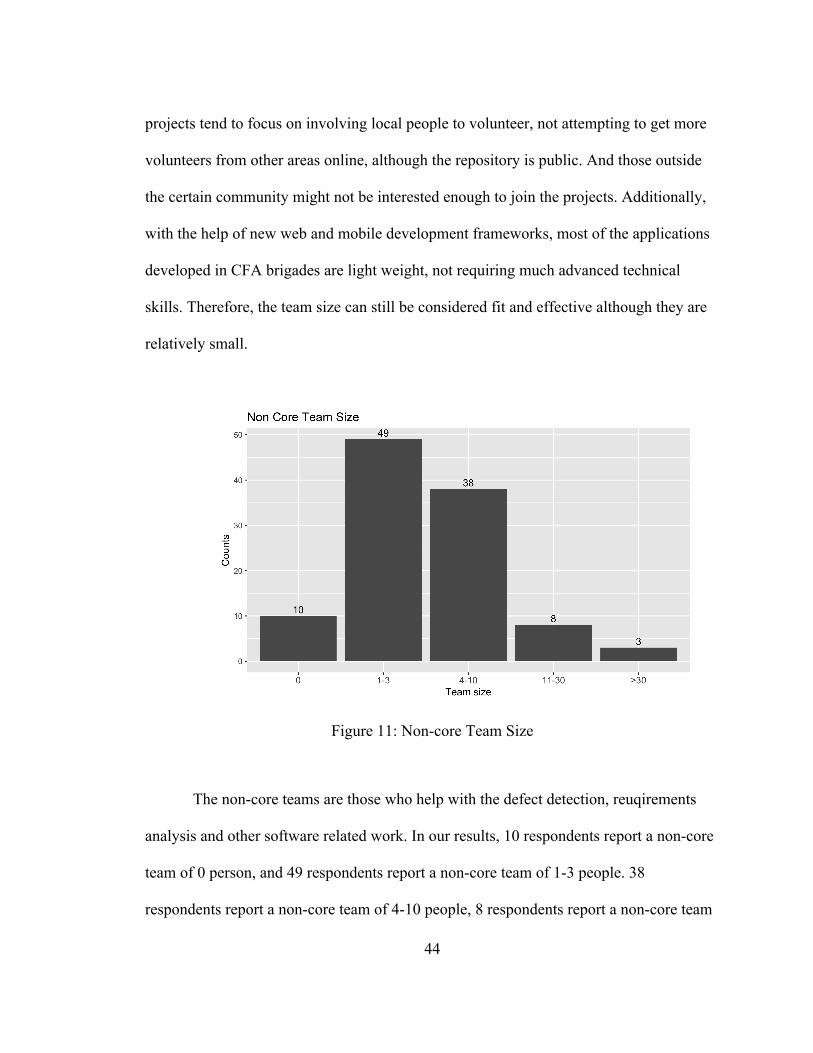
Figure 11: Non-core Team Size
The non-core teams are those who help with the defect detection, reuqirements
analysis and other software related work. In our results, 10 respondents report a non-core
team of 0 person, and 49 respondents report a non-core team of 1-3 people. 38
respondents report a non-core team of 4-10 people, 8 respondents report a non-core team

45
of 11-30 people, while 3 respondents report a non-core team of size over 30. As we can
see from the comparison of Figure 10 and Figure 11, there are slightly more non-core
teams of size over 10 people than core-teams of size over 10, but the pattern is not
obvious. In order to check the comparison of core-team size and non-core team size for
each project respectively, we create a cross tabulation of the data. Results are shown in
the Table 3.
Non-core team size
Core team size 0 1-3 4-10 11-30 >30 Total
<3 5 21 13 0 1 40
3-6 4 26 22 5 0 57
7-10 0 2 3 2 1 8
11-20 0 0 0 1 0 1
>20 0 0 0 0 1 1
Table 3: Core vs. Non-core Team Size
From Table 3, we can see that 5 out of 40 (12.5%) respondents report that their
core team size is less than 3 and they do not have any non-core team member. 21 out of
40 (52.5%) respondents report that their core team size is less than 3 and their non-core
team size is 1-3 people. For projects that have a core team of size 3-6, 4 out of 57 (7%)
respondents report that they do not have any non-core team member, while 26 out of 57
(45.6%) respondents report a non-core team of size of 1-3 people. These results show that
about a half of the projects do not have a larger number of non-core team members.

46
The literature suggests that successful OSS developments tend to have an “onion”
team structure. That is, they have a much larger group of non-core developers to fix bugs
and even a larger group of participants who report problems. Our survey results reveal
that for civic OSS projects in CFA, most projects do not have the same “onion” team
structure. In CFA projects, the majority of projects have 1-6 core team members. About
half of all projects have approximately a non-core team no larger than the core team, and
half of them have a slightly larger number of additional contributors than the core-team.
Few projects have a significantly larger group of non-core contributors like successful
“conventional OSS”. One of the possible reasons is that most CFA projects are under
development and are not released yet. There are no ways for these projects to get a very
large number of users to report bugs.

47
4.3.2 Team gender composition
Figure 12: Female Number vs. Male Number
We ask respondents how many males and females that their teams have
respectively. And we give them some range choices: 0, 1-3, 4-10, and 11-30. Referring to
Figure 12, which shows the distributions of the frequency of male number and female
number in each size group, we can see a pattern that in CFA brigade projects teams are
generally composed of more males than females. The mode of the distribution of female
number is 1-3 people, while the mode of the distribution of male number is 4-10 people.
9 respondents report that no female member is on their teams while no respondent report
0 male member on their team. 73 people report 1-3 female members on their team, while
42 people report 1-3 male members on their team. 26 people report 4-10 female members
on their team, while 61 people report 4-10 male members on their team. Only 1 person

48
reports 11-30 females on their team, while 6 respondents report 11-30 males on their
team.
4.3.3 Team communication
Team members in the brigades generally communicate frequently. 56.5% of the
respondents report that they communicate weekly or more frequent than weekly. Over
90% of the respondents communicate at least monthly.
Figure 13: Primary Team Communication Means
Figure 13 shows the primary team communication means. Different than the
“conventional OSS”, which almost exclusively uses email, version control system and
other electronic media to communicate (In early days of “conventional OSS”, there might
not be convenient team chatting applications such as Slack that can be used by OSS
teams), civic OSS projects in CFA brigades rely more heavily on face-to-face

49
communication and chatting applications, which are more spontaneous and less formal
than emails or VCS used in “conventional OSS”. 60% of the respondents report that they
primarily communicate through chatting application while 28.6% of the respondents
primarily communicate face to face. It reflects the fact that they are co-located and their
communications involve more informal discussions. These communication means appeal
to some participants’ motivations of sharing knowledge, hanging out with like-minded
civic hackers, and gaining reputation within the community. They also facilitate solving
implementation issues of the projects.
Figure 14: Team Communication Effectiveness
From the Figure 14, it is observed that 49.1% of the respondents think that their
teams have moderate effectiveness in their communications, while 35.2% of the
respondents report that their teams communicate very effectively.
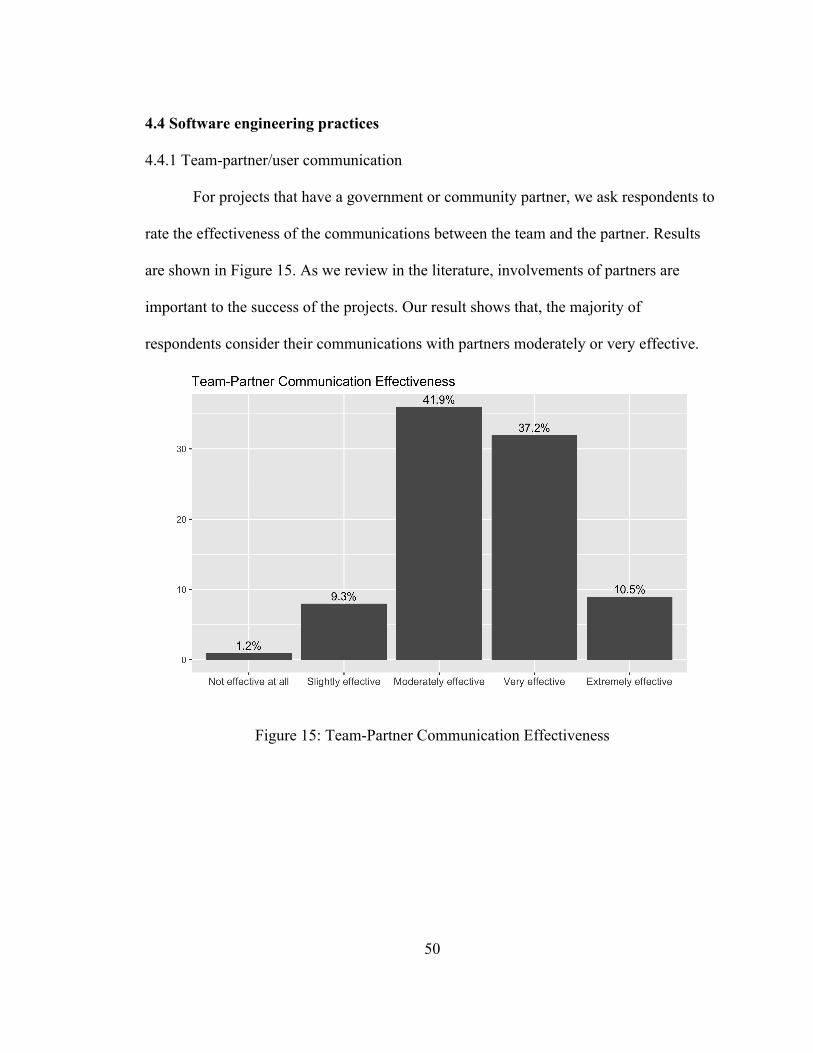
50
4.4 Software engineering practices
4.4.1 Team-partner/user communication
For projects that have a government or community partner, we ask respondents to
rate the effectiveness of the communications between the team and the partner. Results
are shown in Figure 15. As we review in the literature, involvements of partners are
important to the success of the projects. Our result shows that, the majority of
respondents consider their communications with partners moderately or very effective.
Figure 15: Team-Partner Communication Effectiveness

51
Figure 16: Team-User Communication Frequency
As for the frequency of the communications between the team and the target users
(“users” include organizational partners and individuals who will use the application), 29
respondents email users whenever they have questions regarding the requirements. 18
respondents indicate that their target users come to the meetups every time and they talk
in the meetup, while 14 respondents indicate that they talk to their target users whenever
they show up in the meetup. Among all the respondents, 17 never communicate with
users or only communicate with them during their initial pitch of the idea, which
indicates that the team asserts the requirements with their personal experience or
knowledge of the users. This is consistent with what researchers have discovered for the
OSS requirement elicitation. In the free form answers, one member indicates that users
are part of the development team and they communicate constantly. Another member
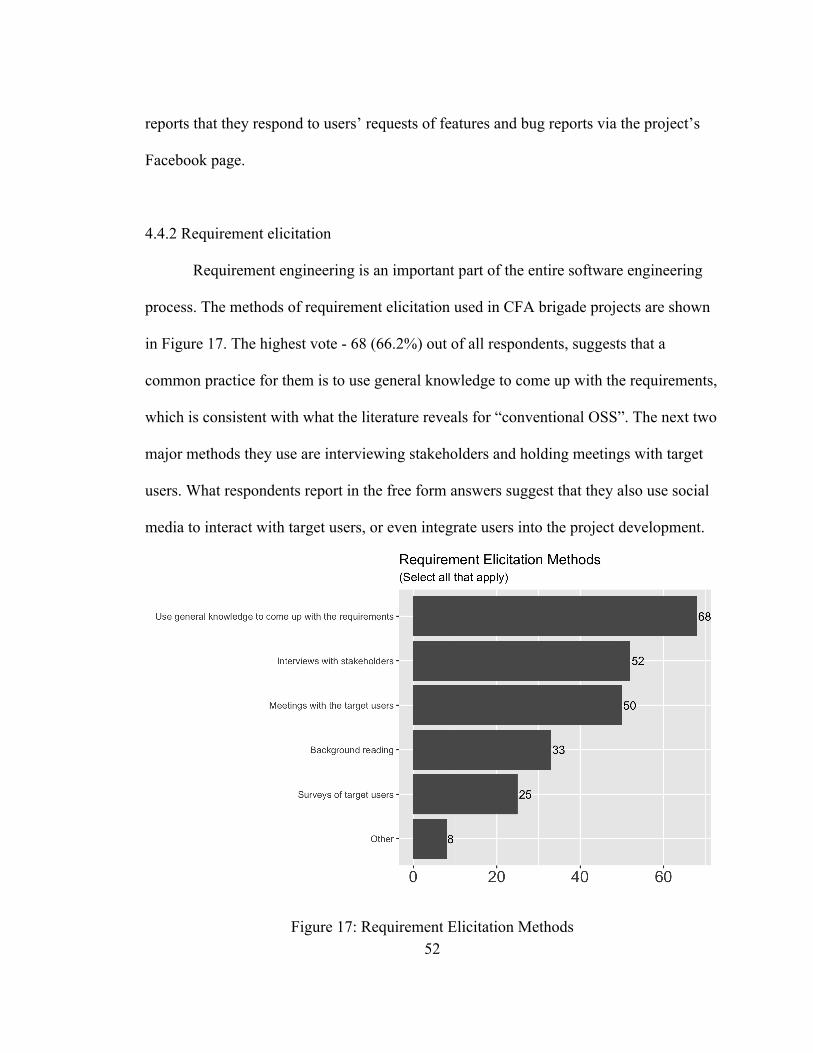
52
reports that they respond to users’ requests of features and bug reports via the project’s
Facebook page.
4.4.2 Requirement elicitation
Requirement engineering is an important part of the entire software engineering
process. The methods of requirement elicitation used in CFA brigade projects are shown
in Figure 17. The highest vote - 68 (66.2%) out of all respondents, suggests that a
common practice for them is to use general knowledge to come up with the requirements,
which is consistent with what the literature reveals for “conventional OSS”. The next two
major methods they use are interviewing stakeholders and holding meetings with target
users. What respondents report in the free form answers suggest that they also use social
media to interact with target users, or even integrate users into the project development.
Figure 17: Requirement Elicitation Methods
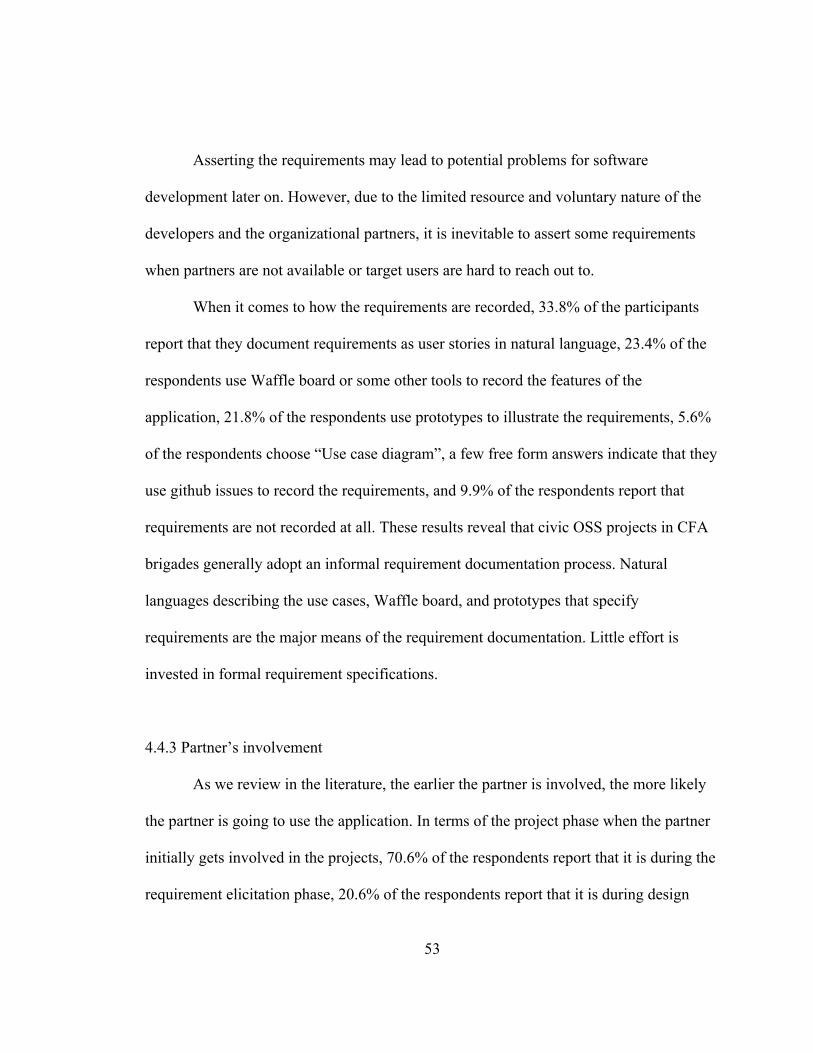
53
Asserting the requirements may lead to potential problems for software
development later on. However, due to the limited resource and voluntary nature of the
developers and the organizational partners, it is inevitable to assert some requirements
when partners are not available or target users are hard to reach out to.
When it comes to how the requirements are recorded, 33.8% of the participants
report that they document requirements as user stories in natural language, 23.4% of the
respondents use Waffle board or some other tools to record the features of the
application, 21.8% of the respondents use prototypes to illustrate the requirements, 5.6%
of the respondents choose “Use case diagram”, a few free form answers indicate that they
use github issues to record the requirements, and 9.9% of the respondents report that
requirements are not recorded at all. These results reveal that civic OSS projects in CFA
brigades generally adopt an informal requirement documentation process. Natural
languages describing the use cases, Waffle board, and prototypes that specify
requirements are the major means of the requirement documentation. Little effort is
invested in formal requirement specifications.
4.4.3 Partner’s involvement
As we review in the literature, the earlier the partner is involved, the more likely
the partner is going to use the application. In terms of the project phase when the partner
initially gets involved in the projects, 70.6% of the respondents report that it is during the
requirement elicitation phase, 20.6% of the respondents report that it is during design
54
phase. There are 9% of the respondents reporting that the partner is initially involved
during implementation, testing or release phase of the projects.
As for how often the partner is involved in the project, the results are dispersed.
From Table 4, we can see that most of them range from once a week, to less than once a
month.
Frequency %
Less than once a month 22.5%
Once a month 17.5%
Once in two weeks 18.8%
Once a week 26.2 %
Twice a week 1.25 %
More than twice a week 5%
I don't know 8.8%
Table 4: Partner's Involvement Frequency
The involvement of partners during the initial requirement elicitation helps steer
the direction of the software application. Although the frequency of the partner’s
involvement varies, about 69% of the projects meet every month or more frequent than
every month. Considering that most brigades meet weekly, or every other week, the
involvement of partners is quite frequent.

55
4.4.4 Software design
Figure 18: Systematic Architecture and Component Design
43% of the respondents report that their projects do not have a systematic
architecture or component design. We further retrieve the responses only from developer
respondents in that UI designer, tester, or project manager might not have idea about the
architecture design. Results are shown in Table 5. Nearly half of the developers report
that they do not have a systematic architecture or component design. And 19.2% of them
do not know if there is a systematic design.
No Yes I don't know
Developer 48.1% 32.7% 19.2%
Table 5: Developers' Knowledge of the Architecture and Component Design

56
The absence of extensive architecture design fits most of the software applications
in CFA brigades, although the ideal characteristics of an architectural design should
consider scalability, high cohesion and low coupling [15]. From our observations in Code
for Denver/Boulder and the civic tech project repositories [52], most of the projects are
web or mobile applications targeting at local community users rather than developer
users, which is also proved in our survey results shown in Figure 7. Therefore, most of
the projects simply use the existing popular MVC (model-view-controller) architecture,
or do some customization based on existing MVC pattern. In addition, since the
applications focus on local community, they do not have a very large user base, and
scalability and maintenance is not highly prioritized. This leads to little extensive
architecture design.
When it comes to whether the projects have documented interface design, 57% of
the respondents report that they have wireframes or prototypes to document their user
interfaces. 36.6% of the respondents indicate that they do not have these documented user
interfaces.
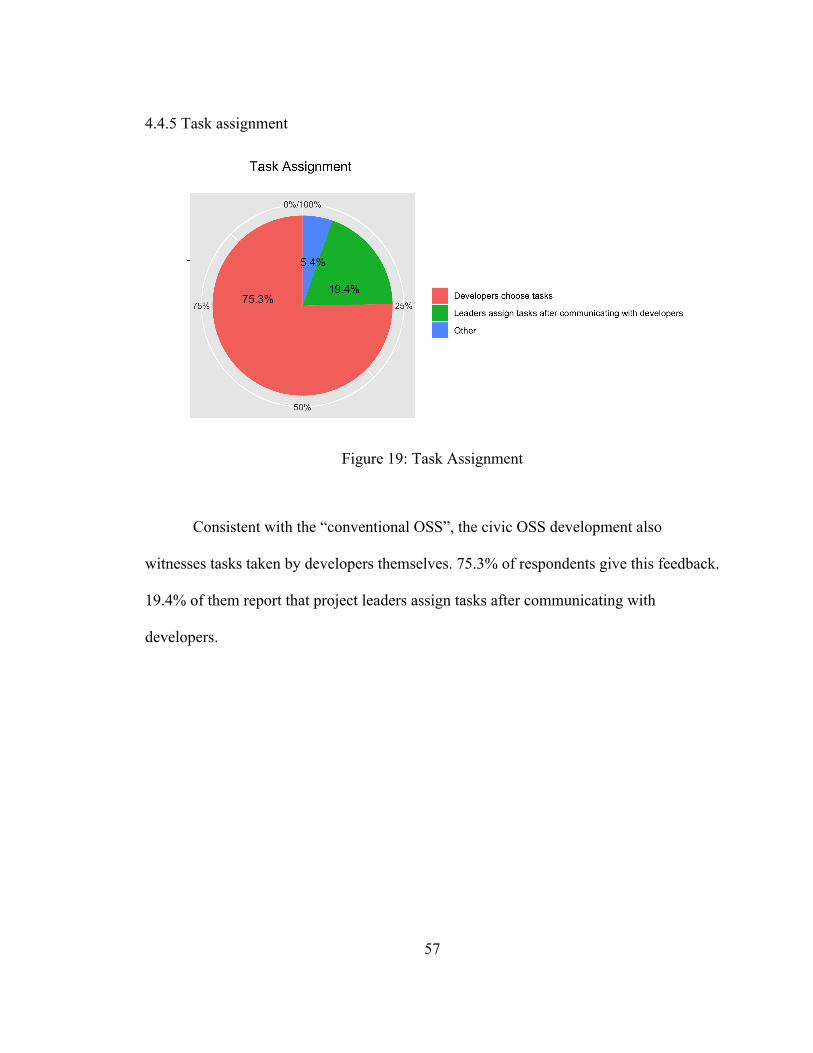
57
4.4.5 Task assignment
Figure 19: Task Assignment
Consistent with the “conventional OSS”, the civic OSS development also
witnesses tasks taken by developers themselves. 75.3% of respondents give this feedback.
19.4% of them report that project leaders assign tasks after communicating with
developers.

58
4.4.6 Development centrality
Figure 20: Development Centrality
The results of the development centrality among team members are also
consistent with the “conventional OSS”. 81.7% respondents report that a core team
develops most of the features while others help with bug detection, documenting or
peripheral feature development. In the free form answers, 3 respondents report that
everyone is equal in that they all contribute according to their skills or what are assigned
to them. A few respondents report that they have a strong mixture of active and inactive
developers. And a few respondents report that they are at initial planning phase and have
not had any experience with the distribution of contributions at the time of taking this
survey.
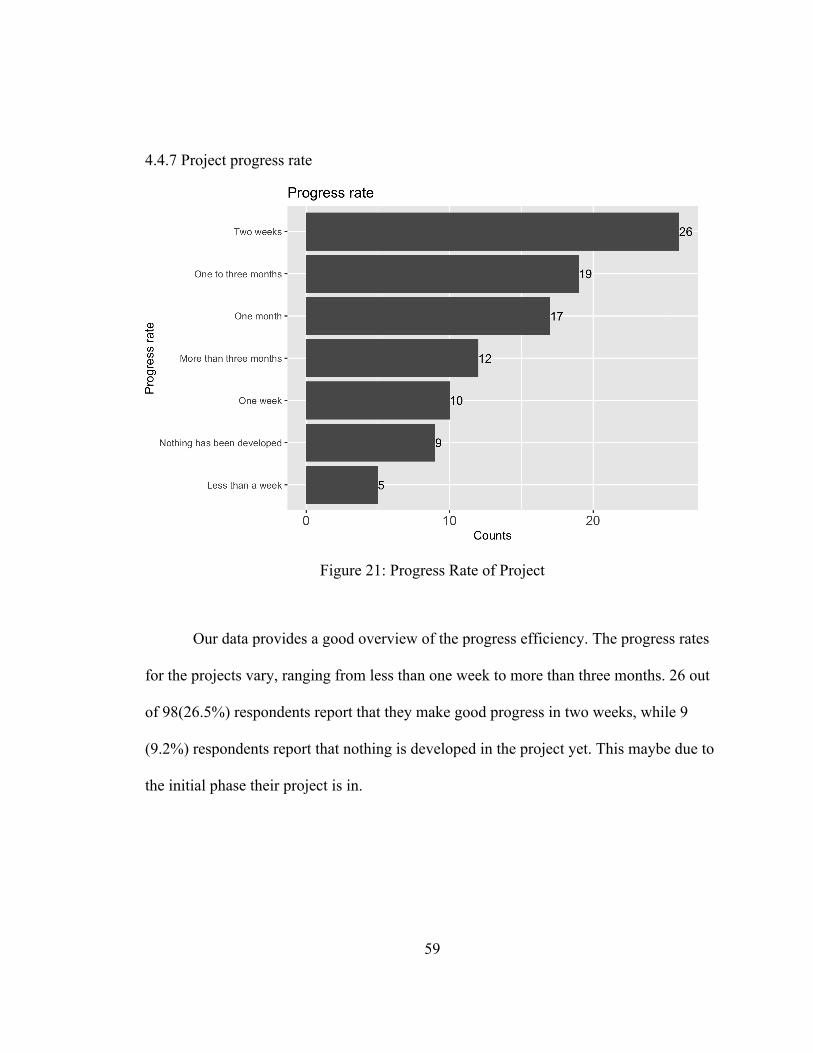
59
4.4.7 Project progress rate
Figure 21: Progress Rate of Project
Our data provides a good overview of the progress efficiency. The progress rates
for the projects vary, ranging from less than one week to more than three months. 26 out
of 98(26.5%) respondents report that they make good progress in two weeks, while 9
(9.2%) respondents report that nothing is developed in the project yet. This maybe due to
the initial phase their project is in.

60
4.5 Conceptual model, hypothesis test and prediction model
4.5.1 Variables and conceptual model
We convert our survey items to variables, group them into clusters and illustrate
the key dimensions in civic open source software with a conceptual model.
Predictor factors (Explanatory variables):
Volunteer input: whether the volunteer is the end user of the application, the level
of their interest in the technology being used in the application, whether the volunteer is a
core member, their self-efficacy (the degree they think they can contribute to the
application), and their participation level.
Project features: project size (the number of core team members), partner’s
involvement, and the level of public benefit of the project.
Team dynamics: whether the team is well led, gender composition of the team,
the primary team communication means.
Intermediate measures (Explanatory variables):
Volunteer’s perception: perception of whether the application will be completed
or will be used, their team communication effectiveness.
Success measures (Response variables):
System creation: team member’s satisfaction level, team member’s willingness to
continue in the project, and project progress rate.
We illustrate the potential relationships of the predictor factors, intermediate
measures and success measures in the conceptual model in Figure 22.
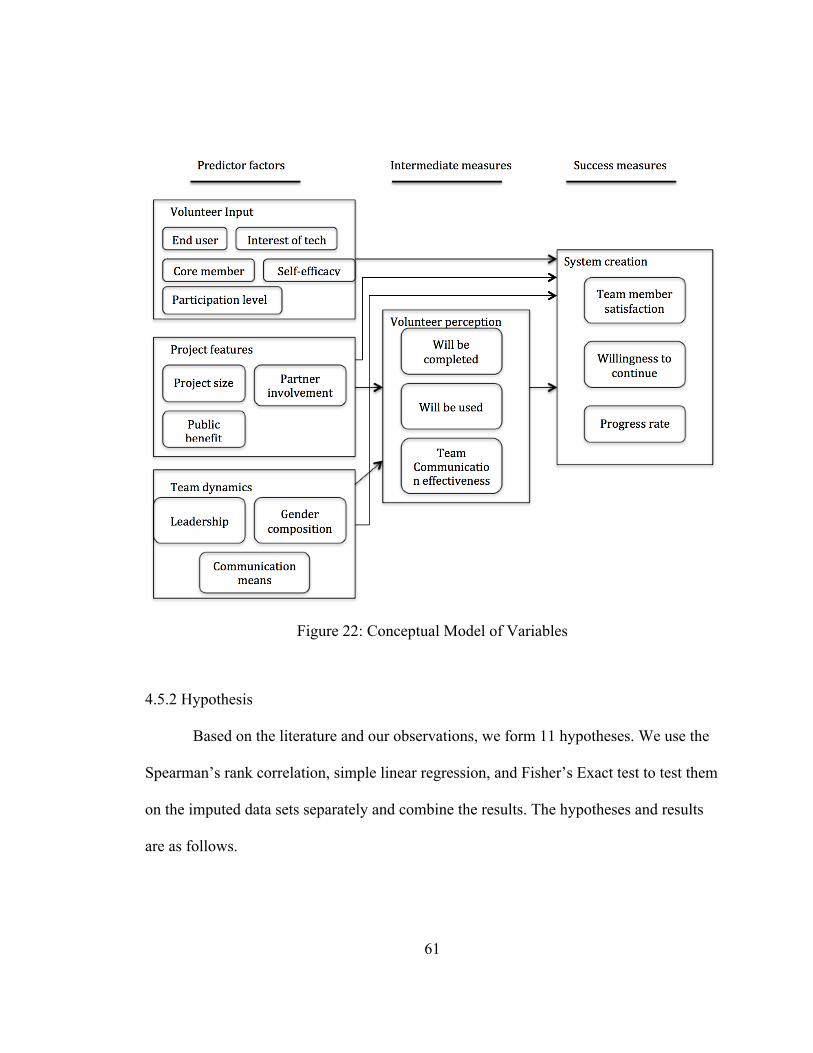
61
Figure 22: Conceptual Model of Variables
4.5.2 Hypothesis
Based on the literature and our observations, we form 11 hypotheses. We use the
Spearman’s rank correlation, simple linear regression, and Fisher’s Exact test to test them
on the imputed data sets separately and combine the results. The hypotheses and results
are as follows.

62
H1. Team member’s participation level and willingness to continue in the project
are not independent of him/her being an end user.
The range of the p-values of our Fisher’s exact tests between the team
member’s category of being an end user or not and the team member’s participation
frequency is from 0.009 to 0.03. The upper bound of the p-value is smaller than the
critical value 0.05, indicating the significance of the evidence. It suggests that team
member’s participation frequency is dependent of him/her being an end user of the
application. However, our result fails to provide evidence that the team member’s
willingness to continue in the project is dependent of him/her being an end user of the
software project that he/she participate in, with the p-values ranging from 0.18 to 0.67.
The lower bound of this range is greater than our critical value 0.05, indicating the lack of
evidence against the null hypothesis. Figure 23 and Figure 24 show the heat map of the
data points — End User versus Participation Level and Willingness to Continue. The
darker the color, the more frequent the data falls in that area.
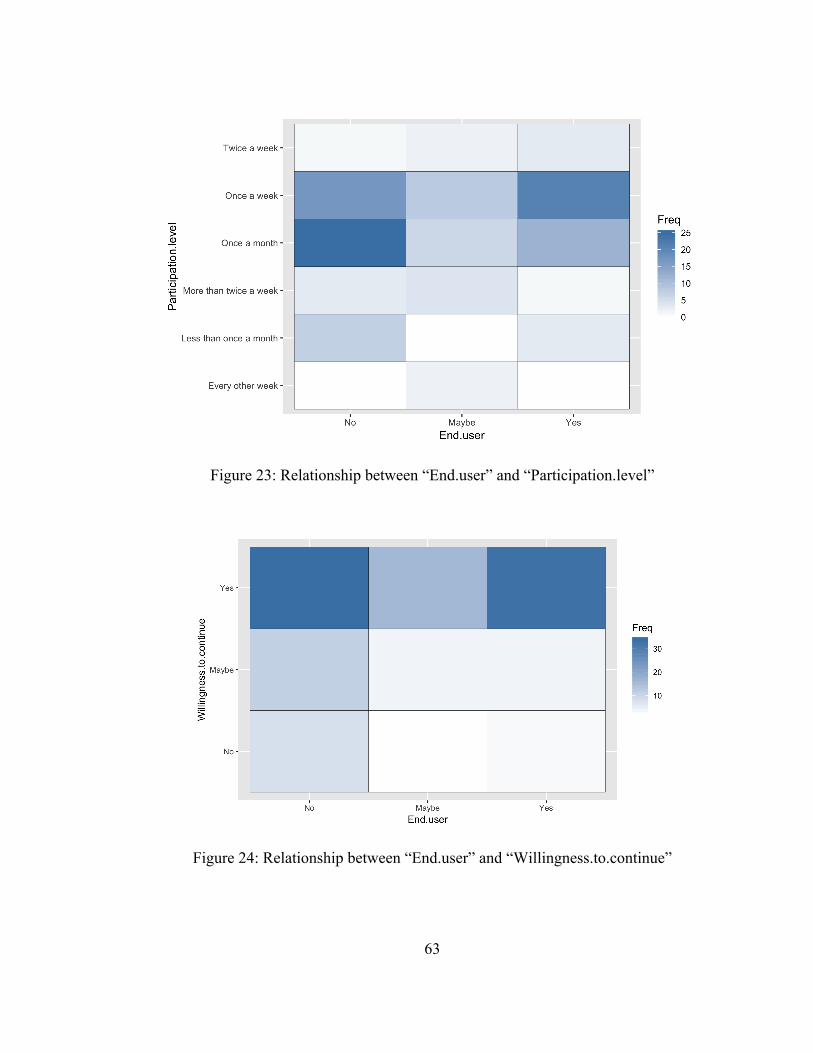
63
Figure 23: Relationship between “End.user” and “Participation.level”
Figure 24: Relationship between “End.user” and “Willingness.to.continue”
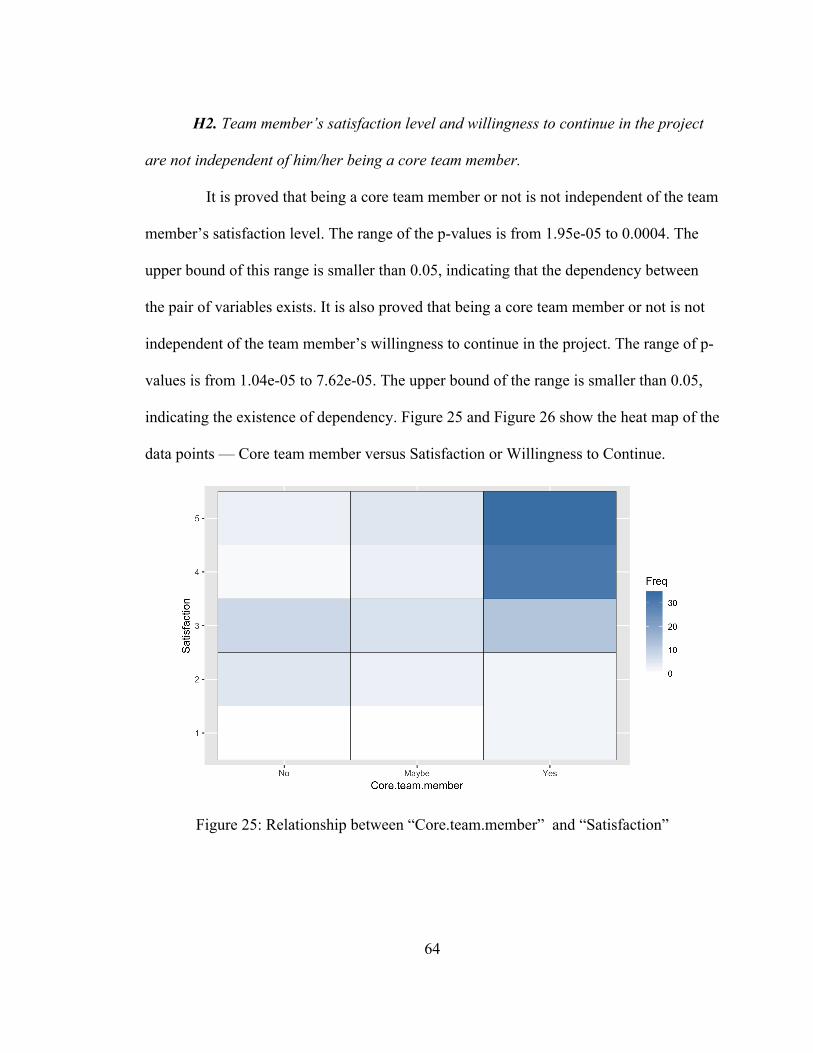
64
H2. Team member’s satisfaction level and willingness to continue in the project
are not independent of him/her being a core team member.
It is proved that being a core team member or not is not independent of the team
member’s satisfaction level. The range of the p-values is from 1.95e-05 to 0.0004. The
upper bound of this range is smaller than 0.05, indicating that the dependency between
the pair of variables exists. It is also proved that being a core team member or not is not
independent of the team member’s willingness to continue in the project. The range of p-
values is from 1.04e-05 to 7.62e-05. The upper bound of the range is smaller than 0.05,
indicating the existence of dependency. Figure 25 and Figure 26 show the heat map of the
data points — Core team member versus Satisfaction or Willingness to Continue.
Figure 25: Relationship between “Core.team.member” and “Satisfaction”

65
Figure 26: Relationship between “Core.team.member” and “Willingness.to.continue”
H3. Team member’s perception of the project’s likelihood that it will be
completed or will be used is not independent of the partner’s involvement.
Our Fisher’s Exact test result does not show evidences that there is a
dependency between the presence of a partner of a project and the volunteers’ perception
that the project will be completed. The p-values range from 0.14 to 0.15. The lower
bound of the range is greater than 0.05, which fails to reject the independence of the pair
of variables.
However, the result of the test for the partner’s presence and the team member’s
perception that the project will be used by target users indicates a dependency between
the two variables. The p-values range from 0.0002 to 0.0013. The upper bound of the
range is smaller than 0.05. Figure 27 and Figure 28 show the heat map of the data points
— Partner.present versus “Will.be.completed” or “Will.be.used”.

66
Figure 27: Relationship between “Partner.present” and “Will.be.completed”
Figure 28: Relationship between “Partner.present” and “Will.be.used”
67
H4. Team members’ high interest in the technology used in the software
application is correlated with high participation level and high willingness to continue.
The result of Spearman’s rank correlation coefficient fails to show a correlation
between team members’ interest in the technology and team members’ participation level
in the project. The average correlation coefficient is 0.116. To see how significant this
averaged coefficient is, we regress the participation level on the team member’s interest
in the technology on 10 imputed data sets and get the pooled p-value 8.805658e-02 (>
0.05) according to Rubin’s rules. However, our result shows evidence that team
member’s interest in the technology does correlate to his/her willingness to continue in
the project. The average correlation coefficient is 0.256, and the combined p-value based
on linear regressions on the ranks of this pair of variables is 6.459888e-03, which is
smaller than our critical value 0.05 and hence shows that the evidence is significant.
H5. Team member’s self-efficacy level (operationalized as the degree that he/she
thinks he/she can contribute to the application) is positively correlated to his/her
willingness to continue.
The average correlation coefficient from our Spearman’s correlation coefficient
analyses is 0.354. The combined p-value based on linear regressions of this pair of
variables is and 1.800383e-03 (< 0.05), which is significant and indicates that as the level
of team member’s self-efficacy increases, his/her willingness to continue in the project
tends to grow stronger.

68
H6. Team communication effectiveness is correlated with the project progress
rate and satisfaction level.
Our results show that as team communication becomes more effective, the project
tends to make progress faster and the team member tends to be more satisfied with the
project. The correlation coefficient between the team communication effectiveness and
the project progress rate is 0.285. Based on the combined result of linear regressions on
this pair of variables on 10 data sets, the pooled p-value is 2.508233e-04 (< 0.05),
indicating a significant evidence of the positive correlation. The correlation coefficient
for the Team communication effectiveness and the satisfaction level is 0.416. The pooled
p-value from the combined result of the linear regressions on this pair of variables on 10
data sets is 3.244151e-04 (< 0.05), indicating the significance of the positive correlation
as well.
H7. Team size (operationalized as core team size) is positively associated with
progress rate.
Our result gives evidences that the progress rate is associated with the size of
the team. The average correlation coefficient is 0.185. The combined result of linear
regressions shows that the pooled p-value is 1.035558e-03 (< 0.05).
H8. Since the highest motivation of volunteers’ is “help the community”, we
propose that “public benefit” level is positively associated with team member’s
participation level and their willingness to continue.
69
Our results do not show associations between the “public benefit” level of the
project and the team member’s participation level. The correlation coefficient is -0.081.
The pooled p-value is 0.25 (> 0.05), which is insignificant. In addition, our results do not
show evidence that the “public benefit” level of a project is correlated to the team
member’s willingness to continue. Although the correlation coefficient is 0.252. the
combined result of simple linear regressions shows that the pooled estimate is 0.1566, the
pooled standard error of the estimates is 0.0823, and the pooled p-value is 5.975516e-02
(> 0.05), failing to indicate the significance of the correlation.
H9. Team member’s perception that the software will be used by target users is
positively correlated to their willingness to continue and satisfaction level.
The spearman correlation coefficient for the pair of variables “will be used” and
“willingness to continue” is 0.246. However, the pooled p–value from the combined
result of linear regressions on this pair of variables is 0.4911749 (> 0.05). It fails to show
an evidence of the existence of the correlation between team member’s perception that
the project will be used and his/her willingness to continue in the project.
Our result proves that there’s a strong positive correlation between team
member’s perception that the project will be used and his/her satisfaction level. The
correlation coefficient is 0.488. And the pooled p-value is 3.193897e-07 (< 0.05), which
is significant.
H10. The number of female team members is correlated with the team
communication effectiveness.

70
The average correlation coefficient between the two variables is 0.175.The pooled
p-value is 2.321803e-05 (< 0.05), which indicates an association between the number of
female members on a team and the team communication effectiveness.
H11. The Leadership is correlated with the team communication effectiveness.
Our results indicate that the leadership is positively correlated with the team
communication effectiveness. The correlation coefficient is 0.311 and the pooled p-value
is 5.593157e-03 (< 0.05). The better the team is led by its leader(s), the better the team
communication tends to be.
4.5.3 Logistic regression model
We want to develop models for the prediction of the progression rate of the
project, participants’ willingness to continue and their satisfaction level. Modeling of the
success patterns of civic OSS is essential for better planning, organizing, and practicing
the development process.
Through Logistic regression, we examine the factors associated with the
participants’ satisfaction level, their willingness to continue and the progress rate of the
project. We also examine the significance of those explanatory variables.
Since our success measures— participants’ satisfaction level, their willingness to
continue and the progress rate of the project, are all ordered categorical variables, we use
ordinal logistic regression to perform the analysis.

71
First, we report the distribution of respondents’ satisfaction level of the projects
and our results of Logistic regression for their satisfaction level.
Figure 29: Satisfaction Level
Figure 29 shows the distribution of satisfaction rating of our respondents. Our
sample has an increasing pattern regarding the satisfaction ratings. To develop a
regression model, based on literature, previous analysis and our observations, we try
independent variables including “Interest of tech”, “Core team member”, “Well led”,
“Public beneficial”, “Will be used”, and “Female number”. We run regressions on ten
imputed data sets. For all variables that are suitable to run with the regression, we get the
following combined results of coefficients and related statistics shown in Table 6.

72
Table 6: Results of Initial Regression for Satisfaction3
From the p-values in Table 6, we can see that the p-values of three groups of
“Female number” are all greater than 0.05.Therefore we drop those variables to refine our
model until we find a set of variables that have at least one significant p-value. The
results are in Table 7.
3The estimates are drawn by using the “pool” function of the MICE package. The “pool” function combines estimates by Rubin’s Rules.
73
Table 7: Results of Refined Regression for Satisfaction4
The results indicate that a strong leadership of the project, the team member’s
identification as a core member, and the public benefit level of the project are significant
predictors for the team member’s satisfaction level. It is worth noting that after we refine
our model by selecting variables according to their p-values, the p-values of those
variables in the refined model are biased downward. Therefore, this selected model is
indicative of possible relations among the variables, rather than verified relations among
the variables.
We convert the coefficients to odds ratios. The result is shown in Table 8.
4The estimates are drawn by using the “pool” function of the MICE package. The “pool” function combines estimates by Rubin’s Rules.

74
Table 8: Odds Ratios of Regression for Satisfaction
As for whether a project is well led or not, compared to the reference group –
“Not well led”, the odds of having a higher satisfaction rating for “There is not a clear
leader” is 14.87 times greater, and the odds of having a higher satisfaction rating for a
“well led” project is 41.58 times greater.
When it comes to how being a core team member predicts his/her satisfaction
rating, compared to the reference group –“Not a core team member”, the odds of having a
higher satisfaction rating for those who are core team members is 7.97 times greater.
As for how “Public.beneficial” predict the satisfaction level of team members, to
our surprise, the estimates of coefficients are negative and odds ratios are less than 1,
indicating that project with higher level of “Public.beneficial” is less likely to have higher
level of satisfaction among team members. As we can see from Table 7,
“Public.beneficial: Undecided” and “Public.beneficial: Agree” are significant. Referring
to Table 8, compared to the reference group – “Public.beneficial: Strongly disagree”, the
odds of having a higher satisfaction rating for those who are not decided on the project’s
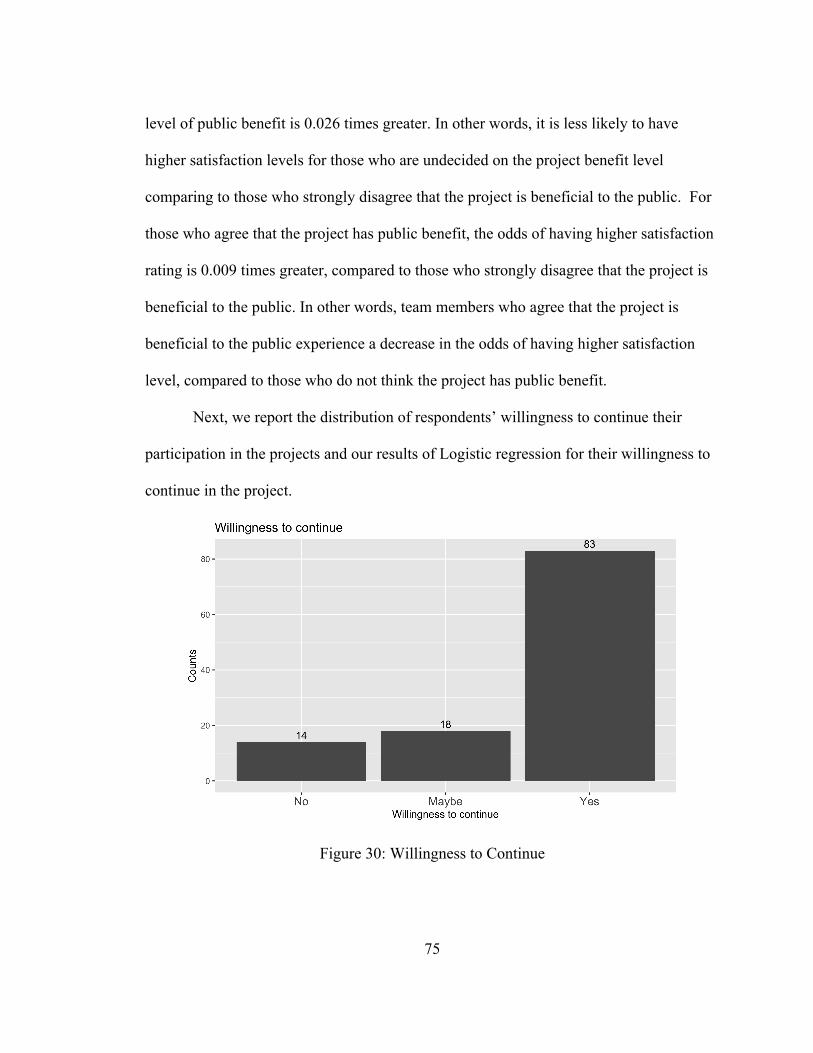
75
level of public benefit is 0.026 times greater. In other words, it is less likely to have
higher satisfaction levels for those who are undecided on the project benefit level
comparing to those who strongly disagree that the project is beneficial to the public. For
those who agree that the project has public benefit, the odds of having higher satisfaction
rating is 0.009 times greater, compared to those who strongly disagree that the project is
beneficial to the public. In other words, team members who agree that the project is
beneficial to the public experience a decrease in the odds of having higher satisfaction
level, compared to those who do not think the project has public benefit.
Next, we report the distribution of respondents’ willingness to continue their
participation in the projects and our results of Logistic regression for their willingness to
continue in the project.
Figure 30: Willingness to Continue
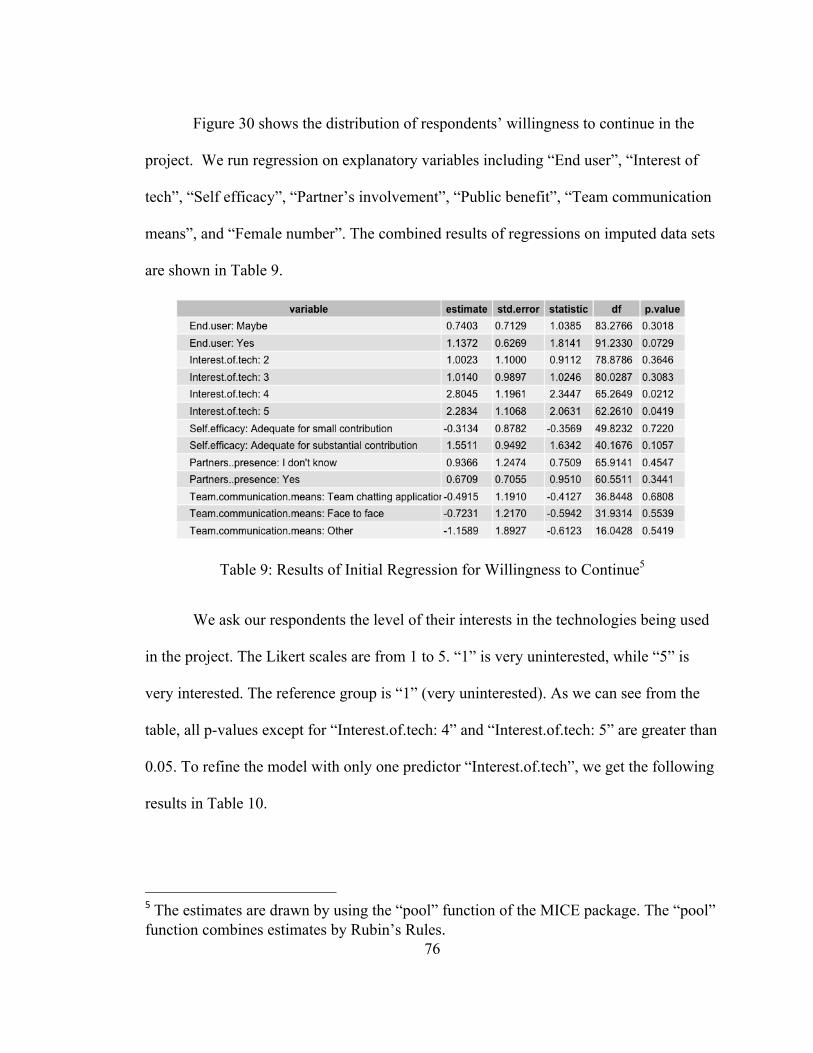
76
Figure 30 shows the distribution of respondents’ willingness to continue in the
project. We run regression on explanatory variables including “End user”, “Interest of
tech”, “Self efficacy”, “Partner’s involvement”, “Public benefit”, “Team communication
means”, and “Female number”. The combined results of regressions on imputed data sets
are shown in Table 9.
Table 9: Results of Initial Regression for Willingness to Continue5
We ask our respondents the level of their interests in the technologies being used
in the project. The Likert scales are from 1 to 5. “1” is very uninterested, while “5” is
very interested. The reference group is “1” (very uninterested). As we can see from the
table, all p-values except for “Interest.of.tech: 4” and “Interest.of.tech: 5” are greater than
0.05. To refine the model with only one predictor “Interest.of.tech”, we get the following
results in Table 10.
5The estimates are drawn by using the “pool” function of the MICE package. The “pool” function combines estimates by Rubin’s Rules.

77
Table 10: Results of Refined Regression for Willingness to Continue6
As shown in Table 10, two of the p-values are less than 0.05, which indicate the
significance of those two levels of the predictor. The results indicate that strong interests
of the technologies used in the project are significant predictors for the team member’s
willingness to continue in the project. Similar to our regression on team member’s
satisfaction level, the p-values of these two levels of variables in the refined model are
biased downward after we drop other variables. This selected model is indicative of
possible relations among the variables. We convert the coefficients to odds ratios. The
result is shown in Table 11.
Table 11: Odds Ratios of Regression for Willingness to continue
Referring to Table 11, we observe that the odds of being more willing to continue
in the project for those who are interested in the technologies used in the project is 14.05 6The estimates are drawn by using the “pool” function of the MICE package. The “pool” function combines estimates by Rubin’s Rules.

78
times greater than that of those who are very uninterested in the technologies used in the
project. Similarly, the odds of being more willing to continue in the project for those who
are very interested in the technologies used in the project is 7.75 times greater than that of
the reference group.
Lastly, to discover the predictors for the progress rate of the projects, we first run
regression on variables including “Core team size”, “Well led”, “Team-partner
communication frequency”, “Team communication means”. We drop “Core team size”
and “Team-partner communication frequency” because they cause the over-fitting
problem. We end up with the following results in Table 12.
Table 12: Results of Initial Regression for Progress Rate7
From Table 12, it is observed that none of the variables are predictors with all
their p values being greater than 0.05. Therefore, we cannot build a model that predicts
the project progress rate based on the above factors that we are interested.
7The estimates are drawn by using the “pool” function of the MICE package. The “pool” function combines estimates by Rubin’s Rules.
79
Chapter Five: Limitations and Discussions
5.1 Response bias
5.1.1 Sample size
Limited access to inactive brigade members is an important reason for response
bias. We distributed the survey by emailing the list of brigade leaders and also posted the
survey in various brigade communication platforms, including the Slack channels (the
major communication platform). The number of people (active or inactive) in the Slack
channels of all brigades vary from about 30 people to more than 1500 people, suggesting
that there might be a significant number of brigade members who have not seen this
survey or they have seen this survey but do not take it. They might not want to take the
survey because it is time-consuming for them, or they are not currently active, or they do
not hold strong opinions on the projects in the brigade, or they have not participated in a
software application project that they think is suitable for this study.
5.1.2 Representativeness
Locations of respondents
From the results in Chapter 4, we can see that responses from certain brigades are
substantially more than those from some other brigades. A large number of observations
80
are from Code for Denver. Although we sent the survey to 63 brigades across the United
States, we only got responses from 37 brigades and a few from brigades not listed in our
survey.
Roles of respondents
A large number of observations are reported by brigade captains/co-captains, as
we can see from Figure 3 in section 4.1.2. The percentage of brigade captains/co-captains
in our observations may not be consistent with the percentage of them in the actual
brigade projects.
Projects of respondents’ choices
It might be tempted to think that who respond to this survey are those who have
participated in a relatively successful project, or at least an on-going project. But from
our observations, many participants, especially those who have been involved for a long
time, have experienced some unsuccessful or abandoned projects. And at the beginning
of our survey, respondents are instructed to identify any project to answer the survey.
Therefore, it is not fair to believe that they all identify successfully projects to answer the
questions. They might also have a lot of thoughts on those unsuccessful projects that they
want to report and base their answers on. In this case, we believe that there is some
balance in terms of the project successfulness.
However, it is likely that those who are not satisfied with the projects have
already left the projects and hardly have access to this survey, or simply do not take the
81
survey. Therefore, it could be the potential reason of some unbalances in our data. The
variance of opinions of the public benefit level of the project, satisfaction ratings or
willingness to continue is relatively small. For example, few people report the project to
be not beneficial to the public at all. And the distribution of respondents’ satisfaction
level is skewed to the higher levels. Some categories of some predictors have small or
zero cells in the cross tabulations of the data. There could also be desires among
respondents to provide socially desirable answers, which lead to this kind of skewed data
distribution. This type of response bias introduces some issues with the logistic
regression.
In short, the respondents of this study are those who have seen and are willing to
take this survey, and the limited number of respondents who are inactive in the projects at
the time of taking this survey indicates possible limited number of unsuccessful projects
in our data. Therefore, the sample might not represent the CFA community as a whole
and limits the generalizability of the results of this study.
5.2 Accountability
The respondents’ understanding of the survey questions might differ from what
we attempt to ask. For example, in one question, we ask respondents about their primary
role in the project. Then in the next question, we ask them to choose all their roles in the
project if they take multiple roles. The number of choices they are able to choose is not
limited. However, we have seen some observations that choose “Brigade captain/co-
captain” as their primary role but do not include this role in their answers to the question

82
asking all the roles they take. It might be due to the gap of understanding of the questions
between respondents and the survey designer. Respondents might think that they are not
supposed to include their primary role again since they have just answered that question,
or they think the number of items they can select is limited. So they just choose the other
roles that they also take. Therefore, the accountability of these results might not reflect
the reality.
5.3 Logistic regression model
In regression analysis for volunteer’s satisfaction level, for variables like “Will be
used” and “Interest of tech”, we get a problem of over-fitting (complete separation of
data points) when running the regression. Thus we drop them from the regression.
However, there are still possibilities for the variable “Will be used” to predict the
satisfaction level of a team member. It is proved that “Will be used” is correlated with
“Satisfaction” (H9) in section 4.5.2. As we discussed in section 5.1, the problem is
probably due to the limited amount and limited variation of the data used for this
analyses. Although the sample is like this, from the previous analyses, literature review,
and our observations in the brigades, we still consider that “Will be used” is a potential
candidate as a predictor of team member’s satisfaction level. More data needs to be
obtained to test it.
It is observed that although “Self efficacy” is correlated with “Willingness to
continue” (H5) as we analyzed in section 4.5.2, it is not a significant predictor in the
regression for “willingness to continue”. This is perhaps because of the “confounding

83
bias”. A certain other variable influences both the “Self efficacy” and “Willingness to
continue”. In other words, a certain other variable confounds the relation between “Self
efficacy” and “Willingness to continue”. In this case when we have both that variable and
“Self efficacy” in the regression, coefficients of “Self efficacy” might not be significant.
5.4 Success measures
There can be many success measures to assess civic OSS development. But we
only choose three that are suitable in our case. We exclude some success measures for the
following reasons. First, although we gather a lot of data about the application
development practices, which are important explanatory variables for software quality,
we do not use software quality to measure success of civic OSS in our study because the
CFA projects are mostly ongoing, and it is hard to measure the software quality such as
code quality or defect density under this circumstance. Therefore, we do not explore the
relationship between development practices and software success in terms of quality.
What’s more, we cannot use the number of team size as a success measure. Different than
“conventional OSS”, which are normally pure online projects in which developers rarely
meet, civic OSS focuses on solving local issues by local volunteers. Therefore, the size of
community and the number of local technologists affects the size of the project team.
Finally, since most projects are not released, users are hard to identify. So we cannot use
user interest, user satisfaction, or number of downloads as success measures.

84
Chapter Six: Conclusion and Future Work
6.1 Conclusion
This study reveals that the top motivation of volunteers to participate in the civic
software development is to help the community. The motives of voluntary action for
social movements and community work, and motives of working in teams both apply to
the participants of civic open source software development.
A majority of respondents joined the projects during initial planning phase.
Nearly half of the developers report that they do not have a systematic architecture or
component design. The core team size is mostly 1-6 people and most of the projects do
not have a significant larger number of non-core contributors who help find problems or
fix bugs. Project teams generally have more male than female members. The primary
team communication means are chatting application and face-to-face. And most team
members consider their communications moderately or very effective.
Most projects have a government/community partner. Team members tend to
meet partners every month or more frequently. As for requirement elicitation methods,
66.2% of the respondents report that they use their general knowledge to come up with
the software requirements, while “interview with stakeholders” and “meetings with the
target users” are slightly less used.
85
Similar to conventional OSS, in civic OSS, developers choose tasks instead of
being assigned tasks in their projects. And development work is significantly attributed to
a small number of core contributors.
A conceptual model that captures the groups of variables is presented. The model
includes clusters of explanatory variables such as volunteer input, project features, team
dynamics and volunteers’ perception of the project, and a group of success measures in
terms of system creation, each of which contains multiple variables.
Our study shows that there is a dependency between team member’s identification
as an end user of the software and the team member’s participation frequency in the
project. Both of the team member’s satisfaction level and his/her willingness to continue
in the project are dependent of his/her identification as a core team member. We also find
that the team member’s perception that the software will be used by target users is
dependent of the existence of a government/community partner for the project. The more
likely that team members feel the project will be used, the more likely they will have
higher satisfaction levels.
In addition, volunteer’s interest in the technology used in the software
development and his/her high self-efficacy level are correlated with his/her willingness to
continue in the project as well. It is also proved that the better the team is led by a team
leader, the more effectively the team members communicate. And the more effectively
team members communicate, the more efficient that project makes progress and the more
satisfied that team members feel.
86
Finally, our logistic regression shows that, leadership, team member’s
identification as a core team member, and the public benefit level of the projects are
predictors for the satisfaction level of team members. Comparing to a project that is not
well led, a well-led project or a project without a clear leadership has higher odds of
having a higher satisfaction level. Compared to not being a core team member, being a
core team member makes him/her have higher odds of being more satisfied with the
project. Compared to volunteers who strongly disagree that a project is public beneficial,
those who are undecided on the project’s public benefit level or who agree that the
project is public beneficial have lower odds of being more satisfied with the project. Our
results also show that, compared to volunteers who are very uninterested in the
technologies used in the project, those who are interested or very interested in the
technologies experience an increase in the odds of being more willing to continue in the
project.
6.2 Future work
Firstly, we would like to collect more data to make the results of this study more
generalizable. The number and variance of observations is limited, which needs to be
addressed by collecting more representative data to make the logistic regression fit better.
Additionally, collecting more data from those who are not currently active in the projects
can help get more insights into why people leave the projects and provide lessons for
better management.
87
Secondly, we would like to study the development process in a qualitative way.
Interviews will help provide a concrete and accurate description of the software
development process currently adopted in the brigades. Some researchers, who have been
core team members of the Apache server project, draft a good description of the
development process and have it checked by other team members. As participants of
CFA projects, we would like to interview brigade members or have them draft a
description to provide a clear overview of the development process and find more
insights.
Finally, a longitudinal study on the project level would help track the
development trends, such as the change of team sizes, development practices,
advancements of project, and team member’s satisfaction levels. It may suggest other
determinants of project success.

88
References
[1] Stol, Klaas-Jan, Muhammad Ali Babar, Barbara Russo, and Brian Fitzgerald. "The use of empirical methods in open source software research: Facts, trends and future directions." In Proceedings of the 2009 ICSE Workshop on Emerging Trends in Free/Libre/Open Source Software Research and Development, pp. 19-24. IEEE Computer Society, 2009.
[2] Ghosh, Rishab A., Ruediger Glott, Bernhard Krieger, and Gregorio Robles. "Free/libre and open source software: Survey and study." (2002).
[3] Hertel, Guido, Sven Niedner, and Stefanie Herrmann. "Motivation of software developers in Open Source projects: an Internet-based survey of contributors to the Linux kernel." Research policy 32, no. 7 (2003): 1159-1177.
[4] Steinmacher, Igor, Marco Aurelio Graciotto Silva, Marco Aurelio Gerosa, and David F. Redmiles. "A systematic literature review on the barriers faced by newcomers to open source software projects." Information and Software Technology 59 (2015): 67-85.
[5] Crowston, Kevin, and James Howison. "The social structure of free and open source software development." First Monday10, no. 2 (2005).
[6] Gasser, Les, and Walt Scacchi. "Towards a global research infrastructure for multidisciplinary study of free/open source software development." In IFIP International Conference on Open Source Systems, pp. 143-158. Springer, Boston, MA, 2008.
[7] Stewart, Katherine, and Tony Ammeter. "An exploratory study of factors influencing the level of vitality and popularity of open source projects." ICIS 2002 Proceedings (2002): 88.
[8] Mockus, Audris, Roy T. Fielding, and James Herbsleb. "A case study of open source software development: the Apache server." In Proceedings of the 22nd international conference on Software engineering, pp. 263-272. Acm, 2000.
[9] Klug, Michael, and James P. Bagrow. "Understanding the group dynamics and success of teams." Royal Society open science 3, no. 4 (2016): 160007.
[10] Aberdour, Mark. "Achieving quality in open-source software." IEEE software 24, no. 1 (2007).
[11] Zhao, Luyin, and Sebastian Elbaum. "A survey on quality related activities in open source." ACM SIGSOFT Software Engineering Notes 25, no. 3 (2000): 54-57.
89
[12] Subramaniam, Chandrasekar, Ravi Sen, and Matthew L. Nelson. "Determinants of open source software project success: A longitudinal study." Decision Support Systems 46, no. 2 (2009): 576-585.
[13] Lee, Sang-Yong Tom, Hee-Woong Kim, and Sumeet Gupta. "Measuring open source software success." Omega 37, no. 2 (2009): 426-438.
[14] Crowston, Kevin, Kangning Wei, James Howison, and Andrea Wiggins. "Free/Libre open-source software development: What we know and what we do not know." ACM Computing Surveys (CSUR) 44, no. 2 (2012): 7.
[15] Sommerville, Ian. Software engineering. Pearson, 2016.
[16] Crowston, Kevin, Hala Annabi, James Howison, and Chengetai Masango. "Effective work practices for software engineering: free/libre open source software development." In Proceedings of the 2004 ACM workshop on Interdisciplinary software engineering research, pp. 18-26. ACM, 2004.
[17] Raymond, Eric S. "The cathedral and the bazaar-musings on Linux and open source by an accidental revoltionary (rev. ed.)." (2001): I-XIV.
[18] Laurent, Andrew M. St. Understanding open source and free software licensing: guide to navigating licensing issues in existing & new software. " O'Reilly Media, Inc.", 2004.
[19] Bezroukov, Nikolai. "Open source software development as a special type of academic research: Critique of vulgar Raymondism." First Monday 4, no. 10 (1999).
[20] Lee, Melissa, Esteve Almirall, and Jonathan Wareham. "Open data and civic apps: first-generation failures, second-generation improvements." Communications of the ACM 59, no. 1 (2015): 82-89.
[21] Stephens,John, “Civic Technology – Open data and Citizen Volunteers as a Resource for North Carolina Local Governments” 2017
[22] Mccann, Laurenellen. “But what is ‘civic’”? https://civichall.org/civicist/what-is-civic/ Accessed: 09/10/2018.
[23] Schrock, Andrew. Civic Tech: Making Technology Work for People. Rogue Academic Press, 2018
[24] Stallman,Richard. “Free Software is even more important now.” http://www.gnu.org/philosophy/free-software-even-more-important.html Accessed: 03/20/2018
90
[25] Ermoshina, Ksenia. "Democracy as pothole repair: Civic applications and cyber-empowerment in Russia." Cyberpsychology: Journal of Psychosocial Research on Cyberspace 8, no. 3 (2014).
[26] Code for All network’s mission. https://codeforall.org Accessed: 03/20/2018
[27] https://www.getcalfresh.org/en/about Accessed: 03/20/2018
[28] https://www.detroitwaterproject.org Accessed: 09/18/2018
[29] Lakhani, Karim R., and Robert G. Wolf. "Why hackers do what they do: Understanding motivation and effort in free/open source software projects." (2003).
[30] Zeitlyn, David. "Gift economies in the development of open source software: anthropological reflections." Research policy32, no. 7 (2003): 1287-1291.
[31] Roberts, Jeffrey A., Il-Horn Hann, and Sandra A. Slaughter. "Understanding the motivations, participation, and performance of open source software developers: A longitudinal study of the Apache projects." Management science 52, no. 7 (2006): 984-999.
[32] Rising, Linda, and Norman S. Janoff. "The Scrum software development process for small teams." IEEE software 17, no. 4 (2000): 26-32.
[33] Pentland, Alex. "The new science of building great teams." Harvard Business Review 90, no. 4 (2012): 60-69.
[34] Faraj, Samer, and Lee Sproull. "Coordinating expertise in software development teams." Management science 46, no. 12 (2000): 1554-1568.
[35] Yamauchi, Yutaka, Makoto Yokozawa, Takeshi Shinohara, and Toru Ishida. "Collaboration with Lean Media: how open-source software succeeds." In Proceedings of the 2000 ACM conference on Computer supported cooperative work, pp. 329-338. ACM, 2000.
[36] Herbsleb, James D., and Rebecca E. Grinter. "Splitting the organization and integrating the code: Conway's law revisited." In Proceedings of the 21st international conference on Software engineering, pp. 85-95. ACM, 1999.
[37] Crowston, Kevin, Qing Li, Kangning Wei, U. Yeliz Eseryel, and James Howison. "Self-organization of teams for free/libre open source software development." Information and software technology 49, no. 6 (2007): 564-575.
91
[38] German, Daniel M. "The GNOME project: a case study of open source, global software development." Software Process: Improvement and Practice 8, no. 4 (2003): 201-215.
[39] Brigade Organizer’s Playbook, https://brigade.codeforamerica.org/resources Accessed: 03/21/2018
[40] Noll, John. "Requirements acquisition in open source development: Firefox 2.0." In IFIP International Conference on Open Source Systems, pp. 69-79. Springer, Boston, MA, 2008.
[41] Scacchi, Walt. "Understanding the requirements for developing open source software systems." IEE Proceedings-Software 149, no. 1 (2002): 24-39.
[42] Reis, Christian Robottom, and Renata Pontin de Mattos Fortes. "An overview of the software engineering process and tools in the Mozilla project." In Proceedings of the Open Source Software Development Workshop, pp. 155-175. 2002.
[43] DiBona, Chris, and Sam Ockman. Open sources: Voices from the open source revolution. " O'Reilly Media, Inc.", 1999.
[44] Nichols, David M., and Michael B. Twidale. "Usability and open source software." (2002).
[45] Henderson, Lisa GR. "Requirements elicitation in open-source programs." CrossTalk-The Journal of Defense Software Engineering 13, no. 7 (2000): 28-30.
[46] Mockus, Audris, Roy T. Fielding, and James D. Herbsleb. "Two case studies of open source software development: Apache and Mozilla." ACM Transactions on Software Engineering and Methodology (TOSEM) 11, no. 3 (2002): 309-346.
[47] Crowston, Kevin, James Howison, and Hala Annabi. "Information systems success in free and open source software development: Theory and measures." Software Process: Improvement and Practice 11, no. 2 (2006): 123-148.
[48] Wynn, Donald E. "Organizational structure of open source projects: A life cycle approach." In Abstract for 7th Annual Conference of the Southern Association for Information Systems, Georgia. 2003.
[49] Bonaccorsi, Andrea, and Cristina Rossi. "Why open source software can succeed." Research policy 32, no. 7 (2003): 1243-1258.
[50] Krishnamurthy, Sandeep. "Cave or community?: An empirical examination of 100 mature open source projects." (2002).
92
[51] Code for America Blog, https://medium.com/code-for-america/about Accessed: 03/10/2018
[52] Code for America project repositories, https://brigade.codeforamerica.org/projects Accessed: 03/10/2018
[53] Netcraft Web Server Survey, https://news.netcraft.com/archives/category/web-server-survey/ Accessed: 09/25/2018
[54] History of the Mozilla Project, https://www.mozilla.org/en-US/about/history/details/ Accessed on 09/25/2018
[55] Raymond, Eric S. The Cathedral and the Bazaar, http://www.catb.org/~esr/writings/cathedral-bazaar/cathedral-bazaar/ar01s02.html Accessed on 09/25/2018
[56] Code for America Wiki, https://en.wikipedia.org/wiki/Code_for_America Accessed: 03/10/2018
93
Appendix: Survey questionnaire
1. Which brigade do you volunteer in? Code for _______
2. What’s your gender identity?
Female Male Other
3. Are you currently active in the brigade?
Yes No
4. How long were you or have you been involved in the brigade? Less than 3 months 3-6 months 6 months - 1 year 1 – 2 years 3-5 years More than 5 years
5. How often do you come to the meetups to contribute when you’re active in the brigade? Less than once a month Once a month Every other week Once a week Twice a week More than twice a week
(If you are currently involved in multiple projects, please identify for your self a representative project and base your responses on that to answer the questions; If you are not currently participating in the projects, please base your responses on the last project to which you contributed to answer the questions)
6. What do you identify as your primary role in the project? (select one) Front-end developer Back-end developer UX designer Product manager Testing

94
Documenting Application partner Brigade captain/co-captain Brigade organization helper Other, please specify ________
7. What are your roles in the project (if you have more than one role)? (select all that apply) Front-end developer Back-end developer UX designer Product manager Testing Documenting Application partner Brigade captain/co-captain Brigade organization helper Other, please specify ________
8. Are you also an end user of the project for which you’re responding?
Yes No Maybe
9. I think this project will significantly benefit the public:
Strongly disagree Disagree Undecided Agree Strongly agree
10. What was the project status when you first joined the project?(choose all that
apply) Initial planning Application User Interface Designing / Architecture designing Implementation Testing Release Maintenance
11. To what extent are you interested in the programming languages, frameworks or
other technologies used by the project? (1 is very uninterested, 5 is very interested) 1

95
2 3 4 5
12. Are the projects well led by the project leader(s)?
Yes No There’s not a clear leader in this project
13. Are there partners (government/NGO/individuals who are the target users)
involved in the project? Yes No I don’t know
14. Do you think the project will be completed? Definitely yes Probably yes Might or might not Probably not Definitely not It is already completed
15. Do you think the project will be used by target users?
Definitely yes Probably yes Might or might not Probably not Definitely not It is already completed
16. How many team members were in the project when you first joined it?
<3 3-6 7-10 11-20 <20
17. In an average month, how many members make substantial contribution to the code or design (i.e., core team)? <3 3-6 7-10
96
11-20 <20
18. How many people help contribute to the project but are not the members of core
team (for example, those who help discover defects, analyze requirements, publicize the application or communicate with end users)? 0 1-3 4-10 11-30 >30
19. In an average month, how many females are in your whole project team(core plus non-core team)? 0 1-3 4-10 11-30 >30
20. In an average month, how many males are in your whole project team (core and
non-core team)? 0 1-3 4-10 11-30 >30
21. How often do you communicate the requirements, implementation issues or
progress with other team members? More than weekly Weekly Every Two weeks Monthly Every two to three months Less than every three months Never
22. What is your primary way of communicating the project with the team members?
Face to face Email Slack/Flowdock or other team chatting application Other, please specify ________

97
23. How effective is your communication with other team members? Extremely effective Very effective Moderately effective Slightly effective Not effective at all
24. How effective is the communication between your team and the partner? (This question is only displayed to the respondent who select “Yes” to question number 13) Extremely effective Very effective Moderately effective Slightly effective Not effective at all
25. How does your team capture the requirements of the software application?
(Choose all that apply) Interviews with stakeholders Surveys of target users Meetings with the target users Background reading Use our general knowledge to come up with or supplement the requirements Other, please specify ________
26. How often do you communicate with the users to confirm the requirements? Almost every meetup we talk with users about the requirements Whenever the users come to the meetup Email users whenever we have questions regarding the requirements Only communicated with users when they initially pitched the project idea Never. We use our general knowledge to come up with the requirements I don’t know Other, please specify ________
27. How are the requirements recorded? (choose all that apply) Requirements are not recorded. User stories/ use cases statements in natural language Use case diagrams We use prototypes to illustrate the requirements We use waffle board or other tools to record the feature requirements of the application State transition diagrams Other, please specify ________

98
28. Is there a systematic software architecture or component design? Yes No I don’t know
29. Is there a documented user interface design (prototype/wireframe) in the project?
Yes No I don’t know
30. When did the external partner first get involved in the project? (This question is
only displayed to the respondent who select “Yes” to question number 13) Requirement elicitation phase Design phase Implementation phase Testing phase Release phase Maintenance phase
31. How is the partner involved in the project? (select all that apply)(This question is only displayed to the respondent who select “Yes” to question number 13) Communicate requirements and solutions face to face Test the features of the application Email Slack/Flowdock or other team chatting application Other, please specify ________
32. How often does the partner of the project get involved in the project? (This question is only displayed to the respondent who select “Yes” to question number 13) Less than once a month Once a month Once in two weeks Once a week Twice a week More than twice a week
33. How are tasks assigned to different developers?
Developers choose tasks Project leader assign tasks after communicating with developers Other, please specify ________
34. What’s the time interval to release a new feature or have a substantial styling
improvement?

99
Less than a week One week Two weeks One month One to three months More than three months Nothing is developed in the project
35. Are the functionalities of the application developed equally by all developers, or
does a core team develop most of the functionalities? Every team member equally develop same amount of features (including UI design or project coordination) A core team develops most of the features while others help with smaller features or detect bugs or fix bugs Other, please specify ________
36. Was the MVP (minimum viable product) of your project completed?
Yes No Will soon be completed I don’t know
37. Are you a core team member (make substantial contribution to the code or
design)? Yes No Maybe
38. What motivated you to participate? (choose up to 3) Improve programming/UI design/project management skills Solve your own problem Want to help the community Social activities (hang out with people) Make career advancement Gain reputation among the community Share knowledge and skills Help publicize my app and increase its usage To get help in realizing a software application idea Solve a problem that can’t be solved by commercial product Other, please specify ________
39. I feel that my level of skills to contribute to the project is:
Inadequate to contribute substantially Adequate for small contribution
100
Adequate for substantial contribution
40. What are the reasons that you decided to stop contributing? (choose up to 3) (This question is only displayed to the respondent who select “No” to question number 3) I no longer have time to participate. I don’t feel I have the right skills to contribute to the projects. The project became inactive. The projects were not of interest to me. I feel that the project goals might not be achieved. The projects do not have much civic benefits. The projects are already almost completed so I don’t feel a need in participation. The atmosphere there is not inclusive enough. I can’t get enough help when I encountered problems. It does not help with improving my skills/experience/career. I moved to another city. Other, please specify ________
41. If you have time, are you willing to continue (if you are active now) or return (if
you are not active now) to contribute to the projects? Yes No Maybe
42. How do you rate your overall satisfaction of the project (1 is very unsatisfied, 5 is
very satisfied)? 1 2 3 4 5
43. Is there anything else you want to say about participating in the projects or the
survey? _____________