motivations, intentions and strategies of entrepreneurs
TRANSCRIPT

Motivations, intentions and strategies of entrepreneurs for
the development of High Growth Firms in Portugal
Diogo de Lonet Delgado e Oliveira
Thesis to obtain the Master of Science Degree in
Industrial Engineering and Management
Supervisors: Prof. António Miguel Areias Dias Amaral
Prof. Jesus Iglésias Garrido
Examination Committee
Chairperson: Prof. Rui Miguel Loureiro Nobre Baptista
Supervisor: Prof. António Miguel Areias Dias Amaral
Member of the Committee: Prof. António Sérgio Constantino Folgado Ribeiro
November 2018


i
Acknowledgments
Completing this work during the time that I was working has been one of the most challenging journeys
of my life. Though there were some unforeseen challenges and intensive research, over hundreds of
papers, constant discussion of ideas, revisions and revisions, and so I am immeasurably grateful to
have many wonderful people who accompanied me not only during the writing process of this thesis but
also throughout all my master's degree and who, somehow, were also part of journey.
I will not mention everyone in particularly because I do not want to take the risk of forgetting the name
of anyone, however, my heart is with all of you even if my memory fails me. Nevertheless, there are
people without whom none of this would have been possible and, in this regard, my deepest appreciation
goes to:
My supervisor and professor, Miguel Amaral, whom I express my gratitude to, firstly for believing in me
and having bet on me for this challenge. However, I would also to thank him for all his help, suggestions
and comments during this process and for his continuous encouragement and incentive, which were
extremely important for this work. All his guidelines were crucial to guide me and keep my focus, which
without I would not have been able to finish this dissertation.
A special “thank you” goes to IAPMEI by making available to me the database used I’m also indebted
to the “entrepreneurship and HGFs research community” and the academic microcosm whose
previously developed works served as the basis of support and guidance in this project.
I am profoundly indebted to my uncle Helge Jorgens, who has always, and I mean literally, always been
available to look at my work and helped to restructure my thoughts and correct my grammatical and
structural errors. It is still a myth to me how somebody can grasp intellectual glitches so quickly and give
back a so constructive and productive feedback.
During my time at IST, I have also made some good friends with whom I have spent very good moments.
To my childhood friends for their friendship and all the moments shared who helped shape the person I
am today.
Expressly, my warmest and genuine thanks go to my mother, my father, my sister and my girlfriend for
always believing in me even when not nobody else does including me. For all their love, strength and
patience. All my achievements are only worth it if I have you with me to share.

ii
Abstract
For many years, the entrepreneur was an invisible figure in the relevant micro and macroeconomics
literature and HGFs were a phenomenon with a non-existent reflection and an ambiguous term since
there are different interpretations to the term growth. However, from the early 20th century onwards, due
to the works and research of some key economists, the terms have gained a more relevant space for
economics and interest from policy makers.
At entry, this work tries to unravel, according to conceptual and applied insights from the relevant
literature, an accurate definition for the principal keywords associated and to provide a wider vision on
the subject. The literature review also aims to help pinpoint different hypotheses to justify the business
growth phenomenon and to explore the causes of HGF through a systematic and structured literature
review
This thesis provides important central and objective review about this small but important restricted
group of firms to both economics and entrepreneurship literature, by, firstly, outlining how the
development of HGFs are backed in the motivations, intentions and strategies of the entrepreneur and,
secondly, to include the strategic management as a potential explanatory agent of business growth
phenomenon, having significant academic and practical relevance and has also significance concerning
public policies to support potential business growth.
Keywords: Entrepreneurship, Portugal, Gazelles, High Growth Firms, Strategic management, Firm
Growth.

iii
Sumário Executivo
Ao longo de vários anos, o empreendedor era uma figura invisível na literatura micro e macroeconómica
e as empresas de crescimento elevado eram um fenómeno sobre o qual não existia reflexão. Para além
disso, tratava-se de um termo ambíguo pois existem diferentes interpretações do termo crescimento e
da forma como este é medido. No entanto, desde o início do século 20, devido ao trabalho e
investigação de alguns investigadores e economistas chave, estes termos ganharam maior interesse e
relevância para a comunidade científica e também aos olhos dos decisores políticos.
Como ponto de partida, este trabalho procura, de acordo com as ideias concetuais aplicadas a partir
da literatura relevante, dar uma definição precisa das principais palavras chave e providenciar uma
visão mais ampla sobre este tema. A revisão da literatura pretende, também, ajudar a identificar
diferentes hipóteses que podem justificar o fenómeno de crescimento de uma empresa através de uma
revisão sistemática e estruturada da literatura.
Esta tese fornece novas e relevantes revisões sobre este pequeno, mas importante grupo restrito de
empresas, trazendo mais conhecimento para a literatura económica e empreendedora, delineando, em
primeiro lugar, como o desenvolvimento das empresas de crescimento elevado era apoiado nas
motivações, intenções e estratégias do empreendedor e, em segundo lugar, ao incluir a gestão
estratégica como um potencial agente explicativo do fenómeno de crescimento de negócio, tendo uma
relevância significante a nível académico e para a prática. Para além disso, apresenta, também,
importância em matéria de políticas públicas para apoiar o potencial de crescimento dos negócios.
Palavras-chave: Empreendedorismo, Portugal, Gazelas, Empresas de Crescimento Elevado, Gestão
estratégica, Crescimento empresarial.

iv
Table of contents
Acknowledgments .....................................................................................................................................i
Abstract..................................................................................................................................................... ii
Sumário Executivo ................................................................................................................................... iii
Table of contents ..................................................................................................................................... iv
List of figures ........................................................................................................................................... vi
List of tables ........................................................................................................................................... vii
List of acronyms .................................................................................................................................... viii
1. Introduction .......................................................................................................................................... 1
1.1 Theoretical framework and problem definition ........................................................................... 1
1.2 Motivation ................................................................................................................................... 5
1.3 Structure ..................................................................................................................................... 8
2. Literature Review ............................................................................................................................... 10
2.1 High Growth Firms: Key concepts and definitions ................................................................... 10
2.2 Key outcomes and barriers and incentives associated with HGFs .......................................... 13
2.2.1 Positive impact of HGFs ........................................................................................................ 13
2.2.2 Key constraints and barriers for firms’ high growth ............................................................... 14
2.2.3 Public policy towards HGFs .................................................................................................. 16
2.3 What drives firms’ high growth? ............................................................................................... 19
2.3.1 Firm-level approach .............................................................................................................. 19
2.3.2 Individual (entrepreneur) level approach .............................................................................. 19
2.3.2.1 Entrepreneurs’ profile and background .............................................................................. 21
2.3.2.2 Entrepreneurs’ motivations and intentions ......................................................................... 23
2.4 Strategic management ............................................................................................................. 25
2.4.1 The value of formal plans to strategic management ............................................................. 27
2.4.2 Business model - a framework toward a unified perspective ................................................ 30
2.4.2.1 Business Model Canvas ..................................................................................................... 31
3. Methodology ...................................................................................................................................... 35
4. Entrepreneurship in Portugal ............................................................................................................. 37
5. Data Description ................................................................................................................................ 41
6 Concluding remarks ............................................................................................................................ 50
6.1 Contribution .............................................................................................................................. 50
6.2 Limitations and further research ............................................................................................... 50
6.2.1 Limitations ............................................................................................................................. 50
6.2.2 Suggestions for further research ........................................................................................... 51
References ............................................................................................................................................ 54
Appendices ............................................................................................................................................ 60
Appendix A – Business Model Canvas framework ........................................................................ 61
Appendix B – Portuguese HGFs age and average annual growth rate (2013-2015) .................... 62

v
Appendix C – Request for response to questionnaire ................................................................... 72
Appendix D – Draft questionnaire .................................................................................................... 2
vi
List of figures
Figure 1 – Number of persons employed and value added of SMEs (Portugal vs EU-28) ..................... 1
Figure 2 – EU28 unemployment rate in January of 2017 (Source: Eurostat) ......................................... 5
Figure 3 – Evolution of the company’s constitution and other organizations in Portugal between 2007
and 2016 (INFORMA D&B, 2017) ........................................................................................................... 6
Figure 4 - Evolution of survival rate of the new firms in Portugal ............................................................ 6
Figure 5 - The most important obstacle cited by firms (Source: Lee (2011)). ....................................... 15
Figure 6 – A conceptual model of strategic drivers of high growth (Source: Demir et al., 2016). ......... 24
Figure 7 – The relationship between traditional “strengths-weaknesses-opportunities-threats” analysis
(Barney, 1991) ....................................................................................................................................... 26
Figure 8 – A Resource-Based Approach to Strategy Analysis: A Practical Framework (Grant, 2001). 26
Figure 9 – BMC areas of business (Adaptation from Business Model Generation (Osterwalder and
Pigneur, 2010)). ..................................................................................................................................... 34
Figure 10 - One, three and five-year survival rates of enterprises in 2015 (Source: business
demography statistics, Eurostat website) .............................................................................................. 37
Figure 11 – Average pace of growth evolution on Portuguese firms (employees on the left and
business volume on the right) (Source: Informa D&B (2017)) .............................................................. 38
Figure 12 - The Evolution of the unemployment Rate in Portugal (in %) – 1983-2017 Source: Eurostat
(http://ec.europa.eu/eurostat/en/web/lfs/statistics-illustrated) ............................................................... 39
Figure 13 – Evolution on new job creation by HGFs in Portugal between the year 2009 and 2016 and
its representativeness in the total new creation in the Portuguese business ........................................ 39
Figure 14 - Percentage of new job creation by HGFs by firms’ dimension – a comparison between
HGFs in the period 2006-2009, 2009-2012, 2010-2013 and 2013-2016 .............................................. 40
Figure 15 – Total number of firms by set of firms .................................................................................. 41
Figure 16 – Percentage of growth rates (turnover) for the eligible set of firms ..................................... 42
Figure 17 – Percentage of growth rates (turnover) for the HGFs.......................................................... 42
Figure 18 – Strength of correlation based on the value of r .................................................................. 44
Figure 19 – Comparison between percentage of growth rates (turnover) for exporting and non-
exporting HGFs ..................................................................................................................................... 44
Figure 20 - Average annual growth rate [2013-2015] for exporting HGFs by quartile vs non-exporting
HGFs. .................................................................................................................................................... 46
Figure 21 – Number of HGFs in Portugal (2015) by geographic distribution ........................................ 47
Figure 22 – Percentage of average annual growth rate (2013-2015) of HGFs in Portugal (2015) by
geographic distribution .......................................................................................................................... 48
Figure 23 - Average annual growth rate [2013-2015] by dimension (number of employees). .............. 49

vii
List of tables
Table 1 – Research evidence examples from different environments .................................................. 13
Table 2 - Principal differences between general SME policy and High-Growth Entrepreneurship policy
(Source: Autio et al. (2007)) .................................................................................................................. 17
Table 3 – Literature review on the definition of business models ......................................................... 30
Table 4 – BMC nine blocks ( Source: Business Model Generation (Osterwalder and Pigneur, 2010)) 32
Table 5 - Analysis of HGFs’ age ............................................................................................................ 43
Table 6 – Percentage of exporting and non-exporting HGFs................................................................ 44
Table 7 - Number of exporting HGFs by quartile - percentage of exportations over total turnover (in the
year 2015). ............................................................................................................................................ 45

viii
List of acronyms
BM – Business model
BMC – Business model canvas
BP – Business plan
CEO – Chief executive officer
EIP – Entrepreneurship Indicators Programme
EU28 – The European Union (EU) is an economic and political union of 28 countries1.
GDP – Gross Domestic Product
HGF – High growth firm
IAPMEI - Instituto de Apoio às Pequenas e Médias Empresas e à Inovação
ICE – International Consortium for Entrepreneurship
INE – Instituto Nacional de Estatística
MC – Management control
OECD – Organization for Economic Co-operation and Development
PT – Portugal
R&D – Research and Development
UK – United Kingdom
SME – Small and medium-sized enterprises
TEA – Total entrepreneurial activity
1 Austria, Belgium, Bulgaria, Croatia, Republic of Cyprus, Czech Republic, Denmark, Estonia, Finland,
France, Germany, Greece, Hungary, Ireland, Italy, Latvia, Lithuania, Luxembourg, Malta, Netherlands,
Poland, Portugal, Romania, Slovakia, Slovenia, Spain, Sweden and the United Kingdom.

1
1. Introduction
1.1 Theoretical framework and problem definition
Portugal underwent a period of expansion and development during the second half of the 90’s, however,
since the beginning of the 20th century the country was confronted with a deceleration of economic
growth (Sarmento et al., 2013). Furthermore, in the aftermath of 2008, there was a financial and
economic crisis, culminating in an imperative bailout from TROIKA in 2011. Financial markets started to
be reluctant regarding the country’s ability to fulfil its sovereign debt liabilities in a context of sturdy
competition from emerging economies (Paulo T. Pereira & Laura Wemans, 2015). Hence, this
entanglement regarding the Portuguese economy and an indebted public sector started to undermine
the overall economic dynamics and financial-sector competitiveness in the Portuguese small internal
market, which is deeply dependent on exportation (Carneiro et al., 2013). Survival rates of Portuguese
firms are lower than those of other European countries (Gal & Menon, 2014; Nunes & Sarmento, 2010)
and unemployment rates have been constantly increasing over the last years epitomizing this economic
instability (Carneiro et al., 2013). In a fleeting time, according to data collected by INE - Labour Force
Survey, the Portuguese average rate of unemployment almost tripled. Nevertheless, in 2012, a new
phase for entrepreneurship seems to have started in Portugal, where the founding of new companies
has been growing yearly. In fact, 2015 was the best year in terms of new ventures creation (INFORMA
D&B, 2017). In 2014, estimations show that SMEs represented over 99% of the companies operating in
Portugal and were responsible for almost 79% of total employment (67% in the EU-28), accounting for
67% of the total value added in Portugal (58% in EU-28) in the non-financial business economy2. Over
the course of the period under analysis there was a significant decrease in people employed and value
added in Portugal, as compared with other European countries, as one can observe below in Figure 1
– Number of persons employed and value added of SMEs (Portugal vs EU-28) (European
Commission3).
Figure 1 – Number of persons employed and value added of SMEs (Portugal vs EU-28)
2 The non-financial business economy includes the sectors of industry, construction and distributive
trades and services
3 Source:
https://ec.europa.eu/docsroom/documents/29489/attachments/23/translations/en/renditions/pdf

2
Nowadays, SMEs create more jobs than large enterprises and in developed countries we are witnessing
an evolution from an alleged managed economy to an entrepreneurial economy (Audretsch and Thurik,
2001). SMEs are increasingly seen as the backbone of an economy regarding their importance for
driving gross domestic product (GDP) growth and sustaining employment, development, industrial
health and economy in general (Ayyagari et al., 2011; Robu, 2013).
In our society, successful entrepreneurs as Bill Gates, Mark Zuckerberg and Elon Musk, are idolatrized
and act as role models for nascent entrepreneurs or for those who aspire to become one. Hence, High
Growth Firms (HGFs) have been recognized in honour events as Fast 500 and The Gazelle of the Year.
However, “behind the scene” of the acquired success there’s a lot of arduous work, time, struggle
through near-debilitating failures or anxiety, and moments when everything might seem to crumble. Over
several generations of entrepreneurs, such sentiments were unmentionable, and psychiatrists state that
business leaders sometimes practice impression management, using the expression “fake it till you
make it” to best describe it (Henrekson and Johansson, 2010). For Toby Thomas, CEO of EnSite
Solutions, the finest analogy for that is: a man riding a lion. "People look at him and think: this guy really
got it together! He's brave!" yet, “the man riding the lion is thinking, how the hell did I get on a lion, and
how do I keep from getting eaten?" (Henrekson and Johansson, 2010). Along the process, some
thresholds need to be met and some entrepreneurs may fail more than once, get up, and fail again, only
to achieve success. Failure should not be considered the opposite of success, but as stepping-stone for
it. Nevertheless, starting a new venture should be a choice not a response. For an individual, self-
employment is clearly better than being unemployed, yet, it is not evident that, in all cases, self-
employment is preferable to general employment (Autio et al., 2007). A new venture goes through
distinct stages on its way from idea search to the maturity stage. The process toward the establishment
of a new firm emerges from an alignment between exposure to opportunity and the entrepreneur’s
competencies and strengths (Shane, 2001). So, in this line of reasoning, new ventures are not a result
from one of those agents alone, they are a unique combination from external conditions and the
entrepreneur himself (Demir et al., 2016).
There’s a widespread and implicit belief that high growth is always positive for firms and their
shareholders, however, the veracity of that premise is questionable (Ramezani et al., 2001). In contrast,
it remains practically unexplored in the literature whether there are ideal levels of growth that an HGF
should pursue to elicit a sustainable growth and a higher level of performance. In other words, if there
is an optimal amount of growth that can be sustained (Demir et al., 2016). Some firms will neither
innovate nor grow ever, yet, a part of them don’t even intend to do so in a foreseeable future (Autio,
2005b). For example, in Finland, in the year 2004, Hyvärinen and Rautiainen (2006) show that only a
minor part of the firms from the dataset wanted to grow. Yet, for those who want to grow, perceiving how
to transform small businesses into growth-oriented ones is a difficult challenge and there is a myriad of
barriers to growth, however, entrepreneurs’ characteristics both in the form of experience, education
and profile are preponderant to surpass and overcome eventual setbacks (Koryak et al., 2015).

3
Hence, the main theory that underpins the research developed in the present dissertation is that
motivations, intentions and strategies of the entrepreneur are drivers playing a key role for firms’ rapid
growth and success; which leads to the principal research question: What factors have a positive impact
on the high-growth of businesses?
Over the past years, business growth is a multidimensional phenomenon, which has caught the attention
from many researchers (Barbero, Casillas and Feldman, 2011). Despite being recognized as a core
source of dynamism and an engine to economy (Hölzl & Friesenbichler, 2008; Mitusch & Schimke,
2011), HGFs, acquired immense prominence due to their relevance for the creation of new jobs (e.g.
Acs, 2011). The knowledge regarding high-growth’s phenomenon is burgeoning, however, it remains
fragmented and there’s scarce reflection on the relevance of specific factors on high business growth.
HGFs provide researchers a unique context to study closely patterns of firms’ above-average growth
and their inherent idiosyncrasy of management challenges and fast evolving organization structures not
seen in other firms (Derlmar et al., 2003), still, the term HGF itself is ambiguous and embraces different
interpretations since it depends on the variable through which growth is observed and validation
propositions (metrics) (Daunfeldt et al., 2014). Therefore, there is a necessity of adopting a definition
with an indubitable interpretation that prevents dataset bias, distorting the bigger picture with firms below
a meaningful size threshold (OECD, 2010).
Despite the different conceptualizations, researchers share a common belief that HGFs emerge in all
industries and comprise companies of all sizes, withal, there’s a notorious over-representation of SMEs
(Daunfeldt et al., 2016; Delmar et al., 2016). Despite being a transversal phenomenon, above-average
growth can be achieved in two different general moments by organizations. One concerns the case of
incumbent firms (firms that already exist in the market), where their blatant growth is commonly a result
from a strategic renovation or a change in market position. The other is the case of the start-up of a new
company, which, while respecting certain requirements, are categorized as gazelles, a subset of HGFs
(Moreno & Casillas, 2013). This term, gazelles, which is a burgeoning buzzword nowadays, is the
bequeath of David Birch (1979), who first mentioned it in his research where he presented a paradigm-
changing evidence of the preponderance of small firms in the share of job creation comparing to large
firms in the United States of America (Henrekson & Johansson, 2010a; Coad et al., 2014). More
recently, the veracity of this conclusion has been tested broadening the geographical scope and adapted
to other macro and micro economic variables (Audretsch & Fritsch 2002; van Stel & Storey 2004 and
Mitusch & Schimke, 2011). Synoptically, HGFs, in general, are proven to disseminating social benefits,
instigating the market productivity-enhancing effects (Krasniqi and Desai, 2016) and spread innovation
throughout the wider economy (Mason et al., 2010). However, to make the leap from a small business
into growth-oriented firm, unlocking its potential as well as to expand rapidly is still a difficult job. While
there’s an implicit assumption that growth is something positive in all cases, firms experiencing a growth
stage do not do so in a predictable or linear way and so, the effect that the growth process has on firms
may cause obstacles due to the very fast growth itself and to erratic growth patterns (Storey and van

4
Witteloostuijn 2010; Mason and Brown 2010; Levy et al 2011). That is, irregular and inconsistent growth
pace can be arduous to predict and, subsequently, to plan for, being significantly difficult to identify the
current – and forecast the future – resources’ necessities. In fact, firms, since their first moment of
existence, face mishaps along their way. Certain internal and external influences, also known as
barriers, are frequently discussed due to their adverse impact on the firms’ growth path and survival rate
(Coad and Pawan, 2012). Hence, these barriers may restrain growth or even cause it not to exist at all.
Nevertheless, not belittling the constraints and barriers faced by firms, given all the acquired positive
impacts, above-average growth remains a very captivating subject even for policymakers, who make
many decisions based on employment numbers and on the status of economic welfare (Stam, 2006). It
offers them the possibility to focus their attention on a smaller group of firms and reduce oftentimes
ineffective or blanket business support, investing on resource focus rather than resource spread
(Bennett, 2008). In stark contrast, many researchers defend that success and above-average growth,
at an early stage, is unpredictable and the triggers of success are idiosyncratic of each firm, and so,
difficult to replicate (Fischer & Reuber, 2003). This study focuses on the hypothesis of a non-random
process and, although there are already studies on some factors which are assumed as levers for the
growth of companies, it also aims at exploring something that has still been little in depth - unravelling
the role of the entrepreneur, strategic management and possible interrelations between these concepts
and above-average growth.

5
1.2 Motivation
Business growth is a multidimensional phenomenon which has caught the attention of many researchers
over the past years, especially in the entrepreneurship literature (Barbero, Casillas and Feldman, 2011).
Coad et al. (2014) state that between 2010 and 2013 over 4000 papers have incorporated the key-
words “high-growth firms” or “gazelles” within their titles. Given the economic and social importance of
SME and the preponderance from Gazelles to generate new jobs (Hölzl & Friesenbichler, 2008; Mitusch
& Schimke, 2011), they can have a significant role by meddling to help partly mitigate problems such as
unemployment (Millán et al., 2014). Portugal, which, as of in January of 2017, ranked as the sixth country
with high unemployment among EU28 as one can observe below in Figure 2 – EU28 unemployment
rate in January of 2017.
Figure 2 – EU28 unemployment rate in January of 2017 (Source: Eurostat4)
Moreover, Portugal has been showing a positive entrepreneurial spirit and dynamics even within the
context of a crisis. According to a survey carried out by INFORMA D&B with the impetus of analysing a
database regarding entrepreneurship in Portugal there were born 347.272 new firms and organizations
between 2007 and 2016 (INFORMA D&B, 2017). According to this same study, 2015 was the best year
in terms of company’s constitution so far with 37.978 new firms and other organizations (as one can
observe below, Figure 3 – Evolution of the company’s constitution and other organizations in Portugal
between 2007 and 2016). After a fall in the birth rate between 2008 and 2012 (except for the year 2011,
where the government gave the possibility to establish companies with the social capital of 1€ which
leverages the birth rate), started a new course for entrepreneurship in Portugal where the number of
new companies’ created has been growing year after year (Figure 3 – Evolution of the company’s
constitution and other organizations in Portugal between 2007 and 2016).
4 http://ec.europa.eu/eurostat/documents/2995521/7895735/3-02032017-AP-EN.pdf/8a73cf73-2bb5-
44e4-9494-3dfa39427469

6
Figure 3 – Evolution of the company’s constitution and other organizations in Portugal
between 2007 and 2016 (INFORMA D&B, 2017)
However, despite this ascending entrepreneurial trend, there’s a concern: the survival rate of this new
firms. According to the same database (INFORMA D&B, 2016), only 67% of the companies survived
the first year, 52% survived through the third year and solely 41% reached a mature stage (surviving
the fifth year), as one can observe in the Figure 4 - Evolution of survival rate of the new firms in Portugal.
Understanding why firms, belonging to the same size category, same specific domain of activity and co-
existing under the same environment can experience drastic disparities within their growth and the
impact on direct and indirect creation of new net jobs is becoming a prominent issue for policymakers,
investors, companies, academics and entrepreneurs (Hölzl, 2014).
Figure 4 - Evolution of survival rate of the new firms in Portugal
Within the entrepreneurship research field there’s an emergent attempt to understand how to stimulate
firm survival and growth. Many approaches relate firm high growth with variables such as: human capital
investment (Burke et al., 2010; Senderovitz et al., 2016), technology (Eckhardt & Shane, 2011),
innovation (Fritsch and Mueller, 2007; Hoelzl, 2009) and industry (Acs et al., 2008). However,
surprisingly, apart from few exceptions5, there is a void in research focusing on strategic management
and, consequently, formal plans, on firm high growth. The main motivation that underpins this work is to
exploit this gap and to shed new light on the topic by presenting hypotheses as a result of meta-analysis,
write an outlook for future research in which its presented the data on HGFs in Portugal (describing a
potential sample for a future empirical study) and also describe a potential research strategy based on
5 See, for example, Stam and Wennberg (2009) and Parker et al. (2010)

7
semi-structured interviews to analyse the motivations, intentions and strategies of entrepreneurs for the
development of high growth firms in Portugal, i.e., to understand if the high growth presented from a few
number of firms is the harvest from motivations and intentions from the entrepreneurs, strategic
management practices within the company and the implementation of formal plans and specific policies
targeting firms’ growth by the government, producing new useful knowledge for the activity of the
entrepreneurs and for the public policy decision-makers.

8
1.3 Structure
The remainder of this thesis is organized as follows:
Chapter 1, introduction, is divided in three sections. The “theoretical framework” acts as introduction to
this work presenting not only the problem statement and research questions, but also providing the
reader a general context on the subject and topics addressed further as well as a situational description
that pointed the direction of research. The “motivation” intends to clarify what triggers interest in this
topic and why is it so relevant. The organization of this thesis aims to establish a logical sequence
between each addressed subject and this topic aims to furnish steadfast support to understand how
everything is architected to define the guidelines for the development of this work.
Chapter 2, the literature review, is divided in four sections and provides an extensive review of the
existing literature on relevant and related topics, which introduces key concepts and gives a close look
at the existing theories, identifying gaps and theoretical hypothesis to be tested (section 2.1). The
second section (2.2) familiarizes the reader with an overview about HGFs and provides detail on a
subgroup of these firms – the so-called gazelles. Subsequently, when we talk about HGFs and gazelles,
it cannot be forgotten to emphasize the positive impact they have on employment and on the economic
environment. By highlighting HGF relevance, it becomes important to address policymakers’
involvement and the design and implementation of public policies targeted at this group of companies.
It is also mandatory to analyse the incentives and constraints that HGF may experience to achieve
growth, which is done in section 2.3. Within this section, literature on the firm and individual entrepreneur
characteristics is put into evidence. The last section (2.4) focuses on the importance of strategic
management to firm high-growth and – on a more operational level – the role formal plans and business
models play on the high-growth process.
Chapter 3 describes the methodology used to empirically approach the topic under study.
Methodological steps, the reasoning behind the choice of methods and approaches to be employed,
collection techniques and sources of information are provided in this chapter.
Chapter 4, on its first section, presents the empirical findings and results based on the analysis of the
data provided from IAPMEI on different valuation approaches as well as distinct variables. Throughout
this chapter are written considerations as the different results are obtained and it is outlined a discussion
on the key results and their implications to clarify the object of study. In its second and last section,
chapter 4 also aims to gather important conclusions for the object of study, however, in contrast with the
previous section, it is not on the basis on the analysis of the collected data but rather based on the
analysis and discussion of studies carried out by certified organizations that are focused on the topics
under analysis on this dissertation.

9
Chapter 5 includes the final conclusions collected from the insights collected along during the
development of the entire thesis dissertation, as well as attempts to elucidate which were its main
limitations. Lastly, on the last section, a contribute for futures researches is provided based on insights
about suggestions how this work could be further developed in the future.
References and Appendices are included at the end of the project.

10
2. Literature Review
The review made on the relevant literature aims to help identify and establish patterns that might be
related to the success of firms and to establish an overview on the relation between the entrepreneur,
strategic management and fast firm growth. Therefore, the main purpose is to make a logical connection
to the further steps by providing a solid structure and setting guidelines to the project development (see
chapter 1.3 Structure).
2.1 High Growth Firms: Key concepts and definitions
Firms that achieve above-average growth, i.e., High Growth Firms (HGFs) are an extraordinary
phenomenon arousing an undeniable interest by researchers and policymakers resulting in an
impressive increase in the number of scientific papers and reflection on the topic (Fischer & Reuber
2003; Nicholls-Nixon 2005 ; Henrekson & Johansson, 2010). These firms are recognized as a central
source of dynamism and an engine to the economy (Hölzl & Friesenbichler, 2008; Mitusch & Schimke,
2011) and many researchers have proven that HGFs crop up in all industrial sectors and include all firm
sizes, withal there’s an over-representations of small and young firms (Daunfeldt et al., 2016; Delmar et
al., 2016)
HGFs can be defined as “firms growing at or above a particular pace” (Coad et al., 2014). On this basis,
the term HGF is ambiguous since there are different interpretations to the term growth, disagreements
regarding the pace of growth, and the number of years in which growth occurs (Demir et al., 2016). So,
the identification of HGFs depends on the applied method of measurement (Delmar, et al., 2003), in
other words, it depends on the variable through which growth is observed, with turnover or number of
employees being the most common among the research carried out so far, and if the growth is measured
between the start and end period, or as annualized growth during a specific number of years (Daunfeldt
et al., 2014; Coad et al., 2014).
According to the assumption stated before saying that measuring growth is usually based on turnover
or number of employees, there are several derivations of the definition of HGF. Barringer et al. (2005)
classify HGFs as firms which consistently grow at a rate that exceeds the GDP. Furthermore, Barbero
et al. (2011) consider HGFs as firms which had experienced at least an annual growth rate of 10%
during the five-year period.
However, OECD (2010) states that it is important to adopt a definition with clear interpretability, and
moreover one that classifies high-growth firms as those that outstands some predetermined standards
to prevent any small enterprise growth bias, and so, distorting the picture. A practical example is an
enterprise that grows, over a year, from one to two employees automatically achieving the status of high
growth. Yet, the size boundary should be low enough to avoid excluding too many companies. However,

11
to facilitate comparisons over time and across countries, the literature has progressively moved from
measures of absolute growth to relative measures (Coad et al., 2014).
Therefore, for the purpose of this study, the definition OECD (2007) adopted relates growth with
employment, where firms must have to be above a meaningful size threshold (t), and they should be
measured for a specific period of time (x) to corroborate the idea of sustainable growth, describing HGFs
as:
“Firms that had at least ten employees in the first year and an annualized employment average growth
rate over 20 % during a 3-year period”.
According to the definition adopted (OECD, 2007), if we want to ascertain whether a certain firm is an
HGF, it is not necessary to account for increases in employee numbers from one year to the next over
a three-year period separately. What should be considered is, among the population of active firms,
which ones, in the year xx-3, have or exceed the employee threshold (t) and to measure the number of
employees in the year xx. Then, to conclude the identification of an HGF, we need to verify that the
average annualized growth respects the requirement imposed by the formula:
√𝑛𝑢𝑚𝑏𝑒𝑟 𝑜𝑓 𝑒𝑚𝑝𝑙𝑜𝑦𝑒𝑒𝑠(𝑥𝑥)
𝑛𝑢𝑚𝑏𝑒𝑟 𝑜𝑓 𝑒𝑚𝑝𝑙𝑜𝑦𝑒𝑒𝑠(𝑥𝑥−3)
3
− 1 > 𝟎. 𝟐
Equation 1 – Formula to validate HGF.
In short, the average annualized growth of a firm, for the last three years, must be over 20%, i.e., from
year xx-3 to year xx, the firm must present at least a 72.8% growth in the number of employees (the
number of employees in year xx is at least 1.728 times higher than in year xx-3.
However, there are certain specific cases where firms, notwithstanding presenting employee growth
over 20% in a three-year period, are unable to be considered.
According to OECD (2007), the firm in question should not be considered a high-growth firm:
❖ If growth was due to mergers or take-overs.
❖ If the firm was born in the year xx-3.
This happens because both are biasing the data for distinct reasons. On one hand, when we talk about
a merge or a take-over the growth in the number of employees and turnover of one firm can be
influenced by the other. On the other hand, firms can be born at separate times during the year xx-3
(from January to December). Subsequently, in their birth year, their average turnover might be
significantly lower than in following years solely because it’s referent to a lower period of activity. Despite

12
not having this problem when only employment is measured, it is important to ensure that high-growth
enterprises are always identified from the same base population regardless the method of
measurement.
Disregarding the method of measurement, another important thing to have in mind is the moment when
a firm achieves high growth. It is stated that firms can experience high growth in two different
circumstances. The first case concerns existing enterprises in the market (incumbents), where fast
growth usually results from a strategic renovation or a change in market position. The second
circumstance is when sustained growth happens during the first five years (star-up) of a new company
(gazelles) (Moreno & Casillas, 2013).
Nowadays, gazelle can be considered a buzzword, though it was David Birch’s (1979) research that
started this burst with a paradigm-changing evidence proving that in the United States, small firms were
more preponderant in the share of job creation than large firms (Henrekson & Johansson, 2010a; Coad
et al., 2014).
To maintain the congruence of the research, the definition that’s going to be adopted is the one from
OECD (2010). Thus, in accordance with the previous facts and literature, Gazelles can be classified as
a subset of HGFs which are up to 5 years and so, respecting the definition adopted for HGFs (see
chapter 2.1), gazelles’ definition (OECD, 2010) can be stated as:
“All enterprises up to 5 years old with average annualized growth greater than 20% per annum, over a
three-year period”.
We can schematically represent the connection between them as:
Total number of firms
Firms with 10 or more employees
High-growth firms (HGFs)
HGFs up to 5 years - Gazelles.
The term gazelle was created to help make a more precise data observation and denote which subset
of high growth firms created more jobs. Gazelles stands in contrast with Elephants, which, according to
Birch (1979), despite having a superior number of employees (>500), generate few new jobs. To end
the analogy, Birch identifies Mices as those companies with very few employees (<20) and that,
according to the author, have little or no potential to create new jobs (this definition was adopted by
other reasearchers in their studies such as Acs & Mueller, 2007 and Henrekson & Johansson, 2010a).
Granting the definition given, a gazelle is identified as a firm born in the year xx-4 or xx-5 (third or fourth
year of survival as the birth year of a firm is considered as year zero), which respect the assumptions

13
made for HGFs (see chapter 2.1). A gazelle born in year xx that fulfils the given conditions can be
counted once or twice, if it shows high growth in the third and/or fourth year of survival.
To be consistent, the exclusions suggested for high-growth enterprises in general (see chapter 2.1),
should be the same for gazelles. Briefly, firms’ survivals among population from years xx-4 and xx-5
should be considered, but not from xx-3.
2.2 Key outcomes and barriers and incentives associated with HGFs
2.2.1 Positive impact of HGFs
Birch’s (1979) research isn’t a “one-hit wonder” in the identification of the relevance of Gazelles as
impressive job creators. Stam (2006), Henrekson & Johansson (2010b), Ayyagari et al. (2011), Bravo-
Biosca et al. (2013) and Daunfeldt et al. (2014) are examples of research that supports the theory. In
fact, Henrekson and Johansson (2010) conducted a research expounding that gazelles sustain their
notable impact upon job creation even in periods of recession, and Bravo-Biosca et al. (2013) have
proven, in a joint project by FORA and Nesta in collaboration with researchers and national statistical
agencies in twelve different countries with support from the International Consortium for
Entrepreneurship (ICE) and the Entrepreneurship Indicators Programme (EIP) of the OECD, that the
employment dynamics created by HGFs are a phenomenon across different countries and not an
isolated case.
Nevertheless, HGFs do not stand out only for their impact on employment but also for their positive
macro and micro economic impact (Audretsch & Fritsch 2002; van Stel & Storey 2004 and Mitusch &
Schimke, 2011), disseminating social benefits in their local areas, instigating the market productivity-
enhancing effects (Krasniqi and Desai, 2016) and spread innovation throughout the wider economy
(Mason et al., 2010), which led to studies and evidence from different researchers adapted to different
environments, as the ones presented below ( Table 1 – Research evidence examples from different
environments).
Table 1 – Research evidence examples from different environments
Impact Author, year Evidence from
Sales and Productivity Du, Jun; Temouri, 2015 UK
Exports Halabisky & Parsley, 2008 Canada
Internationalization Mason & Brown, 2010 Scotland
Industry Growth Du, Jun; Temouri, 2015 UK
Innovation Mason et al., 2009 UK
Knowledge creation Colombelli et al., 2014 UK, Germany, France, Sweden, Italy and the Netherlands
Once more, the research examples presented are from studies conducted in diverse countries, showing
that HGF is a pervasive phenomenon across countries. However, despite being a general phenomenon

14
with an acknowledged positive impact in diverse areas, it is still a difficult job to perceive how to transform
or support small businesses into growth-oriented firms and to enable HGFs to have their potential pulled
to the maximum as well as to make possible for them to expand rapidly. HGFs usually face a few
mishaps along the way and certain factors, known as barriers, are commonly discussed because of their
negative impact on growth (Coad and Pawan, 2012).
2.2.2 Key constraints and barriers for firms’ high growth
There are some internal and external aspects within a firm that need to be taken into account because
they might hold back HGF’s success including: access to financial capital, cash flow, regulation or skills
shortages (Lee, 2011). However, it’s also mandatory to be considered that the challenges faced by
HGFs are typically different from those usually seen in non-growing entrepreneurial firms (Autio et al.,
2007). Constraints and barriers to firm high-growth might appear in any step of the growth process and
may cause that HGFs and potential HGFs6 only achieve high growth for a fleeting period, usually
followed by relative stagnation or decline, or not even accomplish a high-growth stage at all (Mason and
Brown, 2010).
Firstly, it is necessary to be considered that firms which experience a high-growth stage do not grow in
a predictable or linear way and so, the high-growth process may arise obstacles due to the very fast
growth itself and to erratic growth patterns (Storey and van Witteloostuijn 2010; Mason and Brown 2010;
Levy et al 2011). In other words, irregular and inconsistent growth pace can be difficult to predict and,
consequently, to plan for, specially getting very difficult to manage the current and forecast the future
resources necessities, and do, might mean that a formal plan is seen as a problem for fast growing firms
(Lee, 2011). One example of that is the fact that very rapid growth may create recruitment problems for
positions with specific skills needs, making it hard to fill lacks quickly or with the right person. Early on,
several studies have been conducted with the purpose to explore this issue and to unravel other factors
representing constraints and barriers for firms to experience high-growth.
A first study conducted by Mattar (1988) entitles flunk of firms mainly with external factors highlighting
the “sandwich effect”. Mattar (1998) states that companies highly rely on acquisitions and sells from big
suppliers and sizable clients respectively, standing in a situation where they cannot impose buying and
selling prices being easily exposed to be squeezed by the competition. Other external factors presented
to explain unsuccessful firms as no market need and lower credit or difficult access to financing (Pelissari
et al., 2012). In like manner, future profitability of gazelle firms is critical for their success since firm
experiencing growth in the absence of financial return tend to be de-capitalized (Senderovitz et al.,
2016).
6 firms which have the potential to attain high-growth stage but have not done so yet (Mason and
Brown, 2010).

15
In a wider-range study, Lee (2011) conducted a research with an extensive analysis on a unique data
comprising combined the Small Business Survey from 2010 and Annual Small Business Survey from
2007/87 giving a set of around 4.800 firms of actual and potential HGFs from UK to attempt to demystify
the most important obstacles for firms’ growth (a synthesis of the results from the ten most commonly
cited can be consulted in Figure 5 - The most important obstacle cited by firms).
Figure 5 - The most important obstacle cited by firms8 (Source: Lee (2011)).
From all the categories listed: the economy, recruitment, cash flow, regulations, competition, taxation,
shortage of skills, obtaining finance, management skills and cost of premises, the general state of the
economy is most frequently cited as the foremost obstacle to firm success for both potential and actual
HGFs, however, only 15% of HGFs say the economy is the utmost important obstacle they have
compared to almost 20% from potential HGFs. Similarly, both potential and actual HGFs classify cost
of premises as the less relevant problem from all listed above. The only categories where there’s a
higher percentage of potential HGFs saying the obstacle is the most significant than in actual HGFs are
the economy, recruitment and obtaining finance, in the remaining, potential HGFs present a lower
percentage than actual HGFs.
Not belittling the constrains and barriers for firm high-growth, given all the positive (context discussed
previously above in chapter 2.1.2 - Positive impact of HGFs), understanding rapid firm growth and its
benefits is becoming a captivating subject not only for scholars but also for policymakers (Smallbone et
al., 2002; Mason & Brown, 2013; Lee, 2014 and Hölzl, 2014), especially because many policy decisions
7 Both surveys of SME (with fewer than 250 employees) conducted by the UK Department for Business,
Innovation and Skills.
8 Ordered by percentage of relevance for high growth firms. The categories “other” and “no opinion”
were excluded.

16
taken are made based on employment numbers and HGFs are seen as a valuable community resource
(Stam, 2006). Withal, research conducted by Fischer & Reuber (2003) finds that it’s reciprocal. Not only
policy makers have an interest in interacting with HGFs, but, also, entrepreneurs recognize that it is
important to benefit from public policies and interact with other external sources, developing a network-
based approach to support growth. This leads to a key question: whether governments, through public
policies, should be involved or not, helping to establish a propitious environment supportive for HGFs
business development (Audretsch, 2004).
2.2.3 Public policy towards HGFs
In the previous section, it’s stated that HGFs are increasingly gaining interest among policy making9,
however, it is still not clear how such policies should be design and implemented (Karlsson and
Andersson, 2009). In their later work, Mason and Brown (2013) argue that the problem with high growth
support is that it is generic rather than bespoke programmes geared towards potential HGF’s. For
example, the Europe 2020 strategy explicitly references the support of SMEs as public policy target and
David Cameron10 highlighted the importance of SME and high-growth business for UK economic
recovery and the relevance of addressing some policy measures to help overcome the barriers they
face to growth:
“We’ve got to back the big businesses of tomorrow, not just the big businesses of today. That means
opening access to finance, creating an attractive environment for venture capital funding, getting banks’
lending to small businesses again and insisting that a far greater proportion of government procurement
budgets are spent with small and medium-sized firms.” - 25 October 2013.
Since a small proportion of firms may have disproportionately relevant social and economic development
impact, policy makers can focus attention on a smaller group of firms reducing time and financial
resources on blanket business support (Bennett, 2008). However, policy makers face two main goals
when targeting HGFs. On one hand, they must ensure potential HGFs can achieve their full potential
and reach high-growth stage by addressing the obstacles faced by firms as their rapidly expansion. On
the other hand, they need to firstly identify and define who the potential HGFs are and secondly
investigate what, if anything, is holding them back (Lee, 2011).
A hindrance for SMEs remains on the regulatory burdens and the arduousness to deal with problems
ascending from regulation and the fact that it must be easily available and at a minimum cost for SMEs
to get access to information about regulations and public policies so they can narrow information gaps
9 “A deliberate act of government that in some way alters or influences the society or economy outside
the government” - Deardorff's (2010).
10 Prime Minister of the UK from 2010 and 2016.

17
(OECD, 1996). A blueprint to promote entrepreneurial success would be to set up a “one-stop-shop
system”, where it can be powwowed all the important information which can influence, outline and
sustain firm strategies and decisions (OECD, 1996).
Public policies regarding HGFs can take two forms: policies fostering the emergence of potential high-
growth and policies supporting HGFs that already do perform above-average in order to sustain their
high growth (Lilischkis, 2011). In other words, policy measures ought to be orchestrated encompassing
all steps of the entrepreneurial process, from opportunity exposure to the consolidation and maturity
stage, ensuring that do not exist any gaps in policy coverage, being consistent and complementary.
However, since the support for firms with the potential for rapid growth present to be highly demanding
and complex, in a policy for high-growth entrepreneurship is more valuable resource focus than resource
spread (Autio et al., 2007). In this line of thought, Shane (2009) argues that policy-makers should stop
subsidizing all start-ups and instead focus on supporting the small subset of new businesses with high
growth potential. An interesting framework suggesting differences between policies for general SMEs
versus high-growth SMEs is presented by Autio et al. (2007) (see Table 2 - Principal differences between
general SME policy and High-Growth Entrepreneurship policy).
Table 2 - Principal differences between general SME policy and High-Growth Entrepreneurship
policy (Source: Autio et al. (2007))
SMEs Policy High-Growth Entrepreneurship Policy
Policy Goals
Objectives in relation to
entrepreneurs
Entice more people to
become entrepreneurs
Entice the right people to become
entrepreneurs
Objectives in relation to
entrepreneurial firms
Increase the number of new
entrepreneurial firms
Increase the growth of entrepreneurial firms
Objectives in relation to
operational environment
Facilitate the environment for
small business operation
Facilitate the environment for entrepreneurial
firm growth
Resource Provision
Source Mostly from public sources Combination of public and private sources
Type of financial resources Grants, subsidies, soft loans R&D loans and innovation grants, business
angel finance, venture finance, IPOs
Dominant service Basic advice for firm creation,
business planning, small
business operation
Experience-based advice for venture finance,
strategic planning, internationalization,
organizational growth
Resource distribution
principle
Ensure equal access for
everyone (resource spread)
Select promising recipients (resource focus)

18
Regulatory Emphasis
Life cycle focus Remove bottlenecks to new
business entry
Remove bottlenecks to entrepreneurial firm
growth
Compliance bottleneck Reduce cost of compliance
for small business
Smooth compliance requirements for growing
firms
Fiscal regulations Reduce VAT for small firms Accommodate dramatic changes in firm
scale; treat share options neutrally
Attitude towards failure Avoid failure, bankruptcy Accept firm failure and bankruptcy, but reduce
the related economic and social cost
Links to other policy
domains
Industrial, social and labour
policies
Industrial, innovation and labour policies
In the framework presented, the cornerstone referent to policy goals within the entrepreneurial activity
is the trade-off between quantity and quality. SME policy goals are focused on accentuate quantity and
stability, that is, increment the number of people who start new firms and furnish a stable environment
for small business operation. Whereas the limelight of high-growth entrepreneurship policy is to foster
quality and dynamism, in other words, to stimulate the environment for entrepreneurial firm growth and
to entice the right people and firms. This may lead to conflicts of interest, especially in economies with
scarce resources, regarding measures of provision of resources (Autio et al., 2007).
As stated before, in a high-growth policy ensuring that firms can achieve and sustain an above average
pace of growth as well as guarantee that the resources are being well channelled into the firms that are
almost tailor-made for the purpose is important, otherwise, is an undesirable waste of resources (state
failure theory)11. Despite HGFs being considered a core source of dynamism and an engine to economy
(Hölzl & Friesenbichler, 2008; Mitusch & Schimke, 2011), as previously seen, they face some step backs
that can act as constrains to their success (Lee, 2011), and their success at an early stage is
unpredictable (Fischer & Reuber, 2003). In more detail, Fischer & Reuber (2003) defend that we don’t
know where the growth is likely to come from so we cannot specify what type of measures taken by
policymakers would be effective and, even if we do know, the causes of success might be idiosyncratic
being difficult to replicate. This goes in line with Gibrat’s law (1931), which states that the growth of a
company is a random process.
Hypothesis 1: Public policies and their knowledge can influence high-growth achievement within a
firm.
11 State failure theory refers to the possible failure in governmental decisions, i.e. with inefficient
policies (Lilischkis, 2011)

19
2.3 What drives firms’ high growth?
2.3.1 Firm-level approach
Back into 1931, Robert Gibrat, formulated one of the first models of industry dynamics. His law stated
that small firms grow at the same rate as large firms and is based on the observation that the size
distribution of French manufacturing establishments closely resembled the lognormal distribution
(Daunfeldt & Elert, 2013).
In its simplest form, Gibrat’s law or “the law of proportionate effect” states that the size of a firm and its
growth rate are independent of each other - i.e. across a population of firms and over time, growth rate
of a given firm is scale-invariant and a random process that at any point is, on average, proportionate
or dependent of the firm’s size at the beginning of the period examined and, therefore, has no influence
on the firms’ growth rate in subsequent periods (Parker et al., 2010), implying that an economy related
with large enterprises towards small ones should have same issues regarding unemployment rate
(Sutton, 1997).
Several statistical regularities, identified by different researchers, however, contradicted Gibrat’s
assumption that firm growth is a purely random process (Sutton, 1997). Hart and Oulton (1996), found
faster growth in the smallest sized firms and Wagner (1992) for West Germany realized that those firms
growing faster in one period were more likely than others to have an above-average growth rate in
subsequent periods. In parallel, Smallbone et al. (1995) on their study highlights that HGFs were more
likely to be involved in export markets and many studies state that firms are more prone to achieve high
growth if they stay focused on making an effort to develop their competences (Andersson et al., 2007)
and that the strategy which is chosen is positively correlated with the ability of a firm to grow profitably
(Parker et al., 2010; Parnell, 2013). In addition, Stuart (2000) argues that younger firms are more likely
to have greater margins of growth, however, many author defend that the role of the entrepreneur is
preponderant to surpass and overcome eventual setbacks to growth-oriented firms that might put in risk
the firm’s survival (Davidsson et al., 2006), and correspond to the adaptability necessary to changes in
the related environment (Hashi & Krasniqi, 2011).
Hypothesis 2: The probability of a firm achieving a high-growth stage is conditioned by the firm profile
(example: age, dimension, be an exporter, etc.).
2.3.2 Individual (entrepreneur) level approach
The concept of entrepreneurship as well as the phenomenon in particular triggered a need to thorough
investigation due to its relevance in a wide range of areas (Davidsson et al., 2006). Researchers
recognize entrepreneurial activity as an input-completing and gap-filling for growth and prosperity
economy welfare and competitiveness (e.g. Audretsch, 2007; Acs et al., 2008). The constant churn of
20
business births and deaths is seen as vital for economic dynamism (Acs et al., 2013). Audretsch et al.
(2009), propose that entrepreneurship could be viewed as a spill over filter –a mechanism to filter/spill-
out knowledge from academia and other knowledge generation centres to society. Knowledge spill over
is an exchange of ideas among individuals (Alfred, 2001). The creation of new knowledge expands the
set of technological opportunities which allow entrepreneurs to identify and exploit favourable
circumstances (Acs et al., 2013) and have an impact on the decision making process inherent in the
entrepreneurial spirit to create a new firm. (Audretsch et al., 2009). Entrepreneurship is considered a
crucial mechanism of economic development (van Stel et al., 2005). Stevenson and Jarillo (1990) stated
that “entrepreneurship is the function through which growth is achieved”.
According to the European Commission (2008), the purpose of entrepreneurship education and training
is to “develop entrepreneurial capacities and mindsets that benefit economies by fostering creativity,
innovation and self-employment”. Richard Cantillon (1755) is reputable for being the first and foremost
responsible to identify the role of the entrepreneur in economic theory which were afterwards explored
by subsequent economists. Over time, the concept of entrepreneurship underwent many nuances and
reached a critical place among academic and economic research and public discourse (Rehn et al.,
2013). Entrepreneurship is a multidimensional concept arousing an extensive debate of what the word
really means, reason why there’s a failure of a single definition widely accepted in an undoubtedly way
(Giner et. al, 2016). This is aggravated in sequence of all the nuances that the term acquires, turning
difficult to converge on a fixed term (Chenhall, 2003; Vanaelst et al., 2006). However, for the aim of this
study, entrepreneurship can be conceptualized as “the discovery of opportunities and the subsequent
creation of new economic activity, often via the creation of a new organization assuming the risks and
rewards of it” (Reynolds, 2005), and so, an entrepreneur can be characterized as the person who
creates a new business or the one who exploits a business opportunity and takes advantage of it and
searches for change (Hashi & Krasniqi, 2011). Nevertheless, a new business can be started by more
than one person, that is, a collective called entrepreneurial team and an individual can become part of
that entrepreneurial team at any moment of the maturation of the firm (Cooney, 2005). In this way,
arises the need to define an entrepreneurial team which can be conceptualized as two or more
individuals who jointly start a business where both share financial interest and participate actively in the
development of the firm. (Cooney, 2005). Constantly entrepreneurs and entrepreneurial teams fuel
economic growth and contribute to economies competitive edge (Porter, 1990).
Despite the acquired importance, there is still much to know about the backgrounds, motivations, and
beliefs of the entrepreneur within HGFs (Wadhwa et al., 2009). Understanding the firms’ profile and how
entrepreneurs’ past history and profile, the mindset and strategies adopted could trigger the
entrepreneurial spirit and foster high growth entrepreneurship can be helpful to understand the
phenomenon, define support methodologies and enlarge the amount of successful entrepreneurs
(Praag & Versloot, 2008).

21
2.3.2.1 Entrepreneurs’ profile and background
The literature has continuously examined the relationship between entrepreneurs (or entrepreneurial
teams) and firm overall performance, stating that it’s assumed that the individual characteristics and
managerial background of the top management individual (or team) can shape the culture, overall
performance of the firm he leads, general organizational outcomes as well as strategic choices (Balboni
et al., 2014). The question whether entrepreneurs are born or made still has no answer. Which will weigh
more: certain genetic characteristics and personality traits or our background, experiences and
influences? It’s divisive, however, it’s certain that high growth relies on the capability to have good
business performance, and managerial competences and skills are a key factor for the appearance of
HGFs, especially for those who want to survive on a dynamic and competitive market (Olawale & Garwe,
2010). However, fundamental elements of human capital as entrepreneurs’ education, skills and his
previous experiences will influence how entrepreneurs devise and perform the strategy for their business
(Burke et al., 2010; Senderovitz et al., 2016).
Brüderl and Preisendörfer’s (2000) research presented consistent results highlighting a positive
correlation between high growth and previous management experience. Firms tend to perform better
and have better survival rates in the present of an entrepreneur with previous business experience
regarding learning effects derived from past entrepreneurial experience that can be used in subsequent
business (Minniti and Bygrave, 2001). Nonetheless, there are some differences between having
management experience in a firm already established in the market and on start-up which is an
emerging new venture passing through evolutional stages (Vanaelst et al., 2006). And so, several
studies distinguish the importance of previous management in an entrepreneurial setting (Stam and
Wennberg, 2009). The reason for entrepreneurial management experience being seen also as a driver
of high growth is that such practice is relevant in the process of transposing knowhow acquired from
preceding entrepreneurial events to the new venture, sharpening entrepreneurial judgement, by this
means having a direct impacting on its survival and growth rates (Florin et al., 2003). Additionally, Minniti
and Bygrave (2001) also stated that previous experience in the same industry/area is a strong foretoken
of high growth which is corroborate by several further studies (Barringert al., 2005; Florin et al., 2003;
Siegel et al., 1993). Industry expertise is commonly gauged as a simple indicator (Stam and Wennberg,
2009) based on the number of prior assignments within a specific industry (Florin et al., 2003) or on the
number of years an individual spent working there (Barringer et al., 2005; Siegel et al., 1993).
Duchesneau & Gartner (1990) defend that all entrepreneurs don’t need to fit a specific stereotype profile
gathering specifically and exactly share the same characteristics to build a successful business.
However, for Koryak et al. (2015), there are some general entrepreneurs’ characteristics both in the
form of experience, education and profile which are an important influence upon the success in
organizations and are expected to support firms’ growth. Different visions and opinions have been
collected in the past years. For example, Wickham (2006) has stated that an entrepreneur needs to be
should be willing to take risk, creative and necessarily innovative. And so, to conceptualize the term

22
innovation, in this work is adopted Schumpeter’s (1947) definition: “doing of new things or the doing of
things that are already being done in a new way” which can be products, services, processes or
technologies that are a novelty within the firm or within the industry where the firm operates. This goes
in line with the study Holzl’s (2009) performed of HGFs from sixteen different European countries which
states that HGFs are more innovative than firms who don’t achieve high-growth (Coad and Rao, 2008;
Stam and Wennberg, 2009; Parker et al., 2010). Curiously, Pajarinen et al. (2006) have indicated that
entrepreneurs who tend to be more innovative are the ones who have higher academic background.
Many researches, conducted in different years, emphasize the relevance of educational levels of the
entrepreneur as a key element to justify high growth (Barringer et al., 2005; Hölzl, 2009; Senderovitz et
al., 2016). Demir et al., (2016) state that, on the strategic management of HGFs, human capital is the
most predominant theme, where education and skills are a prime element. The literature on HGFs refers
to distinct variations of human capital, counting on the educational level and skills of entrepreneurs-
managers, management expertise, industry, market and technology knowledge and organizational
capabilities (Coff and Kryscynski, 2011). Capabilities, on an organizational level, are central means for
creating, shaping, and, if necessary, reconfiguring the firm’s resource base and so, are required for the
firm’s growth and competitive advantage (Barney, 1991; Teece et al., 1997). In addition, Bjuggren et al.
(2013) defends that having a family background has a positive impact on a firms’ growth and also,
Delmar et al. (2003) highlights age, Coad and Hölz, (2012) the gender and Bibu & Sala (2014) strong
networking.
Lastly, Wadhwa et al. (2009), conduct a survey with 549 entrepreneurs, focusing on relating
backgrounds of entrepreneurs with high-growth from a variety of industries and countries. In their study,
Wadhwa et al. (2009) concluded that:
❖ Entrepreneurs tend to be middle-aged and well-educated, and did better in high school
than in college;
❖ Entrepreneurs tend to come from middle-class or upper-lower-class backgrounds, and
were better educated and more entrepreneurial than their parents coming from different
areas;
❖ Most entrepreneurs are married and have children;
❖ Entrepreneurs share an early interest and propensity to start companies.
Therefore, the profile and background of the entrepreneur, and differences in the environment they face
are likely to impact on the likelihood of achieving venture viability (Burke et al., 2010). However,
independently from the background and profile, not all the entrepreneurs are successful and not every
company experiences an above-average growth. Most small firms do not even grow. Indeed, there are
also many business owners, who, for some reason, depending on the type of venture they are seeking
to create, don’t even have any ambition to grow (BERR, 2008).

23
Hypothesis 3: There is a correlation between aspects of the entrepreneur profile and background and
the achievement of high-growth of the firm.
2.3.2.2 Entrepreneurs’ motivations and intentions
The combination of intentions and motivational factors that influence the decisions of a person are
indicators of how steadfast entrepreneurs are willing to try and how much of effort they are planning to
bring to bear to achieve the final purpose. Entrepreneurs differ in matter of orientation and intents
towards growth (Dutta and Thornhill, 2008) and the choice of creating a firm is a challenge, since for a
fruitful launch of the venture there are many different resources and requirements needed as well as the
right motivation (Vanaelst et al., 2006).
A motivated founder, regarding the vision, goals and strategies is a key factor in the growth process of
a new firm (Balboni et al., 2014). Through the last decades many researchers have been analysing the
motivation for entrepreneurs to form a new business (Park, 2009), and some point the explanatory
motive being linked to job dissatisfaction and unemployment (Audretsch et al., 2004). There are plenty
of researches that sustain compelling evidence that unemployment pushes individuals to start their own
businesses, however according to Millán (2014) entrepreneurship arising from a previous past of
unemployment periods tends not to elicit sustainable growth and the firms are more susceptible to fail.
Orser (1997), in his study, found that growth intentions of a business manager can be influenced by
their own experience, direct influence of others and the perceived feasibility of success. According to
Brush et al. (2009) the results from different studies are consistent showing that entrepreneur’s
motivation is related to his knowledge of the market, competition and based on his previous experience,
which is also positively correlated with above-average growth. A reason for the positive effect of
preceding management involvement on above-average growth is that previous knowhow, network, and
inner knowledge of the “rules of the game” help to forge the ideal conditions and provide the confidence
required through which entrepreneurs decide to enter in the business and resort growth-oriented
strategies to address the market (Brüderl and Preisendorfer, 2000). However, also interdependencies
between institutions, governance, access to financial capital and other resources are relevant to trigger
entrepreneurial spirit (Gujrati, 2013) and sometimes one strategic step to take (or a necessity) is to add
partners firms to increment the human capital, available resources or to increase the ease of achieving
tactical requirements (Federico, Kantis and Rabetino, 2009).
The path followed by the entrepreneur (or individual who attempts to become an entrepreneur – nascent
entrepreneur) can be the result of positive factors such as financial access and implications, contribution
to the community and recognition of the value added but can also be negatively subjective to issues
such as work-family balance, stress, potential loss of control and overall monitoring of the firm. The
counter-balance of these factors combined also have a share in the definition of the entrepreneur’s
growth intentions (Acs et al., 2008)

24
There’s a widespread belief that the entrepreneurs’ growth intentions and motivation have an inter-
relationship with actual growth (Kolvereid and Bullvag 1996, Delmar and Wiklund 2008), however plunge
from an one-man firm to stablish a growth pattern is a major challenge for entrepreneurs (Trondsen,
2016). As soon as the firm attain certain size begins to arouse the interest of inventors who can provide
knowledge, founds and know-how, relaying on preliminary stages, the period where the firm is more
vulnerable (Trondsen, 2016). In this line of thought, Demir et al. (2016) conduct a review on thirty-nine
articles with the purpose of perceive the principal salient drivers leading to a firms’ high growth as well
as explore and synthesize into a conceptual framework the differences in the management of HGFs
from firms which don’t achieve the same status. Despite the base of research remaining fragmented
regarding differences in definitions, categorization measures and used frameworks, by directing a
review of the extant literature and identifying the independent variable(s) and considering high growth
as the dependent variable, this work aimed to identify thematic commonalities, relating them and
manage to isolate five principal drivers of high growth: human capital, strategy, human resource
management, innovation, and capabilities. Notwithstanding the fact that these five common facts tend
to be studied majority separated from each other, Demir et al. (2016) state when building a framework,
it’s important to consider that some of the independent variables identified act as moderating variables
stablishing relations with the others. Therefore the framework created by Demir et al. (2016) outlines a
set of drivers (independent variables) that confine high growth (dependent variable) and a set of
contingent instruments moderating these drivers as one can observe below in Figure 6 – A conceptual
model of strategic drivers of high growth),
Figure 6 – A conceptual model of strategic drivers of high growth (Source: Demir et al., 2016).

25
As it’s possibly to see in Figure 6 – A conceptual model of strategic drivers of high growth, the literature
review carried out by Demir et al. (2016) accumulates evidence suggesting a direct relationship between
Human Capital, HRM, Strategy, Innovation and Capabilities and high growth identified with solid lines
establishing the connections between the variables. As stated before, several studies from the literature
reviewed on the research from Demir et al. (2016) suggest moderate relationships between the
independent variables. In other words, the impact of certain independent variables on high growth is
influenced by another independent variable. However, it is of extreme relevance that strategy plays a
central role being a major predictor of high growth and a central influence on the other variables (Demir
et al., 2016). Strategy, or strategic planning, and its implication on high growth are the focus of almost
half of the thirty-nine papers from the literature review conducted by Demir et al. (2016).
Shuman et al.’s (1985) analysed the 500 fastest-growing companies in different industries in the United
States of America and proved that the pace of growth is positively correlated with the formalization of
strategic-planning practices. Strategic management closes the gap between the business manager and
the pursuit of above-average performance via synchronized opportunity-seeking and advantage-
seeking attitudes (Sirmon et al., 2003). Opportunity seeking assimilate the process of planning areas of
future activity for the firm, driving paths and efforts to acquire and integrate new and already existing
knowledge as a learning process (Bingham et al., 2007). It is stated that strategy will prevail to enhance
the entrepreneurship performance (Senderovitz et al., 2016).
Hypothesis 4: the increase in turnover of a company hinges on the motivations and intentions from the
entrepreneur.
2.4 Strategic management
The term strategy can be defined as the combinations of decisions within a firm that mirrors its
objectives, purposes, or policies and contributes positively to make the leap from the firm’s plans and
achieving its goals as well as competitive advantage over the rival firms (Demir et al., 2016). A firm can
achieve competitive advantage over the others rival firms by implementing strategies which will exploit
firms’ internal strengths, through capitalizing the existent and emerging environmental opportunities,
while reducing the negative impacts of internal weaknesses and neutralizing external threats, as
suggested in figure 7 (Barney, 1991).

26
Figure 7 – The relationship between traditional “strengths-weaknesses-opportunities-threats”
analysis (Barney, 1991)
The existence of competitive advantage is not defined by a period of calendar time, but for the ability to
implement a value creating strategy that potential and current competitors are unable to simultaneously
replicate and implement, and these other firms cannot duplicate the benefits of this strategy (Grant,
2001). In a simple conceptual form (Figure 8 – A Resource-Based Approach to Strategy Analysis: A
Practical Framework (Grant, 2001)), it is stated that strategies can be defined as the match a firm makes
between internal analyses of organizational strengths and weaknesses (resources and capabilities) and
external analyses of opportunities and threats (environment) and how they are matched to obtain
competitive advantage.
Figure 8 – A Resource-Based Approach to Strategy Analysis: A Practical Framework (Grant,
2001)
High growth firms represent an extremely peculiar context to observe strategies for firm growth and its
heterogeneously distributed variable resources and capabilities as well as the specific challenges and
threats that firms face (Delmar et al., 2003). As stated before, the acknowledge of the internal (resources
and capabilities) strengths and weaknesses will allow to explore in a better way the opportunities and
threats from the surrounding environment, traducing that into competitive advantage. On the other hand,
Resources
•Identify and classify the firm's resources.
•Appraise strenghts and weaknesses relative to competitors.
•Identify opportunities for better utilization of resources.
Capabilities
•Identify the firm's capabilities: What can the firm do more effectively than it's rivals?
•Identify the resources inputs to each capability, and the complexity of each capability.
Competitive Advantage
•Appraise the rent-generating potential of resources and capabilities in terms of: (a) their potential for sustainable competitive advantage, and(b) the appropriability of their returns.
Strategy
•Select a strategy which best exploits the firm's resources and capabilities relative to external opportunities.

27
the competitive advantage relies on the strategy, and consequently strategic management, for firms’
success. Many authors have analysed a correlation between strategic management and observed
variation in survival and growth rates and their importance since day one (Smallbone, Leig and North,
1995; Shafer, Smith and Linder, 2005; Foster and et Al, 2011; Parnell, 2013). Geroski et al. (2010)
stated that the conditions under a firm is born and the strategic decisions made will have a significant
impact on its survival changes, and that may last for many years, despite decreasing as the time goes
by, rejecting the null hypothesis on their study referring that only current conditions matter. Therefore,
due to this temporal distinguish, Geroski et al. (2010), in their study, also suggest that policy makers
ought to clearly distinguish from neo-natal and post-natal policies.
Many researchers share a strong belief that human capital and hiring strategies are important to help to
understand the post-entry performance of a firm - in particular, their initial workforce characteristics
(Agarwal et al., 2011; Muendler et al., 2012; Andersson and Klepper, 2013). Studies conducted in
different countries corroborate that firms employing a workforce with a higher level of education are
more productive on average (Demir et al., 2016), for example Koch et al. (2013) have analysed a dataset
from Germany and stated that, for a start-up, employing a larger share of workforce with higher levels
of education have an important positive impact on post-entry growth on new firms.
The role of the entrepreneur as strategic leader is characterized by his strategic thinking, his capacity
to control globally the organization and interact with external stakeholders. Subsequently, the
entrepreneur, besides acting like a leader within the organization’ structure, needs to powder the vision
that he wants for his employees to share and to extol the potential of his team building business
strategies that promote a sustainable competitive advantage for the firm (Teece, 2010 and Bibu & Sala,
2014).
As seen before, the way capital and human resources are allocated and managed is of critical
importance, especially since the fact that usually the same mistake in new born firms come up with more
significant consequences than in a larger firm, particularly if the new born firm opts for a single-product
strategy (Trondsen, 2016). To shield from this inherent vulnerability HGFs tend to have more than one
product/service and operate in more than one market (Demir et al., 2016). To help firms articulate and
interconnect goals and detail how they plan to achieve those goals with a higher rate of success some
authors defend that formulating a well-sustained formal plan, as a business plan or business model, is
extremely helpful (Demir et al., 2016). However, inflexible premises can restrict the preponderance of a
firm to achieve above average growth or at least limit it (Levy et al., 2011).
2.4.1 The value of formal plans to strategic management
Some researchers claim that formal plans add meagre value or show a dimly positive plan-performance
relationship (Brews and Hunt, 1999; Grant, 2003), and so, a firm would perform better without them
(Carter et al. 1996; Lange et al., 2007) because formal plans might retard the nimbleness of decision

28
making, stifle improvisation and constrain flexibility with the introduction of rigidities that can be a
hindrance towards innovation and lead to confusing and redundant bureaucracy (Bresser and Bishop,
1983; Miller and Cardinal, 1994). Mintzberg (1987) in his work even describe formal plans like “setting
oneself on a programmed course in unknown waters, which is the perfect way to sail straight into an
iceberg”. Additionally, several economics use the illustrious phrase Mike Tyson said in an interview
before a match: “everyone has a plan 'till they get punched in the mouth” to illustrate and metaphorize
the idea that it’s worthless to develop a formal plan that might be obsolete few months later or won’t
survive first contact with the external environment and that formal plans may provide an illusion of control
that is not real (Dencker et al., 2009a).
Greene and Hopp (2017) state that the extant literature, and the consequent empirical evidence,
remains oppositional and conflicting regarding if it pays to plan. In this sense and, consequently, in stark
contrast with the review above, many other researcher and economics share a different opinion. Recent
academic research states that writing formal plans provide a rational synopsis of the process required
to develop a viable venture (Delmar and Shane, 2003). Formal plans provide an intrinsic relation with
the development of methodical goals and a concrete path to follow that allows firms to adequately
coordinate resources and integrate activities (Miller and Cardinal, 1994; Wolf and Floyd, 2013). The
value of plans is acknowledged, even when uncertainty is high, to help the establishment of a framework
for adaptive thinking (Anderson, 2004) and aid foresee the timing of resource flows and ease constraints
in the coordination and allocation of resources, supplies and demands, creating a positive correlation
between formal plans and the accomplishment of new venture viability and above-average performance
effects (Greene and Hopp, 2017). Furthermore, plans support managers to have confidence in their
actions and favour the deployment of organizational values and strategic goals (Falshaw et al., 2006).
Lastly, formal plans help to identify opportunities to reinforce decision making prior to time and resource
investment, simultaneously in terms of concentrate the inherent assumptions made and to identify gaps
and missing information (Boyd, 1991). In a simpler way, written formal plans offer a rational synopsis of
the steps compulsory to develop a viable venture (Greene and Hopp, 2017).
Formal plans might as well help a firm to map and synthetize what is necessary to drive the business,
promoting adaptive thinking and schematizing knowledge about how to respond interrogations as
“where is the business now?”, “where does it want to be” and “how is it going to get there?” (Ansoff,
1991; Miller and Cardinal, 1994). In fact, as a boundary-spanning mechanism, formal plans might aid a
firm to select, evaluate and refine a nascent business and, during the process, dwindle mistakes and
help to dodge hazards that derail the emerging venture (Delmar and Shane, 2003). That said, formal
plans grease the wheels to detail how the opportunity is to be seized, which resources are implicit and
how does success look like, being vital to building legitimacy to catch the attention for investment
decisions from investors, banks and venture capitalists, likewise, formal plans are an important
communicative tool and might play a significant role in convincing employees of the entrepreneur’s
strategic intentions (Honig and Karlsson, 2004). Consequently, formal plans may aid surpass liabilities
of newness and orchestrate fledgling business propositions (Greene and Hopp, 2017).

29
Formal business planning within SMEs is frequently associated with a process whereby the owner
manager(s) of the firm systematically attempt to examine their business environment and establish a
framework and direction for future activities. By its nature formal business planning requires
organization, analysis, discipline and a willingness to make a commitment (at least to paper) of a
particular course of action in a given direction. (Mazzarol, 2001) In syntheses, a formal plan can be
defined as written script that detail opportunities to be seized, markets to be served, proposed
product/services, what success looks like, and what resources are required, and it can be key to the
investment decisions of angel investors, banks, and venture capitalists (Greene and Hopp, 2017). An
abiding debate among economic and strategy literatures regards the positive or negative effects that
formal plans might have for entrepreneurs in achieving venture viability and performance, especially
regarding that requires time and place to write a complete formal plan that might not serve of no use
during the initial stages of a firm if you don’t test your assumptions in the real world (Delmar, 2015).
Throughout the road of value delivery pursuit, many ideas include a paradigm shift ending up not to be
in line with the business later (Chesbrough and Rosenbloom, 2002). To Ash Maurya12 the problem is
that firms have attention paucity on the foundation of a vision and strategy to make sure it connects to
costumers’ expectations and entrepreneurs tend to fall in love with one idea too early. Peculiarly in the
initial stages, new ventures are marked for uncertainty, volatile scenarios and constant churn, being a
very complex and demanding task to start a new business where many variables need to be considered
since that doesn’t exist an operation historical to consult. Entrepreneurs need to define the boundaries
of the business they want to create being well aware of the dynamic setting, innovation speed, product
development, costumers’ behaviours, governmental regulations, key partners, emergence of copycats
and a globalized market (as the example of the Chinese one), as well as many other environmental
factors that have a considerable impact on the organization (Goktan and Miles, 2011; Mulders and van
den Broek, 2012). In parallel, a business opportunity has a limited time span (to avoid product
obsolescence and to guarantee faster action than possible competitors) and so, entrepreneurs, within
an uncertain environment, must process information and make decision rapidly, even before exists
demand. It follows that one of the core reasons for failure among new ventures is their lack of processes
that permit a rapidly validation of their idea of business opportunity, i.e., trial-error dynamics supporting
or changing the assumptions from the very initial stages (Lee et al., 2002). Eric Ries13 states that “ideas
turn into businesses once they find a repeatable and scalable plan”, however, at the same time, firms
arise from business opportunities that need to be introduced quickly in the market. To conjugate all of
this, entrepreneurs need a rapid solution to schematize their idea, identify their customers segments
and test their markets. Following this need, to schematize how the business is going to generate and
capture value, was introduced the concept of a simple visual framework that allows to adjoin and
12 the author of the international bestseller “Running Lean: How to Iterate from Plan A to a plan that
works” and the creator of the one-page business modelling tool “Lean Canvas”
13 The author of the book “The Lean Startup”.
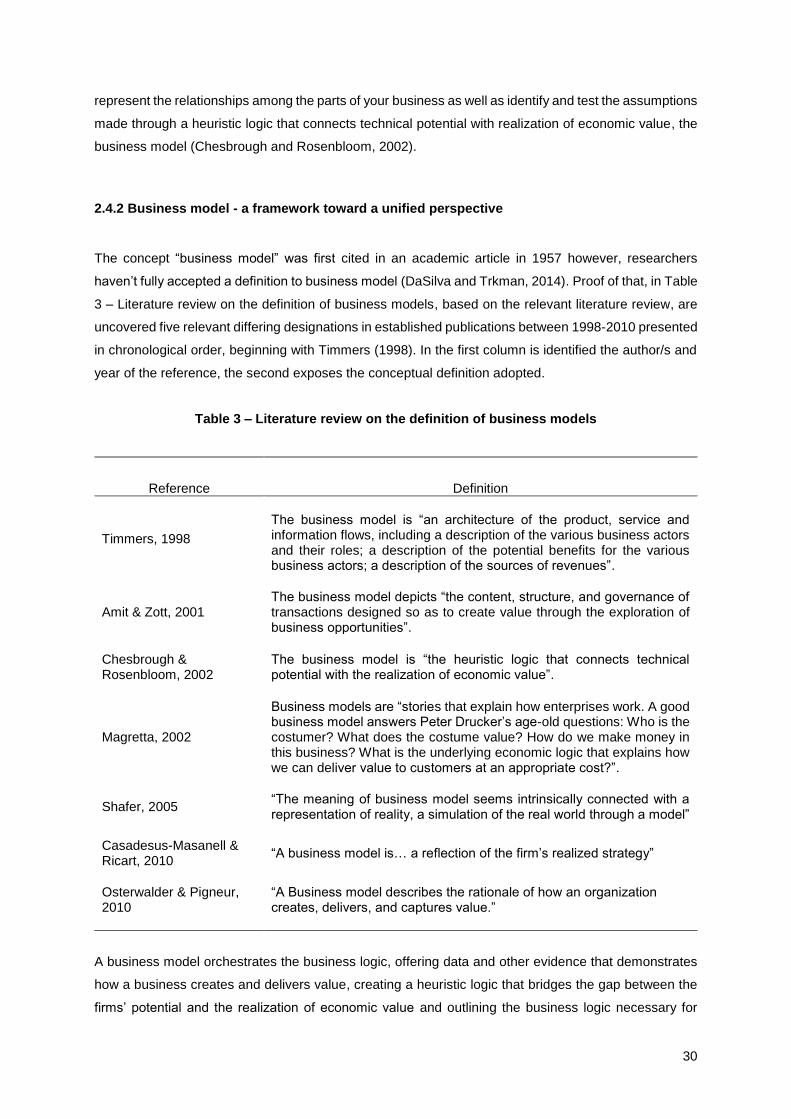
30
represent the relationships among the parts of your business as well as identify and test the assumptions
made through a heuristic logic that connects technical potential with realization of economic value, the
business model (Chesbrough and Rosenbloom, 2002).
2.4.2 Business model - a framework toward a unified perspective
The concept “business model” was first cited in an academic article in 1957 however, researchers
haven’t fully accepted a definition to business model (DaSilva and Trkman, 2014). Proof of that, in Table
3 – Literature review on the definition of business models, based on the relevant literature review, are
uncovered five relevant differing designations in established publications between 1998-2010 presented
in chronological order, beginning with Timmers (1998). In the first column is identified the author/s and
year of the reference, the second exposes the conceptual definition adopted.
Table 3 – Literature review on the definition of business models
Reference Definition
Timmers, 1998
The business model is “an architecture of the product, service and information flows, including a description of the various business actors and their roles; a description of the potential benefits for the various business actors; a description of the sources of revenues”.
Amit & Zott, 2001 The business model depicts “the content, structure, and governance of transactions designed so as to create value through the exploration of business opportunities”.
Chesbrough & Rosenbloom, 2002
The business model is “the heuristic logic that connects technical potential with the realization of economic value”.
Magretta, 2002
Business models are “stories that explain how enterprises work. A good business model answers Peter Drucker’s age-old questions: Who is the costumer? What does the costume value? How do we make money in this business? What is the underlying economic logic that explains how we can deliver value to customers at an appropriate cost?”.
Shafer, 2005
“The meaning of business model seems intrinsically connected with a representation of reality, a simulation of the real world through a model”
Casadesus-Masanell & Ricart, 2010
“A business model is… a reflection of the firm’s realized strategy”
Osterwalder & Pigneur, 2010
“A Business model describes the rationale of how an organization creates, delivers, and captures value.”
A business model orchestrates the business logic, offering data and other evidence that demonstrates
how a business creates and delivers value, creating a heuristic logic that bridges the gap between the
firms’ potential and the realization of economic value and outlining the business logic necessary for
31
value creation and delivery, specifying the fundamental requirements (Teece, 2010). Business models
provide a powerful way for entrepreneurs to represent the cognitive connection between the business
appraisal of the opportunity and its exploitation as well as evaluate and communicate with their strategic
choices (Shafer et al., 2005). To obtain the most of shareholder value, entrepreneurs must architect and
implement strategies which empower their firm to outperform rivals, achieving competitive advantage –
when firms profit growth is higher than the average of other firms competing under the same
circumstances. Strategy can be seen a position regarding choices due which products or services will
the focus for each market and can been seen also as perspective referent to choices due to how the
business is conceptualized (Teece, 2010). Business model it’s not the exhibition of the strategy itself,
what a business model does is to facilitate analysis, testing, and validation of a firm’s strategic choices
regarding strategic management and to schematize the repercussions of the cause-and-effect
relationships that flow from the strategic choices that have been made (Shafer et al., 2005). Before
deciding about the best strategic path to follow, business managers can translate a set of strategic
choices into a range of business models at the same time, simulating a different grouping of strategic
decision, which they analyse, test and validate before making any conclusion (Chesbrough &
Rosenbloom, 2002). It’s has been proved that the long-term probability of success intensifies with the
thoroughness and formality that a firm tests its strategic alternatives through business models (Shafer,
Smith and Linder, 2005). Business models can represent a major driver of growth and well-succeeded
new ventures are the ones that can efficaciously adjust their business models over time having in mind
that competition is a race without end (Balboni et al., 2014).
“…. Formula 1 teams have highly complex and extensive systems infrastructure both on and off the
track. The same logic applies to start-up’s, the faster they need to go, the more management control
infrastructure they need.” – Foster et al. (2010).
The meaning of the business model seems intrinsically connected with a representation of reality, a
simulation of the real world through a model (Shafer et al., 2015). A simply way to describe a business
model is the adopted by Osterwalder & Pigneur (2010) in their Business Model Canvas. framework
(Appendix A – Business Model Canvas framework), which produces a more flexible plan that can be
tested and changed continuously to validate the entrepreneurial project.
2.4.2.1 Business Model Canvas
The BMC concept streamlines a way to simply describe the principal areas of a business and to
manipulate logical strategic alternatives, providing a systematic and interactive way to organize the
assumptions made so that they can be examined and tested. Due to the simplicity of this visual narrative,
provided by a single-page framework, beside creating a clear picture of how a business aims to make
money, it’s possible to rapidly draw a new canvas every time it is necessary an adaptation and to keep
track of every modification a business model goes through. Consequently, and over time, the model can
be converted into a flip book that shows how a business has evolved. In synthesis, a BMC provides the

32
groundwork for structuring the business and accompanies each iteration made outlining the way in which
the business articulates its different components (Osterwalder and Pigneur, 2010).
The BMC schematizes and describes the elements of a business model, adapting them into distinct and
interactive modules that predictably influence one another forcing entrepreneurs to, at the same time,
consider each element of the business individually but also as a whole. The individual elements prompt
knowledge of a business’ full scope, while the layout reassures a reflection about how the pieces fit
together. Therefore, Osterwalder and Pigneur (2010) believe that a BMC allows to visualize and test
businesses, without overcomplicating, through nine basic building blocks (Table 4 – BMC nine blocks
that show the logic of how a company intends to create, deliver and capture value, i.e., it’s a framework
where all the elements are interrelated, providing cohesion to the overall business model.
Table 4 – BMC nine blocks ( Source: Business Model Generation (Osterwalder and Pigneur,
2010))
Business Model Canvas - nine blocks Question to answer
Key Partnerships
The partnerships’ network arises from the need to get access to resources or to outsource certain activities. By doing this, a company seek better returns, optimizing and assuring the proper functioning of a business models or to reduce risk and costs. Business partners are alliances between two or more entities for both parts to benefit. We can distinguish between strategic alliances, coopetition, buyer-supplier relationships and join ventures
Who are our key partners and
what type of partnerships would
suit our needs?
Key Activities
Key activities are key business processes a company must perform to operate successfully and deliver a value proposition to customers segments through channels, generating the revenue stream. Key activities are pivotal in an organization and differ depending on business model to implement.
What key activities do our value
proposition, channels, customer
and revenue streams require?
Key Resources
Key resources are the tangible and intangible assets deployed to give response to the business requirements, and, as well as key activities, vary according to the type of business to implement. Key resources can be physical, financial, intellectual or human owned or leased by the company or outsourced from key partners.
What key resources do our value
proposition, channels, customer
and revenue streams require?
Value Propositions
Value Proposition describes the bundle of products or services that create value for the customer segments, i.e., satisfy a customer need, caters benefits or is a pain reliever, being the distinguish factor in the market place.
What value do we deliver to the
customer and which one of our
customer’s problems are we
helping to solve?
Customer Relationships
It is important that a company identifies the nature of relationships that wants to settle with each customer segment through the different channels as well define the overall customer experience strategy. The type of relationship with the customer can be fostered by one or more of the following motivations: range acquisition, retention and expansion (get, keep, grow)
What type of relationship does
each of our customer segments
expect us to establish and
maintain with them?
Channels
Channels are customers touch points that should describe the most effective way to reach and communicate with each customer segment. Channels are the company interface through which it liaises with customers, gives acknowledge and delivers the value proposition. A company can use different channels, which also can be physical or virtual.
Through which Channels do our
Customer Segments want to be
reached and which ones are
more cost-efficient?

33
Customer Segments
Customer segments are distinct groups of people in which customers can be segmented according to their mutual needs, behaviours and other attributes that a company aims to reach and serve, whom without, sovereign to which industry it operates, any company lasts. Customer segmentation is the recognition that are groups of consumers with dissimilar needs and behaviours, whom a company must decide to serve or to ignore. A company can serve one or several customer segments.
For whom are we creating value?
Cost Structure
The cost structure describes the relevant costs that can or will incur in financial weight during the operationalization of the business.
What are the most important
costs inherent in our business
model?
Revenue Streams
Revenue Streams are based on the value each customer segment is willing to pay for the value proposition provide by a company. In a business, the present and future earnings generated from each customer segment by a product or service should be greater that the cost structure before the lifecycle ends.
What are the revenues sources?
The BMC acts as a blueprint for the company strategy to be implemented through organizational
structures, processes and systems, helping managers to measure and monitor a more comprehensive
spectrum of indicators rather than solely financial ones (Osterwalder and Pigneur, 2010). Relating this
BMC nine block concept to the four standpoints of Norton and Kaplan’s Balanced Scorecard approach
(Kaplan and Norton, 1992), it is possible to state that the nine blocks cover four principal areas of a
business: customers, offer, infrastructure, and financial viability (Figure 9 – BMC areas of business).
The costumer area (costumer relationship, costumer segments and channels) labels the target
audience, explains the information flow traducing how the value proposition delivered is perceived and
enlightens which kind of relationship should be nurtured and maintained with each segment of clients.
The offer (value proposition) clarifies the products and/or services that is delivered to the market, i.e.,
communicates the persuasive reasons is best suited for a customer segment. The infrastructure area
(key partners, key activities and key resources) denotes the key activities essential to provide support
to execute a company’s value proposition and core processes, the key resources that are essential to
create and drive value for the costumer and the key partners, including business alliances, strategic
alliances and join ventures, who optimize operations and reduce risks of a business model. Lastly, the
financial viability area (cost structure and revenue streams) grants a visualization of the cash flow,
proving information respecting the sustainability of the company, the principal disbursements required
and the way a company is going to earn revenues from each customer segment.

34
Figure 9 – BMC areas of business (Adaptation from Business Model Generation (Osterwalder
and Pigneur, 2010)).
Hypothesis 5: Strategic management plays a significant role for entrepreneurs from HGFs.
Hypothesis 6: For most HGFs was produced a business model (such as BMC).

35
3. Methodology
Being an empirical work, this thesis has a theoretical basis implicit based on a broad set of articles,
working papers, thesis and reports. Therefore, this work, supported by the conceptual and applied
insights from its literature review firstly aims to unravel an accurate definition for the principal concepts
associated, to provide a wider vision on the subject from the mishmash of diverse theoretical
perspectives in integrated or holistic models and to pinpoint distinct theoretical hypotheses that might
help understand the business growth phenomenon and shed some light and accurate insights as a
result of meta-analysis. Then, is presented an outlook for future research in which it is presented the
data on HGFs in Portugal (describe a potential sample for a future empirical study) and describes a
potential research strategy based on semi-structured interviews.
• Problem statement: What factors have a positive impact on the high-growth of businesses?
Set of hypotheses that have been identified along the literature review:
• Hypothesis 1: Public policies and their knowledge can influence high-growth achievement within
a firm.
• Hypothesis 2: The probability of a firm achieving a high-growth stage is conditioned by the firm
profile (example: age, dimension, be an exporter, etc.).
• Hypothesis 3: There is a correlation between aspects of the entrepreneur profile and
background and the achievement of high-growth of the firm.
• Hypothesis 4: the increase in turnover of a company hinges on the motivations and intentions
from the entrepreneur.
• Hypothesis 5: Strategic management plays a significant role for entrepreneurs from HGFs.
• Hypothesis 6: For most HGFs was produced a business model (such as BMC).
The conducted data analysis method will be based on secondary data from the following source14:
(i) Instituto de Apoio às Pequenas e Médias Empresas – IAPMEI.
14 The source was contacted, and the raw data required is available for the research proposed.

36
Ultimately, according to the complexity and specificity of the subject, a complementary analysis is going
to be conducted more focused on the statistical information regarding the entrepreneurship in Portugal
through data that is accessible online on the websites from:
I. Eurostat;
II. The Global Entrepreneurship and Development Institute;
III. Informa D&B.

37
4. Entrepreneurship in Portugal
Entrepreneurship has important economic and social impacts and has an increasingly important role for
different reasons including job creation, innovative solutions development and to the dynamism of the
national economy and sectorial renovation (Sarmento and Nunes, 2010). Portugal has some of the
highest business entry rates when compared to other countries from the European Union (Nunes and
Sarmento, 2010) and in 2015, according to Eurostat data15, Portugal boasted more enterprises births
than any other country EU28, however, Portugal stands in the 19th position on European ranking of
entrepreneurship endorsed by the Global Entrepreneurship Index in the 2018’s report16, which is a
composite indicator of the health of the entrepreneurship ecosystem in a given country (Acs Z et al.,
2017). This is not surprisingly since, also in 2015, Portugal’s one, three-year survival rates of
enterprises were the second lowest and the five-year survival rate was the lowest in the EU28 as one
can see below (Figure 10 - One, three and five-year survival rates of enterprises in 2015). Studies
confirm that there is a trend showing that Portuguese firms present survival rates lower than other
European countries like Germany, Italy and Spain and that they are more likely to fail before the hazard
rate17 starts declining (Gal & Menon, 2014; Nunes & Sarmento, 2010).
Figure 10 - One, three and five-year survival rates of enterprises in 2015 (Source: business
demography statistics, Eurostat website)
15 Source: http://ec.europa.eu/eurostat/statistics-explained/index.php/Business_demography_statistics
16 Source: http://thegedi.org/2018-global-entrepreneurship-index/
17 In this case, the hazard rate, also known as failure rate, measures firm’s closure risk.

38
According to a survey carried out by INFORMA D&B with the impetus of analysing the entrepreneurship
in Portugal published in May 2017, on a five-year period (between 2012 and 2016), in Portugal, were
constituted almost 178 thousand of firms and other organizations, being 2015 the best year for
entrepreneurship in Portugal in the last decade (as one can see above in Figure 3 – Evolution of the
company’s constitution and other organizations in Portugal between 2007 and 2016). In this same study,
it is concluded that Portuguese firms have a higher pace of growth on the first years of existence. The
volume of employees increases, on average, in the first year 35% and it takes almost 8 years to double
its initial number, however, the business volume growths 139% in the first year and in the 8th year of
existence is, on average, five times higher (Figure 11 – Average pace of growth evolution on Portuguese
firms (employees on the left and business volume on the right).
Figure 11 – Average pace of growth evolution on Portuguese firms (employees on the left and
business volume on the right) (Source: Informa D&B (2017))
Contemporaneous economic decay in many economies around the globe sent out a global
entanglement concerning political shockwaves and, despite being in a process of structural
transformation and recovery, Portugal’s economy remains extremely vulnerable and very compromised
to cope with challenges related to fiscal stability likewise restoring financial-sector competitiveness,
besides, the indebted public sector is still a drag on overall economic dynamism (Carneiro et al., 2013).
Portugal experienced fast expansion in the second half of the 90’s, succeeded by a deceleration of
economic growth since 2001. Portuguese entrepreneurs started facing a financial and economic crisis
in the aftermath of 2008, aligned with a sturdy competition from emerging economics and a small internal
market deeply dependent on exportation which is an undeniable mishap and extra challenge, especially
for those who want to enter a new market or start a new project (Sarmento et al., 2013). This mentioned
financial and economic instability was also felt on the labour market resulting in catastrophically high job
destruction rates, record high unemployment rates, and massive long-term unemployment (Carneiro et
al., 2013). According to data collected, the growth of the unemployment rates, which had been stable
for decades, was so huge that the average rate of unemployment almost tripled from 2002 to 2013 as
one can observe below in Figure 12 - The Evolution of the unemployment Rate in Portugal (in %) –
1983-2017.
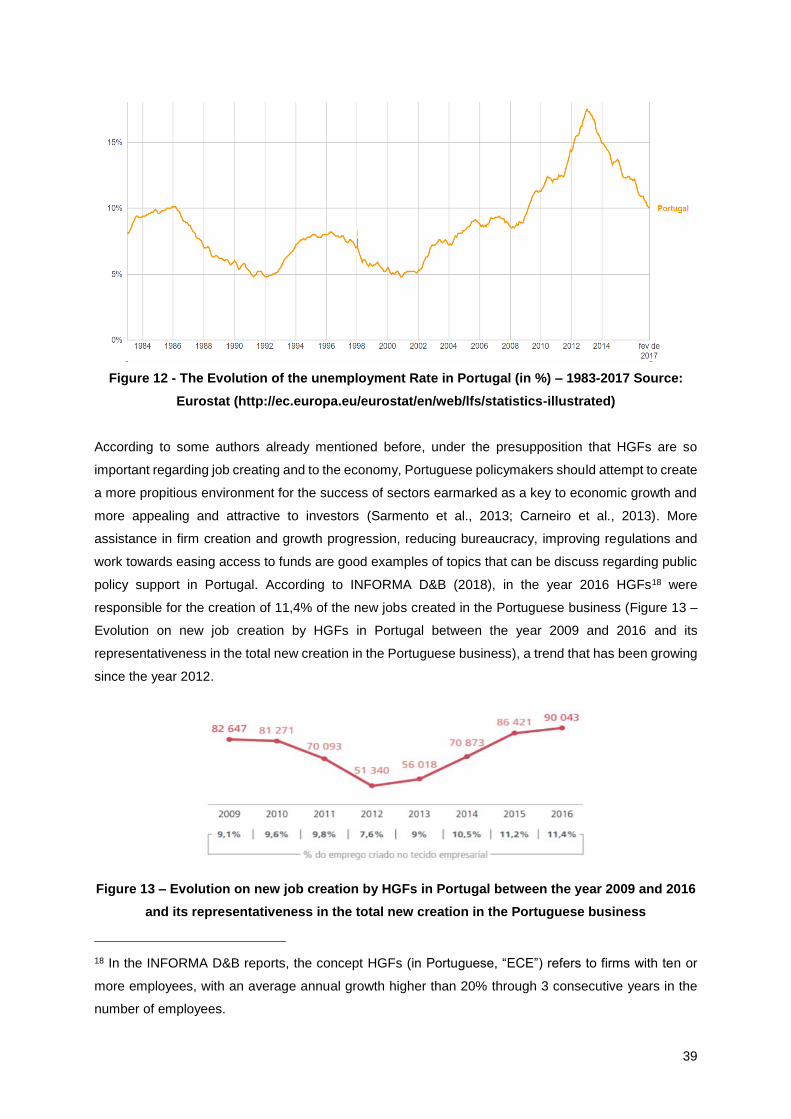
39
Figure 12 - The Evolution of the unemployment Rate in Portugal (in %) – 1983-2017 Source:
Eurostat (http://ec.europa.eu/eurostat/en/web/lfs/statistics-illustrated)
According to some authors already mentioned before, under the presupposition that HGFs are so
important regarding job creating and to the economy, Portuguese policymakers should attempt to create
a more propitious environment for the success of sectors earmarked as a key to economic growth and
more appealing and attractive to investors (Sarmento et al., 2013; Carneiro et al., 2013). More
assistance in firm creation and growth progression, reducing bureaucracy, improving regulations and
work towards easing access to funds are good examples of topics that can be discuss regarding public
policy support in Portugal. According to INFORMA D&B (2018), in the year 2016 HGFs18 were
responsible for the creation of 11,4% of the new jobs created in the Portuguese business (Figure 13 –
Evolution on new job creation by HGFs in Portugal between the year 2009 and 2016 and its
representativeness in the total new creation in the Portuguese business), a trend that has been growing
since the year 2012.
Figure 13 – Evolution on new job creation by HGFs in Portugal between the year 2009 and 2016
and its representativeness in the total new creation in the Portuguese business
18 In the INFORMA D&B reports, the concept HGFs (in Portuguese, “ECE”) refers to firms with ten or
more employees, with an average annual growth higher than 20% through 3 consecutive years in the
number of employees.

40
Despite there is a recent tendency for HGFs with higher dimension19 (in the number of employees) being
responsible for the most percentage of new jobs creation (when until 2009-2012 were the small medium
firms), medium-sized and small firms have increased their preponderance as job creators.
Figure 14 - Percentage of new job creation by HGFs by firms’ dimension – a comparison
between HGFs in the period 2006-2009, 2009-2012, 2010-2013 and 2013-2016
19 In the INFORMA D&B reports higher dimension firms, refers to firms with over 250 employees, small-
medium firms relate to firms with 50-249 employees and small firms are the firms with 49 or less
employees.

41
5. Data Description
This study uses data from IAPMEI (Instituto de Apoio às Pequenas e Médias Empresas e à Inovação),
a public organization for business support to SMEs founded on 1975. IAPMEI conducts an annual
initiative called “PME Excelência”. The PME excellence statute is awarded by IAPMEI and Turismo de
Portugal (in the case of tourism companies) in partnership with banks operating in Portugal. The
requested data contain information on the 3.000 Portuguese firms who presented an average growth
rate superior or equal to 5% in their total volume of businesses between the year 2013 and 2015. The
longitudinal coverage of the dataset, besides its high degree of reliability, makes this an appropriate
database for a wide-ranging study on entrepreneurship dynamics. However, four firms were discarded
from the analysis because didn’t have the compulsory data to be compared in the same basis. In parallel,
were also excluded outliers that might corrupt the analysis due to their completely discrepant levels of
growth compared to the remaining companies, therefore, the total of eight firms that presented an
average growth for this period above 500% or a total growth rate superior to 2000% were not considered.
Consequently, the total number of firms that were classified as eligible firms and, therefore, used as the
data set, were 2.988.
From this data set were grouped all the firms that were qualified as an HGF in the same period (2013-
2015), thus respecting the abovementioned OECD definition were identified 1.064 firms that have
experienced high growth in this period having the total volume of businesses as the growth indicator,
representing 35,61% of the eligible set of firms. At a later stage, the firms from this data set were also
clustered regarding the similarly aforementioned Gazelle definition, returning a set of firms compound
by 121 firms on behalf of 11,37% of the HGFs set of firms and only close to 4 (4,05) out of 100 of the
eligible set of firms are Gazelles.
Figure 15 – Total number of firms by set of firms
Throughout the analysis of HGFs and Gazelles, the focus of analysis will be the percentage of growth
in the total volume of business that firms in different scenarios present. Thanks to the fact that the
database not only present the average growth in the temporal space of the three years, it will be possible
observe not only the total percentage of growth from one period to another as well as the total growth

42
present separately in the year 2014 and in the year 2015. This will allow to observe if there were
discrepancies in the company's growth capacity over the period under analysis.
In the first instance, the focus of attention will be on companies from the original dataset that are eligible
for analysis (Figure 16 – Percentage of growth rates (turnover) for the eligible set of firms). In this set of
firms, the percentage of growth was blandest in the first year than in the second year. However, both
the proportion of growth in 2014, 2015 and the average were all superior to 20% (the reference value
for HGFs).
Figure 16 – Percentage of growth rates (turnover) for the eligible set of firms
Above were made considerations about the data set. It was observed that the sample of eligible HGFs
from the data set was 1064, and this section will focus attention exactly on these firms. Naturally, being
HGFs a subset of the eligible set of firms excluding the ones whose average growth rate (2013-2015) is
equal or inferior to 20%, the growth values on Figure 17 – Percentage of growth rates (turnover) for the
HGFs are transversely higher than the previous observed on Figure 16 – Percentage of growth rates
(turnover) for the eligible set of firms. However, there is a slight difference, HGFs present a total growth
rate superior in the first year (2014) than in the second one (2015) unlike the eligible data set, where
exactly the opposite happens.
Figure 17 – Percentage of growth rates (turnover) for the HGFs

43
AGE (firms).
The age of the companies in the database will be measured based on the start date of activity and, in
this scenario, for HGFs, the average age is 18,16 years old. Therefore, HGFs are mostly mature firms
(Gazelles only represent 11,37% of the firms). However, one can observe that an HGF may appear in
a very wide range of ages.
Table 5 - Analysis of HGFs’ age
The relationship between two quantitative variables (in this case, age and growth) by calculating the
correlation between these two variables, a statistical technique that can be used to determine the
degree to which two variables are related, calculated as follows:
𝑟 =𝟏
𝒏 − 𝟏∑ (
𝑥𝑖−�̅�
𝑆𝑥
) (𝑦𝑖−�̅�
𝑆𝑦
)
𝑛
𝑖=1
In Appendix B – Portuguese HGFs age and average annual growth rate (2013-2015)it is possible to
observe the age of each HGF and the respective average annual growth rate (2013-2015) (only this
sample of the total data due to confidentiality restrictions). Thus, applying the formula given above,
𝑟 = −0,19
Since the sign of r denotes the nature of association while the value of r denotes the strength of
association, it is possible to conclude that there’s an indirect relationship between the two variables, that
is, which means an increase in one variable is associated with a decrease in the other. However, since
r ranges between (-1) and (+1), according to the Figure 18 – Strength of correlation based on the value
of r, there’s a weak relation among the two variables.

44
Figure 18 – Strength of correlation based on the value of r
Exportations
For this study, it was considered that an exporting firm is a firm that in 2015, presented any volume of
exports. Hence, as we can see in Table 6 – Percentage of exporting and non-exporting HGFs the
majority of HGFs are exporting firms, representing on average 36% of their total turnover. Are accounted
as exporting firms 61% of the total HGFs, that is, a total of 653 firms.
Table 6 – Percentage of exporting and non-exporting HGFs
Despite being in greater numbers, contrary to what would be expected, HGFs that do exportations
present in all the scenarios a lower growth rate (turnover) than non-exporting HGFs as one can observe
in Figure 19 – Comparison between percentage of growth rates (turnover) for exporting and non-
exporting HGFs.
Figure 19 – Comparison between percentage of growth rates (turnover) for exporting and non-
exporting HGFs

45
For a more detailed analysis the exportation firms were also grouped in quartiles according to the weight
of exports in the total volume of business, thus, to do that, it is compulsory to calculate the percentage
of exportations over total turnover in the year 2015 as follows:
𝑃𝑒𝑟𝑐𝑒𝑛𝑡𝑎𝑔𝑒 𝑜𝑓 𝑒𝑥𝑝𝑜𝑟𝑡𝑎𝑡𝑖𝑜𝑛𝑠 𝑜𝑣𝑒𝑟 𝑡𝑜𝑡𝑎𝑙 𝑡𝑢𝑟𝑛𝑜𝑣𝑒𝑟 (2015) =𝑉𝑜𝑙𝑢𝑚𝑒 𝑜𝑓 𝑒𝑥𝑝𝑜𝑟𝑡𝑎𝑡𝑖𝑜𝑛𝑠 𝑖𝑛 2015
𝑇𝑜𝑡𝑎𝑙 𝑣𝑜𝑙𝑢𝑚𝑒 𝑜𝑓 𝑏𝑢𝑠𝑖𝑛𝑒𝑠𝑠 𝑖𝑛 2015 ×100
The total number of firms belonging to each quartile are shown in Table 7 - Number of exporting HGFs
by quartile. As one can observe, mostly HGFs present a percentage of exportations over total turnover
(in 2015) under 25%, however, the second largest quartile it’s the opposite extreme, firms with over than
76%.
Table 7 - Number of exporting HGFs by quartile - percentage of exportations over total turnover (in the
year 2015).
Although they are represented in smaller number, and, as a whole, exporting companies presenting
lower levels of growth comparing to non-exporting firms, the 78 firms that present between 51% and
75% of total volume of exportations over total turnover (in the year 2015) are the ones that have a higher
growth margin, as one can observe in Figure 20 - Average annual growth rate [2013-2015] for exporting
HGFs by quartile vs non-exporting HGFs.

46
Figure 20 - Average annual growth rate [2013-2015] for exporting HGFs by quartile vs non-
exporting HGFs.
Geographic Distribution
To analyse the variable of the geographical component, in this work, the firms will be grouped based on
existing aggregator category, the district.

47
Figure 21 – Number of HGFs in Portugal (2015) by geographic distribution20
In Figure 21 – Number of HGFs in Portugal (2015) by geographic distribution, one can observe the
geographic distribution of HGFs in Portugal (on the left) as well as the respective absolute number by
district (on the right). Porto, despite not being the capital or the largest district, is the one with the higher
number of HGFs. Along with Lisbon, these two districts, totalize 39,76% of all the HGFs in Portugal. In
terms of the average growth rate (in turnover, 2013-2015) it is possible to make the same analysis,
where Bragança leads with the highest percentage (however, it has only 2 accounted HGFs).
20 Absolute values on the right and the map on the left. The higher the number of HGFs in a district,
the larger the red ball on the map.

48
Figure 22 – Percentage of average annual growth rate (2013-2015) of HGFs in Portugal (2015)
by geographic distribution21
Dimension (in terms of employees)
Referring to the number of employees, the HGFs exist in different scenarios, in this study, the firms are
grouped as follows:
• Micro – 10 or less employees, representing 5% of the total population;
• Small – 11 to 50 employees, representing 72% of the total population;
• Medium – 51 to 250 employees, representing 23% of the total population.
In terms of growth, despite presenting very similar values, micro HGFs are the ones whose percentage
of average annual growth rate [2013-2015] is the highest as one can observe in Figure 23 - Average
annual growth rate [2013-2015] by dimension (number of employees).
21 Percentages on the right and the map on the left. The higher the percentage of growth in a district,
the larger the red ball on the map.

49
Figure 23 - Average annual growth rate [2013-2015] by dimension (number of employees).
Key points:
• HGFs are mostly mature firms;
• There’s an indirect weak correlation between the age of the HGF and average growth (in
turnover);
• HGFs can appear in a very wide range of ages;
• Most of HGFs do exportations;
• Non-exporting HGFs present higher levels of growth than exporting HGFs;
• HGFs with 51% to 75% of percentage of exportations over total turnover (2015) are the ones
with the highest level of growth (in comparison with the other quartiles and non-exportin HGFs);
• Porto is the district with the higher number of HGFs, however, Bragança is the one with higher
average growth rate (in turnover, 2013-2015);
• The majority of the HGFs (73%) are small firms;
• Micro firms are the ones that present the highest levels of growth.

50
6 Concluding remarks
6.1 Contribution
By synthesizing and highlighting conceptual and applied insights from the relevant literature, an accurate
definition for the principal keywords associated and to provide a wider vision on the subject as well as a
more substantiated level of knowledge about past accomplishments, unresolved issues, and
unanswered questions related to growth drivers and setbacks, entrepreneurs’ profile, background,
intentions and motivations influence and the impact of the strategic management in HGFs. In practical
terms, this work contribution is based on pinpoint different hypotheses to justify the business growth
phenomenon and to explore the causes of HGF through a systematic and structured literature review
and meta-analysis having a set of hypotheses as a result as well as a descriptive analyse and
conclusions from a data set from IAPMEI, an outlook for future research strategy (based on the form of
a questionnaire and on potential semi-structured interviews).
6.2 Limitations and further research
6.2.1 Limitations
This study does have a few theoretical, empirical and data coverage limitations of which will be listed
here those that were considered as the main.
Firstly, this study is fixated on phenomenon in two specific set of Portuguese firms, HGFs and Gazelles,
on a specific period (2013-2015), and so, it may not be valid in other contexts. Factors such as
environmental differences, extent of political conjecture and industry particularities could suggest
different triggers and setbacks for growth for another country, a different temporal space or simply
dissimilar set of firms.
An important aspect to take into consideration that, since this work has the mission to explore what it
considers to be a failure in the existing literature, this dissertation requires that it be very well justified
and sustained by its literature review. However, a hindrance felt and observed transversally during this
work is the paucity of consensual definitions for relevant concepts and likewise for terms that
characterize and define the metrics to form the analysed subgroups. This means that some analyses
and conclusions drawn from previous researches cannot be fully considered since the assumptions for
the definition of the sample group are different, highlighting the HGF definition itself and the way to
measure growth, where different authors use different metrics.
Since this work is an explorative study based on the of a and complemented data set from IAPMEI and
with through data that is accessible online on the websites from: Eurostat, The Global Entrepreneurship
and Development Institute and Informa D&B, it is restricted to a set of variables explored, however, it is
proposed using alternative data sources where the collection methods should be focused in collecting
additional information to future explore the hypothesis. Due to availability and temporal limitations it was
not possible to be put on practice on this work. However, it is important to refer that the probability of
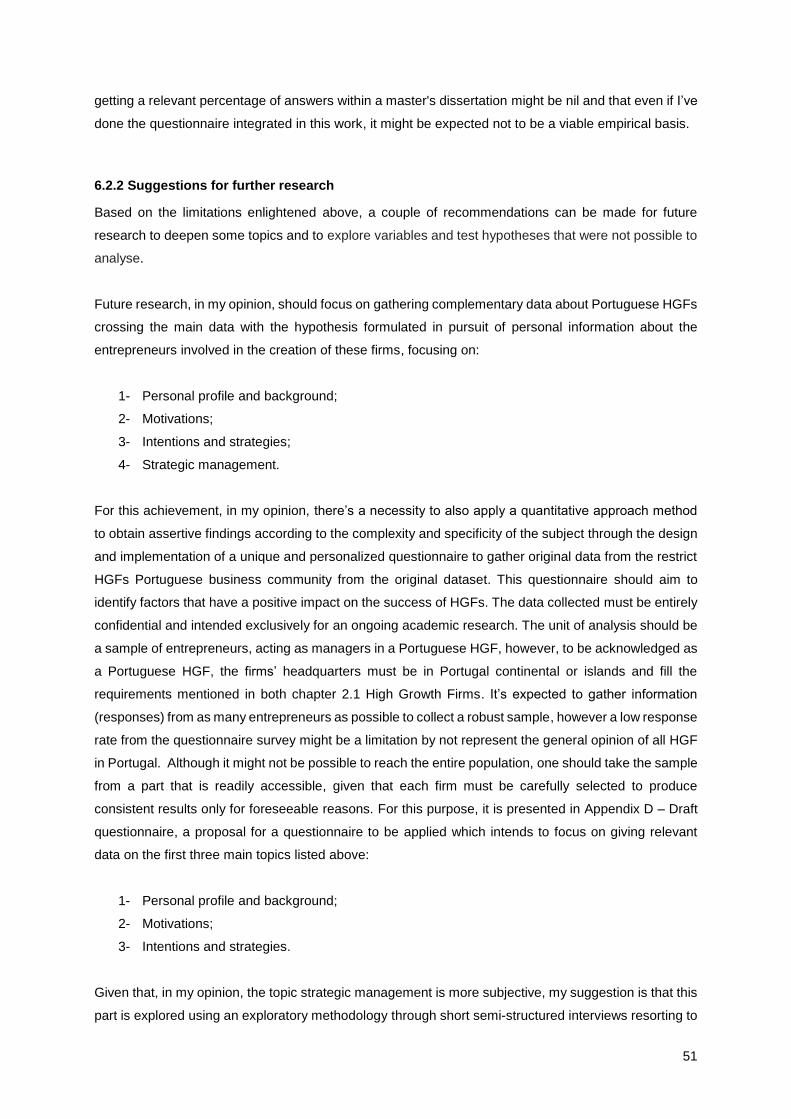
51
getting a relevant percentage of answers within a master's dissertation might be nil and that even if I’ve
done the questionnaire integrated in this work, it might be expected not to be a viable empirical basis.
6.2.2 Suggestions for further research
Based on the limitations enlightened above, a couple of recommendations can be made for future
research to deepen some topics and to explore variables and test hypotheses that were not possible to
analyse.
Future research, in my opinion, should focus on gathering complementary data about Portuguese HGFs
crossing the main data with the hypothesis formulated in pursuit of personal information about the
entrepreneurs involved in the creation of these firms, focusing on:
1- Personal profile and background;
2- Motivations;
3- Intentions and strategies;
4- Strategic management.
For this achievement, in my opinion, there’s a necessity to also apply a quantitative approach method
to obtain assertive findings according to the complexity and specificity of the subject through the design
and implementation of a unique and personalized questionnaire to gather original data from the restrict
HGFs Portuguese business community from the original dataset. This questionnaire should aim to
identify factors that have a positive impact on the success of HGFs. The data collected must be entirely
confidential and intended exclusively for an ongoing academic research. The unit of analysis should be
a sample of entrepreneurs, acting as managers in a Portuguese HGF, however, to be acknowledged as
a Portuguese HGF, the firms’ headquarters must be in Portugal continental or islands and fill the
requirements mentioned in both chapter 2.1 High Growth Firms. It’s expected to gather information
(responses) from as many entrepreneurs as possible to collect a robust sample, however a low response
rate from the questionnaire survey might be a limitation by not represent the general opinion of all HGF
in Portugal. Although it might not be possible to reach the entire population, one should take the sample
from a part that is readily accessible, given that each firm must be carefully selected to produce
consistent results only for foreseeable reasons. For this purpose, it is presented in Appendix D – Draft
questionnaire, a proposal for a questionnaire to be applied which intends to focus on giving relevant
data on the first three main topics listed above:
1- Personal profile and background;
2- Motivations;
3- Intentions and strategies.
Given that, in my opinion, the topic strategic management is more subjective, my suggestion is that this
part is explored using an exploratory methodology through short semi-structured interviews resorting to
52
a few open-ended questions about this topic and others that might help to improve the proposal of
questionnaire. A draft suggestion for the questions for the semi-structured interviews is as follows:
1- Did your firm developed a Business Model? If yes, which one?
2- How do you think a Business Model might help to foster the success of the firm and
consequently, high growth?
3- In your opinion, which part or block of the Business Model is the hardest to predict and define?
4- In your opinion, does all the parts of block of the Business Model have the same relevance for
the success of a firm? If not, which one/ones are the most relevant?
5- In your opinion, does public policies have an important impact on the achievement of high-
growth by a firm?
6- In your opinion, which are the most the personal traits from the entrepreneur profile and
background that might lead to the firms’ growth?
7- In your opinion, does the intensions and motivations of entrepreneur conditionate the firms’
growth? If yes, why?
Complementary to the suggestions made based on the limitations previously expressed, others proposal
researches can be presented based on correlative topics from the literature review that, despite they
are not directly connect to give a response to the hypothesis identified in this study, they might help
enrich the study of HGFs with important insights.
An important outcome of the literature review made is that strategic management literature highlights
that when a firm experiences excessive growth in a certain moment might cause quite a few potential
managerial problems in the future (Muurlink et al., 2012 and Demir et al., 2016). More in depth, a topic
to be explored is if high-growth there is an ideal amount that should be pursued by firm to be sustainable
and something positive for firms and their stake and shareholders. It has been recommended in several
studies to explore if there’s an optimal level of growth that foments sustainable competitive advantage
for firms and high levels of performance (Pierce and Aguinis, 2013 and Daunfeldt and Halvarsson,
2014).
Only a part of the previous researches introduces control variables to help disregard obvious explanatory
variables for a firm to present high levels of growth (Delmar and Shane, 2003). In this sense, Demir
(2016) suggests that future research should collect data and employ methodologies that more rigorously

53
draw inferences by account for such potential methodological biases related to high growth and over
time.

54
References
Acs Z., Szerb L., Autio E.2016. ‘Introduction to the Global Entrepreneurship Index’. In: Global
Entrepreneurship and Development Index 2016.
Acs, Z.J., Braunerhjelm, P., Audretsch, D.B. et al.2008. ‘The knowledge spillover theory of
entrepreneurship’. Small Bus Econ (2009) 32: 15. https://doi.org/10.1007/s11187-008-9157-3
Acs, Z.J., Desai, S. & Hessels, J. 2008. ‘Entrepreneurship, economic development and institutions”.
Small Bus Econ 31: 219. https://doi.org/10.1007/s11187-008-9135-9
Acs, Z. J. and Mueller, P. 2008. ‘Employment effects of business dynamics: Mice, Gazelles and
Elephants’, Small Business Economics. 30(1), pp. 85–100. https://doi.org/10.1007/s11187-007-9052-3.
Anabela Carneiro & Pedro Portugal & Jose Varejao, 2013. "Catastrophic job destruction during the
Portuguese economic crisis," Special Conference Papers 24, Bank of Greece.
Andersson, T. et al. 2007. ‘Competence Development for Growth International Outlook and Analysis’,
IKED.
Audretsch, D. B.2004. ‘Sustaining Innovation and Growth: Public Policy Support for Entrepreneurship’,
Industry & Innovation,.11(3), pp. 167–191. http://doi.org/10.1080/1366271042000265366.
Audretsch, D. B. and Fritsch, M. 2002. ‘Growth Regimes over Time and Space’, Regional Studies, 36(2),
pp. 113–124. http://doi.org/10.1080/00343400220121909.
Audretsch, David B. and Thurik, Roy. 2001. What's New About the New Economy? Sources of Growth
in the Managed and Entrepreneurial Economies (26 2000, 10). ERIM Report Series Reference No. ERS-
2000-45-STR. Available at SSRN: https://ssrn.com/abstract=370844
Autio, E., Kovalainen, A., & Kronlund, M. (2007). High-growth SME support initiatives in nine countries
: analysis, categorization, and recommendations : report prepared for the Finnish Ministry of Trade and
Industry. Helsinki: Ministry of Trade and Industry.
Ayyagari, M., Demirguc-Kunt, A. and Maksimovic, V. 2011. ‘Small vs. young firms across the world:
contribution to employment, job creation, and growth’, World Bank Policy Research Working Paper
Series, (April), pp. 1–57. http://doi.org/10.1596/1813-9450-5631.
Balboni, B., Bortoluzzi, G. and Tivan, M. 2014. ‘The Growth Drivers of Start-up Firms and Business
Modelling: A First Step toward a Desirable Convergence’, Management, 9(2), pp. 131–154.

55
Barbero, J. L., Casillas, J. C. and Feldman, H. D. 2011. ‘Managerial capabilities and paths to growth as
determinants of high-growth small and medium-sized enterprises’, International Small Business Journal,
29(6), pp. 671–694. http://doi.org/10.1177/0266242610378287.
Barney, J.1991. ‘Firm Resources and Sustained Competitive Advantage’, Journal of Management,
17(1), pp. 99–120. http://doi.org/10.1177/014920639101700108.
Barringer, B. R., Jones, F. F. and Neubaum, D. O. 2005. 'A quantitative content analysis of the
characteristics of rapid-growth firms and their founders’, Journal of Business Venturing, 20(5), pp. 663–
687. http://doi.org/10.1016/j.jbusvent.2004.03.004.
BERR. 2008. ‘High growth firms in the UK: Lessons from an analysis of comparative UK performance.’,
BERR Economics Paper 3. [Online], (3).
Bibu, N. a. and Sala, D. C. 2014. ‘Aspects of Fast Growth in Romanian Companies. The Case of a
Successful Company in Timis County’, Procedia - Social and Behavioral Sciences, 124, pp. 263–271.
http://doi.org/10.1016/j.sbspro.2014.02.485.
Bravo-Biosca, A., C. Criscuolo and C. Menon (2013), “What Drives the Dynamics of Business Growth?”,
OECD Science, Technology and Industry Policy Papers, No. 1, OECD Publishing, Paris.
http://dx.doi.org/10.1787/5k486qtttq46-en
Coad, a. et al. 2014.‘High-growth firms: introduction to the special section’, Industrial and Corporate
Change, 23(1), pp. 91–112. http://doi.org/10.1093/icc/dtt052.
Coad, A. & Tamvada, J.P.'Firm growth and barriers to growth among small firms in India', Small Bus
Econ (2012) 39: 383. https://doi.org/10.1007/s11187-011-9318-7
DaSilva, C. M. and Trkman, P.2014.‘Business model: What it is and what it is not’, Long Range Planning.
Elsevier Ltd, 47(6), pp. 379–389. http://doi.org/10.1016/j.lrp.2013.08.004.
Daunfeldt, SO. & Elert, N.'When is Gibrat's law a law?' Small Bus Econ (2013) 41: 133.
https://doi.org/10.1007/s11187-011-9404-x
Daunfeldt, SO., Elert, N. & Johansson, D. J, ' The Economic Contribution of High-Growth Firms: Do
Policy Implications Depend on the Choice of Growth Indicator?', Ind Compet Trade (2014) 14: 337.
https://doi.org/10.1007/s10842-013-0168-7
Davidsson, Per, Delmar, Frederic, & Wiklund, Johan (2006) Entrepreneurship as growth : Growth as
entrepreneurship. In Davidsson, P, Delmar, F, & Wiklund, J (Eds.) Entrepreneurship and the Growth of
Firms. Edward Elgar Publishing, United Kingdom, England, Cheltenham, pp. 21-38.

56
Delmar, F.2015.‘Journal of Business Venturing Insights A response to Honig and Samuelsson (2014)’,
Journal of Business Venturing Insights. Elsevier, 3, pp. 1–4. http://doi.org/10.1016/j.jbvi.2014.11.002.
Demir, R., Wennberg, K. and McKelvie, A.2016.‘The Strategic Management of High-Growth Firms: A
Review and Theoretical Conceptualization’, Long Range Planning. Elsevier Ltd.
http://doi.org/10.1016/j.lrp.2016.09.004.
Federico, J. S., Kantis, H. and Rabetino, R.2009. ‘Exploring the determinants of young SMES’ growth:
Evidence from contrasting regions.’, Journal of Small Business and Enterprise, pp. 1–32.
Fischer, E. and Reuber, R. A. 2003. ‘Support for Rapid Growth Firms : A Comparison of the Views of
Founders , Government Policy Makers and Private Sector Resource Providers University of Toronto
Support for Rapid Growth Firms : A Comparison of the Views of Founders ,Government Policy Makers’,
Journal of Small Business Management, 41(4), pp. 346–365.
Foster, G. and Et Al (2011) ‘Global Entrepreneurship and the Successful Growth Strategies of Early-
Stage Companies’, World Economic Forum USA Inc. & Stanford University, pp. 370–375.
Frédéric Delmar, a, , Per Davidssonb, 1, W. B. G.2003.‘Arriving at the High Growth Firm’, Journal of
Business Venturing, 18, pp. 57–63. https://doi.org/10.1016/S0883-9026(02)00080-0
Gal, P. N. and Menon, C.2014.‘The Dynamics of Employment Growth : New Evidence from 18
Countries’, Centre of Economic Perfomance,1274.
Geroski, P. A., Mata, J. and Portugal, P.2010.‘Founding conditions and the survival of new firms’,
Strategic Management Journal, 31(5), pp. 510--529. https://doi.org/10.1002/smj.823
Giner, J.M., Santa-María, M.J. & Fuster, A. Int Entrep Manag J (2017) 13: 75.
https://doi.org/10.1007/s11365-016-0392-9
Grant, R. M. (2001) ‘The Resource-Based Theory of Competitive Advantage: Implications for Strategy
Formulation’, California Management Review, 33(3),pp. 114–135.
Morina, Donjeta and Gashi, Prespë, The Role of SMEs on the Economic Development: Kosova's Case
(April 24, 2016). CRC - Journal. Available at SSRN: https://ssrn.com/abstract=2820980 or
http://dx.doi.org/10.2139/ssrn.2820980
Hashi,I.,Krasniqi, B.A. (2011) "Entrepreneurship and SME growth: evidence from advanced and laggard
transition economies", International Journal of Entrepreneurial Behavior & Research, Vol. 17 Issue: 5,

57
pp.456-487, https://doi.org/10.1108/13552551111158817
Henrekson, M. & Johansson, D. 'Gazelles as job creators: A survey and interpretation of the evidence',
Small Bus Econ (2010) 35: 227. https://doi.org/10.1007/s11187-009-9172-z
Hölzl, W. and Friesenbichler.2008.‘Final Sector Report Gazelles’, Europe Innova – Innovation Watch.,
pp. 1–109.
INFORMA D&B (2017) ‘Empreendedorismo em portugal’.
Lee, N.2011.‘Free to grow ? Assessing the obstacles faced by actual and potential high growth
firms’,November, 11(01), pp. 1–32.
Lee, N.'What holds back high-growth firms? Evidence from UK SMEs' Small Bus Econ (2014) 43: 183.
https://doi.org/10.1007/s11187-013-9525-5
Lilischkis, S. (2011), ‘Policies in support of high-growth innovative SMEs - Part 2: Policy measures
to improve the conditions for the growth of innovative enterprises’, European Commission, DG
Research and Innovation, Brussels.
Mason, C. and Brown, R. 2010.‘High Growth Firms in Scotland’, Strategy, October.
Mason, C. & Brown, R. 'Creating good public policy to support high-growth firms', Small Bus Econ (2013)
40: 211. https://doi.org/10.1007/s11187-011-9369-9
Mazzarol, T.2001. ‘Do Formal Business Plans Really Matter ? – An Exploratory Study of Small Business
Owners in Australia Small Business Owners in Australia’, Small Enterprise Research, 9(1), pp. 32–45.
http://doi.org/10.5172/ser.9.1.32.
Millán, J. M., Congregado, E. and Román, C.2014. ‘Persistence in entrepreneurship and its implications
for the European entrepreneurial promotion policy’, Journal of Policy Modeling. The Society for Policy
Modeling, 36(1), pp. 83–106. http://doi.org/10.1016/j.jpolmod.2013.10.001.
Nunes, A. and Sarmento, E. (2010) ‘A semi-parametric survival analysis of business demography
dynamics in Portugal’, The 6th International Scientific Conference ‘Business and Management 2010’.
Selected papers, pp. 675–682. doi: 10.3846/bm.2010.089.
OECD.1996.Small Businesses, Job Creation and Growth: Facts, Obstacles and Best Practices.
OECD.2007.Eurostat-OECD Manual on Business Demography Statistics, OECD-Eurostat.ISSN 1977-

58
0375
Osterwalder A, Pigneur Y (2010). Business Model Generation – A Handbook for Visionaries, Game
Changers and Challengers. John Wiley and Sons, Inc., Hoboken, New Jersey.
Parker, S.C., Storey, D.J. & van Witteloostuijn, A. ‘What happens to gazelles? The importance of
dynamic management strategy’,Small Bus Econ (2010) 35: 203. https://doi.org/10.1007/s11187-009-
9250-2
Parnell, J. A.2013.‘Uncertainty, Generic Strategy, Strategic Clarity, and Performance of Retail SMEs in
Peru, Argentina, and the United States’, Journal of Small Business Management, 51(2), pp. 215–234.
http://doi.org/10.1111/jsbm.12010.
Pereira, P. T. and Laura Wemans. 2015.‘The Global Financial Crisis and its Budget Impacts in OECD
Nations’, The Global Financial Crisis and its Budget Impacts in OECD Nations: Fiscal Responses and
Future Challenges, pp. 231–254. http://doi.org/10.4337/9781784718961.
Praag, C. M. Van and Versloot, P. H., The Economic Benefits and Costs of Entrepreneurship: A Review
of the Research, Foundations and Trends R in Entrepreneurship, vol 4, no 2, pp 65–154, 2008.
http://doi.org/10.1561/0300000012.
Ramezani, Cyrus A. and Soenen, Luc A. and Jung, Alan Robert, 'Growth, Corporate Profitability, and
Shareholder Value Creation' (March 21, 2001). Available at SSRN: https://ssrn.com/abstract=304880 or
http://dx.doi.org/10.2139/ssrn.304880
Robu, M. 2013. ‘The dynamic and importance of smes in economy’, The USV Annuals of Economics
and Public Administration, 13(1), pp. 84–89.
Sarmento, E.D.M.; Figueira, C.; Theodorakopoulos, N.; Nunes, A.(2013) - 'High-growth
entrepreneurship and policy support in Portugal'. In 9th Iberian International Business Conference.
Braga, Portugal
Sarmento, E. de M. and Nunes, A. 2010. ‘Entrepreneurship in Portugal : Comparison between the
World’, pp. 38–50.
Senderovitz, M., Klyver, K. and Steffens, P.2016.‘Four years on: Are the gazelles still running? A
longitudinal study of firm performance after a period of rapid growth’, International Small Business
Journal, 34(4), pp. 391–411. http://doi.org/10.1177/0266242614567483.
Shafer, S. M., Smith, H. J. and Linder, J. C.2005.‘The power of business models’, Business Horizons,

59
48(3), pp. 199–207. http://doi.org/10.1016/j.bushor.2004.10.014.
Smallbone, D., Baldock, R. and Burgess, S.2002.‘Targeted support for high-growth start-ups: Some
policy issues’, Environment and Planning C: Government and Policy, 20(2), pp. 195–209.
http://doi.org/10.1068/c0049.
Smallbone,D., Leig, R., North,D. (1995) "The characteristics and strategies of high growth SMEs",
International Journal of Entrepreneurial Behavior & Research, Vol. 1 Issue: 3, pp.44-62,
https://doi.org/10.1108/13552559510100657
Stam, E. et al. 2006. ‘High Growth Firms , Public Policies and Economic Growth’, pp. 1–14.
van Stel, A. and Storey, D.2004. ‘The Link between Firm Births and Job Creation: Is there a Upas Tree
Effect?’, Regional Studies, 38(8), pp. 893–909. http://doi.org/10.1080/0034340042000280929.
Sutton, J.1997. ‘Gibrat ’ s Legacy’, Journal of Economic Literature, 35(1), pp. 40–59.
Teece, D. J.2010. ‘Business models, business strategy and innovation’, Long Range Planning. Elsevier
Ltd, 43(2–3), pp. 172–194. http://doi.org/10.1016/j.lrp.2009.07.003.
Trondsen, M.2016.Management control in fast growing entrepreneurial firms:Case study of four small
and medium sized gazelles in Nordland county Management Control.Master Thesis, University of
Nordland.
Wadhwa, V. et al. 2009. ‘Anatomy of an Entrepreneur Family Background and Motivation’, (July), pp.
1–24,Kauffman: The foundation of Entrepreneurship.

60
Appendices

61
Appendix A – Business Model Canvas framework

62
Appendix B – Portuguese HGFs age and average annual growth rate (2013-2015)
Due to confidentiality policies, the remaining data were omitted.
Age
Average
annual growth
rate
[2013-2015]
32 20,0%
38 20,1%
40 20,1%
39 20,1%
17 20,1%
16 20,1%
7 20,2%
9 20,2%
34 20,2%
12 20,2%
49 20,2%
16 20,2%
7 20,3%
30 20,3%
24 20,3%
47 20,3%
7 20,3%
15 20,4%
26 20,4%
26 20,4%
5 20,4%
5 20,5%
17 20,5%
3 20,5%
31 20,5%
14 20,5%
9 20,5%
13 20,5%
15 20,5%
8 20,5%
12 20,6%
21 20,6%
53 20,6%
10 20,6%
20 20,6%
4 20,7%
13 20,7%
20 20,7%
50 20,7%
14 20,7%
15 20,8%
19 20,8%
3 20,9%
14 20,9%
4 20,9%
10 20,9%
7 20,9%
30 20,9%
6 20,9%
15 20,9%
11 20,9%
10 21,0%
9 21,0%
27 21,0%
28 21,0%
11 21,0%
9 21,0%
9 21,0%
3 21,0%
22 21,1%
5 21,1%
6 21,1%
28 21,1%
9 21,1%
46 21,1%
24 21,1%
24 21,1%
20 21,2%
37 21,2%
14 21,2%
31 21,2%
25 21,2%
13 21,2%
7 21,2%
8 21,2%
46 21,2%
8 21,2%
16 21,3%
65 21,3%
30 21,3%
16 21,3%
26 21,4%
49 21,4%
14 21,4%
26 21,4%
6 21,4%
13 21,4%
6 21,4%
17 21,4%
12 21,4%
9 21,4%
7 21,5%
35 21,5%
7 21,5%
24 21,5%
41 21,5%
20 21,5%
11 21,6%
14 21,6%
21 21,6%
23 21,6%
34 21,6%
37 21,6%

63
36 21,6%
15 21,6%
42 21,6%
26 21,6%
14 21,6%
34 21,6%
3 21,7%
4 21,7%
23 21,7%
29 21,7%
7 21,8%
38 21,8%
17 21,8%
27 21,8%
31 21,8%
9 21,9%
11 21,9%
12 21,9%
24 21,9%
20 21,9%
30 21,9%
28 21,9%
6 22,0%
25 22,0%
33 22,0%
7 22,1%
10 22,1%
14 22,1%
41 22,1%
54 22,2%
10 22,2%
9 22,2%
8 22,2%
13 22,2%
28 22,2%
12 22,2%
10 22,3%
18 22,3%
27 22,3%
23 22,3%
13 22,3%
7 22,3%
18 22,4%
7 22,4%
5 22,4%
11 22,4%
9 22,4%
9 22,4%
33 22,4%
49 22,4%
16 22,4%
19 22,5%
8 22,5%
21 22,5%
17 22,5%
41 22,5%
40 22,5%
19 22,6%
14 22,6%
28 22,6%
18 22,6%
3 22,6%
33 22,6%
27 22,6%
53 22,7%
12 22,7%
9 22,7%
23 22,7%
10 22,7%
25 22,7%
18 22,7%
13 22,7%
10 22,7%
38 22,7%
37 22,8%
22 22,8%
27 22,8%
22 22,8%
9 22,9%
21 22,9%
54 22,9%
24 22,9%
33 22,9%
14 22,9%
38 22,9%
28 22,9%
20 22,9%
13 23,0%
13 23,0%
27 23,0%
39 23,1%
23 23,1%
11 23,1%
9 23,1%
47 23,1%
14 23,1%
4 23,1%
27 23,1%
28 23,1%
6 23,1%
9 23,1%
27 23,2%
7 23,2%
20 23,2%
10 23,2%
37 23,3%
27 23,3%
13 23,3%
21 23,3%
14 23,3%
14 23,3%
13 23,3%
15 23,4%
7 23,4%
25 23,4%
34 23,4%
4 23,4%

64
17 23,4%
46 23,4%
23 23,4%
30 23,5%
37 23,5%
14 23,5%
33 23,5%
19 23,5%
15 23,5%
33 23,5%
30 23,5%
17 23,5%
10 23,6%
6 23,6%
3 23,6%
11 23,7%
24 23,7%
68 23,7%
14 23,7%
15 23,7%
25 23,8%
31 23,8%
16 23,8%
34 23,8%
19 23,8%
26 23,8%
38 23,8%
17 23,8%
16 23,9%
3 23,9%
34 23,9%
16 23,9%
24 23,9%
15 23,9%
13 24,0%
5 24,0%
16 24,0%
4 24,0%
9 24,0%
13 24,0%
25 24,1%
25 24,2%
18 24,2%
12 24,2%
9 24,2%
37 24,2%
30 24,2%
15 24,2%
14 24,2%
14 24,2%
24 24,3%
16 24,3%
18 24,3%
18 24,3%
19 24,3%
18 24,3%
20 24,3%
13 24,3%
13 24,3%
24 24,3%
27 24,3%
24 24,3%
12 24,4%
5 24,4%
4 24,4%
10 24,4%
5 24,5%
18 24,5%
11 24,5%
29 24,5%
14 24,5%
5 24,5%
16 24,6%
27 24,6%
8 24,6%
20 24,6%
21 24,6%
29 24,6%
25 24,6%
29 24,6%
51 24,7%
47 24,7%
33 24,7%
65 24,7%
9 24,7%
36 24,7%
7 24,8%
27 24,8%
18 24,8%
12 24,8%
26 24,8%
16 24,8%
14 24,8%
18 24,8%
41 24,8%
25 24,8%
37 24,9%
6 24,9%
7 24,9%
49 25,0%
9 25,0%
10 25,1%
33 25,1%
22 25,1%
21 25,1%
21 25,2%
5 25,2%
19 25,2%
16 25,2%
7 25,2%
21 25,2%
5 25,2%
28 25,2%
9 25,3%
5 25,3%
14 25,3%
7 25,3%

65
17 25,3%
24 25,3%
28 25,3%
41 25,3%
32 25,3%
11 25,3%
94 25,4%
37 25,4%
2 25,4%
26 25,4%
22 25,5%
31 25,6%
4 25,6%
17 25,6%
23 25,6%
21 25,7%
7 25,7%
25 25,9%
17 25,9%
5 25,9%
16 25,9%
15 25,9%
23 25,9%
24 25,9%
5 26,0%
25 26,0%
21 26,1%
8 26,1%
32 26,1%
71 26,2%
13 26,2%
26 26,2%
6 26,2%
17 26,2%
25 26,3%
20 26,3%
13 26,3%
15 26,3%
22 26,3%
16 26,4%
7 26,5%
5 26,5%
30 26,5%
19 26,5%
14 26,5%
28 26,6%
6 26,6%
7 26,6%
19 26,6%
29 26,6%
10 26,6%
12 26,6%
26 26,6%
10 26,6%
38 26,7%
18 26,7%
8 26,7%
17 26,8%
16 26,8%
22 26,9%
36 26,9%
17 26,9%
15 26,9%
11 26,9%
10 27,0%
27 27,0%
26 27,0%
19 27,0%
10 27,1%
9 27,1%
24 27,1%
13 27,1%
25 27,1%
23 27,1%
17 27,1%
27 27,1%
9 27,1%
15 27,2%
8 27,2%
24 27,2%
15 27,2%
15 27,2%
12 27,2%
16 27,3%
85 27,3%
29 27,3%
28 27,4%
20 27,4%
22 27,5%
8 27,5%
21 27,6%
11 27,6%
25 27,6%
39 27,6%
9 27,6%
9 27,6%
10 27,6%
11 27,6%
24 27,7%
13 27,7%
17 27,7%
14 27,7%
36 27,8%
14 27,8%
7 27,8%
11 27,8%
36 27,9%
14 27,9%
15 27,9%
15 27,9%
13 28,0%
15 28,0%
14 28,0%
16 28,0%
11 28,0%
44 28,1%
33 28,1%

66
23 28,2%
9 28,2%
34 28,2%
11 28,3%
59 28,3%
21 28,3%
12 28,3%
22 28,3%
24 28,3%
7 28,4%
7 28,5%
7 28,5%
8 28,5%
31 28,5%
23 28,5%
13 28,6%
15 28,7%
3 28,7%
33 28,7%
20 28,7%
13 28,7%
8 28,7%
9 28,8%
24 28,8%
11 28,8%
11 28,8%
10 28,8%
28 28,9%
10 28,9%
20 28,9%
21 28,9%
9 28,9%
15 29,0%
8 29,0%
16 29,0%
12 29,0%
31 29,0%
6 29,0%
51 29,0%
24 29,1%
47 29,1%
15 29,1%
40 29,1%
9 29,1%
28 29,1%
4 29,1%
7 29,2%
44 29,3%
24 29,3%
27 29,4%
16 29,4%
18 29,4%
6 29,4%
18 29,4%
9 29,5%
25 29,6%
16 29,6%
21 29,6%
36 29,6%
7 29,6%
13 29,6%
18 29,7%
17 29,7%
26 29,7%
11 29,7%
14 29,7%
26 29,8%
15 29,8%
17 29,8%
26 30,1%
27 30,1%
34 30,2%
28 30,2%
35 30,3%
22 30,3%
24 30,3%
12 30,4%
36 30,4%
5 30,4%
25 30,4%
20 30,5%
38 30,5%
9 30,5%
44 30,5%
8 30,6%
15 30,6%
16 30,6%
22 30,6%
33 30,6%
4 30,7%
15 30,8%
18 30,8%
15 30,8%
22 30,9%
19 30,9%
17 30,9%
20 30,9%
17 30,9%
27 31,0%
24 31,1%
16 31,2%
12 31,2%
10 31,2%
31 31,2%
26 31,3%
6 31,3%
8 31,3%
2 31,4%
14 31,4%
28 31,4%
21 31,5%
13 31,5%
5 31,6%
23 31,6%
24 31,6%
21 31,6%
14 31,6%

67
9 31,6%
34 31,7%
7 31,7%
75 31,7%
27 31,8%
15 31,8%
5 31,9%
3 31,9%
3 32,0%
27 32,1%
64 32,1%
14 32,1%
33 32,1%
21 32,1%
21 32,2%
26 32,2%
94 32,3%
27 32,3%
27 32,4%
20 32,4%
15 32,4%
73 32,4%
4 32,4%
27 32,4%
9 32,5%
25 32,5%
13 32,5%
31 32,6%
23 32,6%
11 32,6%
19 32,7%
16 32,7%
63 32,7%
21 32,7%
13 32,7%
12 32,8%
4 32,8%
14 32,8%
10 32,8%
12 32,8%
3 32,8%
7 32,9%
17 32,9%
5 32,9%
96 32,9%
16 32,9%
30 32,9%
9 33,1%
10 33,1%
12 33,2%
13 33,2%
37 33,2%
19 33,3%
25 33,3%
3 33,3%
22 33,3%
29 33,4%
33 33,6%
22 33,6%
11 33,6%
22 33,6%
20 33,6%
8 33,7%
22 33,7%
8 33,8%
22 33,8%
17 33,8%
23 33,9%
12 33,9%
36 33,9%
7 33,9%
15 34,0%
27 34,1%
11 34,1%
15 34,1%
11 34,1%
14 34,2%
24 34,2%
19 34,3%
19 34,4%
14 34,4%
62 34,5%
14 34,5%
10 34,5%
6 34,5%
16 34,6%
8 34,6%
16 34,8%
30 34,8%
11 34,8%
21 35,0%
16 35,0%
6 35,0%
27 35,1%
20 35,1%
3 35,3%
18 35,4%
5 35,4%
9 35,4%
8 35,4%
13 35,4%
12 35,4%
35 35,5%
9 35,6%
27 35,6%
10 35,6%
17 35,6%
8 35,7%
4 35,7%
13 35,7%
5 35,8%
34 35,8%
4 35,8%
34 35,9%
28 35,9%
4 35,9%
8 36,0%

68
18 36,0%
10 36,1%
21 36,1%
21 36,1%
14 36,2%
34 36,2%
4 36,4%
18 36,5%
17 36,5%
4 36,5%
6 36,5%
14 36,7%
6 36,8%
17 36,8%
17 36,8%
24 36,8%
4 36,9%
18 36,9%
32 37,0%
28 37,0%
7 37,1%
25 37,2%
9 37,3%
8 37,3%
5 37,3%
9 37,4%
16 37,4%
10 37,6%
15 37,6%
25 37,7%
13 37,9%
8 37,9%
11 37,9%
29 38,0%
29 38,0%
42 38,1%
17 38,1%
7 38,1%
7 38,1%
3 38,2%
25 38,2%
24 38,3%
27 38,3%
7 38,5%
8 38,6%
10 38,6%
55 38,8%
15 38,9%
12 38,9%
21 38,9%
68 39,3%
18 39,3%
16 39,5%
19 39,5%
23 39,6%
12 39,6%
9 39,7%
16 39,7%
30 39,7%
16 39,9%
15 39,9%
14 40,0%
25 40,1%
17 40,2%
16 40,2%
26 40,3%
29 40,3%
25 40,6%
3 40,6%
8 40,7%
8 40,8%
30 40,9%
6 41,1%
5 41,1%
31 41,2%
18 41,3%
10 41,3%
3 41,4%
11 41,5%
27 41,5%
71 41,6%
34 41,7%
50 41,7%
6 41,8%
51 41,9%
26 42,0%
16 42,1%
6 42,3%
23 42,4%
6 42,5%
10 42,7%
9 42,7%
29 42,8%
13 42,8%
27 42,8%
17 42,8%
17 42,9%
8 43,3%
5 43,4%
21 43,4%
20 43,6%
8 43,6%
31 43,7%
11 43,9%
7 43,9%
18 43,9%
16 43,9%
8 43,9%
18 44,0%
24 44,2%
14 44,3%
100 44,3%
14 44,5%
8 44,7%
25 44,8%
2 44,9%
31 44,9%

69
9 45,0%
22 45,0%
39 45,4%
10 45,4%
9 45,5%
7 45,8%
11 45,8%
5 45,9%
26 46,0%
9 46,0%
20 46,3%
6 46,4%
29 46,4%
14 46,6%
2 46,7%
10 46,8%
26 47,0%
10 47,1%
26 47,3%
25 47,3%
10 47,4%
21 47,5%
15 47,5%
5 47,5%
8 47,6%
13 47,6%
18 47,6%
16 47,8%
9 47,8%
38 47,8%
7 48,0%
20 48,1%
6 48,1%
6 48,3%
7 48,3%
10 48,3%
19 48,6%
5 48,7%
5 48,7%
8 48,8%
28 48,8%
6 49,2%
34 49,3%
14 49,4%
7 49,8%
14 49,9%
5 49,9%
3 50,0%
13 50,1%
12 50,2%
33 50,2%
15 50,3%
8 50,4%
19 50,5%
5 50,8%
7 51,0%
13 51,1%
7 51,5%
4 51,5%
26 51,6%
29 52,2%
19 52,5%
6 52,6%
14 52,7%
26 52,8%
31 52,8%
6 52,9%
8 53,0%
9 53,1%
17 53,6%
5 53,6%
14 53,7%
47 53,8%
12 53,8%
14 54,2%
7 54,3%
22 54,6%
3 54,6%
16 54,8%
29 54,9%
8 55,3%
14 55,7%
13 56,0%
3 56,1%
5 56,3%
19 56,3%
20 56,4%
26 56,7%
18 57,1%
8 57,4%
7 57,5%
5 57,6%
25 57,6%
10 57,7%
8 57,7%
8 57,8%
7 58,2%
12 58,4%
13 58,4%
4 58,5%
6 58,7%
6 59,1%
5 59,2%
7 59,8%
27 60,0%
70 60,3%
19 60,4%
24 60,5%
27 60,6%
3 60,8%
10 60,8%
12 60,9%
44 60,9%
19 61,4%
10 61,4%
9 61,5%
9 61,8%

70
3 63,4%
23 64,4%
6 64,5%
27 64,9%
12 64,9%
31 64,9%
11 65,4%
21 65,7%
14 66,5%
10 66,8%
9 66,8%
12 66,8%
7 67,5%
26 68,8%
17 68,8%
19 69,2%
12 69,2%
9 69,6%
5 69,8%
8 69,8%
7 70,3%
5 70,4%
16 70,5%
4 70,9%
19 71,1%
2 71,6%
8 71,7%
3 71,7%
16 71,8%
9 71,9%
9 72,5%
11 72,6%
4 72,6%
30 72,9%
5 73,7%
6 74,1%
8 74,1%
7 74,2%
25 74,7%
4 74,9%
14 75,6%
13 75,9%
9 76,4%
27 76,4%
5 76,5%
5 76,9%
14 77,0%
15 78,0%
4 78,9%
14 79,2%
7 79,2%
7 79,5%
4 80,2%
17 80,8%
7 82,2%
24 82,6%
11 82,8%
5 82,9%
5 83,0%
4 83,0%
5 83,2%
4 84,8%
18 85,5%
30 85,7%
17 86,1%
7 86,5%
11 87,3%
19 88,0%
31 89,0%
4 89,4%
9 89,7%
21 89,8%
10 91,3%
10 91,8%
9 93,4%
3 93,6%
4 94,5%
17 94,7%
9 95,4%
7 97,2%
9 98,3%
9 99,0%
5 99,3%
5 99,5%
22 99,8%
14 99,8%
4 100,2%
7 100,4%
11 100,7%
38 101,3%
24 101,4%
44 104,3%
3 105,0%
21 106,5%
4 106,8%
13 107,6%
30 109,3%
9 114,1%
4 114,7%
4 115,8%
34 117,3%
33 119,6%
5 119,7%
13 119,7%
13 121,0%
6 121,2%
7 121,7%
4 127,5%
20 127,9%
6 129,7%
7 129,8%
3 131,2%
6 132,3%
25 132,9%
22 135,0%
33 135,9%
5 136,0%

71
4 137,6%
7 139,3%
17 139,5%
14 144,0%
24 152,1%
8 156,4%
13 160,2%
20 170,2%
16 172,1%
51 172,4%
5 172,6%
3 186,1%
9 189,4%
4 194,2%
5 204,4%
10 212,0%
12 220,9%
2 234,6%
19 246,3%
5 264,0%
4 279,5%
5 279,9%
5 282,1%
4 315,3%
2 336,9%

72
Appendix C – Request for response to questionnaire
Exmo(a). Sr.(a).
O meu nome é Diogo de Lonet Delgado e Oliveira e sou estudante do mestrado em Engenharia e
Gestão Industrial no Instituto Superior Técnico – Universidade de Lisboa. Venho por este meio, no
âmbito da realização da minha tese de mestrado, solicitar a sua colaboração através da resposta a
um curto questionário que não levará mais de 10 minutos a responder.
A tese de mestrado está a ser orientada pelo Prof. Doutor Miguel Amaral, Professor do Instituto
Superior Técnico, e coorientada pelo Prof. Doutor Jesus Iglesias, Professor da Universidade de
Huelva, e debruça-se sobre as estratégias, intenções e motivações de empreendedores para o
desenvolvimento de empresas de rápido crescimento.
O questionário é anónimo e é garantido aos inquiridos que os dados recolhidos serão mantidos
confidenciais e destinam-se exclusivamente à investigação académica em curso, respeitando os
princípios deontológicos de investigação em ciências sociais.
Gostaria, por isso, de apresentar o presente pedido de colaboração neste projeto ao/a um dos
Empreendedores/Fundadores da vossa empresa.
Agradecemos desde já a amabilidade e disponibilidade.
Com os melhores cumprimentos,
___________________________
Diogo Lonet
Email: [email protected]
Supervisionado e apoiado por,
___________________________
Professor Miguel Amaral
Email: [email protected]

2
Appendix D – Draft questionnaire
Questionário às Empresas de Crescimento Rápido
[Data]
Instituto Superior Técnico
Este questionário vem no seguimento de uma investigação académica, no âmbito de uma Dissertação de Mestrado sobre
“Estratégias, intenções e motivações de empreendedores para o desenvolvimento de Empresas de Crescimento Rápido em
Portugal”. O estudo em questão tem por objetivo identificar fatores que tenham um impacto positivo para o sucesso das Empresas
de Crescimento Rápido. O questionário deverá ser preenchido por um dos empreendedores/fundadores da empresa. Os dados
recolhidos são totalmente confidenciais e destinam-se exclusivamente à investigação académica em curso. Agradecemos a sua
imprescindível colaboração, visto ser da maior importância para a realização deste estudo. Deste modo, peço, por favor, que
responda a cada uma das questões colocadas e, no caso das respostas com opções de resposta, assinale com um (X) no
retângulo respetivo a opção que mais se aproxima da correta.
I – PERFIL PESSOAL
1. Idade (em anos):
2. Género (sexo):
Masculino
Feminino
3. Tendo tido experiência prévia como empresário/empreendedor, o que sucedeu com
a empresa?
Ensino Básico 1º Ciclo (4º ano)
Ensino Básico 2º Ciclo (6º ano)
Ensino Básico 3º Ciclo (9º ano)
Ensino Secundário (12º ano)
Licenciatura ou Bacharelato
Mestrado
Doutoramento
MBA
4. Em que área científica completou o seu nível de escolaridade mais elevado?
Economia/Gestão
Engenharia
Outro(a)
Ciências Sociais e Humanas
Artes
Qual? _________________
II – MOTIVAÇÕES
1. Qual era a sua situação profissional antes de criar a empresa?
Desempregado
Estudante
Outro(a)
Empresário por conta de outrem
Empresário por conta própria
Qual? _________________

3
2. Em algum período anterior à criação da empresa esteve desempregado?
< 6 meses
6 meses a 1 ano
1 a 3 anos
> 3 anos
Nunca estive em situação de desemprego
3. Anteriormente à criação da empresa teve experiência profissional no setor/indústria
atual de negócio?
< 6 meses
6 meses a 1 ano
1 a 3 anos
> 3 anos
Nunca tive qualquer experiência
4. Anteriormente à criação da empresa exerceu algum cargo de gestão de topo?
< 1 ano
1 ano a 2 anos
2 a 5 anos
> 5 anos
Nunca tive qualquer experiência
5. Tendo tido experiência prévia como empresário/empreendedor, o que sucedeu com
a empresa?
Fechou/Faliu
Fusão
A empresa continua em atividade
Venda (empresa ou participação)
6. Algum elemento do agregado familiar direto tem experiência como
empresário/empreendedor?
Não
Sim
Grau de parentesco: ________________
III – INTENÇÕES E ESTRATÉGIAS
1. Como foi o acesso a informação relativa a programas e apoios governamentais e
legislação?
Muito difícil Difícil Indiferente Fácil Muito fácil
2. Existia uma intenção clara de crescimento?
Não
Sim

4
3. O valor de investimento inicial até ao início de atividade da empresa situa-se em que
intervalo (em milhares de euros)?
4. Em que fase do ciclo de vida da empresa foi mais preponderante cada um dos
elementos?
Desenvolvimento
da ideia
Criação da
empresa
Entrada no
mercado
Crescimento
e maturidade Não se aplica
Plano de negócios
Gestão Estratégica
Incubadora/Aceleradora
Entidade Privada/Investidor
Programas e apoios públicos
Acesso a capital financeiro
Capital humano
5. Atribua uma ordem aos seguintes elementos de acordo com a importância que
tiveram para o crescimento rápido da empresa. (1= menos importante; 7= menos importante).
Plano de negócios
Gestão estratégica
Incubadora/Aceleradora
Entidade Privada/Investidor
___
___
___
___
Programas e apoios públicos
Acesso a capital financeiro
Capital humano
___
___
___
6. Existe algum outro(s) fator(es) não mencionado(s) que foi(/foram) preponderante(s)
para o sucesso da empresa?
Muito obrigado por ser parte integrada deste estudo. Por favor confirme se respondeu a todas as
questões antes de submeter o questionário. É garantido que as suas respostas serão tratadas
com a maior confidencialidade em todos os momentos. Se desejar um resumo das conclusões
deste estudo, por favor indique o seu endereço de e-mail em baixo:
____________________________________