motion monitoring and decision support during heavy transport
TRANSCRIPT

1 Copyright © 2010 by ASME
MOTION MONITORING AND DECISION SUPPORT DURING HEAVY TRANSPORT
Onno A.J. Peters
Dockwise Shipping BV Breda, The Netherlands
Leon J.M. Adegeest AMARCON
Dalfsen, The Netherlands
ABSTRACT During transports of large heavy cargo like jack-up rigs or
semi-submersibles, the Motion Monitoring and Captain Decision Support system is a valuable tool to ensure a safe and economical voyage. Using the dynamic characteristics of the vessel in combination with 5-day weather forecasts and design limits like maximum accelerations at the cargo location, roll motion and/or leg bending moment, more and better information is available to the Master to choose a safe heading, speed and route. This way the best knowledge what to expect is contributing to the safety of cargo, transport vessel and crew.
Besides use in heavy transport, this system is widely used on container ships, LNG carriers, all kinds of offshore vessels and many other types of floating structures.
With daily communication, all important information is made available on internet to the operator’s main office, from which clients are informed with a comprehensive and concise overview of what is happening with their property. After the voyage, clients can be provided with the recorded Motion Monitoring data, which is valuable information for the lifetime assessment.
The paper is presenting background information of the Motion Monitoring and Captain Decision Support system, a brief overview of methods used by the system and is describing the relations between transport vessel, main office and client and between the Transport Manual and the system. Results of two independent measurement systems are giving proof of high accuracy of the measurements. Comparison between measurements and predicted vessel response are shown and explained.
INTRODUCTION In the old days, master and officers had to rely on their
experienced judgment of weather forecasts and weather observation together with their knowledge about motion behavior of their vessel to make decisions about routing; based on limited information and own insight in behavior prescribed limiting weather conditions had to be avoided to ensure a safe voyage. For each specific transport, the master and officers
receive and study the Cargo Securing Manual containing all relevant information for which the transport is engineered. However, it was difficult to relate the design values mentioned in the CSM to actual and forecasted weather.
In the past decade, an Onboard Decision Support system was developed to improve decision making (Ref. [1]). The system is based on calculated vessel response characteristics (RAOs) and combines daily predicted weather condition along sailed and planned route. In the following sections the system. The system provides insight in responses like accelerations at specific locations, like cargo CoG. This information can be compared directly with information provided in the CSM, and thus the master and officers do not have to translate forecasted sea-states to responses of concern. Further, comparison of the forecasted responses with real-time measurement can be made, which benefits in the reliability and confidence mainly in the weather forecasts.
During recent years, numerous systems have been installed of which 13 have been installed on Dockwise operated Heavy Transport Vessels. Within Dockwise the system in integrated in the engineering process; criteria and limits used by the system are determined by engineering and post-voyage analyses are carried out as service to clients, furthermore a database of all relevant data is built.
ENGINEERED TRANSPORT The high value and wide variety of heavy cargoes are
reasons to carry out dedicated motion analyses for world-wide heavy transport at sea. The results of such an analysis are primarily required during the transport engineering phase; from inquiry to contract. Initial studies must prove feasibility of heavy transport. Final detailed analysis is carried out to design seafastening, cribbing plan and/or support structures. Also, other specific checks can be made like allowable leg bending moments for jack-up rigs or allowable accelerations for specific equipment of the cargo. The analyses are based on industry standardized methods, accepted by Marine Warranty Surveyors, ensuring that results are in accordance with regulation and guidelines for heavy marine transport.
Proceedings of the ASME 2010 29th International Conference on Ocean, Offshore and Arctic Engineering OMAE2010
June 6-11, 2010, Shanghai, China
OMAE2010-21143

2 Copyright © 2010 by ASME
The general analysis sequence is visualized in Figure 1, showing how analysis methods, databases and project information are coupled. Calculation of RAO’s is not restricted to basic motions and acceleration, but includes determining RAO’s for accelerations in specific locations, leg bending moment RAO’s, cribbing load RAO’s, etc. This is done by rearranging the basic equation of motions:
( ) 0~~)~(1
, =−⋅+⋅+⋅+∑=
N
iiwiiiiiii FxCxBxAM &&&
Eq. 1
As simple example is the determination of forces and moments in the legs of a jack-up rig. Considering Eq. 1 applies to the complete HTV and cargo system, a subdivision can be made just above the upper guides of a jack-up leg, resulting in N=2. The equation can then be rewritten to:
221,1111111~~)~( xMFxCxBxAM w &&&&& ⋅−=−⋅+⋅+⋅+ Eq. 2
Where the term M2 is the mass tensor of the jacket-leg and 2x&& is the acceleration vector applied to the jack-up leg.
Figure 1 Analysis sequence for calculation of design values
Traditionally, marine transports are engineered to satisfy
design criteria in terms of allowable wave heights. It is obvious that the allowable wave height also depends on the other wave parameters, like the wave period, spectrum shape and spreading. Also, operational parameters like the vessel heading
and vessel speed may have a large effect on the response level in a certain sea state, and thus on the allowable wave height. It follows that different responses may result in different allowable wave heights, depending on the allowable response level.
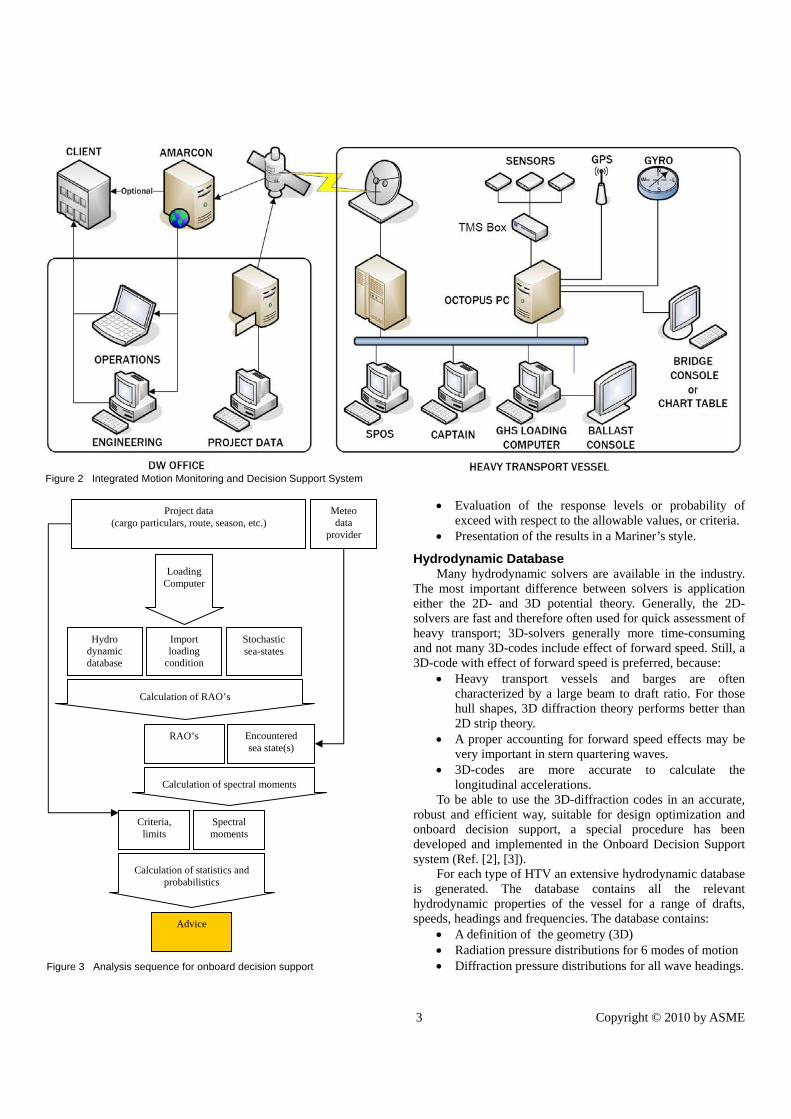
SYSTEM DESCRIPTION The Motion Monitoring and Decision Support system is
not restricted to the hardware and software onboard of a HTV; the system is integrated in the engineering process. Also include in the system is a measurement system. This is outlined in Figure 2.
Onboard system The main components and/or connections of the
OCTOPUS-Onboard system are: • OCTOPUS PC, mainly containing all required software
to operate the system; • Motion Measurement system (TMS Box) with three
motion sensors, sensor are located far apart from each other, measurement system is redundant;
• Connection to Gyro and GPS • Connection to e-mail server (and thus the satellite
communication system) • Network connection for I/O data, like loading condition
data, weather forecast data (in this case SPOS), etc. As Motion Monitoring and Decision support in integrated
the system is complemented with engineering support to the HTV and engineering service to the client. The engineering support mainly consists of ensuring that project specific data, criteria and limits are used. To accommodate the engineering service, the OCTOPUS-Onboard system sends all relevant data to a web server daily. With a login engineers and optionally clients can monitor the sailed route, encountered weather, predicted responses and measured responses.
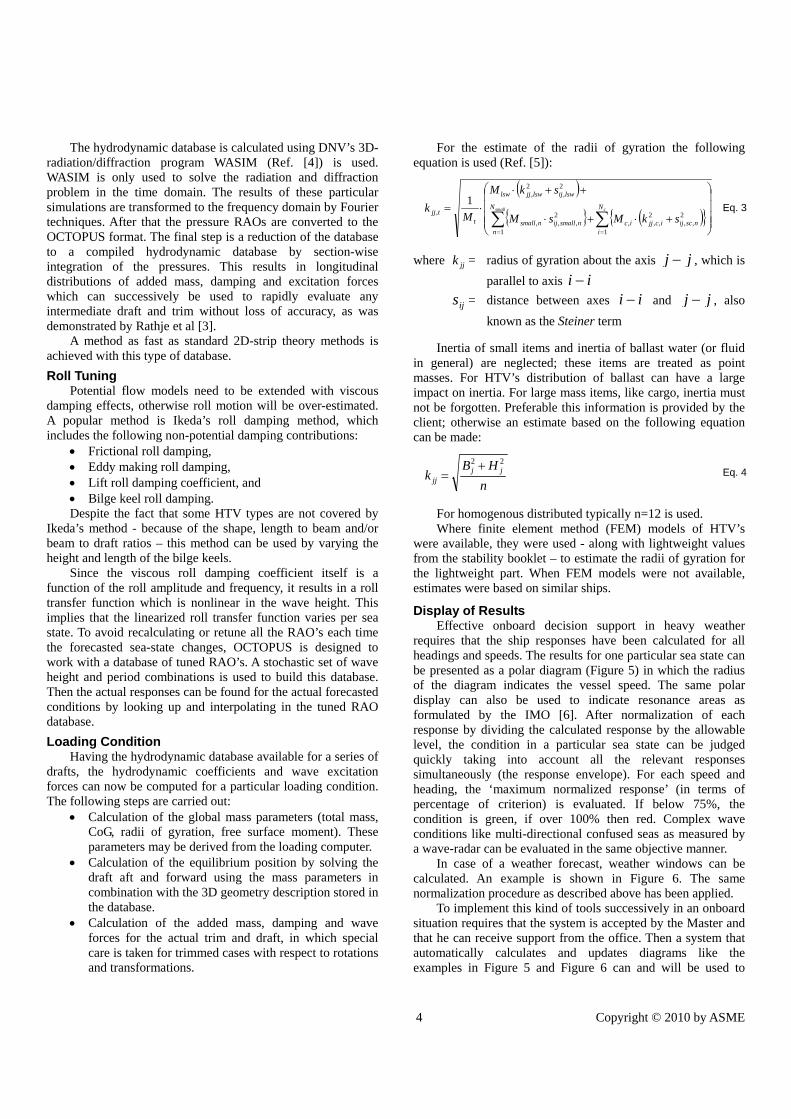
Analysis Procedure The procedure for operational support onboard is very
similar to the design procedure - the flow-diagram of the procedure is shown in Figure 3 - and includes:
• Automatic processing of the actual loading condition, obtained from the loading computer, or specified manually,
• Calculation of hydrodynamic coefficients and wave forces for the actual draft and trim, using the pre-calculated hydrodynamic database,
• Specification of the responses of interest (absolute or relative motions, accelerations, leg-bending moments, etc),
• Calculation of the RAOs, • Specification of the statistical quantity and the
corresponding allowable value for each response of interest,
• Calculation of short-term response statistics by using the available wave information (observation by the Master or weather/wave forecast, etc.)
Ship’s particulars
Hydro dynamic Solver
Hydrodynamic database
RAO’s Encountered sea state(s)
Calculation of spectral moments
Spectral moments
Rules, limits
Calculation of statistics and probabilistics
Design values
Calculation of RAO’s
Project data (cargo particulars, route, season, etc.)
Loading condition
Encountered sea state(s)
Weather database
Hydro static Solver
3 Copyright © 2010 by ASME
Figure 2 Integrated Motion Monitoring and Decision Support System
Figure 3 Analysis sequence for onboard decision support
• Evaluation of the response levels or probability of exceed with respect to the allowable values, or criteria.
• Presentation of the results in a Mariner’s style.
Hydrodynamic Database Many hydrodynamic solvers are available in the industry.
The most important difference between solvers is application either the 2D- and 3D potential theory. Generally, the 2D-solvers are fast and therefore often used for quick assessment of heavy transport; 3D-solvers generally more time-consuming and not many 3D-codes include effect of forward speed. Still, a 3D-code with effect of forward speed is preferred, because:
• Heavy transport vessels and barges are often characterized by a large beam to draft ratio. For those hull shapes, 3D diffraction theory performs better than 2D strip theory.
• A proper accounting for forward speed effects may be very important in stern quartering waves.
• 3D-codes are more accurate to calculate the longitudinal accelerations.
To be able to use the 3D-diffraction codes in an accurate, robust and efficient way, suitable for design optimization and onboard decision support, a special procedure has been developed and implemented in the Onboard Decision Support system (Ref. [2], [3]).
For each type of HTV an extensive hydrodynamic database is generated. The database contains all the relevant hydrodynamic properties of the vessel for a range of drafts, speeds, headings and frequencies. The database contains:
• A definition of the geometry (3D) • Radiation pressure distributions for 6 modes of motion • Diffraction pressure distributions for all wave headings.
Hydro dynamic database
RAO’s Encountered sea state(s)
Calculation of spectral moments
Criteria, limits
Spectral moments
Calculation of RAO’s
Project data (cargo particulars, route, season, etc.)
Import loading
condition
Stochastic sea-states
Loading Computer
Meteo data
provider
Calculation of statistics and probabilistics
Advice
4 Copyright © 2010 by ASME
The hydrodynamic database is calculated using DNV’s 3D-radiation/diffraction program WASIM (Ref. [4]) is used. WASIM is only used to solve the radiation and diffraction problem in the time domain. The results of these particular simulations are transformed to the frequency domain by Fourier techniques. After that the pressure RAOs are converted to the OCTOPUS format. The final step is a reduction of the database to a compiled hydrodynamic database by section-wise integration of the pressures. This results in longitudinal distributions of added mass, damping and excitation forces which can successively be used to rapidly evaluate any intermediate draft and trim without loss of accuracy, as was demonstrated by Rathje et al [3].
A method as fast as standard 2D-strip theory methods is achieved with this type of database. Roll Tuning
Potential flow models need to be extended with viscous damping effects, otherwise roll motion will be over-estimated. A popular method is Ikeda’s roll damping method, which includes the following non-potential damping contributions:
• Frictional roll damping, • Eddy making roll damping, • Lift roll damping coefficient, and • Bilge keel roll damping. Despite the fact that some HTV types are not covered by
Ikeda’s method - because of the shape, length to beam and/or beam to draft ratios – this method can be used by varying the height and length of the bilge keels.
Since the viscous roll damping coefficient itself is a function of the roll amplitude and frequency, it results in a roll transfer function which is nonlinear in the wave height. This implies that the linearized roll transfer function varies per sea state. To avoid recalculating or retune all the RAO’s each time the forecasted sea-state changes, OCTOPUS is designed to work with a database of tuned RAO’s. A stochastic set of wave height and period combinations is used to build this database. Then the actual responses can be found for the actual forecasted conditions by looking up and interpolating in the tuned RAO database. Loading Condition
Having the hydrodynamic database available for a series of drafts, the hydrodynamic coefficients and wave excitation forces can now be computed for a particular loading condition. The following steps are carried out:
• Calculation of the global mass parameters (total mass, CoG, radii of gyration, free surface moment). These parameters may be derived from the loading computer.
• Calculation of the equilibrium position by solving the draft aft and forward using the mass parameters in combination with the 3D geometry description stored in the database.
• Calculation of the added mass, damping and wave forces for the actual trim and draft, in which special care is taken for trimmed cases with respect to rotations and transformations.
For the estimate of the radii of gyration the following equation is used (Ref. [5]):
( ){ } ( ){ }⎟⎟
⎟⎟
⎠
⎞
⎜⎜⎜⎜
⎝
⎛
+⋅+⋅
++⋅
⋅=∑ ∑= =
small cN
n
N
inscijicjjicnsmallijnsmall
lswijlswjjlsw
ttjj
skMsM
skM
Mk
1 1
2,,
2,,,
2,,,
2,
2,
,1
Eq. 3
where jjk = radius of gyration about the axis jj − , which is
parallel to axis ii − ijs = distance between axes ii − and jj − , also
known as the Steiner term Inertia of small items and inertia of ballast water (or fluid
in general) are neglected; these items are treated as point masses. For HTV’s distribution of ballast can have a large impact on inertia. For large mass items, like cargo, inertia must not be forgotten. Preferable this information is provided by the client; otherwise an estimate based on the following equation can be made:
nHB
k jjjj
22 += Eq. 4
For homogenous distributed typically n=12 is used. Where finite element method (FEM) models of HTV’s
were available, they were used - along with lightweight values from the stability booklet – to estimate the radii of gyration for the lightweight part. When FEM models were not available, estimates were based on similar ships.
Display of Results Effective onboard decision support in heavy weather
requires that the ship responses have been calculated for all headings and speeds. The results for one particular sea state can be presented as a polar diagram (Figure 5) in which the radius of the diagram indicates the vessel speed. The same polar display can also be used to indicate resonance areas as formulated by the IMO [6]. After normalization of each response by dividing the calculated response by the allowable level, the condition in a particular sea state can be judged quickly taking into account all the relevant responses simultaneously (the response envelope). For each speed and heading, the ‘maximum normalized response’ (in terms of percentage of criterion) is evaluated. If below 75%, the condition is green, if over 100% then red. Complex wave conditions like multi-directional confused seas as measured by a wave-radar can be evaluated in the same objective manner.
In case of a weather forecast, weather windows can be calculated. An example is shown in Figure 6. The same normalization procedure as described above has been applied.
To implement this kind of tools successively in an onboard situation requires that the system is accepted by the Master and that he can receive support from the office. Then a system that automatically calculates and updates diagrams like the examples in Figure 5 and Figure 6 can and will be used to
5 Copyright © 2010 by ASME
identify possible hazards and their consequences. The system shall only assist the Master in taking the best decision with respect to safe and effective ship operation in a particular condition. The Master takes the final decision!
Figure 7 shows a comparison between the measured accelerations (blue) and the acceleration forecast (green).
QUALITY CONTROL To ensure that the OCTOPUS Onboard system is working
appropriately, several aspects of the system have been checked. First of all the hydrodynamic database has been validated and next a roll tuning study has been performed. Another aspect is the motion measurement system; the real-time measured signals are processed and a comparison between two independent systems has been made. Hydrodynamic Database
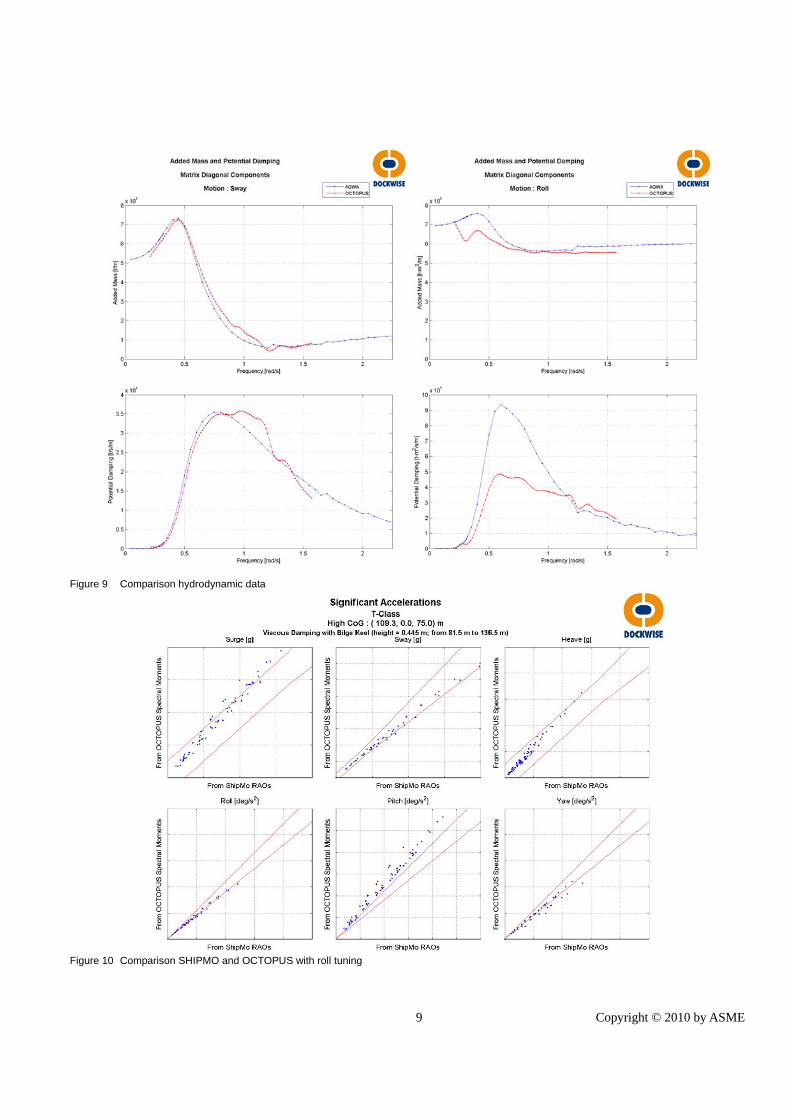
Hydrodynamic databases were created with WASIM for 7 types of Dockwise operated HTV’s. These databases were validated against zero-speed 3D diffraction results from ANSYS-AQWA, models are shown in Figure 8. Basic parameters like added mass, radiation damping and wave force RAO’s were compared. An example of the comparison is given in Figure 9. Generally good agreement was found, however some noticeable difference were found in the hydrodynamic data. Still, investigating RAO’s and responses, these differences were not considered a problem, as became clear from the roll tuning exercise. Roll tuning
In the past, DOCKWISE has performed model test extensively and developed specific tuning routines for the different types of HTV’s. The tuning routines are implemented in the 2D-strip theory program SHIPMO, which is used standard in the transport engineering process.
To ensure that the quality of the onboard calculations is equivalent to the office calculations, a roll tuning study was conducted. This is done by comparing motion response calculations done in SHIPMO and in OCTOPUS Office (the bases for OCTOPUS Onboard), and adapt the bilge keel length and/or height to attempt to match results as good as possible. This is done for different loading conditions, sea-states and wave directions for each type of HTV. A typical example of tuning results is shown Figure 10.
Comparison show typical difference between 2D-strip and 3D-diffraction theory, mainly noticed in surge and pitch. Measurement System
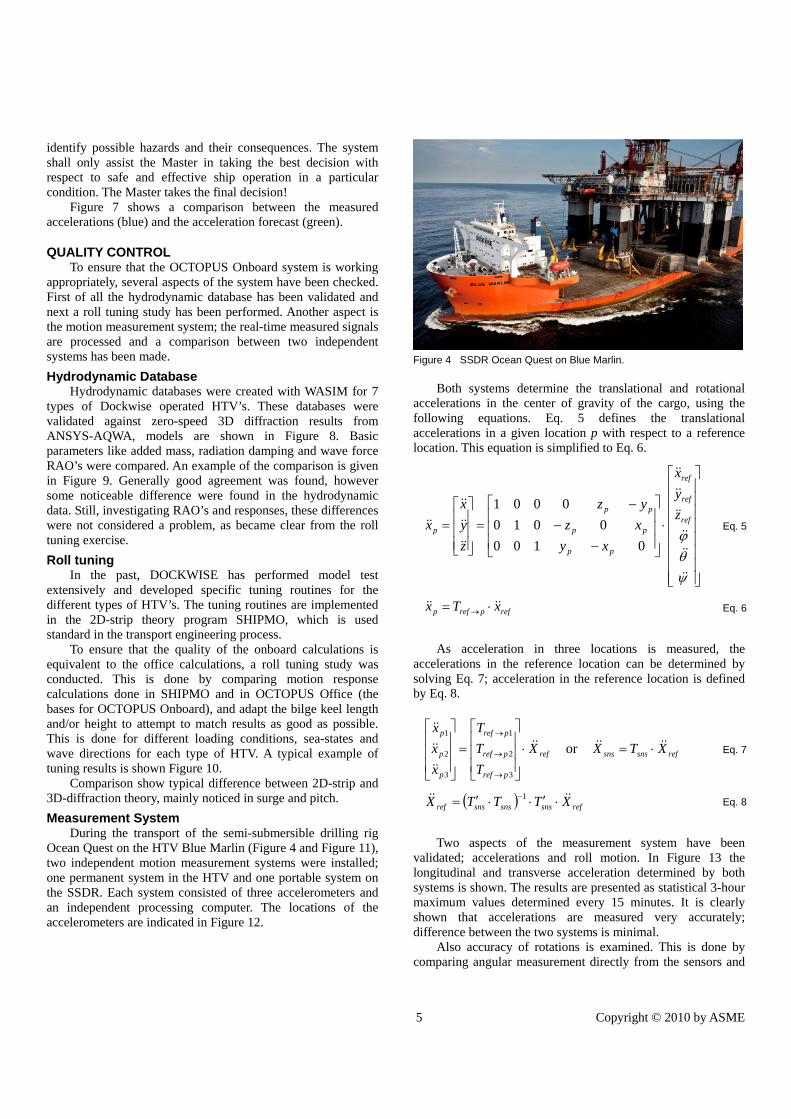
During the transport of the semi-submersible drilling rig Ocean Quest on the HTV Blue Marlin (Figure 4 and Figure 11), two independent motion measurement systems were installed; one permanent system in the HTV and one portable system on the SSDR. Each system consisted of three accelerometers and an independent processing computer. The locations of the accelerometers are indicated in Figure 12.
Figure 4 SSDR Ocean Quest on Blue Marlin.
Both systems determine the translational and rotational
accelerations in the center of gravity of the cargo, using the following equations. Eq. 5 defines the translational accelerations in a given location p with respect to a reference location. This equation is simplified to Eq. 6.
⎥⎥⎥⎥⎥⎥⎥⎥
⎦
⎤
⎢⎢⎢⎢⎢⎢⎢⎢
⎣
⎡
⋅⎥⎥⎥
⎦
⎤
⎢⎢⎢
⎣
⎡
−−
−=
⎥⎥⎥
⎦
⎤
⎢⎢⎢
⎣
⎡=
ψθϕ
&&
&&
&&
&&
&&
&&
&&
&&
&&
&& ref
ref
ref
pp
pp
pp
pzyx
xyxzyz
zyx
x0100
00100001
Eq. 5
refprefp xTx &&&& ⋅= → Eq. 6
As acceleration in three locations is measured, the
accelerations in the reference location can be determined by solving Eq. 7; acceleration in the reference location is defined by Eq. 8.
refsnssnsref
pref
pref
pref
p
p
p
XTXXTTT
xxx
&&&&&&
&&
&&
&&
⋅=⋅⎥⎥⎥
⎦
⎤
⎢⎢⎢
⎣
⎡
=⎥⎥⎥
⎦
⎤
⎢⎢⎢
⎣
⎡
→
→
→
or
3
2
1
3
2
1
Eq. 7
( ) refsnssnssnsref XTTTX &&&& ⋅′⋅⋅′= −1 Eq. 8
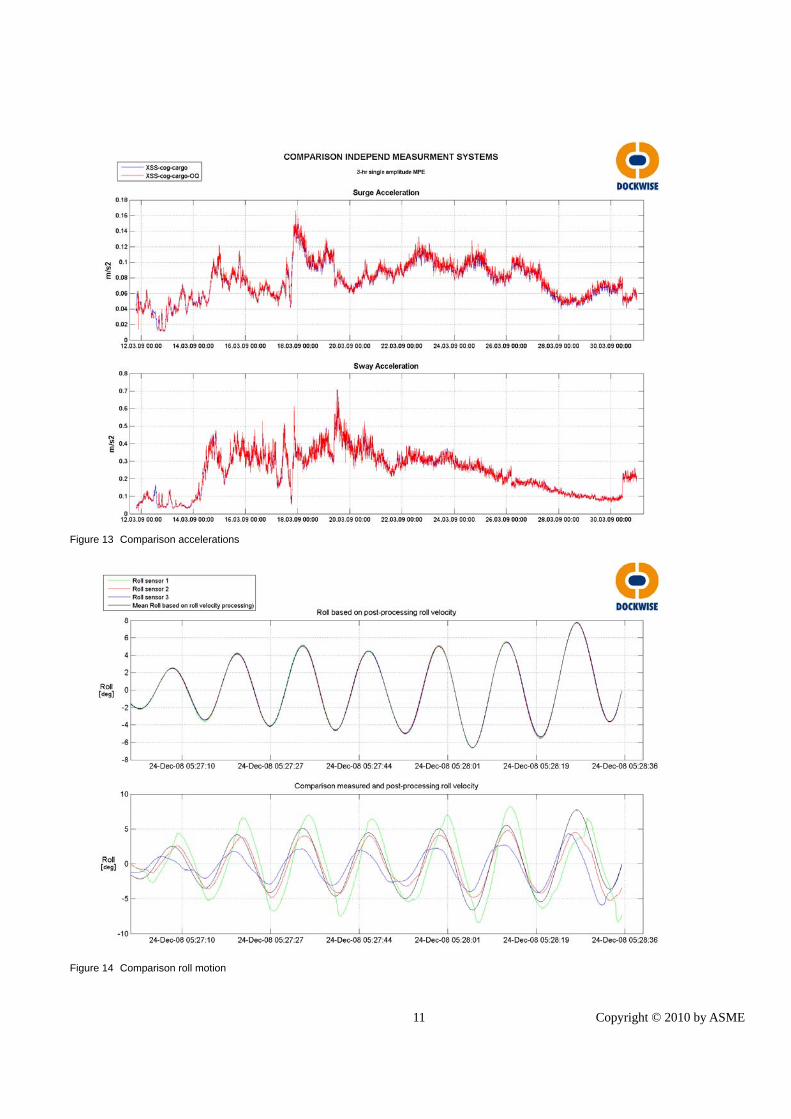
Two aspects of the measurement system have been
validated; accelerations and roll motion. In Figure 13 the longitudinal and transverse acceleration determined by both systems is shown. The results are presented as statistical 3-hour maximum values determined every 15 minutes. It is clearly shown that accelerations are measured very accurately; difference between the two systems is minimal.
Also accuracy of rotations is examined. This is done by comparing angular measurement directly from the sensors and

6 Copyright © 2010 by ASME
the angular motion determined by integration of angular velocities. Figure 14 clearly shows a large difference of angular measurements between the three sensors, while angular motion from integration shows negligible difference. Difference in angular measurement is explained by the fact that direct measurement of angles becomes inaccurate when sensors experience large horizontal accelerations, whereas processing the roll velocities of each sensor show matching roll angles. Based on this investigation the integration method was included in the Motion Monitoring system.
MOTION MONITORING DATABASE With 13 HTV, a lot of valuable data is gathered. In 1½ year
over 250,000 [nm] voyage data was gathered, see Figure 15. From the database several important insights can be obtained:
• How does predicted response and measured response compare?
• How can difference be explained, is it due to inaccurate RAO’s and/or inaccurate weather forecast?
• Which environment has been encountered? • How often did the master required to deviate route to
avoid bad weather? • How close was the maximum encountered condition to
the design conditions? The questions can be answered for each voyage, each area
as indicated in Figure 15 and/or specific voyage legs, like rounding of Cape of Good Hope. Also seasonal variation can be investigated.
By answering these questions more insight is given to the heavy transport engineering; it improves knowledge about safety margins and it can improve accuracy of the calculations in the preparation phase of a transport.
Figure 16 is showing an example comparison of now-casted accelerations and measured accelerations. Here, a reasonable match is found, however during other voyages large differences have been found. It is obvious that crew observations and/or wave radar and/or wave buoy data are needed to identify if weather forecast is accurate.
At this stage, the amount of data is not enough to give any conclusive answer to the questions. Certain is that actual encountered conditions and responses are generally well below design values, especially when Masters decided to reroute.
CONCLUSION With the Motion Monitoring and Decision Support system
the Master and officers have an accurate tool to plan and execute the transport of heavy cargo. This system, together with integrating it in the engineering process, contributes to increased safety.
Accuracy of the system is ensured by extensively investigate, compare and tune data used by the system.
The database built by gathering all relevant information from the system and from crew observations, increases insight in the design margins, which also contributes to an increased safety.
NOMENCLATURE CoG Center of Gravity CSM Cargo Securing Manual HTV Heavy Transport Vessel RAO Response Amplitude Operator SPOS Ship Performance Optimisation System
REFERENCES [1] L.J.M. Adegeest, “Response based Weather-Routing and
Operation Planning of Heavy Transport Vessels”, RINA Marine Heavy Transport & Lift II, London, UK, p123-131, 2008.
[2] H Rathje, J Drakogiannopoulos, L J M Adegeest, “Concept and Implementation of an Innovative Shipboard Routing Assistance System”, RINA Conference Design & Operation of Container Ships, London, 2003.
[3] AMARCON, ‘Manual: Calculation of an OCTOPUS hydrodynamic database using WASIM’, AMARCON document M20070622, June 2007.
[4] DET NORSKE VERITAS, ‘WASIM User Manual’, Det Norske Veritas, November 10th, 2005.
[5] DOCKWISE GC.ENG.301 “Radii of Gyration”, Guidelines and Criteria, November 2008
[6] IMO, ‘Revised guidance to the Master for avoiding dangerous situations in adverse weather and sea conditions’, MSC.1/Circ.1228, January 2007.

7 Copyright © 2010 by ASME
Figure 5 A polar diagram showing combinations of speed and heading.
Figure 6 Display of weather windows after calculation of ship responses using the waves expected during a voyage plan.

8 Copyright © 2010 by ASME
Figure 7 Comparison between measured accelerations and the calculated accelerations based on wave forecast (Dockwise heavy transport
vessel).
Figure 8 3D-diffraction models
9 Copyright © 2010 by ASME
Figure 9 Comparison hydrodynamic data
Figure 10 Comparison SHIPMO and OCTOPUS with roll tuning

10 Copyright © 2010 by ASME
Figure 11 Voyage
Figure 12 Motion sensor locations
11 Copyright © 2010 by ASME
Figure 13 Comparison accelerations
Figure 14 Comparison roll motion

12 Copyright © 2010 by ASME
Figure 15 Database routes
Figure 16 Example comparison now-casted and measured data