motadata | unified it monitoring, flow analysis and log management tool
TRANSCRIPT

MOTADATA
1
All Events. One Platform.
Industry’s first IT ops platform that truly correlates themetric, network flow and log events and turns them into actionable insights.

MOTADATA
2Company Overview

MOTADATA
3
Scattered Information with Limited Visibility (Infrastructure Silos)
Multiple IT Tools Lack Holistic Visibility
Network Monitoring Server Monitoring Database Monitoring
Application Monitoring Cloud MonitoringSecurity Management Log Management
InformationSilos
Multiple tools to Manage
No Holistic Visibility
Limited Automation
NoCorrelation
HigherTCO
Limited support for compliance & Reporting

MOTADATA
4
One Platform For All Your Events
Log Management Flow Analytics
Go proactive and take action before the issue becomes the problem with complete visibility and automated alerts.
Monitoring
Collect and analyze log data from multiple sources regardless of log data format.
Capture flow data to monitor traffic from devices supporting NetFlow v5 & v9, sFlow, and IPFIX etc.

MOTADATA
5360° visibility over IT Infrastructure
Network Monitoring
DatabaseMonitoring
Virtualization Monitoring
URLMonitoring
Cloud Monitoring
SeverMonitoring
WebMonitoring Email Container Services
Network Flow Log (SIEM)
Firewall
Router
Switch
Wi-fi
Any generic SNMP
device
Oracle
MSSQL
MySQL
PostgreSQL
NoSQL
VMware
Microsoft Hyper-v
Citrix Xen
HTTP
HTTPS
Phantom.js
AWS
Google App Engine
Windows
Linux
Redhat
HPUX
IBM AIX
Tomcat
Microsoft IIS
Nginx
Jboss
WebLogic
Apache HTTP
SMTP
Exchange
Active Directory
Ldap
Java
.Net
BSM
SLA
NetFlow v5
NetFlow v9
sFlow
IPFix
Network Log
Server Log
Application Log
Custom Log
Any Text

MOTADATA
6Correlated Analytics for all of your IT data at one single place

MOTADATA
7Motadata - The Only Analytics Platform DesignedFor Speed At Scale With Context
100k 85%
ON Lowest
Events analyzed in lessThan 10 seconds on singleserver
EPS in commodity 4-coreserver
Compression on rawExtracted data
No external proprietaryDatabase required
No time limits on actualData retention
TCO in the industry
ON
1+ Bil

MOTADATA
8The Unified Analytics Platform for Today’s Infrastructure
CorrelationMotadata is data driven analytics platform that quickly detects performance bottlenecks and suspicious behaviors across IT Infrastructure.
IntegrationMotadata brings flexibility to IT operations with proven integration capabilities for monitoring, log collection and collaboration.
AnalyticsPower packed analytics platform that collect data from any sources, correlate metrics, flow & logs and provide alerts with context.

MOTADATA
9Correlation
Metric
Looking at network metric in the context of application load, latency, system log pattern and severe usage trend.Focus on root cause of the problem rather than get sidetracked by the symptoms.
Platform that correlates
Network Flow
Logs
MOTADATA
10Integration

MOTADATA
11Analytics
Metric + Log Discover & Collect
Monitor & Track
Search & Visualize
Correlate & Investigate
Resolved
End-to-End Data Analytics Platform

MOTADATA
12Use Cases
Infrastructure Monitoring(End to End PerformanceMonitoring)
File Integrity
Remedy Actions(Trace route, Top N
Process for CPU and Memory)
Web Server Monitoring and
Log Management
Firewall Monitoring & Log
Analytics
Network Flow Log Analysis
(Net-flow v5, v9, Sflow, IPFIX)
Windows Event Log Analysis
Storage Monitoring and
Log Management
Virtual Private Network
(VPN) Monitoring (IPsec/SSL)
Network Topology Mapping
(End to End Layer Topology)
Linux OS Log Analysis
Wi-Fi Controller/AP
Monitoring& Log Analytics
Business Service Monitoring
Database Monitoring and
Log Management
Network Routing Protocol & Reporting(Static and
Dynamic Routing)
Virtualization Monitoring &Log Analytics

MOTADATA
13
Troubleshoot faster and get actionable information.
Root Cause with Context
PowerShell, SNMP, SSH, JDBC, JMX, HTTP/HTTPS etc.
Native Protocol Support
Multi-vendor monitoring and log management apps.
Multi-Vendor Support
Visualize and monitor all the things that matter
All in one DashboardMore productive ops with 3rd party integration.
Integrate Existing Tools
Find hidden and undisclosed insights from data.
Correlated Data
Monitoring

MOTADATA
14Monitoring
One Platform for Availability, Performance and Security
Go proactive and take action before the issue becomes the problem with complete visibility and automated alerts.

MOTADATA
15Log Management
Agentless or Agent-basedforward the logs using standard methods or use agents.
Compliance ReportingCollect log data to satisfy compliance
requirements.
Log CorrelationPre-defined rules to find patterns in collected logs.
Any Device/Server/App/TextCollect and correlate log data
regardless of format.
Normalize Log DataOrganizing data relation to facilitate better correlation.
Centralized Log ManagementAll your log data in the single central
location.

MOTADATA
16Log Management
Find Actionable Context in Log Data across Infra
Collect and analyze log data from multiple heterogeneous sources regardless of log data format.

MOTADATA
17Flow Analytics
Capture all conversations
Capture, view, log and analyze all the
data.
Bandwidth used per user
Detect the excessive network bandwidth usage.
Application traffic issues
Detect apps with higher bandwidth
usage.
Retain raw conversations
Get historical trend of each
unique transaction.
Deep insight into flow
Deep-level insights on bandwidth
usage.
End-to-End traffic
Unified visibility from network to
end-user.

MOTADATA
18Flow Analytics
Monitor & Analyze Your Network Flow Traffic
Capture flow data to monitor network traffic from network devices supporting NetFlowv5 and v9, sFlow, and IPFIX etc..
MOTADATA
19
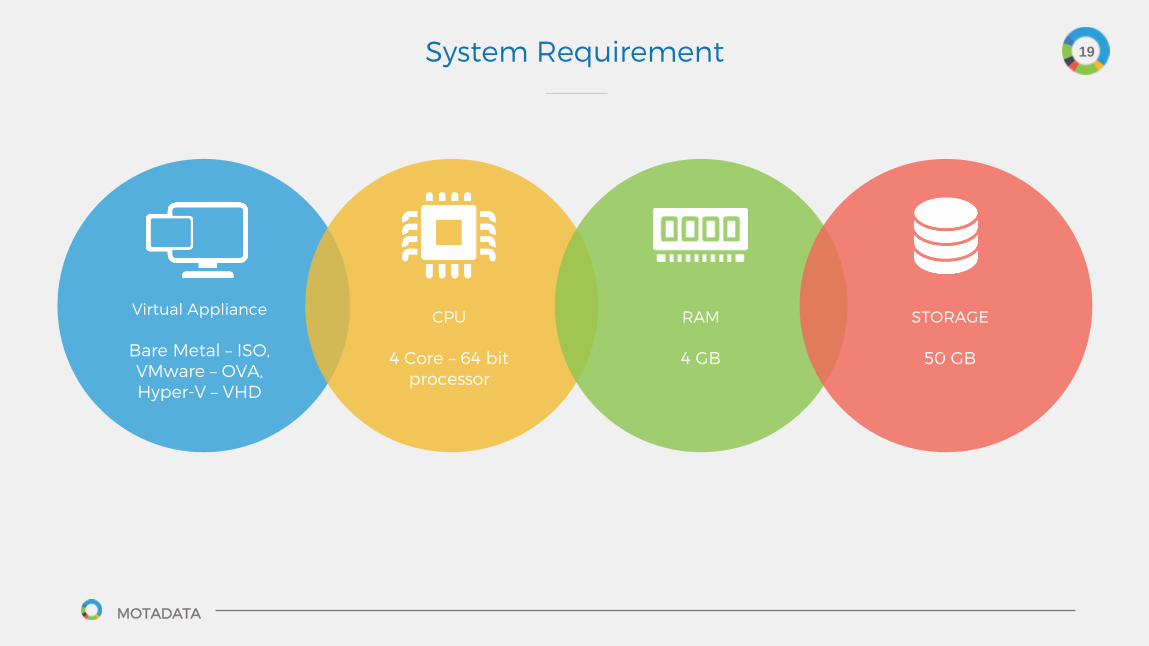
Virtual Appliance
Bare Metal – ISO,VMware – OVA,Hyper-V – VHD
CPU
4 Core – 64 bit processor
RAM
4 GB
STORAGE
50 GB
System Requirement

MOTADATA
20
6 Aaryans Corporate Park,Nr. Shilaj Railway crossing, Thaltej-Shilaj Road, Thaltej,Ahmedabad, Gujarat, India-380058
Email: [email protected]: [email protected]: [email protected]
India: +91 7940191445USA: +1 408-418-5229
Address
Contact Info
Telephone
Keep in touch with usWe always give our 110% for clients growth and uptime.

MOTADATA
21
Motadata platform is built for every member of your IT team to monitor, track, and deliver great business services. Upgrade your existingmonitoring tools with one unified analytics platform for performance monitoring, network behavior analytics, log management and SIEM. Toprovide uninterrupted services to the users, operational team needs correlated data,integrations across the board to collect & automate, analyticscapabilities to monitor & visualize critical metrics which allows making more informed decisions. Motadata platform can help you do just that –Correlate, Integrate and Analyze IT infrastructure stack.
Thank You