mosquito lagoon environmental resources inventory · mosquito lagoon environmental resources...
TRANSCRIPT

NASA Technical Memorandum 107548
Mosquito LagoonEnvironmental Resources Inventory
J. A. Provancha, C. R. Hall and D. M. Oddy,
The Bionetics Corporation,
Kennedy Space Center, Florida 32899
March 1992
National Aeronautics and
Space Administration
https://ntrs.nasa.gov/search.jsp?R=19920020187 2019-04-28T22:32:11+00:00Z
TABLE OF CONTENTS
LIST OF FIGURES ....................................................................................................................... iv
LIST OF TABLES ........................................................................................................................ vii
ACKNOWLEDGEMENTS ..................... _................................................................................... viii
INTRODUCTION ........................................................................................................................... 1
OVERVIEW .................................................................................................................................... 1
CLIMATE ................................................. ....................................................................................... 2
LAND USE ..................................................................................................................................... 6
VEGETATION .............................................................................................................................. 11
GEOHYDROLOGY ..................................................................................................................... 13
HYDROLOGY AND WATER QUALITY ................................................................................... 24
FISHES ........................................................................................................................................ 53
SEA TURTLES ........................................................................................................................... 58
WADING BIRDS ......................................................................................................................... 60
MARINE MAMMALS .................................................................................................................. 61
INVERTEBRATES ...................................................................................................................... 65
SHELLFISH ................................................................................................................................ 66
MOSQUITO CONTROL ............................................................................................................. 68
LITERATURE CITED .................................................................................................................. 69
APPENDIX A ............................................................................................................................... 75
APPENDIX B............................................................................................................................... 88
APPENDIX C ............................................................................................................................... 90

APPENDIXD...............................................................................................................................92
APPENDIXE...............................................................................................................................93
APPENDIXF.............................................................................................................................101
,oo
III

LIST OF FIGURES
Figure 1. Relative Location of Mosquito Lagoon on the East Central Coast of Floridaand its Proximity to the Indian River and Banana River (as modified by Clapp
1987) ............................................................................................................................................... 3
Figure 2. Mean Minimum and Maximum Monthly Air Temperatures for the 28 YearPeriod between 1957 and 1985 at Cape Canaveral, Florida (Mailander 1990) .............. 4
Figure 3. Regional Pattern of Annual Rainfall for Mosquito Lagoon and the EastCentral Coast of Flodda (Rao 1987) ......................................................................................... 5
Figure 4. Climate Diagram for the Mosquito Lagoon Region Based on Data Collectedat Cape Canaveral, Florida (Mailander 1990) ........................................................................ 7
Figure 5. Mean Monthly Solar Insolation for the Cape Canaveral Region (Mailander1990) ............................................................................................................................................... 8
Figure 6. Mosquito Lagoon Sub-Basin Designation within the Northern Part of theIndian River Lagoon System (Clapp 1987) ........................................................................... 10
Figure 7. The Distribution of Submerged Aquatic Vegetation in Mosquito Lagoon,Based on Groundtruthing and Interpretation of 1983 and 1986 Imagery ........................ 14
Figure 8. Locations of the Six Seagrass Transects Monitored Annually in MosquitoLagoon by the Bionetics Corporation for NASA's Ecological Program ........................... 15
Figure 9. Temporal Variation in the Percent Coverage of Seagrass along ThreeTransects Located in Southem Mosquito Lagoon ............................................................... 16
Figure 10. Diagrammatic Representation of Geohydrologic Setting Beneath MosquitoLagoon (Schmalzer and Hinkle 1990b and Clark 1987) ................................................... 19
Figure 11. Diagrammatic Representation of Groundwater Recharge and Flow throughthe Surficial Aquifer on North Merritt Island (taken from Schmalzer and Hinkle 1990bafter Clark 1987) ......................................................................................................................... 20
Figure 12. Locations of Surficial Aquifer Recharge Zones on the Kennedy SpaceCenter and Related Areas of Mosquito Lagoon (taken from Schmalzer and Hinkle1990b after Clark 1987) ............................................................................................................ 23
Figure 13. Hydrograph of Surficial Aquifer Levels Showing the Response to MonthlyRainfall Levels (Clark 1987) ..................................................................................................... 26
Figure 14. Summary of STORET Water Quality Data for Samples Collected between1970 and 1987 from the New Smyrna and Edgewater Region of Mosquito Lagoon(Hand et al. 1988) ...................................................................................................................... 28
iv

Figure 14 (continued). Summary of STORET Water Quality Data for SamplesCollected Between 1970 and 1987 from the New Smyrna and Edgewater Region ofMosquito Lagoon (Hand et al. 1988) ...................................................................................... 29
Figure 15. Location of Historic Water Quality Sampling Stations in Mosquito LagoonBased on Latitude and Longitude Data from the Environmental Protection AgencySTORET Database (1970-1987) ............................................................................................. 32
Figure 16. Locations of Current Volusia County and Brevard County Water QualityStations in Mosquito Lagoon ................................................................................................... 34
Figure 17. Results of Sediment Chemistry Analyses for Lead at Four DifferentLocations in Mosquito Lagoon. Data Values that Occur above the ExpectedRelationship with Aluminum Suggest the Presence of Pollution ...................................... 38
Figure 18. Results of Sediment Chemistry Analyses for Copper at Four DifferentLocations in Mosquito Lagoon. Data Values that Occur above the ExpectedRelationship with Aluminum Suggest the Presence of Pollution ...................................... 39
Figure 19. Results of Sediment Chemistry Analyses for Zinc at Four DifferentLocations in Mosquito Lagoon. Data Values that Occur above the ExpectedRelationship with Aluminum Suggest the Presence of Pollution ...................................... 40
Figure 20. Results of Hourly Temperature Monitoring for a Three Week Periodbeginning November 1988 in Mosquito Lagoon, Banana Creek, and BananaRiver. ............................................................................................................................................. 41
Figure 21. Results of Hourly Temperature Monitoring for a Three Day Period inDecember 1988 and December 1989 ................................................................................... 42
Figure 22. Results of Hourly Water Temperature Monitoring for a Three Week Periodbeginning May 1989 in Mosquito Lagoon, Banana Creek, and Banana River .............. 43
Figure 23. Results of Hourly Dissolved Oxygen Monitoring during a 48 Hour Periodfollowing Observation of a Major Fish Kill in Banana Creek on July 17,1984 .............................................................................................................................................. 44
Figure 24. Results of Monthly Water Level Monitoring by the U.S. Fish and WildlifeService in Mosquito Lagoon, Banana Creek, and Banana River between 1984 and1989 .............................................................................................................................................. 46
Figure 25. Results of Monthly Salinity Monitoring by the U.S. Fish and Wildlife Servicein Mosquito Lagoon, Banana Creek, and Banana River between 1984 and1989 .............................................................................................................................................. 47
Figure 26. Results of Monthly Water Level Monitoring by the U.S. Fish and WildlifeService in a Fresh and a Brackish Mosquito Impoundment on Merritt Island between1984 and 1989 ........................................................................................................................... 48
V

Figure 27. Results of Monthly Salinity Monitoring by the U.S. Fish and Wildlife Servicein a Fresh and a Brackish Mosquito Impoundment on Merritt Island between 1984 and1989 .............................................................................................................................................. 49
Figure 28. Locations of Marine Mammal Strandings, Represented by White Circles, inthe Vicinity of Mosquito Lagoon from 1977 to 1990 (scale = 1:160,000) ....................... 62
vi

LIST OF TABLES
Table 1. Summary of Monthly Wind and Humidity Information for the Cape CanaveralAir ForceStation...........................................................................................................................9
Table 2. Endangered and Potentially Endangered Terrestrial Plants Occurring in theVicinity of Mosquito Lagoon (taken from Schmalzer and Hinkle 1990a)........................ 12
Table 3. Summary of Geohydrologic Setting for Mosquito Lagoon and theSurrounding Areas (taken from Schmalzer and Hinkle 1990b after Clark 1987)..........18
Table 4. Example of Water Quality Data Collected for the Surficial Aquifer on MerrittIsland North of Banana Creek (Clark Eng. and Sci. 1987)................................................22
Table 5. Projected Loading Rates of Five Water Quality Constituents from Six DifferentLand Use Categories in the Volusia County Part of the Mosquito Lagoon Sub-Basin(Erwin 1989)................................................................................................................................27
Table 6. Examples of Mosquito Lagoon Water Quality Data Available from STORETfor SelectParameters................................................................................................................30
Table 7. Mean Values of Water Quality Parameters from Samples Collected at TwentyStations October 1988 and March 1990. Data Provided by Volusia CountyEnvironmental Management ................................................................................................... 36
Table 8. Summary of Water Quality Monitoring Data for South Mosquito Lagoonbetween 1985 and 1990 ........................................................................................................... 50
Table 9. Summary of Water Quality Monitoring Data for Max Hoeck Back Creek(Mosquito Impoundment) between 1985 and 1990 ............................................................ 51
Table 10. Top Five Species Captured by Various Recreational Fishing Methodsduring Spring, Summer, and Fall 1963 between Ponce de Leon Inlet and Titusville.Species are Listed in order of Biomass (Total Weight in Pounds) ................................... 55
Table 11. Species of Birds Observed during Monthly Wading Bird Surveys overMosquito Lagoon ....................................................................................................................... 63
Table 12. Listing of Stranded Marine Mammal Species Recorded for the CanaveralNational Seashore and Mosquito Lagoon between 1977 and 1990 ............................... 64
vii

ACKNOWLEDGEMENTS:
This project was made possible through Interagency Agreement between the NationalPark Service, Canaveral National Seashore and NASA, John F. Kennedy SpaceCenter. Special thanks to Trish Patterson, Gary Rosenleib, and Dr. William Knott forworking out the details of the agreement.
We gratefully acknowledge the technical assistance from Resa Reddick and MarkProvancha in the Remote Sensing and Geographic Information System Laboratory atKSC. We also thank Opal l'illey and Julie Harvey who typed the manuscript.
,oo
VIII

MOSQUITO LAGOONENVIRONMENTAL RESOURCES INVENTORY
INTRODUCTION
This report summarizes Phase I of a water quality and environmental resourceinventory project for Mosquito Lagoon. The work was funded by the National ParkService through an Interagency Agreement with NASA at the John F. Kennedy SpaceCenter. Phase I of the project consisted of a comprehensive literature search and theretrieval of data from various federal, state and local agencies. Literature searcheswere conducted manually through various bibliographic listings as well aselectronically with the DIALOG database, the NASA-RECON database and the NASA-ARIN database. Updating of the literature database represents an ongoing processand to date 157 papers, reports and articles have been inventoried. Each article hasbeen numbered and entered into REF-MENU bibliographic software, where it can beaccessed by author, title, year or keywords. A listing of the bibliographic index printedby reference number (Ref) is presented in Appendix A. The biotic and abioticinformation collected in the Mosquito Lagoon area is listed in Appendix B. A listing ofindividuals contacted in the process of performing Phase l is found in Appendix C.Appendix D lists the types, age and locations of aerial photographs and satelliteimages available for Mosquito Lagoon.
In reviewing data and reports relative to environmental resources in Mosquito Lagoona holistic ecological approach was taken. Studies have been conducted on variouscomponents of this lagoon, many as inventories for the Kennedy Space Center'sEnvironmental Impact Statement and documentation requirements. Also, severalanimal species found in the lagoon are of significant status in terms of mandatedprotection by U.S. laws. There have been few areas of consistent data collectionwithin Mosquito Lagoon or any region of the Indian River Lagoon (IRL), for that matter,over long periods of time. We do know from the various studies that the system isdynamic and there is much that is not understood.
In the following text, we briefly highlight some of the data and information on climate,hydrogeology, land use, chemistry, flora and fauna that most directly relate to waterquality and the historical and current ecological condition of Mosquito Lagoon. At theend of each section a list of reference numbers from the Phase I literature search is
provided suggesting additional reading material pertinent to that section.
OVERVIEW
Mosquito Lagoon is a bar-built type estuary occupying 152.8 km 2 of east central
Florida and is considered a sub-basin of the larger Indian River Lagoon System(Clapp 1987). The Indian River Lagoon extends along the east coast of Florida from

Ponce de Leon Inlet near New Smyrna Beach to St. Lucie Inlet near Stuart, a distanceof about 220 km. The lagoon system is composed of three interconnected waterbodies, Mosquito Lagoon to the north, Indian River to the west and Banana River to theeast of Merritt Island (Figure 1). The lagoons vary in width from about 1-2 km in thenorthern and southern regions to over 8 km near Merritt Island. Average depth isabout 1.5 m with depths greater than 3-4 m generally restricted to dredged basins andchannels. This region crosses the transition zone between the temperate province tothe north and the warm subtropical province to the south. Mosquito Lagoon is locatedin the northern part of this transition zone and the presence and abundance of speciesof flora and fauna generally reflect this condition.
Mosquito Lagoon is dominated by shallow flats (less than 1.5 m) that support densegrowths of submerged aquatic vegetation (SAV) including manatee grass,(.SJLr.[.&__ filiforme), shoal grass (Halodule wrightii), widgeon grass (Ruooiamaritima) and various macroalgae such as Gracilaria, CaulerDa, Sargassum, andAcanthoohora. Shorelines of the system are dominated by mangroves such as1_&g._8£2,/._ racemosa and _ germinans. However, this region representsthe northern limit of their range and the winter freezes of 1983, 1984, and 1989significantly impacted their populations (Provancha et al. 1986, personal observation).Fauna in the lagoon system is also dominated by species common to the CarolinianProvince such as mullet (M..M._g_ceohalus), spotted sea trout ((_ynoscion nebulosus),red fish _ ocellatus), sea catfish _ fells), and blue crabs (Callinectes_) to name a few. Subtropical species are present but are less prevalent than inthe southern portion of the Indian River Lagoon System. This unique environmentalsetting makes Mosquito Lagoon part of one of the most diverse estuarine areas in theUnited States.
CLIMATE
Climate is a dominating factor controlling water quality and the distribution andabundance of biota. Mailander (1990) presents a comprehensive review of existingclimate data for the region, including Mosquito Lagoon. Mosquito Lagoon is situatedbetween 28o38" and 28o58" north latitudes on the east central coast of Florida and
has a warm temperate to subtropical climate. Summers are warm and humid andwinters are typically mild. Figure 2 shows the mean monthly minimum and maximumair temperatures between 1957 and 1985 measured at Cape Canaveral Air ForceStation at the south end of Mosquito Lagoon. The occurrence of freezingtemperatures limits the distribution and abundance of plants and animals in thistransition region. This topic is discussed in more detail in following sections. Theproximity of the lagoon to the Atlantic Ocean moderates extremes in temperaturefluctuations to some degree. Comparison of 40 years of daily temperature data fromMerritt Island and Titusville showed 30 freezing days at Merritt Island compared to 121
days at Titusville, a few miles inland.
Mean annual rainfall for Merritt Island based on a 76 year dataset is 51.6 inches (131 cm)with a range of 30.5 inches (77.5 cm) to 85.7 inches (217.7 cm ). The range for averageannual rainfall between 1951 and 1980 for the Mosquito Lagoon area was 48-56 inches(122-142 cm) (Rao 1987). The regional pattern of precipitation, presented in Figure 3,indicates that Mosquito Lagoon averages slightly less rainfall than the Banana River
2

OSCEOLA FLATS
ALLAPATTAH FLATS
IHDIAN RIVER LAGOONBASIN BOUNDARY
COUNTY BOUIqDARY
ATI AN I ICCOASTAL . _-"
RIDGE
BANANA RIVERLAGOON
BARRIERISLAND
II'JDIANRIVER
LAGOON
TEN MILLERIDGE
N
SEBASTIANST. LUCIE FLATS
GREEN RIDGELOXAItA1 CItEE
i KARST
Figure 1. Relative Location of Mosquito Lagoon on the EastCentral Coast of Florida and its Proximity to the Indian River andBanana River (as modified by Clapp 1987).
3

d
<]
I , I • I
0 0 0O 0_ CO
L
I , I , I
0 0 C_
(.:l) 69a
E_I
E_I
_<_I
! , I
0 0
(/)
L_c_ "_
0 o_
z E_
0 ._ 0<.-.
•,-, COCO')
(j 0_--D _'0<
E_
.c: Er --_,tOO"3
:E .-, =
o. "E "=•-- (1) (0
r_ _-_0
m 0o-_ILlb- t'_ Od _
Z _._._
Eoo

RAIN GAGE STATION
INDIAN RIVER LAGOON
BASIN BOUNDARY
COUNTY BOUNDARY
IIellellIIIfly
• L
Figure 3. Regional Pattern of Annual Rainfall for Mosquito Lagoonand the East Central Coast of Florida (Rao 1987).
5

and Indian River areas. The distribution of rainfall is somewhat bimodal withapproximately 65% falling between May and October as a result of convectional cellsand tropical storms. Winter spring rainfall generally results from passage of frontalsystems. On average there are 148 days per year with measurable rainfall. Figure 4presents the drought and moisture surplus for the region. Two periods of moisturedeficit occur: a two month period between March and May and a one month periodbetween November and December. Moisture surplus occurs between June andOctober. Evapotranspiration data for Cocoa Beach and Cape Canaveral were similarmeasuring 37.0 inches (94.0 cm) per year. Mean solar insolation values for CapeCanaveral are presented in Figure 5. The summer solstice occurs in June but themonth with highest insolation is May because of reduced cloud cover resulting fromfewer days of convective thunderstorms. December is the month with lowestinsolation. The solar elevation ranges from a maximum of 85.5 degrees above thehorizon on June 21 to a minimum of 38.5 degrees on December 21, the longest (14 hr)
and shortest (10 hr) days of the year respectively. A summary of average wind andhumidity values for Cape Canaveral are shown in Table 1. During the summer wetseason east winds predominate. Winter season winds predominate from the north-northwest. Relative humidities are consistantly above 75%.
Associated Database Reference numbers: 41,87, 91.
LAND USE
The Mosquito Lagoon sub-basin, Figure 6, covers a total area of 288.5 km 2 of which53% is open water, 15.8% is barrier island and 31.2% is uplands (Clapp 1987). Theimportance of Mosquito Lagoon to the ecology and economics of the region becomes
apparent based on the numerous classifications bestowed on it by regulatingagencies. The Environmental Protection Agency (EPA), through the National EstuariesProgram, lists the area as an Estuary of National Significance, the state of Floridarecognizes Mosquito Lagoon as Outstanding Florida Waters, an Aquatic Preserve, andgives it a water use classification designation of Class II Shellfish Propagation andHarvesting (Gardner 1990). Approximately 65% of Mosquito Lagoon falls within theboundary of the Kennedy Space Center and is managed as part of the Merritt IslandNational Wildlife Refuge (Clark 1986). An additional 17% is managed by the NationalPark Service at Canaveral National Seashore (CNS) north of the KSC boundary. This
places about 82% of the Lagoon under direct federal jurisdiction.
Activities that may impact water quality in Mosquito Lagoon are regulated by variousfederal and state agencies. The EPA regulates the discharge of pollutants under theFederal Clean Water Act of 1977 (CWA), as amended by the Water Quality Act of1987. EPA has adopted numerous regulations to implement the CWA including thedevelopment of the National Pollution Discharge Elimination System (NPDES) forboth point and non-point source discharges. The U.S. Corp of Engineers administerspermitting of Dredge and Fill activities in navigable waters through the authority of theRivers and Harbours Act of 1899 and in waters of the United States (including isolated
wetlands) through Section 404 of the CWA. Chapter 373 of the Florida Statutesauthorizes the Florida Department of Environmental Regulation (FDER) to administer
regulation of use, management and storage of surface waters. A listing of water quality
6

(t.u uJ) uo!tol!d!ogJd
00 (D 0 0 C)
¢xl
I I I i I
0
I
I I I I
0 0 0 oI_ 0,1 ,--
(C)) oJnlDJodwoj. UDOI'_
OILlO
8Z
bO
133L_I..i..
Z
._o
n.-v
O'_O O
..-I ._.-
o_
I/_ t-O _I
r- O..
8oE_
°_ _._
O-"O
E_Oo
O
•-_ C_Ia,. I_ ,_--
7

I , I , I I I , I , I , I ,
C::) 0 0 C) (:0 0 0 00 0 0 0 0 0 0 0
0 LG') 0 u_ 0 t_ 0
J_lalAI aJDnb S Jad sJnOH--tlD M
0_Jn>ozF--00
n1,1
(_9
<
mLL
Z
e-t_0
o
e-
t-o
o
e-i
L_
0
e-, r_0
e-c_ m
_'_
e,-
En"
8

o
o0c--0
cO
0U.
<
>
0
0o_
a
-m_ 0- _-"_D c-
c-O_°I
c'-_0
o"0
_,._ --
E _Em_ o
f,/) -r.-
• >
_c
_o_ _000_0_0
cO cO ooh-
ZZZ IIILLIUJCOUJLUlII
A
,.--,CO
(:IO_-.(D-)-.._
vU_
o_m
.m
"I0 0_
o
o.(O09
_E
E _cocO
LU
uJ(JrrD0GO

e'O_Cl[ O_ LION I_LI_T
.B.1
I L
ll.B.2
0 ! 7 3 _ 5t J J i
_et_3
o. , _ j ! __. .ICILOUE TE_$
'e
, (
\
Figure 6. Mosquito Lagoon Sub-Basin Designation within theNorthern Part of the Indian River Lagoon System (Clapp 1987).
10

classifications and standards developed by the FDER is presented in Appendix E.Authority has been delegated to the St. Johns River Water Management District toadminister permits and enforcement programs under the Florida Water Resources Act.The Water Management District is also responsible for regulation of stormwaterdischarges and wetland permitting activities under Chapter 403 of the Florida Statutes.
Land use in the Mosquito Lagoon watershed, outside of the federal properties, fallsunder the jurisdiction of Volusia County. Three communities, New Smyrna,Edgewater, and Oak Hill are located along the shore of the lagoon. Erwin (1988)reports that there are about 1400 ha of urban land including 1050 ha of residential useassociated with this part of the watershed. Low density residential housing makes up59% and mobile homes make up 39%. On the Barrier Island there are about 425 hadesignated as urban. Of these, about 375 ha are residential with 81% being classifiedas low density housing and 1% being designated for mobile homes.
Associated Database Reference numbers: 10, 38, 40, 92, 109, 110, 122.
VEGETATION
1) TERRESTRIAL
The natural edges of the Mosquito Lagoon shoreline are generally bordered bymangrove (white, black and occassionally red mangrove), sea oxeye, and wax myrtle.There are a few maritime hammocks in the region as well. A variety of vegetationtypes occur inside the impounded marshes that border the lagoon (i.e.,S oartina/Juncus, Batis/Salicornia). Kirkman (1979) provided a vegetation map andspecies list for a small section (5.25 miles or 8.4 km) of the CNS barrier beach and afew nearby islands in the lagoon. She listed three major vegetation zones and thengave a description of plant communities found within each. The first zone, interiormarshlands, were composed of glasswort/saltwort marsh, rush marsh and a mixture of
the two. The second zone, swamp, was divided into two types; black mangroveswamp and mixed swamp/marsh. The beach and dune zone involved 9 communities:sea oats/cordgrass/salt grass; sea oats/cordgrass/spanish bayonet/palm; sawpalmetto/sea grape; saw palmetto/thicket shrubs; juniper/shrub thicket; palm/shrubthicket; juniper/shrub palm hammock; hardwood hammock; and finally groundsel/waxmyrtle/sea oxeye/daisy community.
The most recent resource maps that included vegetation and land use bordering theMosquito Lagoon were produced in 1986 by The Bionetics Corporation using remotesensing techniques, groundtruthing and a geographical information system (GIS). TheNational Park Service (NPS) maintains a copy of the computerized data.
Schmalzer and Hinkle (1990a) provided a review of the flora of KSC includingdescriptions and locations of the threatened and endangered plants. Table 2 is a list
of the plants of federal concern found within the vicinity of Mosquito Lagoon bySchmalzer and Hinkle.
11

cO
O.
e-
n"
N._-0
.0
I0
0
0
o__
N
e-
°_
t-
Oe-
t-O
0
e_
0e-
o _
0 >
g) 0"0
"0 e-
._ "_
-I 00 e-
"_ e-
1=: ._0 e-
> -_
C t_
-_ .__C m
•r- (_
- Q.
o_ _
12

2) AQUATIC VEGETATION
The Indian River Lagoon is considered to be a seagrass-based ecosystem (Clark1975, Schooley 1977). The pulses in seagrass detrital cycles strongly effect thebenthic invertebrate populations which then effect the benthic feeding fishes(Schooley 1977). However, the general concensus is that due to nutrient enrichmentof the Indian River Lagoon, primary productivity is changing from submerged aquaticmacrophytes to phytoplankton (Windsor and Steward 1987).
Seagrass beds within the bounds of the Kennedy Space Center which includedMosquito Lagoon (Figure 7), were mapped beginning in 1983 (Provancha and Willard1984). The northern end of Canaveral National Seashore was mapped in 1986specifically for the National Park Service. This information is currently stored on theGIS at the KSC Remote Sensing and GIS Laboratory. Total areal coverage ofsubmerged aquatic vegetation (SAV) in Mosquito Lagoon to the northern Park Serviceboundary was 15,403 acres (6233.59 ha). Maps included the delineation of fourdensity classes, representing percent cover of the vegetation and were 10-40%, 40-70%, 70-100% and undiscemable. Sixty-one percent of the SAV were classified asvery dense (70-100% coverage class).
In addition to seagrass mapping in the lagoon, six nearshore seagrass transects,Figure 8, have been monitored from 1983 to the present in the southern end of thelagoon between Gallinipper Point and Max Hoeck Back Creek. Three species ofseagrass have been observed on these transects, Halodule wrightii, Ru00ie, martima,and ._.D.g.q..CW, Lm filiforme. _ has continued to be the dominant species alongthe transects (see Figure 9). Transects were located in water depths ranging from .02m to 0.7 m and averaged about 0.3 m.
Mendonca (1983), studying the feeding ecology of immature green turtles, sampledseagrasses along three transects in Mosquito Lagoon in 1977-1978. Transects wereused to determine the species composition, the relative percentages and depth ofoccurence of seagrasses and macrophytic algae. Syringodium filiforme and Halodulewrightii were found to be the dominant rooted macrophytes, constituting an annualaverage of 76% and 9.9%, respectively, of the total sampled plant composition.Rooted macrophytes showed a sharp zonation as seen in other regions of the IndianRiver Lagoon, with Halodule dominating at depths of up to 0.4-0.8 m but then beingdisplaced by _ up to depths of 1.2 m.
Associated Database Reference numbers:5, 15, 36, 42, 54, 57, 62, 63, 72, 77, 88, 74, 86, 99, 112, 119.
GEOHYDROLOGY
The barrier island complex of the Mosquito Lagoon sub-basin displays a history ofdeposition and erosion through geologic time related to the periodic rise and fall ofsea level. Schmalzer and Hinkle (1990b), Toth (1987), Clark (1986), and Gardner(1990) provide reviews of the existing geohydrologic literature for the region. A
-- 13

I_I<ilOPEN WATER/UNVEGETATED
U SUBMERGED AQUATIC VEGETATION
_'_LAND MASSES
Figure 7. The Distribution of Submerged Aquatic Vegetation inMosquito Lagoon, Based on Groundtruthing and Interpretation of1983 and 1986 Imagery.
14

!
O
/
0
÷
//
//
//
//
15

5O
C.
4n
o50
2O
70
60 -
I0
5eagrass Coverage SGSMLS20
I m Cmlle,ne t
I _ $_,,,e ,IM/I _ i
IL _!! -__i]!_ IL_83 85 8l_
Species Yearly Averages
Seagrass Coverage SGSMLS21
_0 .................I _ "_'e_,_
I _ ueae50 I _ _e,.u,
I _ Iv,_'_.
40O*
0
_ 20
I0
H.... Jl__ IL_ LR t 88 89 gO85 86 87
Species Yearly Averages
9O
8O
7O
e 60
050
o
_ 40
_ 3O
2O
I0
Seagrass Coverage SGSMLS22
Dq,_lue
[1
" 13 IIIL .... , ___ ill ....
eJ 8,_ n6 e7 ee 8g
Species Yearly Averages
II9O
Figure 9. Temporal Variation in the Percent Coverage of
Seagrass Along Three Transects Located in Southern MosquitoLagoon.
16

summary of the geohydrologic setting is presented in Table 3 and Figure 10. Thereare three basic units of geohydrologic interest: the surficial aquifer, the regionalconfining unit, and the Floridan aquifer (McGurk et al. 1989). During the Eocene, theAvon Park limestone and the Qcala Group were deposited and are considered theoldest formations beneath Mosquito Lagoon. These formations contain the Floridanaquifer with a hydraulic transmissivity that ranges between 90,000 and 300,000gallons per day per square foot (3,785,400 and 12,618,000 liters per day per square
meter).
Water quality in the Floddan aquifer is variable depending on location. Beneath theMosquito Lagoon sub-basin the water is reported to be brackish (Clark 1987) withchloride concentrations ranging between 250 and 1000 mg/I (Toth 1987). Thesechloride concentrations are either a function of the saltwater/freshwater interface or
they represent relic seawater that was entrapped in the aquifer during the Pleistocene.The principal fresh water recharge area for the Floridan aquifer in this region isassociated with the karstic Crescent City and Deland ridges to the north and west ofthe lagoon (McGurk et al. 1989) in an area where the water table is higher than thepotentiometric surface. Recharge also occurs to a lesser degree as leakage throughthe interbedded surficial sediments in the Eastern Valley, Atlantic Coastal Ridge, orAtlantic Beach Ridge. Toth (1987) defines the Mosquito Lagoon sub-basin as an areaof active discharge from the Floddan Aquifer. Discharge may occur through springs,artesian wells, or leakage into overlying aquifers through confining beds.
The Hawthorn Formation was deposited during the Miocene and because of its lowpermeability it may act as a confining layer that retards upward movement from theartesian Floddan aquifer and downward movement or recharge from the overlyingsurficial aquifer. Beneath Mosquito Lagoon the Hawthorn sediments are estimated tobe approximately 50 to 100 ft thick (15.2 to 30.5 m) (McGurk et al. 1989) andapproximately 75 feet (22.9 m) below the surface at Ponce de Leon Inlet (Toth 1987).The hydraulic conductivity ranges between 0.001 and 0.03 ft (.0003 to .009 m) per day.Above the Hawthorn formation rests approximately 50 to 100 ft (15.2 to 30.5 m) ofinterbedded sand, shell and clay sediments including Pleistocene to Recent sand,Clayey sand, or Anastasia Formation coquina. Late Miocene and Pliocene sand, shelland clay layers are also incorporated into the area which is classified as the surficialaquifer (McGurk et al. 1989). Clark (1987) reports that fresh water is found only in thesurficial aquifer. Hydraulic conductivities average 11 ft (3.4 m) per day (73 gallons perday per square foot) and precipitation is the primary source of recharge. Only about0.5 % of the annual average rainfall reaches the groundwater reservoir.Approximately 87% of annual precipitation is lost through evapotransporation, 11% islost through seepage and canals and 1.5% is represented by overland runoff. Erwin(1988) reports different values with 67% being lost to evapotransporation, 19% torunoff and 14% to groundwater storage.
Surficial groundwater inputs to lagoon type estuaries may be substantial dependingon geomorphology and in the case of lagoonal systems with small watersheds, oftenrepresent the single largest input of water to the system (Lee and Qlsen 1985) outsideof direct precipitation. Figure 11 depicts the ground water flow pattern in the surficial
aquifer on north Merritt Island. This ground water can be of highly variable quality,depending on soils, and the type of development and industrialization that has
17

0
r,,
o0O_
O_
C_
o o_
_3 _- _ _0
0_3
Nu3"_ u
.oE _'_-6m_E
"ag
_-.ff)
r'_U."
_E3
_o __oo_-
¢..
0
r-
o..
.=
e,.
en
0
v¢-
_-_8
_C
o_
- c
ooO3 _ _
8 o
c
0
i
__Oul
m
¢-
•_ en
_ c
°°o
o
_.__,_o .>= ._,oS..
!-• _i_._
,o _," _
._ ._,
18

SURFICIAL
AQUIFER
DISCONTINUOUS
CONFINING
UNIT AND
SEMI-CONFINED
SAND AND SHELL
BEDS
ANASTASIA
FORMATION
CALOOSAHATCH EE
4"- MARL FORMATION
EQUIVALENT
SHALLOW ROCK
AQUIFER
HAWTHORN
LIMESTONE
AQUIFER
PRINCIPAL
CONFINING
UNIT
FLORIDAN
AQUIFER
TAMIAMI
FORMATION(?)
HAWTHORN
FORMATION
_--- OCALA LIMESTONE
(DOWN TO
- 1500 FT)
Figure 10. Diagrammatic Representation of GeohydrologicSetting Beneath Mosquito Lagoon (Schmalzer and Hinkle 1990band Clark 1987).
19

INDIAN RIVER
SLF
i.rl
//
/LC-39B
PRIMARYDUNE
ATLANTIC OCEAN
ELEVATION RELATIVE TO MEAN SEA LEVEL (FT.)
Figure 11. Diagrammatic Representation of GroundwaterRecharge and Flow through the Surficial Aquifer on North MerrittIsland (taken from Schmalzer and Hinkle 1990b after CTark 1987).
2O

occurred on the watershed. An example of water quality data for the surficial aquiferon north Merritt Island is presented in Table 4 (Clark 1987). No information on nutrientloading to Mosquito Lagoon through surficial groundwater was observed during theliterature review. Estimates in Lee and Olsen (1985) suggest that approximately 50-75% of the nitrogen entering the groundwater is derived from septic systems and lawnfertilizers. Zimmermann et al. (1985) reported a dissolved reactive phosphate flux of29-50 x 10-6 g/m2 per day resulting from groundwater flow to the nearshore sedimentsin the Indian River Lagoon near Ft Pierce.
Figure 12 depicts the surficial groundwater recharge areas for the Kennedy SpaceCenter. The central ridge running north-south through Merritt Island, the barrier islandto the east and the Atlantic Ridge to the west of Mosquito Lagoon represent theprimary area for recharge of the surficial aquifer. Rainfall on these areas percolatesrapidly through the sandy soils producing a head or pressure gradient that results inthe downward and latteral movement of relatively high quality waters in the surficialaquifer. Movement in the aquifer is primarily toward the low lying wetlands, mosquitoimpoundments and estuarine lagoons. Down gradient from the sandy ridge areas theground water recharge potential decreases as the relationship between the elevationand depth to the aquifer decreases (i.e., the aquifer is on average closer to thesurface) reducing the amount of head pressure that can be generated by infiltration.Further down slope in areas adjoining wetlands the recharge potential is furtherreduced and during periods of high rainfall the surficial aquifer may be higher than theland surface producing ponding. As shown in Figure 12 these three regions aredescribed as the Prime, Good, and Fair-poor recharge areas for the surficial aquifer.This relationship between the surficial aquifer and the overlying undulating ridgesystem of ancient sand dunes has resulted in the longitudinal pattern of scrub or slashpine flatwoods and wetland swale vegetation on Merritt Island.
The lagoon basin lies between the Atlantic Coastal Ridge which is 25 ft (7.6 m) abovemean sea level and the barrier island which ranges in height from sea level to 30 feet(9.1 m) above mean sea level (Gardner 1990). The Atlantic Coastal Ridge ischaracterized as a sandy ridge dominated by the Daytona-Satellite-Astatula soil series.This series consists of sandy, silicious, hyperthermic and uncoated families of soils withpredominantly marine origins. The barrier island is dominated by soils of the PalmBeach-Paola-Canaveral series. These soils are Carbonitic, hyperthermic families ofsoils dominated by marine sands and shell fragments (Schmalzer and Hinkle 1990b).The Cape CanaveraI-Merritt Island barrier island complex that forms the southernborder of Mosquito Lagoon is described as unique along the Florida coast; it is notassociated with rivers or former deltas as are capes on the coast of the Carolinas. Thegeologic history of the Cape and Merritt Island is complex and is not a simpleprogradational feature which developed in recent times. The older portion of MerrittIsland consists of beach deposits >240,000 years old. Estimates of the current beachage on Merritt Island suggest formation about 30,000 year ago, while mainland depositsdate back approximately 110,000 years.
Development of the barrier island forming the eastern boundary of Mosquito Lagoonand the present Cape Canaveral peninsula began approximately 7,000 years ago.Unlike the Cape, the history of the barrier beach is marked by erosion, overwash andlandward migration rather than progradation. Five tidal inlets once connected the
21

Table 4. Example of Water Quality Data Collected for the Surficial Aquifer on MerrittIsland North of Banana Creek (Clark Eng. and Sci. 1987).
SUSA(_IIFER:COA_TAL gARRIER \ UPPER ZOIIE
|NOROANLCS
ORINKING NEAN HINIHUH HAXIHUH NUHSER TOTAL
UATER AHglENT AMgI£Nr AHglENT SAHPLES NUHg_R OF
STNOS. CONC. CONC. CONC. 80L SAHPLES
Chlorides (S) 250 1856.00 21.00 10200.00 0 40
Heganese (S) 0.05 _0.09 _0.02 0.43 11 40
Nttrste (P) 10. <0.01 <0.01 O.O8 ]& 40
Sodium (_) 160 1059.00 9.00 4200.00 0 40
Sutfete (S) _50 ¢61.00 _10 2300.00 T 40
TOS (S) 250 4426 150 19000 O 40
pH (S) 6.5 7.50 S.70 0.S0 0 40
ALkalinity &16 S 940 0 40
TRACE
HETALS
Arsenic (P) 0.05 _0.08 <0.05 0.16 36 40
garlum (P) 1. ,0.03 <0.10 _1.0 40 4D
Cec_lum (P) 0.01 _0.013 ,0.005 0.03 36 ¢0
Chr_mtum (P) 0.05 ,0.037 (0.02 <0.05 40 40
Copper (S) 1. _0.06 <0.02 0.80 38 40
Iron (S] 0.30 4.38 <0.03 23.00 38 40
Leed (P) 0.05 _0.06 <0.05 0.11 30 40
mercury (P) 0.002 <0.002 ,0.002 <0.002 40 ¢O
Selenium (P) 0.01 0.08 <0.01 03] 25 40
Sliver (P) 0.05 <0.03 <0.01 _0.05 40 40
Zinc (S) 5. _0.07 _0.02 O.TO 16 40
Gro_s Atphe (pet/t) (P] 15 19.60 <0.20 67.S0 0 28
Fecal CoLiform (n/.1[) (P) 1 <10 <I0 <10 28 28
* ALL CONCENTRATIONS EXPRESSED IN n_J/[ UNLESS OTIIERg[SE SPECIFIED.
22

\
°
"USmA COUNTY _
0R|VAR0 COUNI'Y .
TITUSVILLE
ISLANO
MOSQUITOLAGOON
(
%
tRlO|Nf
Figure 12. Locations of Surficial Aquifer Recharge Zones on theKennedy Space Center and Related Areas of Mosquito Lagoon(taken from Schmalzer and Hinkle 1990b after Clark 1987).
23

Mosquito Lagoon with the Atlantic Ocean (Mehta and Brooks 1973). These previousinlets were located at the mangrove island clusters found between Max Hoeck Creekand Turtle Mound. The inlets appear to be older in age as you progress southward. Thelast invasion of new quartz sand to the lagoon occurred about 1500 years ago and sothe youngest inlet was at Turtle Mound and dates to approximately 500 A.D. Thegeological strata for these old inlet areas contain oysters indicating that the area wasopen to tidal flushing. Mosquito Lagoon was not connected to the Indian River until theconstruction of Haulover canal in 1854 (Snelson 1983).
Associated Database Reference numbers: 52, 87, 141,142.
HYDROLOGY AND WATER QUALITY
Water quality measurements at any given moment are a function of numerousinteracting influencing variables of which two categories, geophysical andmeteorological, are dominating (Lasater 1975). Of major importance in MosquitoLagoon are distance from inlets, watershed characteristics, groundwater interactions,wind speed and direction, rainfall, temperature, and solar radiation. Superimposedover these are a number of biogeochemical processes that influence water chemistry.These include photosynthesis, respiration, decomposition, nutrient fluxes, and mineraldissolution.
Examination of existing water quality datasets for Mosquito Lagoon revealed severalproblems that make interpretation and trend analysis difficult. The most significantproblem is the lack of a long term consistent dataset (>10 yrs) with which to work.Recent implementation of a long term program under Surface Water Improvement andManagement (SWIM) should rectify this problem in the future. Flint (1985) describesthe importance of long term chemical and biological data in the development ofestuarine models that descdbe fluctuations in biological communities. His results forCorpus Christi Bay, Texas suggest that in some estuaries episodic events, such asflooding with fresh water, are the primary stimulators of estuarine production over longperiods. Nutrient recycling from the benthos is the major source of nutrientssupporting primary production. This recycling process is however somewhatinefficient with some materials being lost from the system by burial and biologicalexport (migration and harvest). Episodic events such as hurricanes or major stormsreplace and redistribute the nutrients lost from the system sustaining long termproductivity.
Mendonca (1983) reported the average depth of Mosquito Lagoon to be 1.5 m. Basedon these data, the lagoon volume is estimated at approximately 2.3 x 10⁸ m3 of water.The primary freshwater source for the system is direct rainfall which averages 48inches (122 cm) per year. On a yearly basis this represents a direct input volume ofapproximately 1.8 x 10⁸ m3 of water or about 78% of the total lagoon volume. Rainfallon the watershed equals approximately 1.6 x10⁸ m3 per year or 70% of the volume ofthe lagoon. Based on estimates from Clark (1987) and Erwin (1988) about 15% of therainfall on uplands runs off to the lagoon representing 18.3 cm and a volume of 2.4 x10⁷ m3 or 10% of the lagoon volume. Evapotranspiration for the region is estimated tobe about 94 cm or 77% of total rainfall for the year (Mailander 1990). This produces a
24

surplus rainfall on the watershed of 28 cm. This remaining rainfall on the watershedhas the opportunity to percolate to groundwater storage. Clark (1987) presentshydrographs (Figure 13) that display the rapid response of the water table toprecipitation.
Tidal flow of sea water through Ponce de Leon Inlet is believed to have minimalinfluence on water quality in most of Mosquito Lagoon. At the inlet, mean tidal range isestimated at 2.3 ft (0.7 m) with the degree of tidal flushing diminishing rapidly to thenorth and south of the inlet. Hand et al. (1986) indicate that tidal influences extend 10miles (16 km) from the inlet; however, Jones and Mehta (1978) report that the tidaleffects are a function of several factors and generally range between 1.6 (2.6 km) and6 miles (9.7 km). In a study of shellfish beds in the Canaveral National Seashore, tidalfluctuations ranged from a high of 6 inches (15 cm) at the north end of the study site toa low of 2 inches (5 cm) at the south end of the study site (Grizzle 1990).
Erwin (1988) conducted a comprehensive estuarine water quality assessment as partof the Volusia County Coastal Management Element. The Mosquito Lagoon surfacedrainage basin extends from Ponce de Leon Inlet in the north to the southernmostextent of the lagoon in an area of impounded high marsh designated as Max HoeckBack Creek. Potential pollution sources in the Mosquito Lagoon basin include pointand non-point sources and data are summarized by Erwin (1988). Two point sourcesewage discharges with a maximum flow of 5.0 MGD (18.9 MLD) are permitted by theFDER in the Mosquito Lagoon Basin. An additional 7.5 sources with a maximum flowof 33.2 MGD (125.6 MLD) are permitted for the area north of Ponce de Leon inlet.Currently discharges from these sewage treatment plants average about 50 to 75 % ofpermitted levels. Estimates of non-point source discharges to the Mosquito Lagoonbasin in the Volusia County area are summarized in Table 5.
The single largest unquantified source of non-point pollution is septic tank systemswithin the basin. It is estimated that approximately 22,000 septic systems are in use inthe Volusia County coastal zone with an additional 3,000 projected through the year2005. The largest concentrations of septic systems are to the north of MosquitoLagoon in the more highly developed areas, but a concentration does exist southwestof the New Smyrna Airport (Erwin 1988).
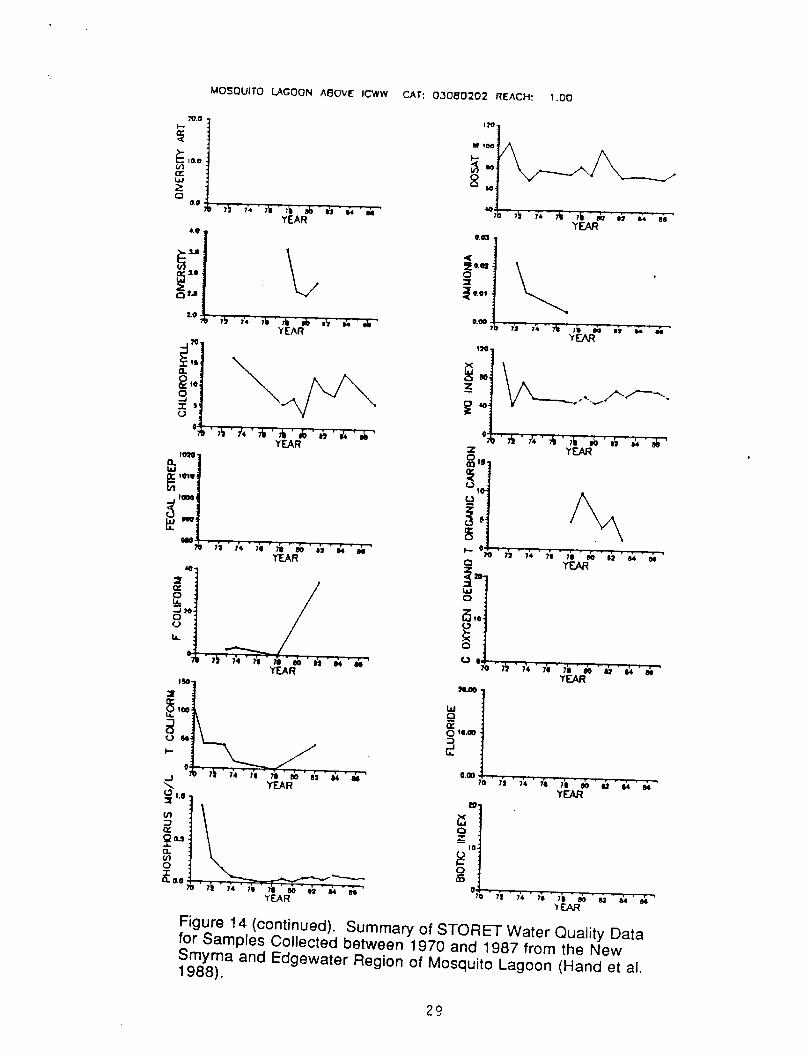
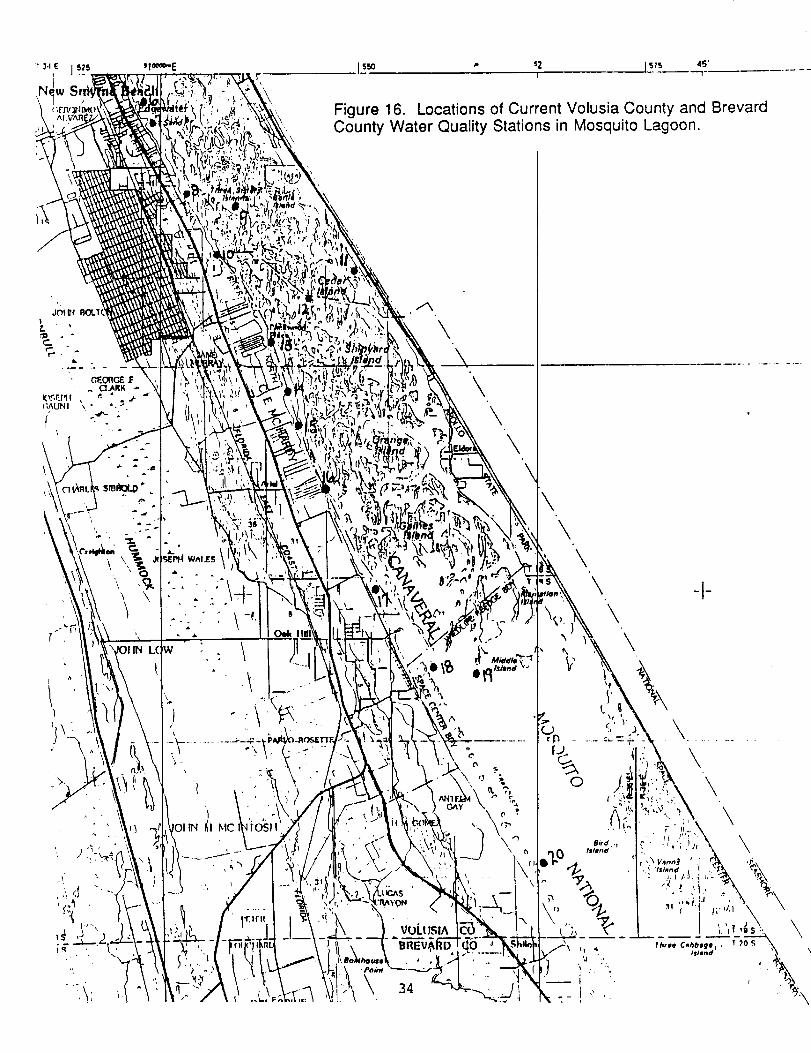
Water quality in Mosquito Lagoon has recently been classified as fair to good basedon data available from the EPA STORET database between 1970 and 1987 using aTrophic State Index that includes chlorophyll, secchi depth, nitrogen and phosphorusconcentrations (Hand et al. 1988). Annual median values for parameters from thedataset are presented graphically in Figure 14. Water quality monitoring data forMosquito Lagoon are reported for numerous stations with highly variable lengths ofrecord. Examples from the STORET database are presented in Table 6. Locations ofhistoric water quality sampling stations are shown in Figures 15. In response to theSWIM program staff members of the St. Johns River Water Management District,Volusia County, and Brevard County implemented a lagoon wide water qualitymonitoring program to rectify the problems observed in the datasets. The newsampling program was initiated in October 1988 and locations of the current stations
are shown in Figure 16. Results for 20 stations collected in Volusia County arepresented in Table 7.
25

HYOROCRAF'-HS OF" SURFICIAL AQUIFER
SAM PLrI',tG,/"T [ ST WELLS.
10.5.
9.0
7.5
6.0
,_, 4.5.
3.0
0.0
-I.5
-- IrlA1
- SRLF2
• RRLF 1
/ \
^j _ a ',s "x , _ . , , a .'*' J _t • #
! 1 I ' ", ie
't
o 7. 0 900TIME (OAYS SINCE JUNE 1. 1984)
MONTHLY RAINFALL (CIF)
J J A $ ONDJ F MA MJ J A S ONDJ F MA MJ J A S OND
UUU[ COEAEAPAUUUECOEAEAPAUUUECOENLGPT VCNBRRYNLGPI VCNBRRYNLGPT VC
1984 1985 1986
MONTH \ YEARIlzli tl, ll'l_l_, II, I1,_1'11¢'1
Figure 13. Hydrograph of Surficial Aquifer Levels Showing theResponse to Monthly Rainfall Levels (Clark 1987).
26

(-
(-
V)(I)
-__.0
(IIC.)a)(t}
"o(._
_.J
(-
°_
aX
0_
E
•._ e-
0_w
°_
•,- (/_
0(1) 0
la....I
0 0..._,
_ m0
rr'
°_ ,,_"0 .,...
UJ
<<_W C-Jn-_
0
0
_J0
OZl--W
n
CO
<000
0 0
1_- 8 _--
°--
_ 0
,_ C") O0 0 0 0 0
CO CO
'_" I".,. (0 O0 '_" '_" 0
0 I_ ,,-
CO _1
0 CO _ LO CO 0,1
o
27

MOSQUITO LAGOON ABOVE ICWW CAT: 03080202 REACH: "I.OO
"/o" _b * i4io* lb _*s':t &'_YE,S,R
N.
u
o
I.s
_ f.O.:cu
o.o
44).0 ¸
_ 31Lll
(kO
°_
" ;_*t** ;'=* _bd)*h A*AYEAR
p" 7_' 7',"7'1' 7b"_ * _ * _, "_ 'YE.AR
YEAR
w,3o,r,,,'
Q.
19
' _ • _ - ;_ * _ * m • _ • _ * A •YEAR
p'7_';'*'io'Tb*_*l'='_'ob"YEAR
L_
'l.O
W
0 ate
0.O
if)
.-J_o
el
o_,.o
ILO
2;.0
J
/
YEAR
YEN_
i'_'_'_'_'_k'_'o_'_*_'YEAR
,,o,oI A
,_,l /N J\ /%
tO
U ¸
Y_
7 7_ 74 7g 7_ 80 8.2 84. 84
YEAR
2_
_I.0
YEAR
io, o
u
2,0
Figure 14. Summary of STORET Water Quality Data for SamplesCollected between 1970 and 1987 from the New Smyrna and
Edgewater Region of Mosquito Lagoon (Hand et al. 1988).
28
MOSOUITO LAGOON ABOVE ICWW CAT: 03080202 REACH" 1.00
YEAR
YEAR
-]
YEAR
=='_1_'°"l
YEAR
7_
YEAR
t.) 14
0-I
_J'I'_R
(,3 1.0
o
_:o.o _., ",'4 .............
'1'reAR
40
"=l_ e.(ll
Y_
0i[_= YEAR
!:[ .YEAR
i!!0YEAR
caoc
0,_ ,_
'rEAR
Figure 14 (continued). Summary of STORET Water Quality Datafor Samples Collected between 1970 and 1987 from the NewSmyrna and Edgewater Region of Mosquito Lagoon (Hand et al.1988).
29

Table 6. Examples of Mosquito Lagoon Water Quality Data Available from STORETfor Select Parameters.
Haulover Canal at SR3 Bridge, Station # 27010463 (Figure 15, #2)
Latitude/Long: 28o 44" 10.4 / 80o 45" 17.5NQmber
Color (PT-CO Units)Salinity (PPT)TKN (rag/L)NO2 & NO3 N-Total (rag/L)
Phos-Tot (mg/L P)Chloro A (rag/L)Phos-Dis Ortho (mg/L P)
Mean Beg, Date En_ Date7 20 1/29/74 7/20/876 28.5 12/7/83 7/20/878 1.34 10/9/73 7/20/871 .05 4/14/87 4/14/87
8 .06 10/9/73 7/20/871 .01 10/9/73 10/9/731 .01 10/9/73 10/9/73
Indian River at ICWW CM 4, Station # 27010461 (Figure 15, #0)
Latitude/Long: 280 53" 07.0 / 80o 50" 40.0Number
Color 7
Salinity 6TKN 8
NO2 & NO3 N-Total 1Phos-Tot 8Chloro A 1Phos-Dis Ortho 1
Mean Beg. Date End Date19 10/29/74 7/20/8729.9 12/7/83 7/20/87
.92 10/9/73 7/20/87
.04 1/5/87 1/5/87
.09 10/9/73 7/20/87
.01 10/9/73 10/9/73
.02 10/9/73 10/9/73
Indian River at ICWW CM 21, Station # 27010467 (Figure 15, #5)Latitude/Long: 28o 49" 08.0 / 80o 47" 59.0
Nvml2er MeanColor 6 19
Salinity 6 30.0TKN 6 1.37
NO2 & NO3 N-Total 6 .02Phos-Tot 6 .09
Chloro A (UG/L corrected) 5 9.29
Beg. Dete12/7/8312/7/8312/7/8312/7/83
12/7/8312/7/83
End Date7/20/877/20/877/20/877/20/87
7/20/877/20/87
3O

Table 6. (continued)
Indian River at ICWW CM 50 Near Edgewater, Station # 27010466 (Figure 15, #18)Latitude/Long: 28o 59" 38.0 / 800 54" 12.0
Number Mean Beg. Date End DateColor 6 19 12/7/83 7/20/87Salinity 6 31.9 12/7/83 7/20/87TKN 6 .85 12/7/83 7/20t87NO2 & NO3 N-Total 1 .01 12/7/83 7/20/87
Phos-Tot 6 .10 12/7/83 7/20/87Chloro A (UG/L corrected) 5 8.20 12/7/83 7/20/87
Indian River at ICW CM 45, Station # 27010451
Latitude/Long: 29o 00" 51.0 / 80o 54" 47.7
Number Mean Beg. Date End DateColor 8 22 6/2/70 7/20/87Salinity 6 31.1 12/7/83 7/20/87TKN 6 .71 12/7/83 7/20/87NO2 & NO3 N-Total 1 .02 12/7/83 7/20/87Phos-Tot 6 .10 12/7/83 7/20/87Chloro A (UG/L corrected) 5 8.36 12/7/83 7/20/87Phos-Tot Ortho 1 .05 12/13/72 12/1 3/72
31

Figure 15. Location of Historic Water Quality Sampling Stations inMosquito Lagoon Based on Latitude and Longitude Data from theEnvironmental Protection Agency STORET Database (1970-1987).
SIIBH_.D
\\
\

\
\
\
\
, 4 <I
Figure 16. Locations of Current Volusia County and Brevard
County Water Quality Stations in Mosquito Lagoon.
\\
%r_
%
%
34 :
\\
\\
, \V


CO
0
EE0 c-
e_111
_8o.
_e-sO.
o')
i
__z
i
_z
,<6
e-13..
e--
0
e-
o_
.... o ............ ° o .
36

Sleister (1989) reported on a sediment chemistry study designed to evaluate theimpacts of stormwater discharge on total metal concentrations in Mosquito Lagoon.Results are presented in Figures 17 to 19. Elevated concentrations of lead, copper,and zinc were found in the vicinity of New Smyrna Beach and zinc was elevated nearEdgewater.
Temperature fluctuations in Mosquito Lagoon display two distinct periodicities. On adaily basis water temperatures at a given location fluctuate in direct response to solarradiation, contact with the atmosphere as it warms and cools and the degree ofinternal mixing. Results of hourly temperature monitoring during a three week periodin November 1988 are shown in Figure 20 for sites in the Indian River, Banana Riverand Mosquito Lagoon. The external controlling factor of meteorology produces similarresponses in all surface waters in this region. During fall, daily temperatures graduallydecline in response to decreasing solar radiation and cooling air temperatures. Meanmonthly maximum air temperatures in summer (June, July, and August) is 32°C. Mean
monthly air temperature in winter (December, January, and February) is 21°C.
Differences in water temperatures between day and night average about 3°C (Figure
20) compared to daily average air temperature fluctuations of 7°C.
The passage of periodic weak cold fronts during late fall produces steep declines inwater temperatures (Figure 20). During winter, the passage of more intense coldfronts dominate the variability observed in surface water temperatures. This is showngraphically in Figure 21 which presents water temperatures for the same time periodduring two different years. Strong north winds (rapid mixing) and declining airtemperatures during December of 1989 combined to reduce water temperature to nearthe freezing point (3 to 4°C) in a matter of hours. This rapid decline put stress on thewarm temperate and subtropical biotic systems leading to fish kills and extensivevegetation damage around Mosquito Lagoon and KSC. As shown in Figure 21,between year variability for a given time period can be large. On December 25, 1988water temperatures were 15°C warmer than in 1989.
During spring, water temperatures gradually rise to the mid 20s and low 30s wherethey typically remain throughout summer. Daily fluctuations in water temperaturesduring this period average about 3°C. Hourly temperatures for a four week period inlate May and early June are shown in Figure 22.
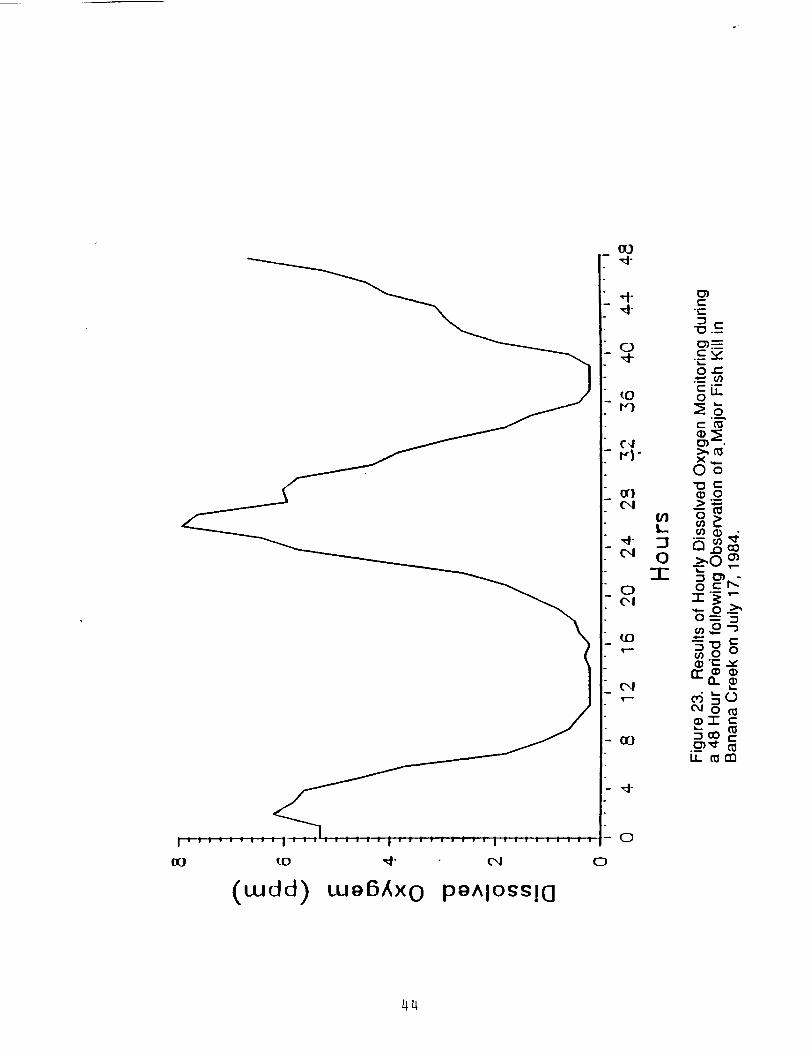
During summer, shallow confined areas may become extremely hot, with temperaturesexceeding 34°C. This is most common in shallow areas of impoundments and alongthe shoreline of the lagoons shoreward of the grass flats during summer periods of lowwater. High temperatures in association with large amounts of decaying organicmatter Biological Oxygen Demand (BOD) often result in a decline in dissolved oxygenwhich, in turn, can produce a summer fish kill. These conditions have been observed
in Banana Creek near the State Road 3 bridge and along shallow shorelines of theBanana River segment including the Hangar AF area. Figure 23 shows hourlydissolved oxygen levels recorded during a two day period following a fish kill inBanana Creek on July 17, 1984. Minimum concentrations (0.02 mg/I) occurred duringthe morning hours when system respiration (oxygen consumption) exceeded primaryproduction (oxygen production). Relatively high dissolved oxygen concentrations(7.80 mg/I) were produced during afternoon hours only to be reduced to lethal levels
37

i
!i,
.i
u
,io.
v
Z
(/J
-O.C:C:_
_u_
ocoE
38

39

cz_QI0
Z
40

I0
L_3.

qx)(.X)
q,o.
°
"o
°°
"°',° o
o"
°°
i i--I i
_1 (.-J C) (()(_1 _1 ('l "--
I I
,fj -j
(o)
(:)
(.L)
('I
(.;I.tJ
if)(',1
(;tJJCi
¢-!
cl14J
r,}
c iIiJ
.E
• t:: (:I:)OEI
(:: __
(1)Q.'I3
E_-
:3 T-
-r.QoE
(l) Erl" -_
"O
,-- ._Qe_l L_
LEQ
q2

t3_O0
•_. I_0 _U
0
_'5
_o
a_.__
"T'- C7'__
'*-- r_ rn
•,,-, 0 (:::
c:x:,,,,_
.__ c:1,_- I-- CI)
I I Ii i iil i _ii i i i iii i i i i i i i i i i
oO to _- c4 0
(wdd) uJ96Ax 0 pgAIO_S!O
00
4-
0
I0i_--)
(',41I,_)"
C4
C4
0C'I
I.C)
C4
O0
0
ltl
J0
7-
T-'m"O.--
C',_"o _-
t0_LT.o
oc _
X,..
Ooco
>-_-- co
7-"_ ,,-_-0__0-- _
_E8(D"_"-_
(I)0:__oL
_o_
.__ coii _en
44

(< 1.0 mg/I) during night and early morning by the high B©D. Over time (3 to 5 days)the BOD may be satisfied and the system returns to a more stable set point.
In general, dissolved oxygen concentrations observed during routine water qualitymonitoring are sufficiently elevated to sustain the biotic communities. Values typicallyrange between 5.5 and 8.5 mg/I. Samples collected in the vicinity of dense SAV onoccasion display supersaturation with values above 13 mg/I being observed as aresult of high primary production occurring in these areas. Transient low dissolvedoxygen levels (< 2.0 mg/I) and anaerobic conditions have been observed in isolatedareas of impoundments, roadside ditches, and swales. In every case these conditionsappeared to be the result of high BOD resulting from the decay of detritus andvegetation.
Results of monthly water level and salinity measurements for Mosquito Lagoon,Banana Creek, and Banana River are shown in Figure 24 and 25. Water levels in thelagoon system display a very distinct pattern when measured on a monthly basis withpeaks in late fall and minimums in summer. This pattern corresponds to the annualrise and fall in sea level with all three lagoons averaging approximately 6-7 in (15-18cm) above mean sea level. Not apparent in these data are the short term wind-drivenfluctuations that may occur over a period of days. Smith (1990) describes the resultsof field and modeling studies of non-tidal circulation for the Indian River Lagoon. Winddriven set-up of waters in the south end of Mosquito Lagoon occurs when winds blowfrom a northly direction. This wind correspondingly sets-down waters in the north endof the Indian River producing a water-level difference between the two systems thatresults in significant non-tidal exchange through Haulover Canal. This pattern isreversed when winds blow from the south-southwest. Wind driven set-up of watersalso produces a significant bottom layer flow pattern upwind as a result of barotrophicpressure gradients. This near-bottom flow can be especially large in the deepchannels and Intercoastal Waterway (ICWW).
Mosquito Lagoon is typically more saline than other reaches of the Indian River
Lagoon System and hyper-saline (> 35 ppt) conditions are not uncommon during dryspring and early summer months when evapotranspiration exceeds rainfall. Salinityhas averaged about 32 ppt during the last six years and there appears to be anincreasing trend in the data for both Mosquito Lagoon and the Banana River. Thisincrease may be directly related to low rainfall during 1988-1990. Salinities in BananaCreek are much more variable than the open lagoon ranging from a low of 1 ppt to ahigh of 34 ppt. A comparison of water level and salinity data from two mosquitoimpoundments (T-24-D and T-27-C) are presented in Figures 26 and 27.
Impoundment T-27-C is located north of Launch Pad 39B at the south end of MosquitoLagoon and is considered a brackish marsh system. Water levels and salinities
fluctuate widely with maximum salinities (> 40 ppt) occurring during periods of extremelow water levels which are controlled by rainfall and evapotranspiration.Impoundment T-24-D is a fresh water marsh system located on the western side of
Merritt Island. Water levels in the fresh water systems are typically higher than thebrackish systems and salinities rarely exceed 10 ppt.
Results of chemical analyses are summarized in Tables 8 and 9 for Mosquito Lagoonand Max Hoeck Back Creek. Several parameters, including phenols, silver, iron and
45

|
_6

,¢- C)ro oo,I 0 0
O,_d) '{_!u!loS
_47

oUI
4 I-,
n ,[ II-
J
J
/
i,,,,,i iiii,ii*ii,,,l**,,,****l,*,*,,,,,
_ _ 0I
(It) IgAel JelDM
n_
oU" (])
"- >,g=oNe-
I:}'. 0 ,__
O_
(De'-
(J) .E
=.__7
a) _ ._____
n. _=o"_" I_
48

0
(tdd) /,tlUlla S
49

Table 8. Summary of Water Quality Monitoring Data for South Mosquito Lagoonbetween 1985 and 1990.
Parameter Average Minimum Maximum
Conductivity (l_mhos/cm) 45200 25200 62200
Total Suspended Solids (mg/I) 68 9 655
Turbidity ntu 5.5 2.0 20.0
Oil and Grease (mg/I) 0.4 <0.2 4.3
Phenols (_g/I) 178 <5 678
Alkalinity (mg/I) 145 84 349
pH 8.4 7.5 8.8
Total Kjeldahl Nitrogen (mg/I) 1.41 0.39 3.25
Nitrate Nitrogen (mg/I) 0.03 <0.02 0.06
Ortho Phosphate (mg/I) 0.029 <0.025 0.100
Chlorophyll A (mg/m 3) 5.1 <0.5 64.7
Biological Oxygen Demand (mg/I) 3.5 <1.0 17.0
Chemical Oxygen Demand (mg/I) 656 225 1732
Dissolved Oxygen (mg/I) 5.7 2.0 10.4
Total Organic Carbons (mg/I) 4.42 0.98 28.1
Aluminum (mg/I) 0.26 <0.10 0.50
Cadmium (_g/I) 0.70 <0.10 2.95
Chromium (mg/I) 0.004 <0.001 0.008
Iron (mg/I) 0.190 <0.040 0.386
Zinc (mg/l) 0.02 <0.01 0.08
Silver (_oJI) 5.86 <0,05 44,00
_- 50

Table 9. Summary of Water Quality Monitoring Data for Max Hoeck Back Creek(Mosquito Impoundment) between 1985 and 1990.
P_,rameter Average Minimum Maximvm
Conductivity (l_mhos/cm) 29500 12000 75000
Total Suspended Solids (mg/I) 63.8 <1.0 385
Turbidity NTU 11.6 0.6 35.5
Oil and Grease (rag/I) 0.60 <0.20 6.29
Phenols (_g/I) 110 <5 343
Alkalinity (rag/I) 180 48 412
pH 8.6 7.2 10.0
Total Kjeldahl Nitrogen (rag/l) 5.05 0.69 13.50
Nitrate Nitrogen (mg/I) 0.05 <0.02 0.10
Ortho Phosphate (mg/I) 0.090 <0.025 1.400
Chlorophyll A (mg/m3) 9.5 <0.5 82.8
Biological Oxygen Demand (mg/I) 5.5 2.0 18.0
Chemical Oxygen Demand (mg/I) 725 172 1680
Dissolved Oxygen (mg/I) 7.3 0.0 13.2
Total Organic Carbons (mg/I) 13.3 2.6 39.4
Aluminum (mg/I) 0.95 <0.10 5,10
Cadmium (pg/I) 0.15 <0.01 3.00
Chromium (mg/I) 0.0045 <0.001 0.012
Iron (mg/I) 0.70 <0.04 3.65
Zinc (mg/I) 0.04 <0.01 0,12
Silver!ug/l) 14,04 .<0,05 30.00
51

aluminum are consistently found at levels exceeding criteria of the Florida Departmentof Environmental Regulation surface water quality classifications (see Appendix E).The general phenol criteria represents a complex rule (Florida Administrative Code17-3) that is designed to limit the levels of primarily man-made chlorinated phenoliccompounds in state waters. The criteria is set at 1.0 ug/I and phenolic compoundsother than those produced by the natural decay of plant material shall not taint theflesh of edible fish or shellfish or produce objectionable taste or odor in the drinkingwater supply. It is believed that the high levels of phenols observed in surface watersin this region are common decomposition products or humic materials derived fromnatural vegetation of the region.
High levels of total silver, in excess of the 0.05 ug/I criteria, have been observed inevery body of water sampled at KSC. Average levels are generally two orders ofmagnitude above the criteria and no apparent source has been identified. Sea watercommonly contains 0.3 ug/I in the open oceans. The levels reported appear to beindicative of background concentrations for the area based on their widespreaddistribution through isolated water bodies. The presence of high levels of humicmaterial suggests that there may be some relationship between elevated silver andphenols through metal binding with high molecular weight organic fractions. Moreinformation on this possible problem needs to be gathered before a determination ofthe validity and significance of these results can be made.
A second metal that is frequently found at concentrations above the state criteria of 0.3mg/I is iron. As with silver the wide spread distribution of iron suggests that baselinelevels in waters of the region may be elevated above expected. Results of sedimentchemistry indicate iron is commonly present in the 500 to 1000 mg/kg range. Iron isknown to form floculants in estuarine and marine environments and, as with othermetals, there is a complex relationship between iron, pH, redox potential, and organicmatter.
Maximum values recorded for aluminum in Max Hoeck Back Creek, Banana Creek,and Banana River were above the 1.5 mg/I criteria and these levels may be related tothe amount of humic material present in the water column. Examination of the averagedata values for the other metals indicated no exceedances of any state criteria.
Results of nutrient analyses (nitrates, ammonia, and ortho-phosphate) revealed lowvalues with few exceptions. The abundance of dense beds of SAV and the associatedattached microalgae serve to control dissolved nutrients in the absence of a majorman made source. Chlorophyll levels, an indicator of phytoplankton production, arealso generally low suggesting that in most cases the majority of primary productionoccurring in the southern part of Mosquito Lagoon is associated with the SAV andattached microalgae. The partitioning of nutrients between seagrasses, macro-algaeand phytoplankton is a complex issue and no quantitative information on the subjectwas found for Mosquito Lagoon. Lasater (1976) states that in spring and earlysummer the red macroalgae (HH_H_H__cervicornis) enters a rapid growth phase whenwater temperatures exceed 29°C. The consumption of dissolved nutrients can be sogreat that populations of phytoplankton are reduced producing a period of extremewater clarity. Lee and Olson (1985) report that in some lagoon systems nutrientenrichment results in growth of macroalgae instead of phytoplankton.
52
A second factor that controls the level of nutrients measured in the water column at any
given time is the rate and efficiency of benthic nutrient regeneration (Nowicki andNixon 1985). Benthic-pelagic coupling is extremely important because the volume ofwater overlying a given area of bottom in lagoonal systems is relatively small and theinfluence of benthic processes may be correspondingly large when compared tomarine environments. Flint et al. (1985) indicated that 90% of the dissolved nitrogen
needed for primary production in Corpus Christi Bay estuary was derived from benthicregeneration. In coastal areas beyond the barrier island this value dropped to 33% inwater 15 m deep. No information on the benthic regeneration of nutrients in MosquitoLagoon was found through the literature search.
Associated Database Reference numbers: 1,3, 4, 7, 8, 9, 11,12, 17, 36, 37, 39, 43,
58, 59, 61,73, 83, 84, 88, 93, 94, 95, 96, 97, 105, 106, 107, 108, 111,113, 116.
FISHES:
The entire Indian River Lagoon system (IRL) is known to be a major contributor to theFlorida fishing industry. Landings data reviewed by Durako et al. (1988) showed thatMosquito Lagoon and the upper Indian River complex are the most productive areasfor the northeast Flodda coast region. The restricted circulation and often hypersalineconditions of Mosquito Lagoon lead to a reference to it as a "miniature oceanenvironment" whereby some fish species remain in the lagoon rather than migrateoffshore to complete their life cycles. A list of fish species that may be encountered inMosquito Lagoon is presented in Appendix F.
Concern for the potential decline of certain fish species inspired investigations as earlyas the 1890's (Brice 1897; Tabb 1960). Evermann and Bean (1897) and Wilcox(1897) provided an excellent review of the fish and fisheries in the Indian RiverLagoon but with few references to Mosquito Lagoon (also known as the HillsboroRiver). When the Florida East Coast Railroad came to Titusville in 1885, the townbecame an important supplier of fish to northern cities in and outside of Florida.Titusville had the largest fishery along the lagoon in 1890. Wilcox (1897) provided nodescription of main fishing grounds for Titusville landings but one would assume thatsome level of activity was taking place in Mosquito Lagoon.
Gilmore (in press) reviewed anecdotal information regarding Mosquito Lagoon, "Watersabound in fish.., and mullet are remarkably abundant". Fishing in the 1870's waspredominantly for family use. Mosquito Lagoon catches for export in 1879 consisted of"150 green turtles, 300-400 mullet roes and a few barrels of salt mullet". Unfortunately,very little information is available for the region between the mid 1890's and the 1950's.
Tabb (1960) reviewed the spotted seatrout fishery of the Indian River area in the early1950's but gave little mention of Mosquito Lagoon. However, he did warn that fisherydeclines would be inevitable as increases in human population would lead todevelopment of marginal shallows of the lagoon bringing with it pollution, bottomalteration, increased freshwater drainage and inlet construction. Anderson andGehringer (1965) also mentioned concern for the ongoing alteration of the lagoons with
53

dredging and filling operations. They described the Cape Canaveral waters (includingMosquito Lagoon) as being some of the most productive in Florida with much of thebottom covered with vegetation that provided ideal habitat for a variety of fish. Theircensus provided a good synopsis of various fisheries in the Canaveral area withdetailed statistics for many species but without specific locality data. They reviewedcatches and estimated sport fishery efforts for the northem and then southern section ofthe Canaveral area. The northern section extended from Ponce de Leon Inlet south
through Mosquito Lagoon to Indian River just north of the Titusville bridge. They foundthat about 30% of the fishermen in the north end were involved in bank fishing and alittle less than 30% were fishing from boats. Fish catch per unit effort was 0.92 ascompared to 1.17 in the southern section (Titusville south to Melbourne). About 40% ofthe boat fishing took place in the winter season and 20 to 30% in the spring.Recreational fisheries catches for spring, summer and fall of 1963 in the northern areatotaled 978,787 pounds of fish. Table 10 presents biomass estimates for speciescaught in the region including Mosquito Lagoon. A creel census has recently beensponsored by the Merdtt Island National Wildlife Refuge for the region but to date is notpublished.
Anderson and Gehringer (1965) mentioned changes in the region as a response tothe missle industry being developed at Cape Canaveral. Commercial fishermen wereswitching to higher paying jobs related to the space industry and the developmentpressures were on the dse inspired by additional people moving to the area to work atthe missle center.
Gilmore (in press) describes 1950-1970 as the most serious period in the history of theIndian River Lagoon in terms of negative influences by man with dramatic increases inagricultural and urban land use. The high marshes along the southern end ofMosquito Lagoon were accessible to fishes until the 1950's. Over 92% of themangrove and saltmarsh habitats along the Indian River were impounded for mosquitocontrol, greatly impacting spot, channel bass and striped mullet in the northern portionof the system. Channalization, ditching, filling, pesticide and herbicide applications
were common occurrences during what Gilmore aptly labels this period of "greatenvironmental insult' when there was "virtually no concern for water quality".
The central and south end of the Mosquito Lagoon was studied from an ecologicalstand point beginning in the early 1970's (Mulligan and Snelson 1983, Schooley1977, Snelson 1980,1983, Snelson and Bradley 1978, and Snelson et al. 1988).Some of the work that has been done is encouraging as it was specifically intended toprovide a baseline, and tracking the condition of populations over the long term was agoal. The baseline provides an inventory of species typically encountered in the pastand information as to what habitats within the lagoon are important to certain species(Schooley 1977, Snelson 1980). Some species require the direct use of severalhabitats in the lagoon during the various phases of their life cycles (Gilmore et al.1983), thus demanding that proper connections between the habitats and the health ofthe indivdual habitats remain intact.
Snelson (1983) provided the first systematic ichthyofaunal survey in the northernsection of the Indian River Lagoon through collections made between 1972 and 1980.Collections included numerous stations in Mosquito Lagoon. Sampling occurred
54

Table 10. Top Five Species Captured by Various Recreational Fishing Methodsduring Spring, Summer, and Fall 1963 between Ponce de Leon Inlet and Titusville.Species are Listed in order of Biomass (Total Weight in Pounds)
Boat Bank Bridge
Sea trout (427,788)Sheepshead (34,273)Red drum (32,597)Black drum (20,758)Pinfish (16,094)
Sea trout (59,079)Puffers (42,261)Bluefish (25,605)Catfish (14,724)Black drum (10,515)
Bluefish (45,072)Sheepshead (20,240)Pinfish (15,840)Catfish (12,808)Spot (8,264)
The nine species above are combined by category below and amount to 785,918 Ibs.Sea trout accounted for a very large percentage of the biomass taken that year.
Sea trout 486,867 Sheepshead 54,513Red drum 32,597 Black drum 31,273Pinfish 31,934 Puffers 42,261Catfish 27,532 Bluefish 70,677Spot 8,264
-- 55

throughout the year and predominantly during the daytime. A variety of fishing gearwas employed to sample the many habitats in the lagoon. The work yielded anannotated list of fish species and a discussion on the possible reasons for differencesin the fauna found in this northern section of the Indian River Lagoon versus thatdescribed by Gilmore (1977a) at the southern end.
Species diversity is considerably lower in the northern reaches of the Indian RiverLagoon. One important feature noted was the lack of reef-like structure that could beused by fishes in the northern Indian River Lagoon with the exception of the ledges inMosquito Lagoon. These are found where the ICWW cuts through limestone andcoquina in the northern section of Mosquito Lagoon. Snelson (1983) could notadequately sample these ledges but suggested that they might support a number ofreef-associated fish that could be missing from the species list. Suggestions for thisregion being incapable of supporting the larger numbers and varieties of fish seen inthe southern Indian River Lagoon were cooler climates (disallowing for more tropicalspecies), only one ocean access (Ponce de Leon Inlet) and the great distance to theGulfstream (which could transport species into the area).
Schooley (1977) described fish community organization and microhabitat distinctionsat 12 stations in the northern Indian River Lagoon which included 2 stations in theMosquito Lagoon during 1976 and 1977. One of the stations was east northeast ofHaulover Canal and about 1/2 mile (.8 kin) west of the beach barrier island. Thesecond station was just west northwest of channel marker #26. He describedseasonal changes in the community structure and the influence of organic materialand depth on community composition. He concluded that nearshore fish communitieswere richer in summer months in terms of number of specimens, species number andbiomass. In summer, there were significant correlations between species and certainenvironmental parameters. Fall and spring were peak periods for species andbiomass diversity. The fall peak was apparently related to the increase in detritalmaterial from the annual seagrass bed "die-back" that attracts detrital feeding benthicinvertebrates which in turn draw bottom feeding fishes.
Mulligan and Snelson (1983) provided the first quantitative sampling of epibenthic fishpopulations in Mosquito Lagoon, north Indian and Banana Rivers. Their objective wasto develop a cost-effective database for use as a quantitative baseline for long termmonitoring. They determined that using "Importance Values" for fishes gives the bestindex for assessing change in a long term monitoring program of fish communities.Importance Values involve the use of abundance, frequency of capture andbiomass/individual.
They used two fixed stations in the lagoon that represented "typical" open lagoonhabitats where monthly sampling was conducted using otter trawls. One of theMosquito Lagoon stations was unique in several ways including the lack ofmacroalgae and seagrasses, the large number and consistent presence ofctenophores, and the large production of sciaenid fish (drum). The abundance ofdrum was correlated to higher salinities which occur in Mosquito Lagoon. Anchoamitchelli (anchovy) was the numerically dominant species in all areas and all monthsand the second dominant species for Mosquito Lagoon was typically.C_, (silver perch).
-- 56

The greatest number of species were found in Mosquito Lagoon and Banana Riversamples leading Mulligan and Snelson to speculate that the high diversities wereinfluenced by the relatively undisturbed conditions of the two areas as compared toIndian River.
Snelson and Bradley (1978) reviewed historical trends in fish mortalities due to coldtemperatures in Florida and gave a detailed description of results of the cold spell of1977 as it affected fish in Mosquito Lagoon and nearby waters. They concluded that,relative to short-term consequences, local fish populations are reduced and that largerfish species and larger individuals are killed by these cold events. The long termeffects of cold induced mortalities are probably minimal. Based on their quantitativetrawl surveys, Snelson and Bradley (1978) found no differences in total catches beforeand after the cold period.
Snelson and Williams (1981) gave species accounts of ten elasmobranch species(sharks and rays) they found in the northern Indian River Lagoon including MosquitoLagoon. The bull shark (._ leucas) was the most abundant shark. Thebluntnose stingray (_._.._) was the most abundant ray and elasmobranch.Sharks and rays apparently were more diverse and numerous in Mosquito Lagoonthan in other parts of the northern Indian River Lagoon. Snelson et al. (1989) notedthe largest numbers of bluntnose stingrays were consistently found in the MosquitoLagoon when compared to their other study sites in the northern Indian and BananaRivers and attributed the distributional differences to the well documented salinitydifferences in these three areas. Interestingly Snelson et al. (1988) found no such dis-proportions in the abundance of the Atlantic stingray (D. sabina).
In June and July of 1980, about 100 large adult red drum (Sciaenoos ocellatus) werefound dead or dying in the Indian River near Titusville and Mosquito Lagoon.Cardeilhac et al. (1981) presented data that suggested the mass kill was caused bythe fish feeding on blue crabs that were contaminated by metal poisoning (copper,zinc and arsenic). Precise locations of the dead fish were not given and the potentialsources of the metals were not noted.
In 1987, Johnson and Funicelli (unpublished) began studying red drum in MosquitoLagoon and documented for the first time, red drum spawning in an estuary. Theircollecting area was concentrated in a 10 km stretch along the ICWW north of HauloverCanal and another was at Ponce de Leon Inlet. The largest number eggs werecollected in the lagoon study site and appeared with a new moon. They reported thatthe ICWW and Haulover Canal may function the way "tidal passes" do by attracting thespawning red drum.
Funicelli et al. (1988) included Mosquito Lagoon in their assessment of theeffectiveness of the existing fish sanctuary on the Kennedy Space Center. Thesanctuary or "unfished" area was considered to be the northern Banana River andBanana Creek where the public is prohibited due to NASA safety and securityrequirements. Mosquito Lagoon was sampled along with the Indian River and southBanana River as the "fished" area and then compared to the above unfished area. Thesampling program by Funicelli and coworkers provided additional information relative to
57

fishes and environmental variables but the "treatment" and "nontreatment" areas are sovery different in terms of habitat as clearly described in the above reviews that such acomparison may not be valid.
Using trammel nets Funicelli et al. (1988) was able to determine the relativeabundance of various species in areas. They also tagged fish of recreational orcommercial importance for mark/recapture information. Their data provided interestingcomparisons of basic parameters but especially bottom type and vegetation found atthe random stations within each water body. The percentage of stations in MosquitoLagoon sampled having mud bottom and sand bottom types were 51.3% and 70.1%,respectively. Seagrass was encountered in 49.3% of the Mosquito Lagoon stationsand algae was observed at 61.8% of the stations. Of the 39 species caught, only28.2% were common to all of the study's areas. The work also yielded interestingtables of catch per unit effort (CPUE) by species for each area as well as by area bymonth. Mosquito Lagoon had the next to lowest overall CPUE of all areas at 20.3%.
Associated Database Reference numbers: 5, 15, 29, 36, 43, 44, 45, 47, 50, 51,52, 53,55, 56, 57, 59, 60, 62, 63, 64, 65, 66, 67, 81,82, 100, 101.
SEA TURTLES:
All species of these large marine reptiles are classified as threatened or endangeredby the U.S. Fish and Wildlife Service under the Endangered Species Act. Due to theirprotected classification and presence in Mosquito Lagoon they merit special attention.We found that historical trend data specific to Mosquito Lagoon's sea turtles is lacking.One anecdotal statement from Gilmore (in press) stated that fisheries in MosquitoLagoon were primarily for family use but that 150 green turtles (E;helonia ELY..(;i._)wereexported in 1879. With the exception of early fisheries reports (Brice 1897, Wilcox1897) describing a turtle fishery in the Indian River region taking a heavy toll on greenturtles, there are no documented studies of the turtles in Mosquito Lagoon until 1975(Ehrhart 1983).
The 19th century reports indicate that the green turtle fishery began in about 1878 andwas concentrated from the Melbourne area south. Landings data are available but donot give specific capture localities. The data indicate that very large numbers of turtleswere landed in the Sebastian to Ft. Pierce sections rather than the Titusville (MosquitoLagoon) area. Turtling was conducted primarily in winter between November and Mayusing tangle nets. It is clear that the green turtles were severely effected bycommercial exploitation over a 17 year period ending in 1895 when captures of turtlesdropped dramatically despite considerable fishing efforts (Wilcox 1897). Loggerheads!Caretta caretta! were not commercially valuable because their taste was disdained bymost, however, they were probably also killed in great numbers through incidentalcatch.
Ehrhart (1983) found four species of sea turtles in Mosquito Lagoon. The two mostcommon species were the green and the loggerhead but he also found, two Kemp'sridleys (LeDidochelys kemDi) and one hawksbill (Eretmochelvs imbricata). Theleatherback (._ coriacea), although also rare, has been reported from thesystem as well (Witherington and Ehrhart 1989).
58

Ehrhart's (1983) turtle netting surveys in Mosquito Lagoon yielded capture rates of0.67 turtles per day (vs. 0.02 captures/day in the northern Indian River). MosquitoLagoon was the only lagoon in the northern Indian River Lagoon that he couldregularly succeed in capturing turtles. However, Witherington and Ehrhart (1989)reported netting turtles near the Sebastian Inlet (approx. 100 km south) and yieldingcatch per-unit-effort values that are an order of magnitude higher than MosquitoLagoon. They postulated that frequent cold stunning events in the northern IndianRiver Lagoon and Mosquito Lagoon might be responsible for fewer green turtlesresiding in the Mosquito Lagoon (see section on green turtles to follow). The capturesin Mosquito Lagoon involved many immature turtles leaving Ehrhart (1983) toconclude that the _ and Care_a populations in the northern Indian River regionare composed of juvenile and/or subadult animals.
Mendonca and Ehrhart (1982) described the Mosquito Lagoon as a uniquedevelopmental habitat for Chelonia and Caretta with the northern end being lesssuitable than the southern end where there is little development and extensiveseagrass flats. They examined the activity, population size and structure of bothgreens and loggerheads in Mosquito Lagoon from 1976-1979. Turtles were collectedsystematically with tangle nets at six stations as well as opportunistically when theywere cold stunned and found floating on the surface during the winter of 1977 and1978. Cold stunning events in the region have been documented many times before,occurring in 1977, 1894, 1978, 1981, 1985, 1986, and 1989. When temperatures
have dipped to about 8°C, the turtles become lethargic and can be seen floating at thesurface, see Witherington and Ehrhart (1989) for a review.
Netting for loggerheads was most productive during April through October. Turtlesapparently were inactive at night. Mendonca and Ehrhart (1982) described trendsrelative to distribution of the captures for each species within the lagoon. Recaptureintervals for both species indicated that there was some degree of residency.
Mosquito Lagoon probably represents the northern limit of the winter range of thegreen turtle (Witherington and Ehrhart 1989). Mendonca and Ehrhart (1982)hypothesized that green turtles remain in Mosquito Lagoon until they begin to reachreproductive maturity. Although some may leave during colder periods of the year,many stay and may bury in the mud bottom during the coldest periods. The size classdistribution of greens immigrating to the lagoon ranged from post-yearling to subadult,in other words did not include the "lost-year" class or adults. They reported apopulation estimate of 135 green turtles in the lagoon. Witherington and Ehrhart(1989) speculated that the Mosquito Lagoon green turtle "population" was growingbased on data collected during the cold stunning events occurring between 1977 and1986. Mendonca and Ehrhart's netting studies indicate that greens were caught withthe greatest frequency in August.
Mendonca (1983) noted that green turtles in Mosquito Lagoon roam much largerdistances (average of 8.2 km/day) and in unpredictable patterns in fall and winter
when the water temperatures drop below 19°C as compared to warmer periods of theyear (average travel of 2.6 km/day). This unpredictable winter travel was postulated tobe attempts to leave the lagoon. The lagoon was referred to as a "funnel trap"
59

whereby animals have difficulty finding their way out via the only two exits at HauloverCanal or Ponce de Leon Inlet. This would agree with Witherington and Ehrhart (1989)as they discussed the cold stunned turtles being "trapped" in the lagoon and thensuccumbing to the cold temperatures. (Note similar suggestions relative to fishstunning events in the Fish section above.) Another hypothesis for the unpredictabletravel patterns is that the increased travel activity might be an effort to producemetabolic heat.
Mendonca (1983) found Mosquito Lagoon green turtles in deeper sloughs duringpedods of low water temperatures where they probably did not feed since seagrassesare not found in these areas. In summer they were much more predictable and spentabout 70% of the day on the seagrass flats; when water temperatures rose above31°C they moved back to the deeper, cooler waters. Their activities are curtailed atnight when they "sleep" and they are often found very close to the same sleeping siteeach night.
filiforme and Halodule _ were the dominant species of vegetationfound consumed by green turtles in Mosquito Lagoon (Mendonca 1983). _yringodiumwas found to be twice as abundant as Halodule in the green turtles examined.
The loggerhead population in Mosquito Lagoon appears to be made up of juveniles,the majority ranging between 50 and 80 cm straight line carapace length, none of thevery small sizes were seen which contrasts with findings for greens. The loggerheadssurveyed grew faster and matured earlier than greens. Although loggerheads exhibitsome degree of residency in the lagoon they do appear to migrate to and from thelagoon. Mendonca and Ehrhart (1982) reported a population estimate of 253loggerheads. They stated that the estimate was probably low based on fieldobservations and interviews with fishermen.
Associated Database Reference numbers: 3, 15, 42, 71, 72, 98, 102, 11 7, 118, 120,121.
WADING BIRDS:
Wading birds play an important role in aquatic systems (i.e., energy transfer). The birdsaffect the fish, invertebrates, reptiles, and submerged aquatic vegetation by their variousfeeding strategies. Trost (unpublished) evaluated wading bird usage and vegetationchanges of salt marshes, including two in Mosquito Lagoon, before and afterimpoundment for mosquito control. Two sites studied in the lagoon were Pardon Islandand a marsh in southwest Mosquito Lagoon. As in all the other study sites, hedocumented a substantial increase in the density of birds using these two marshes afterimpoundment.
Data from surveys of wading birds on Kennedy Space Center (Smith and Breininger,unpublished) are available for the years 1987 through 1990 and include three stationsin Mosquito Lagoon, two classified as impoundments and one as open estuary.Surveys were conducted once each month by two observers utilizing a helicopter.Approximately 43 surveys over the four year period yielded sightings of 23 bird species
60

at the Mosquito Lagoon stations (Table 11). Frequency of occurrence and relativedensity of each species are listed in the Table as well. One species, the woodstork(Mycteria _,mericana), is federally listed as endangered and five are listed by the Stateof Florida as species of special concern. Bird Island, in northern Mosquito Lagoon was,until 1982, the site of significant nesting for woodstorks. The island was abandoned as
a nesting site after the vegetation was damaged by the freeze in the winter of 1981.
Associated Database Reference numbers: 103, 114, 115.
MARINE MAMMALS:
Literature searches thus far reveal very few sources of marine mammal data for the
study area. The Marine Mammal Stranding and Salvage Network (MMSSN),coordinated by the National Marine Fisheries Service, has a database for records(1977 to the present) of stranded (dead) or unique sightings of marine mammals withinU.S. waters. It does not include data regarding the West Indian manatee. Table 12lists the eight species reported within the Canaveral National Seashore and abreakdown of those that were reported to be found in the Mosquito Lagoon itself. Thedistribution of these strandings is plotted in Figure 28.
The bottlenose dolphin (_ truncatus) is by far the most commonly sightedmarine mammal in the lagoon followed by the manatee. A bottlenose dolphin home-range study (Provancha et al. 1982, Odell and Asper 1990) involved surveys thatincluded Mosquito Lagoon. Several of the dolphins marked in the Cocoa andTitusville area for that study were often sited in Mosquito Lagoon. The generalconclusion from the study was that most of the dolphins were year round residents ofthe lagoonal complex and thus this "estuarine population" could be effected by variousperturbations in the system.
Hersh et al. (1990) studied mortality patterns of bottlenose dolphins over an eight yearperiod in the Indian/Banana River system including Mosquito Lagoon. The data for theentire region were pooled for the analysis, hence, trends specific to Mosquito Lagoonare not available.
Manatees (_ manatus) are seen in the lagoon and use it as a travel corridorto other sections of their east coast habitats, at least since the Haulover Canal was
built in 1854. However, aerial surveys over sections of the lagoon (Shane 1983 andB. Bonde, pers. comm.) indicate that, despite it's relatively undisturbed condition, thelagoon is not an area with particularly high numbers of manatees. Shane commentedthat the counts of manatees in Mosquito Lagoon and northern Indian River wereextremely low and contrasted sharply with those from Banana River and Indian Rivers.Her surveys indicated that manatees in Mosquito Lagoon were typically seen in theICWW or along the spoil islands near the ICWW. She speculated that manatees don'tuse the lagoon to much extent because of the lack of freshwater sources and dredgedareas. Dredged areas or basins are often used by manatees in other areas, especiallyin the Banana River (Provancha and Provancha 1988).
61

%ii!!ii!!%_
Figure 28. Locations of Marine Mammal Strandings, Representedby White Circles, in the Vicinity of Mosquito Lagoon from 1977 to1990 (scale = 1:160,000).
62

00
(0..J
0
O"
0
0
09
r_
"0
e.-
c-O
"0
"0
000
°_
rn
oo')(3(J
coh-
c-t___
o_
09
0 0000W
_- o9
o-_W o _ _W -- _._ ,_E _:_°_ _'_:_
__._-_ _ 0 o -- _- 0 0 _ (b o_n c_ (o (0 (o c9 c9 (9 (_ L_ __ Z Z n" rr rr
.o
"_ .-_ o
e-.&'r-
Z
"0
e-
v
Eq_(Jc-O(J
0q_
09
0
(1)°_
(J(1)O.co"0
-J
q)
(O
09
LU
"0(I)
"0
LU
o
(I)
(I)
e-
(I)"0q_U_
63

(1)
(Ifc:
0
(-.
o d',t,,,-
-_(_
0"13(j c
err,.
(n r',-
•_ ,--r-
E_E,-
:;o
-_ CT
o_C_Or- r-
.(/)
__8
>,
0v
(.-00
._1
ll)
I/)c
O
c:
c
,<
Z
g
',-"C'J 0 ,-" 0 0 0 0 0
tO
0
-
__o__o_
_D
8
8
64

It should be noted that no intensive studies of manatees using Mosquito Lagoon havebeen undertaken. Based on our experiences in the lagoon and work in the BananaRiver, one would expect to see animals using both the east and west sections of thenorthern end of the Canaveral National Seashore due to freshwater sources,
channelizations and the availability of some seagrasses. These two areas areattractive due to the features mentioned but are also areas that are potentially
dangerous to manatees due to the concentration of boat traffic with limited space toavoid boats. Today the authors and rangers working the park note that manatees aregenerally seen along the intercoastal and in the northeastern corner of the lagoonnear Eldora and Turtle Mound.
Florida's Department of Natural Resources is currently involved in developing amanatee protection plan for Volusia County (Jim Valade, FLDNR, Pers. comm.). Theyhave just begun biweekly aerial surveys over the Volusia County section of the lagoonand so new information will become available. We will attempt to collate the informationfor Mosquito Lagoon relative to the FLDNR mortality database for manatees as well.
Associated Database Reference numbers: 42, 79, 80, 89, 90, 125, 126, 127.
INVERTEBRATES
Several invertebrate studies have been conducted in Mosquito Lagoon, all between1971 and 1978. The studies involved only one or two stations near Haulover Canal,which is the dredged channel that connects the Indian River with Mosquito Lagoon.Three of the invertebrate studies were associated with seagrass. Hall and Eiseman(1981) reported low species diversity of seagrass epiphytes at the Haulover site and
this was thought to be due to the sparse population of Halodule wrightii caused by the1977 freeze, the large amount of fine silt and fluctuations in temperature and salinity.
Water temperatures ranged from 11-34oc and salinity from 20-46%.
Nelson et al. (1982) noted that environmental variability was greater at their Hauloversite compared to the southern stations (Sebastian, Link Port and St. Lucie). He alsonoted greater amphipod abundance at Haulover Canal. The mean abundance at thetwo northern stations (Haulover and Banana River) was twice that of the threesouthern stations combined. The greater abundance was believed to be due topredation pressure rather than environmental variability. Amphipod distributionalpatterns were thought to be related to the relative proximity of ocean inlets.
Young et al. (1976) set up cages in seagrass beds at Haulover Canal, Link Port andSt. Lucie to document predator/prey relationships of macrobenthos. Thirty-threespecies (mainly polychaetes) were found at the Haulover site. Thirty-two showedincreases in density within the cages. It was expected that an overall increase indensity of macrofauna from caged versus uncaged samples would be observed. This
was the case at the Haulover site but not at the two southern sites where cagingresulted in an unexplained decrease in density. There were lower total numbers ofindividuals and diversity of decapod crustaceans inside cages at Haulover than at thesouthern-most station. Although presumably important in regulating densities of
65

certain prey species at all the sites, decapods have a lesser overall impact onmacrobenthos at Haulover than stations further south. The decrease in caging effect
from north to south may be explained in terms of increased predation inside cages bydecapods.
Buzas and Severin (1982) showed that Haulover Canal and stations at inlets like St.Lucie were distinct from other stations in their foraminifera study. Twenty-one species,two exhibiting peak densities, were found at Haulover. The overall density andnumber of species of foraminifera clearly increased in a southerly direction. A gradientof increasing environmental variability towards the north end of the Indian RiverLagoon was evident. This increasing gradient is postively correlated with thedecrease in foraminifera densities in the northern area. Grizzte's (1974) decapod
study encompassed all estuarine water bodies in Brevard County and includedMosquito Lagoon. He documented the presence of eight species of decapods at twolocations in the southern portion of Mosquito Lagoon.
Associated Database Reference numbers: 15, 16, 18, 20, 22, 23, 24, 25, 27, 30, 31,32, 33, 49, 56, 57, 68, 70, 76, 78, 85, 123.
SHELLFISH
Two groups of invertebrates, crustaceans and mollusks, contribute to the shellfishfishedes of the region. Exploited invertebrates include oysters, clams, blue crabs, andpenaeid shdmp. Florida Department of Natural Resources Shellfish EnvironmentalAssessment Section is the primary source of shellfish related studies in MosquitoLagoon and the surrounding area. The lagoon is split into two sections for shellfishmanagment. The first contains the waters south of the Volusia/Brevard County lineand includes the northern part of the Indian River from Turnbull Creek south to theFlorida East Coast Railway (Harp et al. 1985). The second area is north of theVolusiaJBrevard County line up to the ICWW channel marker #61 and all the area fromeast to west (Poole and Harp 1985, Royal and Pierce 1990). These areas weresurveyed as sites for potential shellfish harvesting in the 1960's and were classified asprohibited, approved, or conditionally approved. The area in Brevard County wasclassified as approved for shellfish harvesting. In the late 1970's and early 1980's itwas resurveyed in order to determine if the classification was still appropriate. It wasdetermined that the classification of approved would remain in place. No trends werenoted between fecal coliform densities and natural physico-chemical parameters inthe Mosquito Lagoon portion and so no restrictions were applied (Harp et al. 1985).The northern part of the lagoon (Volusia County) was also resurveyed and theclassification was changed from approved to conditionally approved. Theclassification was changed due to the strong correlation between fecal coliform levelsand three day rainfall. Poole and Harp (1985) and Royal and Pierce (1990)recommended the following: "When rainfall of 1.50 inches (3.81 cm) or greater ismeasured within a 72 hour period at the Edgewater Wastewater Treatment Plant,and/or when catastrophic events such as hurricanes, sewage spills or detection ofp_chQdiscu8 brevis (a toxic dinoflagellate that causes red tide) occurs, the areas willbe closed to harvesting of shellfish. The area will reopen when sufficient time haselaspsed for depuration to occur and when all other parameters are shown to be
66

within Interstate Shellfish Sanitation Program standards." The northern lagoon also
has two prohibited areas which are: the waters along the ICWW from channel marker#71 southward to channel marker #15, and the water from Grouper Avenue south to
Turtle Mound (Poole and Harp 1985, Royal and Pierce 1990).
In addition to the above mentioned classification surveys, Grizzle (1988,1990) studiedthe distribution and abundance of two shellfish species, Orassostrea virginica (eastern
oyster) and Mercenaria rnercenaria (hard clam) and environmental factors effectingthem. The study took place in the northern part of Mosquito Lagoon, within the bordersof Canaveral National Seashore. Halodule wrightii was the dominant seagrass found.
The amount of bottom area covered by oyster reefs decreased in Mosquito Lagoonfrom north to south as did tidal ranges. Annual water temperatures ranged from 12.3-32.6°C while salinities ranged from 30.7-31.3%. Oyster reefs were primarily found inwaters greater than 1 m deep where tidal currents are presumed to be the greatest.Clams were only found in the vicinity of waters greater than 1 m deep. Sediment typesranged from mixtures of soft sand/mud to firm sand/shell. Clams were found in thehighest abundance in firm sand/shell sediments. There was no north-south trend withclams and there was no correlation between their abundance and tidal range.
In Mosquito Lagoon and other areas of northeast Florida blue crabs (Callinectessupport a large commercial and recreational fishery (Steel, 1979). Blue
crabs spend their entire life in the estuary except during the female spawningmigrations. Spawning may occur during all but the coldest months or whenever watertemperatures exceed 22°C (Tagtz, 1968). Mating is thought to occur primarily inbrackish waters, then females migrate to high salinity areas near tidal passes tospawn. Male blue crabs tend to remain in the lower salinity areas year-round. Bluecrab larvae mature primarily offshore where they pass through seven zoel stages, thenmolt to a megalops stage as they begin the journey back into the estuary. Small crabsoccupy shallow water habitats and gradually move to deeper water as they increase insize. Commercial landings on the east coast historically averaged about 7 millionpounds but have declined during the last 10 to 20 years according to Steele (1979).Peak landings occur summer through fall with all catches coming from estuarinewaters.
Three species of penaeid shrimp, Peanaeus _ (whites), Penaeus aztecus(browns), and Penaeus duorarum (pinks), contribute to the east coast Florida landings.All three species spawn offshore where their eggs and larvae develop as they drifttoward the estuary. Juveniles reside for several months in the estuary whereseagrasses provide the primary habitat (Durako et al. 1988). Brown shrimp have apeak inshore recruitment in February and March. White shrimp recruitment occurs inMay and June. Pink shrimp form only a small part of the commercial catch in northeastFlorida but they contribute significantly to a live-bait fishery extending south fromPonce de Leon Inlet. Pink shrimp spawn year round with a peak in early spring(Durako et al. 1988). The vast majority of commercial catch is taken from offshorewaters but the bait shrimp fishery is supported primarily by lagoon catches using pushnets, dip nets and cast nets.
Associated Database Reference numbers: 5, 67, 88, 93, 94, 95, 96, 104, 108.
67

MOSQU ITO CONTROL
Mosquito Lagoon lies within two mosquito control districts, Brevard and Volusia, and ismanaged differently within each. These two agencies are responsible for most of themosquito control studies that have occurred in the lagoon. Saltmarsh, mosquitocontrol and impoundment studies have been conducted (Montague et al. 1984, Trost,unpublished) in small sections of the Mosquito Lagoon.
The Brevard County Mosquito Control District (BCMCD) was incorporated in 1937 andspraying to control mosquito populations was begun at that time. In the late 1950'sBCMCD, in conjunction with various other agencies, implemented construction ofmosquito control impoundments (Jim Hunt pers. comm.). These impoundments wereconstructed up until 1972. At the present time only maintenance measures areperformed on these existing impoundments.
Through the years various pesticides, larvicides and other chemicals have been usedin the attempt to control mosquito populations. As early as 1937 diesel was used,although in 1988 this was replaced by a chemical called Golden Bear which is arefined diesel oil that is used in considerably lower amounts. In the early 1950's thepesticide DDT was used and in the mid 1960's Pads green, although neither of thesewere sprayed in the lagoon area. The main chemical used in Mosquito Lagoon since1968 is the larvicide, Altosand. The southwestern area of Mosquito Lagoon from stateroad 406 south is a frequently sprayed area. The rest of the lagoon that is managedby Brevard County is rarely sprayed.
Volusia County Mosquito Control District (VCMCD) was also incorporated in 1937when two smaller districts merged. In the 1920's and 1930's hand ditching began inthe lagoon and was later replaced (1940's and 1950's) by draglines. Impoundmentsbecame popular in the 1960's and 1970's, although by the mid 1980's they were nolonger in use in the lagoon (they were opened up). With the 1980's came rotaryditching, which is still in use now. The purpose of rotary ditching was for sourcereduction. Areas where mosquitoes were able to breed, like potholes, were connectedto permanent sources of water. Not only did the water flood the moist ground that wasneeded for egg laying but it allowed access for fish whose primary food source wasmosquito larvae. In addition to these methods, insecticides were used that affected theindividual stages of the mosquito lifecycle. Since 1978, the larvicide Altosid has beenthe primary chemical sprayed in the lagoon by VCMCD. Unlike BCMCD, VolusiaCounty frequently sprays in the areas of Mosquito Lagoon that they manage.
Associated Database Reference numbers: 46, 114, 130, 132, 134, 135, 137, 138, 153,157.
68

Literature Cited.
Anderson, W.W., and J.W. Gehringer. (1965). Biological-Statistical Census of the
Species Entering Fisheries in the Cape Canaveral Area. U.S. Fish & Wildl. Serv.Special Rept. Fisheries #514, 79 pp. Ref. 67.
Brice, J.J. (1897). The Fisheries of Indian River, Florida. Rept. of the Commissioner,U.S. Comm. Fish and Fisheries, Pt. 22:223-227. Ref. 60.
Buzas, M.A., and K.P. Severin. (1982). Distribution and Systematics of Foraminiferain the Indian River, Florida. Smithsonian Contrib. to the Mar. Sci. 16:1-73. Ref. 30.
Cardeilhac, P.T., C.F. Simpson, F.H. White, N.P. Thompson, and W.E. Carr. (1981).Evidence for Metal Poisoning in Acute Deaths of Large Red Drum (Sciaenoosocellata) Bull. Environ. Contam. Toxicol. 27:639-644. Ref. 82.
Clapp, D. (1987). Overview of Physiographic and Surface Drainage Features,Chapter 1. In: Indian River Lagoon Joint Reconnaissance Report. Steward, J.S., andJ.A. VanArman, (eds). p. 1-27. Ref. 150.
Clark, K.B. (1975). Benthic Community Structure and Function, Chapter 2. In."Ecological Study of Lagoons around John F. Kennedy Space Center, Brevard County,Florida, April, 1972 to September, 1975. Vol. 1. Experimental Results and Final Rept.to NASA, Kennedy Space Center, FL., NGR 10-015-008, Fla. Inst. Tech. p. 1-58. Ref. 8.
Durako, M.J., M.D. Murphy, and K.D. Haddad. (1988). Florida Marine ResearchPublications: Assessment of Fisheries Habitat: Northeast Florida. Fla. Dept. Nat.Resour., Bureau of Mar. Res. #45. 51 pp. Ref. 5.
Edward E. Clark Engineers-Scientists, Inc. (1986).Document John F. Kennedy Space Center, NASA.FL., Contract # NAS10-11293. 489 pp. Ref. 145.
Environmental Resources
For: Eng. Dev. Directorate KSC,
Edward E. Clark Engineers-Scientists, Inc. (1987). KSC Subsurface Hydrology andGroundwater Survey. Vol. IV. The Area Groundwater Survey Program. For: Eng. Dev.Directorate (NASA) 210 pp. Ref. 97.
Ehrhart, L.M. (1983). Marine Turtles of the Indian River Lagoon System. Fla. Sci.46(3/4):337-346. Ref. 121.
Eiseman, N.J. (1980). An Illustrated Guide to the Seagrasses of the Indian RiverRegion of Florida. Harbor Branch Foundation, Inc. Tech. Rept. #31.24 pp. Ref. 54.
Erwin, K.L. (1988). Voiusia County Coastal Management Element, Volusia CountyEstuarine Water Quality. Kevin L. Erwin Consulting Ecologist, Inc. For Volusia County.94 pp. Ref. 108.
69

Evermann, B.W., and B.A. Bean. (1897). Indian River and its Fishes. Rept. of theCommissioner, U.S. Comm. Fish and Fisheries, Pt. 22:227-248. Ref. 55.
Flint, R.W. (1985). Long-term Estuarine Variability and Associated BiologicalResponse. Estuaries 8(2A):158-169. Ref. 144.
Funicelli, N.A., D.R. Johnson, and D.A. Meineke. (1988). Assessment of theEffectiveness of an Existing Fish Sanctuary within the Kennedy Space Center. Rept. toMar. Fisheries Comm. Fla. 54 pp. Ref. 35.
Gardner, T. (1990). Mosquito Lagoon Aquatic Preserve Management Plan (Draft).Bureau of Submerged Lands and Preserves. 93 pp. Ref. 141.
Gilmore, R.G. (1977). Fishes of the Indian River Lagoon and Adjacent Waters, Florida.Bull. Fla. State Mus. Biol. Sci. 22(3):101-148. Ref. 28.
Gilmore, R.G. (In Press). Chapter VIII Biology: Fish. Harbor Branch OceanographicInstit. 71 pp. Ref. 62.
Gilmore, R.G., P.A. Hastings, and D.J. Herrema. (1983). Ichthyofaunal Additions to theIndian River Lagoon and Adjacent Waters, East-Central Florida. Fla. Sci. 46(1):22-30.Ref. 19.
Grizzle, R.E. (1974). The Estuarine Decapod Crustaceans in Brevard County, Florida.Fla. Sci. 37(3):129-141. Ref. 49.
Grizzle, R.E. (1988). Distribution and Abundance of Commercially Important MolluscanShellfish in Saline Waters of the Canaveral National Seashore. Ctr. for Coastal &Environ. Studies, Rutgers Univ., N.J. 15 pp. Ref. 88.
Grizzle, R.E. (1990). Distribution and Abundance of _ yirginica(Gmelin,1791) (Eastern Oyster) and Mercenaria ,,%O.,E.(Quahogs) in a Coastal Lagoon.J. of Shellfish Res. 9(2):347-358. Ref. 104.
Hall, M.O., and N.J. Eiseman. (1981). The Seagrass Epiphytes of the Indian River,Florida I. Species List with Descriptions and Seasonal Occurrences. Botanica Marina24:139-146. Ref. 33.
Hand, J., V. Tauxe, and M. Friedemann. (1988). Middle East Coast Basin TechnicalReport: An Appendix of the 305B Water Quality Assessment for the State of Florida,July, 1988. Fla. Dept. Environ. Reg., Standards and Monitoring Tech. Rept. #113. 15pp. Ref. 1.
Harp, J.C., B.D. Poole, D.C. Heil. (1985). Comprehensive Shellfish Growing AreaSurvey Northern Brevard County Body (A). Fla. Dept. Nat. Resour. 55 pp. Ref. 93.
Helsle, D.R. (1990). Less than Obvious Statistical Treatment of Data below theDetection Limit. Environ. Sci. Tech. 24(12):1767-1774. Ref. 146.
70

Hersh, S.L., D.K. Odell, E.D. Asper. (1990). Bottlenose Dolphin Mortality Patterns inthe Indian/Banana River System of Florida. In: The Bottlenose Dolphin. Leatherwood,S., and R. Reeves, (eds). Academic Press, Inc., Harcourt Brace Jovanavich, Publ. p.155-164. Ref. 125.
Johnson, D.R., and N.A. Funicelli. (1987). Estuarine Spawning of the Red Drum in
Mosquito Lagoon on the East-Coast of Florida. (Draft) Univ. Fla. & U.S. Fish & Wildl.Serv. Nat. Fisheries Res. 26 pp. Ref. 34.
Kenworthy, W.J., and D. Haunert. (1991). Results and Recommendations of aWorkshop Convened to Examine the Capability of Water Quality Criteria, Standardsand Monitoring Programs to Protect Seagrasses from Deteriorating WaterTransparency. Rept. to NOAA's Coastal Ocean Prog. Estuarine Habitat Studies. 151pp. Ref. 154.
Lasater, J.A. (1975). Water Chemistry Studies of the Indian River Lagoons, Chapter 6.In; Ecological Study of Lagoons around John F. Kennedy Space Center, BrevardCounty, Flodda, April, 1972 to September, 1975. Vol. 1. Experimental Results andFinal Rept. to NASA, Kennedy Space Center, FL., NGR 10-015-008, Fla. Inst. Tech. p.1-34. Ref. 8.
Lee, V., and S. Olsen. (1985). Eutrophication and Management Initiatives for theControl of Nutrient Inputs to Rhode Island Coastal Lagoons. Estuaries 8(28):191-202.Ref. 151.
Mailander, J.L. (1990). Climate of the Kennedy Space Center and Vicinity. NASATech. Memorandum # 103498. 62 pp. Ref. 41.
McGurk, B., P. Bond, and D. Mehan. (1989). Hydrogeologic and LithologicCharacteristics of the Surficial Sediments in Volusia County, Florida. Tech. Pub. SJ89-7 St. Johns River Water Manage. Dist. 143 pp. Ref. 39.
Mehta, A.J., and H.K. Brooks. (1973). Mosquito Lagoon Barrier Beach Study. Shoreand Beach 41(2):26-34. Ref. 142.
Mendonca, M.T. (1983). Movements and Feeding Ecology of Immature Green Turtles(Chelonia _) in a Florida Lagoon. Copeia 4:1013-1023. Ref. 72.
Mendonca, M.T., and L.M. Ehrhart. (1982). Activity, Population Size and Structure ofImmature Chelonia _ and Caretta caretta in Mosquito Lagoon, Florida. Copeia1:161-167. Ref. 120.
Montague, C.L., A.V. Zale, and H.F. Percival. (1984). Photographic Analysis of Naturaland Impounded Salt Marsh in the Vicinity of Merritt Island, Florida. Tech. Rept. #11 Fla.Coop. Fish & Wildl. Res. Unit & Systems Ecol. & Energy Analysis Prog. 19 pp. Ref.131.
71

Mulligan, T.J., and F.F. Snelson, Jr. (1983). Summer-Season Populations ofEpibenthic Manne Fishes in the Indian River Lagoon System, Florida. Fla. Sci.46(3/4):240-276. Ref. 51.
Nelson, W.G., K.D. Cairns, and R.W. Virnstein. (1982). Seasonality and SpatialPatterns of Seagrass-Associated Amphipods of the Indian River Lagoon, Florida. Bull.Mar. Sci. 32(1):121-129. Ref. 27.
Odell, D.K., and E.D. Asper. (1990). Distribution and Movements of Freeze-BrandedBottlenose Dolphins in the Indian and Banana Rivers, Florida. In: The BottlenoseDolphin. Leatherwood, S., and R. Reeves, (eds). Academic Press, Inc., Harcourt BraceJovanavich, Publ. p. 515-540. Ref. 127.
Poole, B.D., and J.C. Harp. (1985). Comprehensive Shellfish Growing Area Survey forSouth Volusia County. Fla. Dept. Nat. Resour., Shellfish Environ. Assess. Sect. 90 pp.Ref. 96.
Provancha, J.A., and M. Willard. (1984). Seagrass Bed Distribution and Composition.Fla. Sci. 47 (Supplement #1):23. Ref. 147.
Provancha, J.A., and M.J. Provancha. (1988). Long-Term Trends in Abundance andDistribution of Manatees (Tdchechus manatus) in the Northern Banana River, BrevardCounty, Florida. Mar. Mammal Sci. 4(4):323-338. Ref. 89.
Provancha, J.A., E. Asper, and D. Odell. (1982). Live Capture, Marking and Resightingof Free-ranging _ t_ncatus in the Indian River Lagoon System, Florida. Fla.Sci. 45 (Supplement #1):28. Ref. 148.
Provancha, M.J., P.A. Schmalzer, and C.R. Hall. (1986). Effects of the December 1983and January 1985 Freezing Air Temperatures on Selected Aquatic Poikilotherms andPlant Species of Merritt Island, Florida. Fla. Sci. 49(4):199-211. Ref. 152.
Rao, D. (1987). Surface Water Hydrology, Chapter 2. In." Indian River Lagoon JointReconnaissance Report. Steward, J.S., and J.A. VanArman, (eds). p. 1-40. Ref. 150.
Royal, J., and B. Pierce. (1990). Annual Reappraisal of the South Volusia CountyShellfish Harvesting Area. Fla. Dept. Nat. Resour., Shellfish Environ. Assess. Sect. 18pp. Ref. 95.
Schmalzer, P.A., and C.R. Hinkle. (1990a). Flora and Threatened and EndangeredPlants of John F. Kennedy Space Center, Florida. NASA Tech. Memorandum#102791.68 pp. Ref. 155.
Schmalzer, P.A., and C.R. Hinkle. (1990b). Geology, Geohydrology and Soils ofKennedy Space Center: A Review. NASA Tech. Memorandum # 103813. 46 pp. Ref.87.
Smith, N.P. (1990). Longitudinal Transport in a Coastal Lagoon. Estuarine, Coastaland Shelf Science 31:835-849. Ref. 129.
72

Schooley, J.K. (1977). Factors Affecting the Distribution of the Nearshore Fishes in theLagoonal Waters of the indian River, Florida. Univ. Fla. Masters Degree Thesis. 165pp. Ref. 63.
Shane, S.H. (1983). Abundance, Distribution, and Movements of Manatees(..T._ manatus)in Brevard County, Flodda. Bull. Mar. Sci. 33(1):1-9. Ref. 79.
Snelson, F.F., Jr. (1980). A Continuation of Base-Line Studies for Environmentally
Monitoring Space Transportation Systems (STS) at John F. Kennedy Space Center.Vol. III of IV. Part 1 : Ichthyological Studies (Lagoonal Waters). KSC TR 51-2, Vol. III,Part 1, NASA Contract Rept. # 163122. 435 pp. Ref. 100.
Snelson, F.F., Jr. (1983). Ichthyofauna of the Northern Part of the Indian River LagoonSystem, Florida. Fla. Sci. 46(3/4):187-206. Ref. 52.
Snelson, F.F. Jr., and W.K. Bradley, Jr. (1978). Mortality of Fishes Due to Cold on theEast Coast of FIodda, January, 1977. Fla. Sci. 41 (1):1-12. Ref. 45.
Snelson, F.F. Jr. and S.E. Williams. (1981). Notes on the Occurrence, Distribution, andBiology of Elasmobranch Fishes in the Indian River Lagoon System, Florida. Estuaries4(2):110-120. Ref. 44.
Snelson, F.F. Jr., S.E. Williams-Hooper, and T.H. Schmid. (1988). Reproduction andEcology of the Atlantic Stingray, _ sabina, in Florida Coastal Lagoons. Copeia3:729-739. Ref. 47.
Snelson, F.F. Jr., S.E. Williams-Hooper, and T.H. Schmid. (1989). Biology of theBluntnose Stingray, Dasyatis .,_..y.[, in Florida Coastal Lagoons. Bull. Mar. Sci.45(1):15-25. Ref. 81.
Southeastern Wildlife Services, Inc. (1979). Vegetation of a Selected Section ofCanaveral National Seashore. Report for NPS SE Regional Office, Atlanta, GA. 13 pp.Ref. 156.
Tabb, D.C. (1960). The Spotted Seatrout Fishery of the Indian River Area, Florida.State of Fla. Board of Conserv. Tech. Series # 33. 20 pp. Ref. 53.
Taylor, R.B., W.F. McFetridge, and M.L. Cochrane. (1989). Long-Range DredgedMaterial Management Plan for the Intracoastal Waterway in Brevard County, Florida.Final Rept. Fla. Inland Navigation Dist. 139 pp. Ref. 10.
Toth, D. (1987). Hydrogeology. In." Indian River Lagoon Joint ReconnaissanceReport, Chapter 4. Steward, J.S., and J.A. VanArman, (eds). p. 1-13. Ref. 150.
Trost, C.H. (undated). Study of Wildlife Usage of Salt Marsh on East Coast of Floridabefore and after Impoundment for Mosquito and Sandfly Control. U.S. Dept. Interior,Fish & Wildl. Serv. Contract # 14-16-0008-623. 30 pp. Ref. 138.
73

Wilcox, W.A. (1897). Commercial Fisheries of Indian River, Florida. Rept. of theCommissioner, U.S. Comm. Fish and Fisheries, Pt. 22:249-262. Ref. 143.
Windsor, J.G., and J. Steward. (1987). Water and Sediment Quality, Chapter 5. In--Indian River Lagoon Joint Reconnaissance Report. Steward, J.S., and J.A. VanArman,(eds). p. 1-58. Ref. 150.
Witherington, B.E., and L.M. Ehrhart. (1989). Hypcthermic Stunning and Mortality ofMarine Turtles in the Indian River Lagoon System, Florida. Copeia 3:696-703. Ref. 71.
Young, D.K., and M.W. Young. (1977). Community Structure of the MacrobenthosAssociated with Seagrass of the Indian River Estuary. In." Ecol. of Mar. Benthos. B.C.Coull, (ed). Univ. South Carolina Press. p. 359-381. Ref. 31.
Young, D.K., M.A. Buzas, and M.W. Young. (1976). Species Densities ofMacrobenthos Associated with Seagrass: A Field Experimental Study of Predation.J. Mar. Res. 34(4):577-592. Ref. 85.
Zimmermann, C.F., J.R. Montgomery, and P.R. Carlson. (1985). Variability of DissolvedReactive Phosphate Flux Rates in Nearshore Estuarine Sediments: Effects ofGroundwater Flow. Estuaries 8(2B):228-236. Ref. 149.
74

Appendix A
Mosquito Lagoon Bibliographic Database List, by Reference Number.
Ref. 1. Hand, J., V. Tauxe, and M. Friedemann. (1988). Middle East Coast BasinTechnical Report: An Appendix of the 305B Water Quality Assessment for the State ofFlorida, July, 1988. Fla. Dept. Environ. Reg., Standards and Monitoring Tech. Rept.#113. 15 pp.
Ref. 2. Reed, W.L., E.E. Isuk, G.O. Phillips, and D.R. Walls-Johnson. (1985). CanaveralNational Seashore a Bibliography of Scientific Research Vol. 1. National Park ServiceCoop. Agreement #CA1600-3-0007. 175 pp.
Ref. 3. Erwin, K.L., and C.M. Smith. (1987). An Annotated Bibliography of NaturalResource Studies Pertinent to the Volusia County, Florida Coastal Zone. ConsultingEcologist, Inc., Fort Myers. 21 pp.
Ref. 4. Sleister, R.K. (1989). Analysis of Heavy Metals in Sediments from IndianRiver/Mosquito Lagoon Stormwater Outfalls. Environ. Manage. Dept. County ofVolusia. 29 pp.
Ref. 5. Durako, M.J., M.D. Murphy, and K.D. Haddad. (1988). Florida Marine ResearchPublications: Assessment of Fisheries Habitat: Northeast Florida. Fla. Dept. Nat.Resour., Bureau of Mar. Res. #45.51 pp.
Ref. 6. Harbor Branch Oceanographic Institute Library. (1990). Harbor BranchPublications List. 27 pp.
Ref. 7. Heaney, J.P., B. Koopman, D.S. Dwornik, and D.R. Saliwanchik. (1984). WaterResources of the Kennedy Space Center Final Report Publication #82. Fla. WaterResour. Res. Ctr. & Dept. Environ. Eng. Sci., Univ. Fla. 259 pp.
Ref. 8. Carey, M.R., T.A. Nevin, J.A. Lasater, K.B. Clark, E.H. Kalajian, and P.S.Dubbelday. (1975). An Ecological Study of the Lagoons Surrounding the John F.Kennedy Space Center Brevard County, Florida, April, 1972 to September, 1975.Final Rept. Grant # NGR 10-015-008 Fla. Inst. Tech. 213 pp.
Ref. 8. Clark, K.B. (1975). Benthic Community Structure and Function, Chapter 2. In:Ecological Study of Lagoons around John F. Kennedy Space Center, Brevard County,Florida, April, 1972 to September, 1975. Vol. 1. Experimental Results and Final Rept.to NASA, Kennedy Space Center, FL., NGR 10-015-008, Fla. Inst. Tech. p. 1-58.
Ref. 8. Lasater, J.A. (1975). Water Chemistry Studies of the Indian River Lagoons,Chapter 6. In: Ecological Study of Lagoons around John F. Kennedy Space Center,Brevard County, Florida, Apdl, 1972 to September, 1975. Vol. 1. Experimental Resultsand Final Rept. to NASA, Kennedy Space Center, FL., NGR 10-015-008, Fla. Inst.Tech. p. 1-34.
75

Ref. 9. Jones, K.L. (1986). Quantitative Assessment of Stcrmwater Runoff from theVehicle Assembly Building Area of the John F. Kennedy Space Center, Florida. Fla.Inst. Tech. Masters Degree Thesis. 109 pp.
Ref. 10. Taylor, R.B., W.F. McFetridge, and M.L. Cochrane. (1989). Long-RangeDredged Material Management Plan for the Intracoastal Waterway in Brevard County,Florida. Final Rept. Fla. Inland Navigation Dist. 139 pp.
Ref. 11. Bennett, D.B. (1989). Water Resources Analysis of a Multiobjective DrainageNetwork in the Indian River Lagoon Basin. Univ. Fla. Masters Degree Thesis
Publication # 108. 154 pp.
Ref. 12. Heaney, J.P., and D.B. Bennett. (1988). Progress Report: StormwaterManagement in the Kennedy Space Center, Florida. Fla. Water Resour. Res. Ctr. &Univ. Fla. 68 pp.
Ref. 13. Montague, C.L., A.V. Zale, and H.F. Percival. (1985). Final Report: AConceptual Model of Salt Marsh Management on Merritt Island National WildlifeRefuge, Florida. Tech. Rept. #17. Univ. Fla. Coop. Fish & Wildl. Res. Unit & Dept.Environ. Eng. Sci. 92 pp.
Ref. 14. Panico, C.A., and D.D. Barile. (1986). Management of the Indian River
Lagoon. Interim Rept. to the Indian River Lagoon Legislative Delegations/Mar. Resour.Counc. 79 pp.
Ref. 15. Taylor, W.K., and H.O. Whittier, (eds). (1983). Future of the Indian RiverSystem. Fla. Sci. 46(3/4):129-428.
Ref. 16. Gore, R.H. (1972). Zoogeographical Aspects of Decapod Crustacea in theIndian River Region of Florida. Am. Zool. 12(4):509.
Ref. 17. Smith, N.P. (1987). An Introduction to the Tides of Florida's Indian RiverLagoon. I. Water Levels. Fla. Sci. 50(1):49-61.
Ref. 18. Gore, R.H., and L.J. Becker. (1975). Studies on Stomatopod Crustacea of theIndian River Region of Florida. I. Rediscovery and Extension of Range ofArmata (Smith, 1881). Proc. Biol. Soc. of Washington. 88(3):21-28.
Ref. 19. Gilmore, R.G., P.A. Hastings, and D.J. Herrema. (1983). IchthyofaunalAdditions to the Indian River Lagoon and Adjacent Waters, East-Central Florida. Fla.Sci. 46(1 ):22-30.
Ref. 20. Gore, R.H. (1977). Studies on Decapod Crustacea from the Indian RiverRegion of Florida. VI. The Identity of Parthenope (Platylambrus) Serrata (H. MilneEdwards, 1834) and Parthenope (Platylambrus) Granulata (Kingsley, 1879). Proc.Biol. Soc. of Washington. 90(3):505-531.
76

Ref. 21. Gilmore, R.G., D.W. Cooke, and C.J. Donoehoe. (1982). A Comparison of theFish Populations and Habitat in Open and Closed Salt Marsh Impoundments In East-Central Florida. Northeast Gulf Sci. 5(2):25-37.
Ref. 22. Vimstein, R.W., and R.K. Howard. (1987). Motile Epifauna of MarineMacrophytes in the Indian River Lagoon, Florida. I. Comparisons among ThreeSpecies of Seagrasses from Adjacent Beds. Bull. Mar. Sci. 41(1):1-12.
Ref. 23. Mook, D. (1983a). Responses of Common Fouling Organisms in the IndianRiver, Florida to Various Predation and Disturbance Intensities. Estuaries 6(4):372-379.
Ref. 24. Hoskin, C.M., and D. Courtney. (1983). Biodepostion by a Fouling Communityin the Indian River, Florida. Estuaries 6(3):243-246.
Ref. 25. Reed, J.K., R.H. Gore, L.E. Scotto, and K.A. Wilson. (1982). CommunityComposition, Structure, Areal and Trophic Relationships of Decapods Asssociatedwith Shallow- and Deep-Water Oculina varicosa Coral Reefs. Bull. Mar. Sci.32(3):761-786.
Ref. 26. Gilmore, R.G. (1977b). Notes on the Opossum Pipefish, Oostethu8 _,from the Indian River Lagoon and Vicinity, Florida. Copeia 4:781-783.
Ref. 27. Nelson, W.G., K.D. Cairns, and R.W. Vimstein. (1982). Seasonality and SpatialPatterns of Seagrass-Associated Amphipods of the Indian River Lagoon, Florida. Bull.Mar. Sci. 32(1):121-129.
Ref. 28. Gilmore, R.G. (1977a). Fishes of the Indian River Lagoon and AdjacentWaters, Florida. Bull. Fla. State Mus. Biol. Sci. 22(3):101-148.
Ref. 29. Gilmore, R.G. (1978). The Current Status of the Fish Fauna of the Indian RiverLagoon Proc. Vol. I. Brevard Water Resources Conf. Fla. Inst. Tech., Sept. 14-15. 15PP.
Ref. 30. Buzas, M.A., and K.P. Severin. (1982). Distribution and Systematics ofForaminifera in the Indian River, Florida. Smithsonian Contrib. to the Mar. Sci. 16:1-73.
Ref. 31. Young, D.K., and M.W. Young. (1977). Community Structure of theMacrobenthos Associated with Seagrass of the Indian River Estuary. Ecol. of Mar.Benthos. B.C. Coull, (ed). Univ. South Carolina Press. p. 359-381.
Ref. 32. Young, D.K., and M.W. Young. (1978). Regulation of Species Densities ofSeagrass-Associated Macrobenthos: Evidence from Field Experiments in the IndianRiver Estuary, Florida. J. Mar. Res. 36(4):569-593.
Ref. 33. Hall, M.O., and N.J. Eiseman. (1981). The Seagrass Epiphytes of the IndianRiver, Florida I. Species List with Descriptions and Seasonal Occurrences. BotanicaMarina 24:139-146.
77

Ref. 34. Johnson, D.R., and N.A. Funicelli. (1987). Estuarine Spawning of the RedDrum in Mosquito Lagoon on the East-Coast of Florida. (Draft) Univ. Fla. & U.S. Fish &Wildl. Serv. Nat. Fisheries Res. 26 pp.
Ref. 35. Funicelli, N.A., D.R. Johnson, and D.A. Meineke. (1988). Assessment of theEffectiveness of an Existing Fish Sanctuary within the Kennedy Space Center. Rept. toMar. Fisheries Comm. Fla. 54 pp.
Ref. 36. The Office of Coastal Management (Compiler). (1986). Indian River LagoonField Committee of the Interagency Management Committee. Rept. to the Governor. 59PP.
Ref. 37. Steward, J., J. Higman, F. Morris, W. Sargent, R. Vimstein, F. Lund, and J.VanArman. (1989). Surface Water Improvement and Management (SWIM) Plan forIndian River Lagoon. St. Johns River/S. Fla. Water Manage. Dist. 100 pp.
Ref. 38. Cooley, C.D. (1990). Marsh and Wildlife Management Plan, Merritt IslandNational Wildlife Refuge. Annu. Water Manage. Prog. 1990.58 pp.
Ref. 39. McGurk, B., P. Bond, and D. Mehan. (1989). Hydrogeologic and LithologicCharacteristics of the Surficial Sediments in Volusia County, Florida. Tech. Pub. SJ89-7 St. Johns River Water Manage. Dist. 143 pp.
Ref. 40. Long, G.A. (1967). Indian and Historic Sites Report John F. Kennedy SpaceCenter, NASA. Prepared for the KSC Public Affairs Office. 60 pp.
Ref. 41. Mailander, J.L (1990). Climate of the Kennedy Space Center and Vicinity.NASA Tech. Memorandum # 103498. 62 pp.
Ref. 42. Florida Institute of Technology, Florida Sea Grant College, Harbor BranchFoundation, & University of Central Florida. (1981). Indian River System InformationSymposium Programs and Abstracts. 45 pp.
Ref. 43. Martin, D.F., (ed)., and B.B. Martin, (co-editor). (1990). The Second IndianRiver Research Symposium. Fla. Sci. 53(3):145-256.
Ref. 44. Snelson, F.F. Jr., and S.E. Williams. (1981). Notes on the Occurrence,Distribution, and Biology of Elasmobranch Fishes in the Indian River Lagoon System,Florida. Estuaries 4(2):110-120.
Ref. 45. Snelson, F.F. Jr., and W.K. Bradley, Jr. (1978). Mortality of Fishes Due to Coldon the East Coast of Florida, January, 1977. Fla. Sci. 41(1):1-12.
Ref. 46. Provost, M.W. (1973). Salt Marsh Management in Florida Annual Proceedings.Vol. 5. Conf. on Ecol. Anim. Control by Habitat Manage. 13 pp.
Ref. 47. Snelson, F.F. Jr., S.E. Williams-Hooper, and T.H. Schmid. (1988).Reproduction and Ecology of the Atlantic Stingray, _ sabina, in Florida CoastalLagoons. Copeia 3:729-739.
78

Ref. 48. Young, D.K., (ed). (1976). Indian River Coastal Zone Study 1975-1976.Annual Report Vol. I. Harbor Branch Consortium. 187 pp.
Ref. 49. Grizzle, R.E. (1974). The Estuarine Decapod Crustaceans in Brevard County,Florida. Fla. Sci. 37(3):129-141.
Ref. 50. Snelson, F.F., Jr. (1981). New Records of Marine Fishes in the Indian RiverLagoon System, Florida. Fla. Sci. 44(1):61-63.
Ref. 51. Mulligan, T.J., and F.F. Snelson, Jr. (1983). Summer-Season Populations ofEpibenthic Marine Fishes in the Indian River Lagoon System, Florida. Fla. Sci.46(3/4) :240-276.
Ref. 52. Snelson, F.F., Jr. (1983). Ichthyofauna of the Northern Part of the Indian RiverLagoon System, Florida. Fla. Sci. 46(3/4):187-206.
Ref. 53. Tabb, D.C. (1960). The Spotted Seatrout Fishery of the Indian River Area,Florida. State of Fla. Board Of Conserv. Tech. Series # 33.20 pp.
Ref. 54. Eiseman, N.J. (1980). An Illustrated Guide to the Seagrasses of the IndianRiver Region of FIodda. Harbor Branch Foundation, Inc.Tech. Rept. #31.24 pp.
Ref. 55. Evermann, B.W., and B.A. Bean. (1897). Indian River and its Fishes. Rept. ofthe Commissioner, U.S. Comm. Fish and Fisheries, Pt. 22:227-248.
Ref. 56. Kerr, G.A. (1976). Indian River Coastal Zone Study Annual Report, Vol. II,1975-1976. Harbor Branch Consortium. 105 pp.
Ref. 57. Young, D.K., (ed). (1975). Indian River Coastal Zone Study Annual Report,Vol. I, 1974-1975. Harbor Branch Consortium. 180 pp.
Ref. 58. Jones, C.P. and A.J. Mehta. (1978). Ponce De Leon Inlet Glossary of InletsReport #6 Fla. Sea Grant Prog. # 23. Dept. Coastal & Oceanographic Eng. Univ. Fla.57 pp.
Ref. 59. Montague, C.L., A.V. Zale, H.F. Percival, and T. Hingtgen. (1984). ACategorized Bibliography for a Conceptual Model of Salt Marsh Management onMerritt Island, Florida. Fla. Coop. Fish & Wildl. Res. Unit/Sys. Ecol. & Energy Anal.Prog. Univ. Fla. 99 pp.
Ref. 60. Brice, J.J. (1897). The Fisheries of Indian River, Florida. Rept. of theCommissioner, U.S. Comm. Fish and Fisheries, Pt. 22:223-227.
Ref. 61. White, C.B. (1986). Seagrass Maps of the Indian and Banana Rivers. BrevardCounty Office Nat. Resour. Manage. 33 pp.
Ref. 62. Gilmore, R.G. (In Press). Chapter VIII Biology: Fish. Harbor BranchOceanographic Instit. 71 pp.
79

Ref. 63. Schooley, J.K. (1977). Factors Affecting the Distribution of the NearshoreFishes in the Lagoonal Waters of the Indian River, Flodda. Univ. Fla. Masters DegreeThesis. 165 pp.
Ref. 64. Gilmore, R.G., C.J. Donohoe, D.W. Cooke, and D.J. Herrema. (1981). Fishes ofthe Indian River Lagoon and Adjacent Waters, Florida. Harbor Branch FoundationTech. Rept. #41.36 pp.
Ref. 65. Gilmore, R.G., Jr. (1974). Indian River Study Annual Report, Vol.1, 1973-1974Appendix Only. A Regional Description and Checklist of Fishes of the Indian River.Harbor Branch Consortium. 183 pp.
Ref. 66. Briggs, J.C. (1958). A List of Florida Fishes and their Distribution. Bull. of theFla. State Mus. Biol. Sci. 2(8):223-319.
Ref. 67. Anderson, W.W., and J.W. Gehringer. (1965). Biological-Statistical Census ofthe Species Entering Fisheries in the Cape Canaveral Area. U.S. Fish & Wildl. Serv.Special Rept. Fisheries #514, 79 pp.
Ref. 68. Grizzle, R.E. (1984). Pollution Indicator Species of Macrobenthos in a CoastalLagoon. Mar. Ecol. Prog. Series 18:191-200.
Ref. 69. Van Dolah, R.F., V.G. Burrell, Jr., and S.B. West. (1980). The Distribution ofPelagic Tars and Plastics in the South Atlantic Bight. Mar. Pollution Bull. 11:352-356.
Ref. 70. Lichtenfels, J.R., T.K. Sawyer, and G.C. Miller. (1980). New Hosts for Larval._.lJ.£._,._d_Spp. (Nematoda, Anisakidae) and Prevalence in the Calico Scallop(Argopecten Gibbus). Trans. Am. Micros. Soc. 99(4):448-451.
Ref. 71. Witherington, B.E., and L.M. Ehrhart. (1989). Hypothermic Stunning andMortality of Marine Turtles in the Indian River Lagoon System, Florida. Copeia 3:696-703.
Ref. 72. Mendonca, M.T. (1983). Movements and Feeding Ecology of Immature GreenTurtles (_ B_._[a_) in a Florida Lagoon. Copeia 4:1013-1023.
Ref. 73. Nevin, T.A., and J.A. Lasater. (1969). Studies of Pollution in the Indian RiverComplex. Quar. J. Fla. Acad. Sci. 32(3):225-229.
Ref. 74. Vickers, D.H., R.S. White, and I.J. Stout. (1975). Elemental Analysis ofSelected Merritt Island Plants. Fla. Sci. 36(6):163-171.
Ref. 75. Johnson, L.T. (1983). Perspectives on the Future of the Indian River System.Fla. Sci. 46(3/4):132-134.
Ref. 76. Norris, D.R. (1983). The Occurrence of a Toxic Dinoflagellate in the IndianRiver System. Fla. Sci. 46(3/4):150-153.
80
Ref. 77. Rice, J.D., R.P. Tr'ocine,and G.N. Wells. (1983). Factors Influencing SeagrassEcology in the Indian River Lagoon. Fla. Sci. 46(3/4):276-286.
Ref. 78. Reish, D.J., and M.L. Hallisey. (1983). A Check-list of the BenthicMacroinvertebrates of the Kennedy Space Center, Florida. Fla. Sci. 46(3/4):306-313.
Ref. 79. Shane, S.H. (1983). Abundance, Distribution, and Movements of Manatees(TJ_,,_.,£,I_ manatus)in Brevard County, Florida. Bull. Mar. Sci. 33(1 ):1-9.
Ref. 80. Reynolds, J.E. III, and J.R. Wilcox. (1985). Abundance of West IndianManatees (Trichechus m_natus) around Selected Florida Power Plants followingWinter Cold Fronts, 1982-1983. Bull. Mar. Sci. 36(3):413-422.
Ref. 81. Snelson, F.F. Jr., S.E. Williams-Hooper, and T.H. Schmid. (1989). Biology ofthe Bluntnose Stingray, I_asyatis ._..j., in Florida Coastal Lagoons. Bull. Mar. Sci.
45(1 ):15-25.
Ref. 82. Cardeilhac, P.T., C.F. Simpson, F.H. White, N.P. Thompson, and W.E. Cart.(1981). Evidence for Metal Poisoning in Acute Deaths of Large Red Drum !Sciaenoosocellata) Bull. Environ. Contam. Toxicol. 27:639-644.
Ref. 83. Beazley, R.W., T.A. Nevin, and J.A. Lasater. (1974). Haloduric Anaerobes inthe Sulfide Muds of a Saline Lagoon. Bull. Environ. Contam. & Toxicol. 12(3):346-354.
Ref. 84. Cherry, A., L. Hopson, T.A. Nevin, and J.A. Lasater. (1970). The Relationshipof Coliform Populations to Certain Physico-Chemical Parameters in the Indian River-Banana River Complex. Bull. of Environ. Contam. & Toxicol. 5(5):447-451.
Ref. 85. Young, D.K., M.A. Buzas, and M.W. Young. (1976). Species Densities ofMacrobenthos Associated with Seagrass: A Field Experimental Study of Predation. J.Mar. Res. 34(4):577-592.
Ref. 86. Norman, E.M. (1976). An Analysis of the Vegetation at Turtle Mound. Fla. Sci.39(1):19-31.
Ref. 87. Schmalzer, P.A., and C.R. Hinkle. (1990b). Geology, Geohydrology and Soilsof Kennedy Space Center: A Review. NASA Tech. Memorandum # 103813.46 pp.
Ref. 88. Grizzle, R.E. (1988). Distribution and Abundance of Commercially ImportantMolluscan Shellfish in Saline Waters of the Canaveral National Seashore. Ctr. for
Coastal & Environ. Studies. 15 pp.
Ref. 89. Provancha, J.A., and M.J. Provancha. (1988). Long-Term Trends inAbundance and Distribution of Manatees (Z.r._ manatus) in the NorthernBanana River, Brevard County, Florida. Mar. Mammal Sci. 4(4):323-338.
Ref. 90. Provancha, J.A., and M.J. Provancha. (1989). Summary of 1987 and 1988Manatee Aerial Surveys at Kennedy Space Center. NASA Tech. Memorandum #102783. 17 pp.
81

Ref. 91. Reed, J.W. (1979). Cape Canaveral Sea Breezes. J. Appl. Meteorol. 18:231-235.
Ref. 92. Patterson, S., R. Dawson, D. Dottavio, G. Shelton, and B. Coffland. (1990).National Park Service Southeast Regional Office. Remote Sensing and GIS Program:Southeastern Barrier Islands and South Florida. Dept. Environ. Sci., NPS SE RegionalOffice, NASA Ames Res. Ctr. 22 pp.
Ref. 93. Harp, J.C., B.D. Poole, D.C. Hell. (1985). Comprehensive Shellfish GrowingArea Survey Northern Brevard County Body (A). Fla. Dept. Nat. Resour. 55 pp.
Ref. 94. Heil, D.C. (1986). Evaluation of Trace Metal Monitoring in Florida Shellfish.Fla. Dept. Nat. Resour., Division of Mar. Resour., Shellfish Environ. Assess. 186 pp.
Ref. 95. Royal, J., and B. Pierce. (1990). Annual Reappraisal of the South VolusiaCounty Shellfish Harvesting Area. Fla. Dept. Nat. Resour., Shellfish Environ. Assess.Sect. 18 pp.
Ref. 96. Poole, B.D., and J.C. Harp. (1985). Comprehensive Shellfish Growing AreaSurvey for South Volusia County. Fla. Dept. Nat. Resour., Shellfish Environ. Assess.Sec. 90 pp.
Ref. 97. Edward E. Clark Engineers-Scientists, Inc. (1987). KSC SubsurfaceHydrology and Groundwater Survey. Vol. IV. The Area Groundwater Survey Program.For: Eng. Dev. Directorate (NASA) 210 pp.
Ref. 98. Witzell, W.N., (ed). (1985). Ecology of East Flodda Sea Turtles. Proceedingsof the Cape Canaveral, Florida Sea Turtle Workshop Miami, Florida, February 26-27,1985. U.S. Dept. Commerce NOAA Tech. Rept. Nat. Mar. Fisheries Serv. #5. 80 pp.
Ref. 99. Stout, I.J. (1980). A Continuation of Base-Line Studies for EnvironmentallyMonitoring Space Transportation Systems at John F. Kennedy Space Center. VolumeI of iV: Terrestrial Community Analysis. KSC TR 51-2, Vol. I, NASA Contract Rept. #163122 603 pp.
Ref. 100. Snelson, F.F., Jr. (1980a). A Continuation of Base-Line Studies forEnvironmentally Monitoring Space Transportation Systems (STS) at John F. KennedySpace Center. Vol. III of IV. Part I: Ichthyological Studies (Lagoonal Waters). KSC TR51-2, Vol. III, Part I, NASA Contract Rept. # 163122 435 pp.
Ref. 101. Snelson, F.F., Jr. (1980b). A Continuation of Base-Line Studies forEnvironmentally Monitoring Space Transportation Systems (STS) at John F. KennedySpace Center. Vol. III, Part 2. Ichthyological Studies: Sailfin Molly Reproduction. KSCTR 51-2, Vol. III, Part 2, NASA Contract Rept. # 163122 173 pp.
Ref. 102. Ehrhart, L.M. (1980a). A Continuation of Base-Line Studies for
Environmentally Monitoring Space Transportation Systems at John F. Kennedy Space
82

Center. Vol. IV, Part 1, Threatened & Endangered Species of KSC: Marine Turtles.KSC TR 51-2, Vol. IV. Part 1, NASA Contract Rept. # 163122 405 pp.
Ref. 103. Ehrhart, L.M. (1980b). A Continuation of Base-Line Studies forEnvironmentally Monitoring Space Transportation Systems at John F. Kennedy SpaceCenter. Vol. IV, Part 2, Threatened & Endangered Birds & other Forms. KSC TR 51-2,Vol. IV, Part 2, NASA Contract Rept. # 163122 141 pp.
Ref. 104. Grizzle, R.E. (1990). Distribution and Abundance of Crassostrea virginica(Gmelin,1791) (Eastern Oyster) and Mercenaria .&E_2..(Quahogs) in a Coastal Lagoon.J. of Shellfish Res. 9(2):347-358.
Ref. 105. Florida Institute of Technology. (1974). Second Annual Report to the John F.Kennedy Space Center, NASA Cape Canaveral, Florida. A Study of Lagoonal andEstuarine Processes in the Area of Merritt Island Encompassing the Space Center.Fla. Inst. Tech. Grant # NGR 10-015-008. 61 pp.
Ref. 106. Nevin, T.A., J.A. Lasater, K.B. Clark, and E.H. Kalajian. (1974). An EcologicalStudy of the Kennedy Space Center Turning Basin and Adjacent Waters. Fla. Inst.Tech. Grant # NGR 10-015-008 Rept. #6.36 pp.
Ref. 107. Erwin, K.L., and C.M. Smith. (1989). Recommendations for Future Water
Quality Programs in Volusia County, Florida. Proc. of Sixth Symp. on Coastal andOcean Manage. p. 3866-3874.
Ref. 108. Erwin, K.L. (1988a). Volusia County Coastal Management Element, VolusiaCounty Estuarine Water Quality. Kevin L. Erwin Consulting Ecologist, Inc. For VolusiaCounty. 94 pp.
Ref. 109. Sedway Cooke Associates, (Prime Contractor). (1988). Volusia CountyCoastal Management Element, Summary of Findings. Volusia County Planning andZoning and Ponce De Leon Port Authority. 133 pp.
Ref. 110. Hine, A.C. (Draft). Evaluation of the Volusia County Coastline: DominateProcesses, Shoreline Change, Stabilization Efforts, and Recommendations for BeachManagement. Dept. of Mar. Sci. Univ. S. Fla. 38 pp.
Ref. 111. Erwin, K.L. (1988b). Volusia County Estuarine Water Quality ExecutiveSummary Subtask 4.6. Kevin L. Erwin Consulting Ecologist, Inc. 14 pp.
Ref. 112. Leenhouts, W.P., and J.L. Baker. (1982). Vegetation Dynamics in DuskySeaside Sparrow Habitat on Merritt Island National Wildlife Refuge. Wild. Soc. Bull.10(2):127-132.
Ref. 113. Scholl, J.E., J.P. Heaney, W.C. Huber, and D.S. Graham. (1981). WaterQuality Analysis of the Halifax River, Florida. Water Resour. Bull. 17(4):716-717 (WRB16(2):285-293).
83

Ref. 114. Breininger, D.R., and R.B. Smith. (1990). Waterbird Use of CoastalImpoundments and Management Implications in East-Central Florida. Wetlands10(2):223-241.
Ref. 115. Johnson, T.W. (1974). A Study of Mottled Duck Broods in the Merritt IslandNational Wildlife Refuge. Wilson Bull. 86(1):68-69.
Ref. 116. Menon, M.P., G.S. Ghuman, C. Obi., Emeh. (1979). Trace Element Releasefrom Estuarine Sediments of South Mosquito Lagoon near Kennedy Space Center.Water, Air, and Soil Pollution 12:295-306.
Ref. 117. Henwood, T.A. (1987). Movements and Seasonal Changes in LoggerheadTurtle Caretta caretta Aggregations in the Vicinity of Cape Canaveral, Florida (1978-84). Biol. Conserv. 40:191-202.
Ref. 118. Carr, A., L. Ogren, and C. McVeao (1980). Apparent Hibernation by theAtlantic Loggerhead Turtle Caretta caretta off Cape Canaveral, Florida. Biol. Conserv.19:7-14.
Ref. 119. Sweet, H.C., J.E. Poppleton, A.G. Shuey, and T.O. Peeples. (1980).Vegetation of Central Florida's East Coast: The Distribution of Six VegetationalComplexes of Merritt Island and Cape Canaveral Penninsula. Remote Sensing ofEnviron. 9:93-108.
Ref. 120. Mendonca, M.T., and L.M. Ehrhart. (1982). Activity, Population Size andStructure of Immature _ m,Y.._6_ and Care_a caretta in Mosquito Lagoon,Florida. Copeia 1:161-167.
Ref. 121. Ehrhart, L.M. (1983). Marine Turtles of the Indian River Lagoon System. Fla.Sci. 46(3/4):337-346.
Ref. 122. Down, C. (1983). Use of Aerial Imagery in Determining Submerged Featuresin Three East-Coast Florida Lagoons. Fla. Sci. 46(3/4):355-362.
Ref. 123. Mook, D. (1983b). Indian River Fouling Organisms, A Review. Fla. Sci.46(3/4):162-167.
Ref. 124. Ehrhart, L.M. (1976). A Study of a Diverse Coastal Ecosystem on the AtlanticCoast of Florida. Final Rept. to NASA at the Kennedy Space Center Grant # NGR 10-019-004. 182 pp.
Ref. 125. Hersh, S.L., D.Ko Odell, E.D. Asper. (1990). Bottlenose Dolphin MortalityPatterns in the Indian/Banana River System of Florida. In: The Bottlenose Dolphin.Leatherwood, S., and R. Reeves, (eds). Acadmic Press, Inc., Harcourt BraceJovanovich Publ. p.155-164.
Ref. 126. Barros, N.B., and D.K. Odell. (1990). Food Habits of Bottlenose Dolphins inthe Southeastern United States. In." The Bottlenose Dolphin. Leatherwood, S., and R.Reeves, (eds). Acadmic Press, Inc., Harcourt Brace Jovanovich Publ. p. 309-328.
84

Ref. 127. Odell, D.K., and E.D. Asper. (1990). Distribution and Movements of Freeze-Branded Bottlenose Dolphins in the Indian and Banana Rivers, Florida. In.__.TheBottlenose Dolphin. Leatherwood, S., and R. Reeves, (eds). Acadmic Press, Inc.,Harcourt Brace Jovanovich Publ. p. 515-540.
Ref. 128. Seaman, W., Jr., (ed). (1985). Florida Aquatic Habitat and Fishery Resources.Fla. Chap. Am. Fisheries Soc. 543 pp.
Ref. 129. Smith, N.P. (1990). Longitudinal Transport in a Coastal Lagoon. Estuarine,Coastal and Shelf Sci. 31:835-849.
Ref. 130. Provost, M.W. (1969). Ecological Control of Salt Marsh Mosquitoes with SideBenefits to Birds. Tall Timbers Conf. on Ecol. Anim. Control by Habitat Manage. p. 193-206
Ref. 131. Montague, C.L., A.V. Zale, and H.F. Percival. (1984). Photographic Analysisof Natural and Impounded Salt Marsh in the Vicinity of Merritt Island, Florida. Tech.Rept. #11 Fla. Coop. Fish & Wildl. Res. Unit & Systems Ecol. & Energy. 19 pp.
Ref. 132. Leenhouts, W.P. (1985). Soil and Vegetation Dynamics in a Rotary DitchedMosquito Control Impoundment on the Merritt Island National Wildlife Refuge. Proc.Twelfth Annu. Conf. Wetlands Restoration and Creation. p. 181-192.
Ref. 133. Montague, C.L., A.V. Zale, and H.F. Percival. (1987). Ecological Effects ofCoastal Marsh Impoundments: A Review. Environ. Manage. 11(6):743-756.
Ref. 134. Bidlingmayer, W.L. (1982). Surveying Salt Marsh Mosquito ControlImpoundments in Central Florida. J. Fla. Anti-Mosquito Assoc. 53:4-7.
Ref. 135. Breeland, S.G., and J.A. Mulrennan, Jr. (1983). An Overview of OrganizedMosquito Control in Florida. Mosquito News 43(3):276-280.
Ref. 136. Provost, M.W. (1959). Impounding Salt Marshes for Mosquito Control and itsEffects on Bird Life. Fla. Nat. 32:163-170.
Ref. 137. Provost, M.W. (1977). Source Reduction in Salt-Marsh Mosquito Control:Past and Future. Mosquito News 37(4):689-698.
Ref. 138. Trost, C.H. (undated). Study of Wildlife Usage of Salt Marsh on East Coast ofFlorida before and after Impoundment for Mosquito and Sandfly Control. U.S. Dept.Interior, Fish & Wildl. Serv. Contract # 14-16-0008-623. 30 pp.
Ref. 139. Sykes, P.W., Jr. (1980). Decline and Disappearance of the Dusky SeasideSparrow from Merritt Island, Florida. Am. Birds 34(5):728-737.
Ref. 140. Trost, C.H. (1968). Dusky Seaside Sparrow. U.S. Natl. Mus. Bull. 237:849-859.
-- 85
Ref. 141. Gardner, T. (1990). Mosquito Lagoon Aquatic Preserve Management Plan(Draft). Bureau of Submerged Lands and Preserves. 93 pp.
Ref. 142. Mehta, A.J., and H.K. Brooks. (1973). Mosquito Lagoon Barrier Beach Study.Shore and Beach 41(2):26-34.
Ref. 143. Wilcox, W.A. (1897). Commercial Fisheries of Indian River, Florida. Rept. ofthe Commissioner, U.S. Comm. Fish and Fisheries, Pt. 22:249-262.
Ref. 144. Flint, R.W. (1985). Long-term Estuarine Variability and Associated BiologicalResponse. Estuaries 8(2A):158-169.
Ref. 145. Edward E. Clark Engineers-Scientists, Inc. (1986). Environmental ResourcesDocument John F. Kennedy Space Center, NASA. For: Eng. Dev. Directorate KSC,Florida. Contract # NAS10-11293. 489 pp.
Ref. 146. Helsle, D.R. (1990). Less than Obvious Statistical Treatment of Data belowthe Detection Limit. Environ. Sci. Technol. 24(12):1767-1774.
Ref. 147. Provancha, J.A., and M. Willard. (1984). Seagrass Bed Distribution and
Composition. Fla. Sci. 47(Supplement #1):23.
Ref. 148. Provancha, J.A., E. Asper, and D. Odell. (1983). Live Capture, Marking and
Resighting of Free-ranging _ _ in the Indian River Lagoon System,Florida. Fla. Sci. 45(Supplement #1):28.
Ref. 149. Zimmermann, C.F., J.R. Montgomery, and P.R. Carlson. (1985). Variability ofDissolved Reactive Phosphate Flux Rates in Nearshore Estuarine Sediments: Effectsof Groundwater Flow. Estuaries 8(2B):228-236.
Ref. 150. Clapp, D. (1987). Overview of Physiographic and Surface DrainageFeatures, Chapter 1. In: Indian River Lagoon Joint Reconnaissance Report. Steward,J.S., and J.A. VanArman, (eds). p. 1-27.
Ref. 150. Rao, D. (1987). Surface Water Hydrology, Chapter 2. In." Indian RiverLagoon Joint Reconnaissance Report. Steward, J.S., and J.A. VanArman, (eds). p. 1-40.
Ref. 150. Steward, J.S., and J.A. VanArman, (eds). (1987). Indian River Lagoon Joint
Reconnaissance Report. St. Johns River Water Manage. Dist. and S. Fla. WaterManage. Dist. 430 pp.
Ref. 150. Toth, D. (1987). Hydrogeology, Chapter 4. In." Indian River Lagoon JointReconnaissance Report. Steward, J.S., and J.A. VanArman, (eds). p. 1-13.
Ref. 150. Windsor, J.G., and J. Steward. (1987). Water and Sediment Quality, Chapter5. In." Indian River Lagoon Joint Reconnaissance Report. Steward, J.S., and J.A.
VanArman, (eds). p. 1-58.
__ 86

Ref. 151. Lee, V., and S. Olsen. (1985). Eutrophication and Management Initiatives forthe Control of Nutrient Inputs to Rhode Island Coastal Lagoons. Estuaries 8(28):191-202.
Ref. 152. Provancha, M.J., P.A. Schmalzer, and C.R. Hall. (1986). Effects of theDecember 1983 and January 1985 Freezing Air Temperatures on Selected AquaticPoikilotherms and Plant Species of Merritt Island, Florida. Fla. Sci. 49(4):199-211.
Ref. 153. Provost, M.W. (1967)oManaging Impounded Salt Marsh for Mosquito Controland Estuarine Resource Conservation. In." Proc. of the Louisiana State Univ. Marshand Estuary Manage. Symp. J.D. Newson, (ed). LA. State Univ. Contin. Educ. BatonRouge, LA. p. 163-171.
Ref. 154. Kenworthy, W.J., and D. Haunert. (1991). Results and Recommendations of aWorkshop Convened to Examine the Capability of Water Quality Criteria, Standardsand Monitoring Programs to Protect Seagrasses from Deteriorating WaterTransparency. Rept. to NOAA's Coastal Ocean Prog. Estuarine Habitat Studies. 151PP.
Ref. 155. Schmalzer, P.A., and C.R. Hinkle. (1990a). Flora and Threatened andEndangered Plants of John F. Kennedy Space Center, Florida. NASA Tech.Memorandum #102791. 68 pp.
Ref. 156. Southeastern Wildlife Services, Inc. (1979). Vegetation of a Selected Sectionof Canaveral National Seashore. Rept. for NPS SE Regional Office, Atlanta, GA. 13PP.
Ref. 157. Rey, J.R., and T. Kain. (1989). A Guide to the Salt Marsh Impoundments ofFIonda. Univ. Fla., IFAS, Fla. Medical Entom. Lab., Vero Beach, FL. ISBN # 0-9615224-3-7. 447 pp.
87
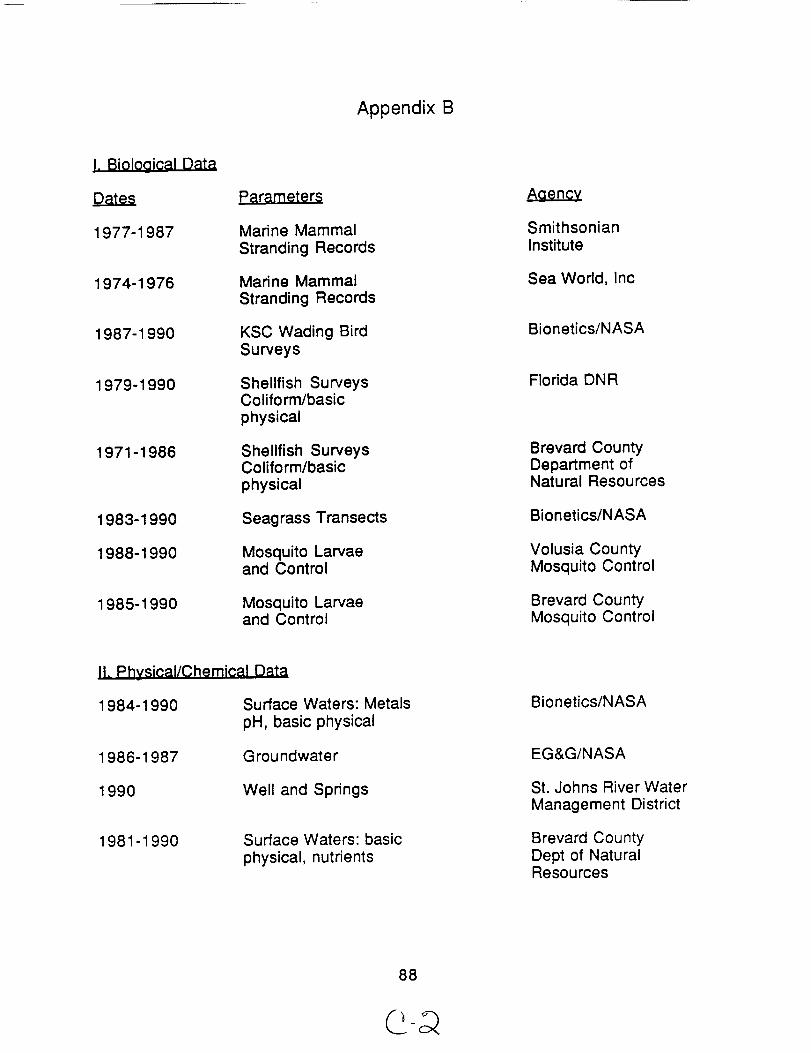
Appendix B
I. Bioloaical Data
Dates
1977-1987
1974-1976
1987-1990
1979-1990
1971-1986
1983-1990
1988-1990
1985-1990
param eters
Marine Mammal
Stranding Records
Marine Mammal
Stranding Records
KSC Wading BirdSurveys
Shellfish SurveysColiform/basic
physical
Shellfish SurveysColiform/basic
physical
Seagrass Transects
Mosquito Larvaeand Control
Mosquito Larvaeand Control
I1. Physical�Chemical Data
1984-1990 Surface Waters: Metals
pH, basic physical
1986-1987 Groundwater
1990 Well and Springs
1981-1990 Surface Waters: basic
physical, nutrients
Agency
SmithsonianInstitute
Sea World, Inc
Bionetics/NASA
Florida DNR
Breva_Coun_Depa_mentofNatuml Resoumes
Bionetics/NASA
Volusia CountyMosquito Control
Brevard CountyMosquito Control
Bionetics/NASA
EG&G/NASA
St. Johns River Water
Management District
Brevard CountyDept of NaturalResources
88

Appendix B (continued)
1970-1989
1985-1990
1989-1990
1970-1990
1984-1988
Surface Waters,Storet:
basic physical, pHcoliform, biological
diversity, flow, waterquality indices, rankings
Surface Waters/Shell-fish: Fecal coliform,
basic physical
Surface Waters:basic
physical, nutrientscoliform
STORET Water Quality Data
Surface Water: lagoonand impoundments, basicphysical and water level
Florida DER
Florida DNR
Volusia CountyDivision ofNatural Resources
EnvironmentalProtection
Agency/Florida DER
Merritt Island National
Wildlife Refuge, US Fishand Wildlife Service
89

Appendix C
List of Individuals Contacted for Phase I.
John Stiner/Canaveral National Seashore, NPS, Titusville, FL.
Derek Busby/National Estuaries Program, EPA, Melbourne, FL.
Bob Day/National Estuaries Program, EPA, Melbourne, FL.
Conrad White/Dept. of Natural Resources, Brevard County, Merritt Island, FL.
Karen Durhing/Division of Natural Resources, Volusia County, Deland, FL.
Mark Freidemann/Division of Surface Waters, Florida DER, Tallahassee, FL.
Liz Ulmer/Bureau of Information, Florida DER, Tallahassee, FL.
Brian Pierce/Shellfish Environmental Assessment Section, Florida DNR, Titusville, FL.
Daniel Odell/Southeastern Marine Mammal Stranding Network, Sea World ResearchInstitute, Orlando, FL.
Paul Haydt/Volusia County Mosquito Control, Ormond Beach, FL.
Mr. Gamble/Volusia County Mosquito Control, New Smyrna, FL.
Jim Hunt/Brevard County Mosquito Control, Titusville, FL.
Bill Sargeant/Environmental Sciences, St. Johns River Water Management District,Palatka, FL.
Dr. Franklin Snelson/University of Central Florida, Orlando, FL.
Diane Barile/Marine Resource Council, Melbourne, FL.
Fred Morals/St. Johns River Water Management District, Palatka, FL.
Brian Poole/Aquatic Preserves/Florida DNR, Melbourne, FL.
Dwight Cooley/Merritt Island National Wildlife Refuge, USFWS, Merritt Island, FL.
Ken Haddad/Floricla Marine Research Institute, Florida DNR, St. Petersburg, FL.
Randy Sleister/Division of Natural Resources, Volusia County, Deland, FL.
Christin Metzger/Harbor Branch Oceanographic Institute, Library, Ft. Pierce, FL.
9O

Appendix C (continued)
Dr. Grant Gilmore/Harbor Branch Oceanographic Institute, Ft. Pierce, FL.
Christal Wood/National Aeronautics and Space Administration, Kennedy SpaceCenter, FL.
Dr. John Morris/Florida Institute of Technology, Melbourne, FLo
Dr. Nicholas Funicelli/University of Florida, National Fisheries Laboratory, Gaineville,FL.
Dr. Doug Morrison/USFWS, National Fisheries Laboratory, Gainesville, FL.
Mark Mercadante/Johnson Controls, Cape Canaveral Air Force Station, FL.
Dr. Robert Virnstein/Environmental Sciences, St. Johns River Water ManagementDistrict, Palatka, FL.
John Dennard/'l'echnical Data Services, St. Johns River Water Management District,Palatka, FL.
Micheal Holmes/Planning, Volusia County, Deland, FL.
Dr. Kevin Erwin/Kevin Erwin Ecologist Consulting, Inc., Ft Myers, FL.
Gary Goode/Mosquito Control, Volusia County, Daytona, FL.
Rick Mann/Mosquito Control, Volusia County, New Smyrna, FL.
Joel Steward/Environmental Sciences/St. Johns River Water Management District,Palatka, FL.
-- 91

Appendix D
1.) Low altitude ohotograohy:Years EX._1
1989 CIR
1986 CIR
1984 CIR
1983 CIR
1982 CIR
1969 B/W
1958 BNV
1951 B/W
1943 B/W
scale
1"=1000'
1"=1000'
1"=1000'
1"=1000'
1"=1000'
1"=50000'
1"=20000'
1"=20000'
1"=20000'
2.) m.U2,J_m._J_.E.e,am198319891990
CIR*CIRCIR, DLG, Color, and B/W expected from NPS RemoteSensing
and GIS Program.
3.) Landsat ScenesYears
1987 TM
1989 TM
1 CIR = Color lnfra Red; BNV = Black and White; TM = Thematic Mapper
* Housed at the Ground Engineering Office at KSC
92

Appendix E
FDER Water Quality Classifications and Standards(from Edward E. Clark Engineers and Scientists, in press)
93

Ul-0
i-¢
3
E_
gl
U
OO
_o00
O ¢M U
pI
00
0
U
0 0
C
,-I
..4 _._
I
_ M
C _
v
u_
INO
o
M
-,-t
,<
_ N.._
{: 0
A
v
O
_4
COE
IJ
O
O
,-4
,,-4 O @
• g
O
O
,-¢
O 41 O TM
|
,-4
oou_o.
P4
U_0
U"4
el
E
0_._
0U
0,-4 C3
0
U
0
O•,-4 >_
U
P4
E
A
v
E
k
m
v
C
N
_n
O _1e) _c_
O
• _
_E
E
_,4
_4 C0 _'_
r'-. _n
C
E
0
E
0i--i
u'l >.4
_= I..i-,,-IE
P,
U
_n0 t_
0 i.I
rn H
94
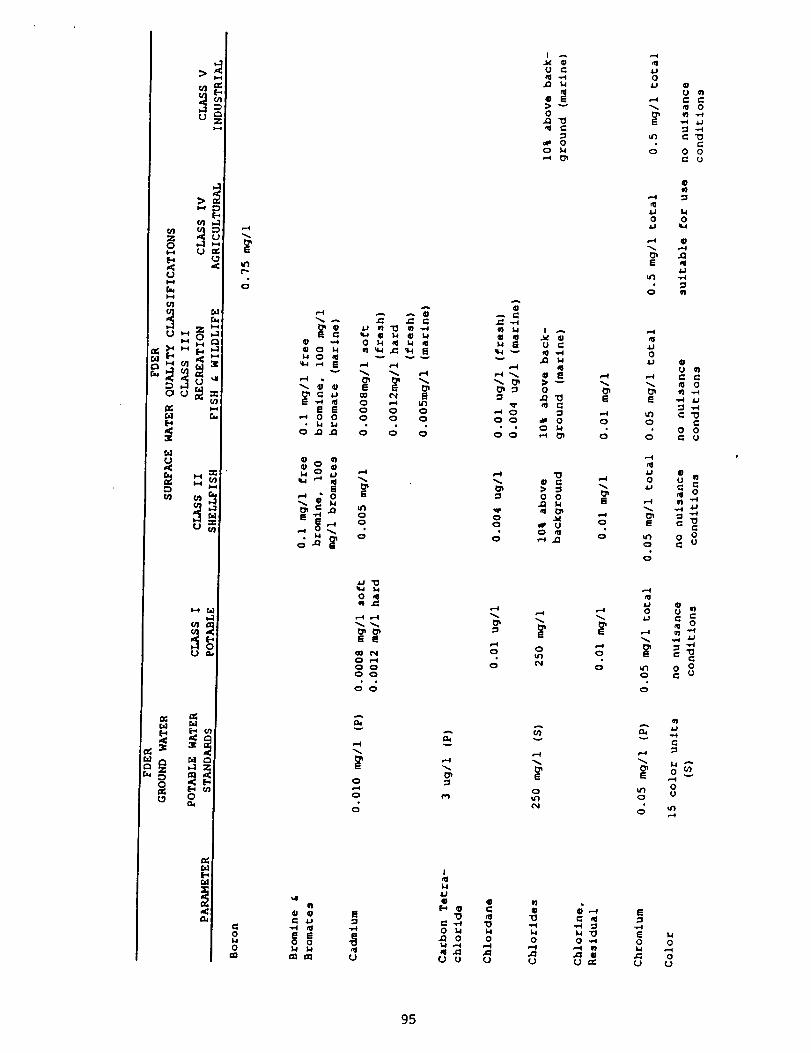
oi
U
r_i-¢¢n
¢n ¢n
u
c
u
,'e
u')
o
_ @ ,u un "_ ¢n -,.-¢E C
t_
E E o o o0 0 0 0 0
• _ I,a0 .,_ .,_ 0 0 0
0•
"_ o
._,o oo_
"__._0 _1
r.,
,."4
S E
• 0 _1
o o
o o
AD_
,,--i
o
o
An.
r_
@A,-, .._
vv
oo
o
o
o
_J
• E
0
C
0
I
U
.Q k4
e
0.Q'O
_P 00
• C
0 0
Oo
0
v
oul(",4
_n
0
0
_nS
o
o
4J0
u_
0
0
E
u'l
o
_J0
_.;
E
0
0
,-.¢
_J0
o
o
0
o
o
Ae_
E
o
o
0 mC Cm 0
0 0e. U
e
0
@
t_
_J
0 mC: C
0¢n -,-4
0 0U
'.,4 '_
C
v
0U
elg •
o Eo o
0 _1
E
U
I
gE-_ •
00
t_ U
@C
0
U
0,-¢
U
-,,-I
0,-4
U
E:3
g0s4
0
0
0L)
95

u3C3
0
U
_ .
!°0
U _o
!.0
v
0
0UC0
Z
0
0U
,-4
g
u_c2o
o
P4
u300
0
00
0
.-4
00
0
0 ::3o
• 00 0
c3o0 0
00
0
0o *
• 00
0
I0
0 II
I
e-.4
u3
o
u_
0
u3
0
url
o
u3
o
Ii.i.ic_
C_I.i
Ci
00o ,-4u3
A
0
00u_
0
,-40
-_4C_
0
E
0 00 0
0 0
00
0
_n
if30o
c;
0
r_d
:3
_P0
0
00
0
_p00
0
0
_n"O
L_0
• :3
0
i.,I0 0
v
0
u_
g
ffl
v _
•-4 _ _
I
g _
..4
0
C_
0
E_o 0
96

o
U
b-* =
[-
<
r_
U
o
o
r-I
o
o
c_
O
O
O
Ev
C3
_no
o
ur3o
o
A
@
o o o
oo
o
o o
o
o
o
c3
t_o
oc3
o
@
v
o o _
o o
o o
o
o
o
o
o
c3
o
o
c3
o
o
0_
o
<:3
0_
o
v
r_
ir_
r_
o°O C_ O
r_
o O
_J
0
0
O
O O
A
v
O
O
C
r_ G
O
O
0_
000
0
A
E
0 00
0 0
4;
;>.,C
U
G
0
00
0
,..-I
I
>,
0,4
,s"
1.4-,..4
Z
I=
0i.-4
I=
0i--4
Z
_J
-,-4
s_0
Z
0
_4_2_4
97

r_
U
o
r_
ul
_3
_ 0 0,-_ 0 c: "0
0
_o
_-4 _ 0 0•"_ 0 _ "0
0IB o_
rj _j _j_1 -,-t 0 Q
0
_J
:)
_J.,-I
v3
o_
!
o
u3
O_g
oo
o
uO
00 o
_'_ _-_ _ -,_ ._ G
_'_ _ _ 0 _ _J _
o=
0
_0 _1
O0G 0 o _ 0
°
N
g
E
m
0
0 ul
_3
0
_ 0 0 0
_ 0 0
0 0 _ _ 4_
A
Eo voo
o
o0o
o
. ,,-I
0 r._
0
I
0r_
0._ 0
M
,-4
O, O,
U') U_
d#
t.d
UO UI3
0 0 _ _1
0 0 _ 0u_
0 0
..
o o
°- c3
r_
(J_.ur3
wo
0 _1
"0:3 ,-_
98

2
U
i..d
°!
w
Q _0 _0 0
0 0
u_00000
0
E
0000
0
0
@
0_D
0
@
@
>
@-,,-I1.1
@-vl
@
1.4¢11>
QU
U
--4 0O U@Q.
v
,-4
0u_
¢1@
,-4
,-4
0
,.-4
0,-4
,-40
@
@ tn
:3
¢1
O 0e. -,.4_1 J.J01 ..,4
-,-4 '13
0O
0
C@ 0UC
0C U
0G
@
@ 0O
0
0
0
@
@ O
OU
0
_10U ,,_
-,4
OU
O
@
_J
@
t
,-4
I0 @I.i C0 @
@
@E._
I
4_
0 >
ee0 0
I
o
o o
t
1,4
0>
0 0
_J
@>
0
-,-I
@
0
e.4
O_
0
0
ooo
ooo
_-4
@C@
O.
0
0 C:30
C
O_
0 0
_n
O
B o
_4o
G
O O
U
E o
O
@
o.
¢:n
ooc_
_J
01,4
I 0uc:
- O_=4
99

1-4
o
I"4eL.I"4
I_ ¸
=.3 3
o
0 •
O _
U •
W
e_v
O,-4
O
;.4E-,
0..Q
0
Z U
c_ .Q(,q
e
0 "0.Q G
0_3 _4
U
O'O
0
U
@>0"0
0
0_3
0
Um
IN
lJ
o_4
r'- c_o _ ..-i
o
@u •
@ ,-4
o
• -,-4 IP
-|
I i:!
W O -,-4O
• :3_ _ ,..4
_ @ I.I
®
v v
WO
U
,,.-4U
G G
W
o_
W ,um
U_
_r _n
-.-4
• -,..IC3e
•,.4 w
_ O•,'4 U
g _4 _
_Nv _
O
U
e
iU
U
0ol
I00

Appendix F
Annotated List of Fish Species from the Northern Part
of the Indian River Lagoon System
101

F'AMILY CAnCIIAr_IIINIDAE- requie.t _harks
I. Carcharhlnus leuca_ (bull _hark).
Mesolzaline. open In_(wm: freq,ent (Snelson and Williams, 1981).9_. Carcharhhm._ llmbatus (hlacktip shark).
Mesohaline: open lagoon, abundance unknown but probably occasional andseasonal (Snelson and Williams, 1981).
3. Carcharhhlus plumbem (sandbar shark).
Mesohallne: open lagoon: rare (Snelson and Williams, 1981).
4. Negaprlon brevirostrL_ (lemon shark).Mesohaltne: open lagoon: occasional (Snelson and Williams, 1981).
FAMILY SPHYnNIOAE--hammerhead sharks
5. Sphyrna lewt,i (.scalloped Immnwrhead).Mesohaline: open lagoon: occasional (Snelson and Williams, 1981).
FAMILY Pms'nDA_-- sawfisbes
8. Pr_lts pectinata (smalltooth sawfish).
Once frequent in the lagoons but no recent records (Snelson and Williams, 1981).
FAMILY DASYATIDAE-- stingrays
7. Da.waIL, amert('ana (southern stingray).Mesohaline: open lago_m: occasional (Snelson and Williams, 1981).
8. DasyatL, sabi.a (Atlantic stingray).Mesohaline: open lag_m., lagcmn perimeter; common (Snelson and Williams,
1981).9. Da_at£, sayt {Idunttu_e slingra.v).
Mesohaline: open lag_.l, lagoon perimeter i common (Snelson and Williams,1981).
10. Gymnura mtcrura (smooth hulh,rflv ray).Mesohaline: open lagoon: occasional (Snelson and Williams, 1981).
FAMILY MYLIOBATIDAE -- eagle rays11. AetobahL* .arinart (spotted en_le ray).
Mesohaline: open lag.on: ,_"casionai (Snelson and Williams. 19RI).12. Rhinopfera bnncLvus (cownose ray).
Mesohaline: open lagoon: frequent but seasonal (Snelson and Williams, 1981).
FAMILY LEPISO.'rrEIDAE-- gars13. LepLsosteu.,t plalyrhincus (Florida gar).
. Fresh, oligohaiine: ditches, ponds, hnpoundments: frequent.
FAMILY AMtlDA£-- bowfins
14. Amta calva (howfin).Fresh: ponds: occasional.
FAMILY ELOP1DAE-- tarpons15. Elops sattrtz_ (ladyfish).
Oligohaline, mesohaline: open lagoon, lagoon perimeter, mar.shes, ditches, im-
poundments; frequent.18. Megalops atlanltcm (tarpon).
Mesohaline, olig.haline: open lagoon, marshes,, ditches, impoundments: occa-sional; larger Individuals f..nd in open lagoon areas, concentrating aro.nd heatedpower-plant effluent in wi.ler: small .individuals occasionally found in hrackishditches, creeks, and impo.mhnents, although apparently not so commonly as furthersouth (Gilmore, 1977a).
102

FAMILY ALBUUO^e-- bonefishes
17. Album _',lpc_ (bonefish).Mesohaline: open Jag(gin: rare; 1 recently transformed i_ldividual seined in
Banana River and 1 juvenile from FP&L site on Indian River: apparently more com-
mon further south in lagoon system (Gilmore et al., 1978).
FAMILY ANGU1LLIDAE--freshwater eels
18. Anguilla rostrata (American eel).Mesohaline, possibly oligohaline: open lagoon, possibly ditches; abundance tin-
known but probably occasional: the sampling procedures employed were not idealfor collecting eels.
FAMILY OPHICtITIIIDAE-- snake eels
19, MyrophL_ punctatus (speckled worm eel).Mesohaline: open lagoon: abundance unknown but probably frequent: most
captures at night, when relaUvely little sampling was conducted.
20. Ophichthu._ _omesi (shrimp eel),Mesohaline: open lagoon: probably rare (Snelson, 1981).
F^MtLY CLur'_o^_-- herrings21. Brevoortia .,mithi (.vellowfin menhaden).
Mesohaline: open lagoon: common.22. Brevoortia tyra,mL, (Atlantic menhaden).
Mesohaline. open lagoon, frequent: notably less abundant than B. smithi: puta-tive hybrids hetween the 2 meuhaden _eci_ not uncommon (Dahlberg, 1970).
23. Dorosoma cepedianum (gizzard shad).
Mesnhaline. olitohaline, fr_h: open lagoon, ditches, impoundments: occasional:collected sporadically in wide variety of habitats: normally considered a freshwater
species but found at salinitie_ _lp to 37 ppt in Texas (Simmons, 1957)..24. Harengula iaguana (scaled sardine).
Mesohaline: open lagoon: abundant: prior.to mid-1970s, this species was namedltarengula pensacolae (Whitehead. 1973).
25. Opi, thonema oeli, um (Atlantic thread herring).Mesohaline: open latex)n: common.
FAMILY ENCRAULmAE -- anchovies
9.6. Anchoa cuha,a (Cuban ancho_,.'y).
Mesohaline: open lagoon: t_."ea.sional. The relative abundance of the 3 primar?'anchovy specie_ in the study area is illustrated by trawl collections made in the st,m-
iners of 1979 and 1980. The total catch of 93,244 anchovies was apportioned as fol-lows: 92,558 (99.26%) A. mitchilli. 665 (0.71%) A. he'psettt_, and 21 (0.02%) A.cuba_!a.
27. Anehoa hepsefu._ (_triped am.hovy).
Mesohaline: open latr.,,m: frequent: widt.'_pread but never taken in large numbers.28. Anchoa mitchilli (bay anchovy).
Memhaline: open la_zoon, lagoon perimeter: abundant: the most abundantmarine fish in study area.
29. Anchoa na.*uta (Iongnose anchovy).
Mesohaline: open lags,m: rare: a single specimen taken in April 1978 in MosquitoLagoon.
FAMILY SYNODONTIDAE -- lizard fishe_
30. Synodus ]oeten., (inshore lizar(llrish).Mesohaline: open lagoon: occasional.
FAMILY CYP1RINIDAE-- minnows
31. Notemlgo,,s cr!t._oleuca._ (golden shiner).Fresh; ponds, impo, mdment._, ditchm: ft:equent; taken oldv in permanent bodies
of water.
103

FAMILY CATt'3STOMIDAE -- SllCk(_'rs
32. Erinlyzon sucetta (lake chubs,cker).
Fresh: ponds, i,npo,ndments, ditches: frequent: taken only in permanent bodiesof water around dense vegetation.
FAMILY ICTALUPJDAE--bullhead catfishes
33. lctaluru._ natalL_ (yellow bullhead).
Fresh; ponds, impoundments, ditches; abundance unknown but probably occa-sional; because suitable sampling procedures were not frequently employed, collection
records probably underrepresent abundance of this species on Merritt Island.
FAMILY AmtnAE-- _a catfishes
34. AritL_ felL, (hardhead catfish).
Mesohaline: open lagoon: common.35. Bagre nlarintt,_ (gafftopsail catfish).
Mesohaline. open lagoon: frequent.
FAMILY BATRACIIOIDIDAE-- toadfishes
36. Op.,antL, tau (oyster toadfish).
Mesohaline, open lagoon, lagoon perimeter; frequent.
FAMILY COBIE_OCIDAE-- ctingfishes37. Cobte_ox strtamo_rt_, (skilletfish).
Mesohaline: open lagoon: abundance unknown but probably frequent: because
of its habit of clinging to and hiding under objects, my capture records, primarily withnets, probably underrepresent abundance of this species.
FAMILY OPIIIDllDAE-- tusk-eels
38. Ophidton margtnatum (striped tusk-eel).Me_ohaline: open la£(_m: rare (Snelson, 1981).
FAMILY EXOCOETInAE-- flyin_fishe_
39. Cypselurus melanurrL_ (Atlantic flyingfish).
Mesohaline: open la_toon: rare: a single individual fo.nd at FP&L plant on IndianRiver, Jul.v 1979: this species wa._ referred to a._ CypselurtL, heterurrt, prior to 1970(Cibbs and Staiger, 1970).
40. ltyporhamphtt_ unifit_riatus (halfl'mak).
Mesohaline: open lal_oon: ¢xceasional; encountered infrequently but in largeschools.
FAMILY BELONIDAE-- needlefishes
41. Strongylura marfna (Atlantic needlefish).
Oligohaline, mesohaline: open lagoon, lagoon perimeter, marshes, ditches, im-
poundments: oecaxional: not collected in freshwater habitats on Merritt Island (c.f.,Herald and Strickland, 1949: McLane, 1955: Tagatz, 1968).
42. Strongylura notata (redfin needlefish).
Oligohaline, mesohaline: open lagoon, lagoon perimeter, marshes, ditches, im-
poundments: common: the most abundant of the 3 needlefish species in study area(Snelson and Bradley, 1978).
43. Strongylura tf_'tlUCtt (timtlctl).
Mesohaline: open lagoon, lagoon perimeter: rare: a single specimen collected
October 1976 in Banana River near Port Canaveral: Schooley (1980) reported a singlespecimen from Mosquito Lagoon. Because of the nature of the diagnostic characters
• (Coilette, 1968), it is difficult to distinguish S. ttmucu and S. marina specimens lessthan 30 mm standard length. Nevertheless, careful evaluation of all large specimensavailable demonstrates that S. timucu is quite rare.
104
FAMILY CYPmNODONTIDAE-- killifishes
44. Cypri,odon variegatus (sheepshead minnow).Oligohaline, mesohaline: impoundments, ditches, marshes, occasionally lagoon
perimeter: abundant: characteristic of protected areas with sand-silt sediments; dis-tribution complementary to that of next species.
45. Floridichthys cabin (goldspotted killifish)."Mesohaline, occasionally oligohaline: lagoon perimeter, marshes: abundant; un-
like preceding species, this one never found in either impoundments or ditches onMerritt Island; characteristic of exposed, wave-washed shore zones, where bottomsediments sand-shell and vegetation sparse; occasionally trawled in open lagoon inareas with abundant drift algae.
40. Fundulm chrysottL_ (golden topminnow).Fr_h- ditches, impoundments, ponds; frequent; typical of areas with dense sub-
merged and emergent vegetation; widely distributed on Merritt Island, but nowhereabundant°
47. Funduht_ confhtentrL_ (marsh killifish).Oligohaline, occasionally mesohaline: impoundments, ditches, marshes: frequent:
although rarely ,seined, often collected in numbers in baited minnow traps: an inhabi-tant of freshwater environments on mainland (Relyea, 1975) but never collected infreshwater on Merritt Island.
48. Fundulm gra,dis (g, lf killifish).Mesohaline, oligohaline: impoundments, ditches, marshes, lagoon perimeter:
common.
49. FunduhL_ heteroclitus (mummichog).Only record from Indian River region is report by Belyea (1975) from near Edge-
water, north of my study area: the locality ts in Volusia County, not Brevard Countyas stated by Relyea.
50. Funduht_ seminolL_ (Seminole killifish),Fresh, oligohaline: Impoundments, ponds, ditches, marshes; occasional: although
ust, ally a freshwater species on mainland "(Belyea, 1975: DuBant et ai., 197_), col-lected sporadically over wide salinity range (0-25 ppt) in and around Merritt Island.
51. Ftmduhts simil_._ (Iongnose killifish).Mesohaline: lagoon perimeter: occasional.
52. ]ordanella floridae (flagfish).Fresh; ditches, ponds, impoundments: frequent: always found In small numbers:
characteristic of areas with dense submerged and emergent vegetation.53. Luca,ia Rondel (bluefin killifish).
Fresh: ponds, ditch,, impoundments; common: the. few individuals collected inbrackish waters apl_earcd to _. wafted from adjacent freshwater areas durimz periodsof high water: characteristic of habitats with abundant s, bmerged and emergent vege-tation.
54. Luca,ia pam,a (rainwater killifish).Oligohaline. mesnhaline: open lagoon, lagoon perimeter, marshes, ditches, im-
poundments: common to abundant: habitat and abundance pattern contrasts sharplywith preceding species: most abundant in shallow brackish waters where vegetationsparse or nonexistent: in open lagoons, closely associated with beds of drift algae andseagrasses: although common in essentially fresh waters of St. Johns River basin(Talzatz, 1968), collected infrequently and in low abundance in fresh waters on MerrittIsland.
FAMILY PoEctUltOAm-- livebearers
55. Gambtmia a/fini., (mosquitofish).
Fresh. oligohaline, mesohaline: virtually ubiquitous except for the open lagoonwaters: abundant.
Io5

56. iteterandria formosa (least killifish).
Fresh: ponds, impoundments, ditches; frequent; collected regularly but in towabundance in habitats where submerged aquatic vegetation was dense.
57. Poecilia latipinna (sailfin molly).
Mesohaline, oligohaline, fresh; lagoon perimeter, ditches, impoundments,marshes: abundant; rare in open lagoon areas and encountered regularly but in lownumbers in strictly freshwater; everywhere abundant in protected mesohaline andoligohaline waters, especially where submerged vegetation dense.
FAMmY ATnmUNmAr.-- silversides
58. Membras martinica (rough silverside).
Mesohaline; lagoon perimeter; occasional; collected only twice, once around
spoil island in northern Indian River and once in Haulover Canal; additional nightcollecting may prove this species to be more common than my records indicate.
59. Menidla beryllina (inland silverside).
Oligohaline, fresh; ditches, impoundments; occasional.60. Menidia peninsulae (tidewater silverside).
Mesohaline, oligohaline: lagoon perimeter, marshes, ditches, impoundments;abundant. Silverside populations associated directly with the lagoon system appearto be M. penirt_ulae. Populations from some low salinity ditches and impoundments
on Merritt Island are tentatively identified as M. beryllina. However, some popula-tions from brackishwater habitats on Merritt Island are not clearly assignable to eitherspecies on the basis of diagnostic morphological characters emphasized by Johnson(1975) and Chernoff et al. (1981), suggesting the possibility of hybridization.
FAMILY SYNONATrlIDAE-- pipefishes
81. ltippocamprLs erectu.s (lined seahorse).Mesohaline: open lagoon, lagoon perimeter; occasional: much less common than
following species.69.. ltipporampm zosterae (dwarf seahorse).
Mesohaline: open lagoon, lagoon perimeter: frequent; typically found in shallowseagraxs beds.
63. Syngnathu., louLWanae (chain pipefish).
Mesohaline: open lagoon: occasional; characteristic of deeper areas: usually col-lected by trawling in areas where little or no vegetative cover was present.
64. Sy,lomth,s scof_ellt (g_,lf pipefish).
Mesohaline. oligohaline: open lagoon, lagoon perimeter, marshes: common toabundant in seagrass beds anti drifting macroalgae (K.lczvcki et al., 1981: Mulliganand Snelson, 1982): not collected in fresh water on Merritt" Island.
FAMILY CENTIIOI"f3MIDAE-- SD(w'_ks
6.5. Centropo. mus undecimali._ (sncx,k).
Mesoimline..li_ohaline: open lagoon, lagoon lx'rimeter, marshes: frequent:
adults characteristic of deeper water, especially in dredged areas and around bridges,navigation markers, and other protective cover: juvenih_ usually in oligohaline creeks:
suffered considerable slr(_ and mortality during unusually cold winter of 1.077 (Snel-"son and Bradley. 1977: (;ilmore et al., 1978).
FAMILY SolnANH)AF -- sea I)a_,_t'-s
66. Cetropristt_ philadelphica (rock sea bass).
Mesohaline: open lagoon: rare: only 2 specimens known from study area, 1trawled near northern ond fff Indian River, 1 collected at FP&L site on lndi'an River.
67. Myctcroperea olicrott'l_i._ (_a_).
Mesohaline: open lagoon: occasional: 6 records, all from Mosquito Lagoon.FAMILY CENTRAnCIIlDAE -- s_mfishes
68. Lepotni., gtdo.,us (warmot,th).
Fresh: ditches, ponds, impc_ffndments: frequent: a secretive species typically col-
lected in (-Ir_se a._s_wiation with vegetation, overhanging brush, and other types of pro-tective _wer.
106

FAMILY
75.
FAMILY
76.
77.
FAMILY
78.
79.
80.
60. Lepomi._ .lacrochir.._(bluegill).Fresh: ponds, ditches, impoundments: common: typically found in larger, more-
permanent bodies of water.70. Lepomis mar_i,atus (d,llar sunfish).
Fresh: ponds, ditches, impoundments: occasional: a small, secretive species in-habiting shallow, weedy, littoral areas: collected at scattered localities throughoutMerritt Island.
7.1. Lepomis microlophus (redear sunfish).Fresh: ponds, ditches, impoundments; frequent: co-occurred with L. macrochirus
througho, t Merritt Island but usually less abundant.72. LepomL_ punctatus (spotted sunfish).
Fresh: ditches: rare; collected at a single site on Merritt Island, a roadside ditch
0,.5 km E. jet. llwys. 402 and 3:10 specimens were taken in 31 collections at this sitebetween November 1972 and May 1975.
73. Micropterus sahnoides (largemouth baxs).Fresh, occasionally oligohaline; ditches, ponds, impoundments: frequent; typi-
cally found in lar_er, deeper, more-permanent bodies of water.74. PomoxL_ ,igromaculatu._ (black crappie).
Fresh: impoundments: only 1 individual captured, but fishermen claim there
are _ood pop,lations in 9. freshwater impoundments.
POM ^T()MIDAF. -- I)luefish_
Pomatomtt_ sa#atrix (bl.efish).Mesohaline: open lagoon: occasional: records sporadic but from all seasons, indi-
cating this species is a year-round inhabitant.
Ec,F, nno^_- remorasEcheneLv naucrates (sharksucker).
Mesohaline: open lagoon: rare (Snelson and Bradley, 1978: Snelson, 1981).Echenei._ neucratoides (whitefin shark_ueker).
Mesohaline: open lagoon: rare (Snelson, 1981).
CAn^ ncm^ v.-iacksCaranx oral.sos (blue r.n,er).
Mes_haline: open laRoon: rare (Snelson and Bradley, 1978).
Caranx hippos (erevalle iaek).Mesohaline: open lagoon: common.
Caranx latus (horse-eye jack).Mt.'s,haline: open lagoon- occasi(mal- appears to travel in schools with preceding
species, but always much legs abundant.
81. Chloroscombru._ ehrysurrt, (Atlantic bumper).Mesohaline: open lagoon: occasional.
82. OIt_oplites saurus (leatherjacket).Mesohaline: open lag_m, lagoon perimeter; frequent: y_ung often float motion-
less iust below s.rfaee, mimickinR drifting pieces of seagr_t_s or algae.
83. Selene setapinnis (Atlantic moonfish).
Mesohaline: open lagoon: rare: 1 specimen collected by gill net in Mosq.itoLagoon and 1 trawled in northern end of Indian River: until recently, this specieswent under the gen.s name Vomer (Berry and Smith-Vaniz, 1978).
84. Selene t,omer (l,r_kdou.'.).
Mesohaline: open lagoon: occasional: in addition to specimen reported by S.cl-son and Bradley (I!t7R). 2 j.venih_ trawled in Banana River near P_rt Canaveral. 2ad.lts recoverrd fr_.n FP&I, station on Indian River, an(! 2 illveniles trawled in north-ern part of Mosq.ito l.agoon.
85. Trachinoht_ caroliuus (Irhwida pompano).Mesohaline: ope. laRoon: _c;=_isional: collected sporadically thro.gho.t st.dy
region: experienced _ill-net fishermen occasionally take commercially siRnificant quan-titit_, especially (t.rinR late summer and fall (Anderson and Gehringer. 1965: Snelson,1980a).
107

86. Trac/_i,ot,s ]a/catrl._ (pernlit).
Mes,haline: open lalz(-)n: occasional: le._s abundarlt than prPc_ling species but
occasionally taken in numbers by gill-net fishermen (Snelson and Bradley, 1978: Sncl-son, 1980ai.
FAMILY LUTJANIDAE -- snappers87.' Lutianus griserL_ (gray snapper).
Mesohaline: open lagoon, lagoon perimeter: frequent: usually Found around
cover such as pilings, bridges, and riprap: occasionally taken in commercial quantitiesby gill-net fishermen in Mosquito Lagoon (Sheikh, i980a). Schooley (1980) reporteda single speeilnen of another lutjanid species. LutiantL_ synagrt_, from MosquitoLagoon: hut the specimen is not available for confirmation.
FAMILY LOBOT1DAE-- tripletails88. Lobotes surinamensL_ (tripletaili.
Mesohaline: open lagoon: rare: 5 specimens, all taken in August and September1979 from intake screens at FP&L power plant on Indian River.
FAMILY CEBBIEIDAE-- mojarras
89. Diapterus aurahL_ (Irish pompano).Mesohaline: open lagoon: frequent: young and juveniles encountered more often
than adults: tisnally found over soft sand-silt bottoms: until recently, this species wasnamed Dtapterus o/L_thostom_L_ (Miller, 1976).
90. DiaptertL_ p/umieri (striped moiarra ).
Mesohaline: open lagoon: rare: only 2 specimens known from study region, 1from Banana River (Snelson and Bradley, 1978), 1 from Indian River at Frontenac.
91. EucinostomI=s argenteIL_ (spotfin mojarra).
Mesohaline: open lagoon, lagoon perimeter: common: this and following speciesusually collected together, seem to show little habitat segregation: usually found oversoft silt or sand-silt bottoms.
92. Eucinostomus gula (silver jenny).
Mesohaline; open lagoon, lagoon perimeter: common. Sehooley (1977) reportedE. le]royi From Banana River but specimens are not available for confirmation.
FAMILY HAF:.MIrI.IDAE-- grunts
93. OrthoprL_tL_ chrysoptera (pigfish).
Me_ohaline: open lagoon: freqHent: usually a._sociated with seagra._s beds: oftencall,hi in traps and sold as preferred bait for htx)k and line fishing for large spottedseatrout (Tabb. 1!)611: pots..bserv.). Sch(mley (1980) reported another haemulid _l)e -cies, llaemuhm sciur,_, from Mosquito Lagoon: but the specimens are not availablefor confirmation.
FAMILY SPARIDAE-- porRies
94. Archosarg_L_ probatocephalus (sheepshead).
Me_ohaline: open la:_()on: common: usually found around structures such aspiers, navigation markers, and bridges.
95. Lagodon rhomboide.s (pinfish).
Me_ohaline: open lagoon, lagoon perimeter: common to abundant; usually as-sociated with seagrass beds.
FAMILY SC1AENIDAE-- drums
96. Bairdiellachrysoura (silverperch).
Mesohaline: open lagoon: abundant.
97. Cynoscian ,ebulosus (spotted seatrout).
Mesohaline: open lagoon: common: a highly prized sport and commercial species:by dollar value, the most important commercial Fin-fish in lagoon system (Andersonand C('hrin_cr. 1965): India, River system populations _row faster than any otherFlorida population examined by Tabb'(1961).
98. Cynoscinn re_ali._ (weakfish).
Mesohaline: open la_;oon: frequent: only young and juveniles taken, most bytrawling.
lO8
ORIGINAL PAOE _$
OF POOR QUALITY

99. Leiostmn.s xa.tlmr.._ (spot).
Mesohaline: ()pen lagoon: common to abundant: us.ally trawled over unvege-
rated sand or sand-silt bottoms: a significant commercial species in lagoon system (An-
derson and Cehringer, 19G5: Snelson, 1980a).I00. Menlicirrh.s america.us (so.thern kingfish).
Mesohaline; open lagoon; frequent; adults most common in winter and earlyspring months. Schooley (1977) reported a single individual of M. saxatilL_ from theIndian River near Titusville. but the specimen is not available for confirmation.
101. Mi_:ropogoni_ undulattt_ (Atlantic croaker).Mesohaline: open lagoon: frequent; a valuable food fish but not taken in signifi-
cant commercial quantities in study area (Snelson, 1980a); until recently, treated under
generic name Micropofton (Chao, 1978).109-. Pogonia_ cromi._ (black drum).
M_ohaline; open lagoon, lagoon perimeter, marshes: frequent; large adults up to28 kg taken in gill nets in open lagoon: young usually taken in mangrove-lined shorezone_L
103. Sctaenops ocellata (red dr.m).Me_ohaline: open lagoon, lagoon perimeter, marshes; frequent to common: young
and juveniles usually taken in shallow shore zones: large adults up to 16 kg taken in gillnets in deeper- water: an important sport and food fish.
FAMILY EPHIPPIDAE -- spadeIishes104. Chaetodipterus.[aber (Atlantic spadefish).
Mesohaline: open lagoon; frequent to common around docks, bridges, and navi-gation markers.
FAMILY SCAmOAE-- parrotfishes
105. Nicholsina ,Lsta (emerald parrotfish).Mesohaline. open lagoon: rare: only 3 individuals taken, all impinged on water
intake screens at FP&L power plant, summer 1979.
FAMILY MUGILIDAE-- mullets
106. Mugtl cephalu,s (striped mullet).Mesohaline, oligohaline; open lagoon, lagoon perimeter, marshes, ditches, im-
poundments: common to abundant; based on annual landings, the most importantcommercial fish species in lagoon system, with greatest landings between July andOctober (Anderson and Gehringer, 1965; Snelson, 1980a).
107. Mugil curema (white mullet).
Mc_ohaline; open lagoon, lagoon perimeter, marshes; common to abundant: un-like situation further south in lagoon system (Gilmore, 1977a), not found in impoundedbrackish waters on Merritt Island; smaller than preceding specie, of limited commer-cial value..
FAMILY SPHYRAENIDAE -- barracuda.s
108. Sphyraena barracuda (great barracuda).Mesohaline; open lagoon: rare: 1 young seined near Port Canaveral locks in
Banana River, 1 juvenile caught by sport fisherman In Banana River.109, Sphyraena boreali.s (northern sennet).
M_ohaline: open lagoon: rare: single specimen from FP&L power plant on In-dian River,
FAMILY URANOSCOPIDAE-- stargazers
110, AstroscoprLs y-e, raecum (southern stargazer).
Mesohaline: open lagoon: rare; 1 specimen from Mosquito Lagoon, 1 from IndianRiver.
FAMILY BLENNIInAF:--combtooth l)lennies
111. Chgsmades saburrae (Florida blenny).
Mes,haline: open lag¢_n, lagoon perimeter: common: typically taken in seagra._sbeds, shell beds, riprap, and other types of protective cover.
112. ttypleurochihLs gemi,atrts (crested blenny).Mesohaline: open lagoon: rare (Snelson, 1981).
ORWo;N.AL 7".-- '$
109 OF POOR QLA,_..,: y

FAMILY ELt'OTnlI')AE --sleepers
113. Dormitator maculatrL_ (fat sleeper).Oligohaline, fresh: marshes, ditch.; occasional; usually found in small ditches or
canals draining directly into lagoon.
FAMILY COBilDAE -- gobies
114. Bathygobiu.s soporator (frillfin goby).Mesohaline: lagoon perimeter: rare; a single specimen collected in northern end
of Banana River: there is very little suitable habitat for this species in study area.
115. Eoorthodu.s lyricu.s (lyre goby).Mesohaline: lagoon perimeter, marshes; rare; small sample taken on 2 separate
occasions at same site near Port Canaveral locks In Banana River: not found in otherareas where habitat seemed to be suitable.
116. Cobiotdes bro_L_soneti (violet goby).Mesohaline; open lagr_n: rare; 2 specimens taken at FP&L site on Indian River.
117. "CobtonelllL* boleosoma (darter goby).Mesohaline; open lagoon, lagoon perimeter; occasional; collected irregularly in
small numbers in Banana River and Indian River: much more common north (Ponce
de Leon Inlet) and south (Sebastian Inlet) of study area.
118. CobtonelhLr oceanicyL, (highfin goby).Mesohaline: open lagoon; occasional: found throughout study area but always
uncommon; some evidence suggests that it is most active at night. Both. C. oceanicusand C. ha_tatfL_ have been reported from the lagoon system (Cilmore, 1977a: Snelson,1980a), but recent studies by Mr. Frank Pezold (pen. comm.) indicate that only one
variable species is present.119. CobtonelltL_ smaragdtL_ (emerald goby).
Mesohaline: open lagoon; rare: 2 individuals taken in Banana River near thePort Canaveral locks.
120, Cobtosoma bosci (naked goby).Oligohaline: marshes, ditches, impoundments; freq.ent; claaracteristic of low-
salinity habitats.19.1. Cobtosoma robtL_tuu! (code goby).
Mesohaline, oligohaline: open lagoon, lagoon perimeter, marshes; abundant:
strongly z_ociated with the drift macroaigae community (Kulezyeki et al., 1981: Mulli-
gan and Snelson, 1982), but found in a diversity of habital,_; characteristically inhabitshigher salinities than preceding specie, although they were taken together at onebrackish ditch on several occasions.
129.. Mtcrogobi_L_ g.lostL_ (clown goby).Mesohaline, oligohaline; open lagoon, lagoon perimeter, marshes, ditches, im-
iw)undment_: common: ..sually collected over _ft sand or silt .substrates: not collectedin .strictly fr_h water on Merritt Island.
123. Micro_.ohi_L_ thalaxdntt_ (green goby).Mesohaline; open lag(.)n: occasional; collected most often in trawl over bare
sand-silt bottom.s; found irregularly throughout study area but always in small num-bers.
FAMILY TmcllllmlnaF. -- cutl,'tssfishc_
124. Trichi.rus Icpturrts (Atlantic cutla._sfish).Mesohaline: ope. lagoon: occasional: seasonally conlmon in Port Canaveral and
around inlets, b.t sporadic in northern part of lagoon system.
FAMILY SCOMllRIDAE -- mackerels
125. Scombcromor.s maculat.s (Spanish mackerel).'
Mesohaline: open lagoon: occasional: a few specimens from Mosquito Lagoonand Banana River (S,clso. and Bradley, 1978): infrequently caught by commercialfishermen in Banana River,
Ii0

FAMILY SCORPAF.NIDAF. -- scorpicmfish_
126. Scorpae,a l, rcrsiliensi.s (barbfish).
Mesohaline: open lagoon: rare: 4 specimens, all taken at FP&L power plant onIndian River.
FAMILY TmCl,mAF-- searobins
127. Prionotu._ scitulus (Ice,pard searobin).Mesnhaline: open lagoon: occasional: records from Mosquito Lagoon and Indian
River.
128. PrionotrLs tribui,s (bighead searobin).Mesohaline: open lagoon- frequent.
FAMILY B(yrlnn^e-lefteyc fh.mders129. Cltharichthys ,_jilopterus (hay whiff).
Mesohaline: open lagoon: occasional: scattered records from Mosquito Lagoonand Indian Hirer.
130. E'tropus croxsot_L, (fringed flounder).
Mesnhaline; open lagoon: rare: a single specimen taken June 1979 at FP&L powerplant on Indian River.
131. Paralichth_ albigutta (g,lf flounder).Mesohaline: open laRoon: frequent.
132. Paralirhthy.s lethostil_ma (southern flounder).
Mesohaline: open lagoon: occasional: encountered only about half as often a.spreceding species.
FAMILY SOLFJDAE-- s{lleS
133. Achirus lineattLs (lined sole).Mesohaline, oligohaline; open lagoon, lagoon perimeter, marshes, ditches: tom-
Ilion.
134. Trinectes maculalu._ (hogehoker).
Oligohaline: lagoon perimeter, marshes, ditches, impoundments: frequent: occursat lower salinities than preceding species but not collected in fresh water on MerrittIsland.
FAMILY CYNOCLOSSlDAF.-- tnnguefishes
135. Symph,rTLs plagiu.sa (blaekcheek tonguefish).Mesohaline: open lagoon: occasional.
FAMILY BALISTmAg -- leatherjackets136. Aluteru._ schoep/i (orange filefish).
Mesohaline: open lagoon; rare; 2 specimens from Indian River, 1 near Titusville,1 at Frontenae.
137. Monacanthus hiapidu., (planehead filefish).
Mesohaline: open lagoon: common around bridges, piers, navigation markers,and similar structures.
FAMILY TE'T_ODONTIDAE -- puffers138. Sphoeroides nephel,s (southern puffer).
Mesohaline; open lagoon, lagoon perimeter: common: strongly associated withseagrass beds.
139. Sphoeroides speneleri (bandtaii puffer).
Mesohaline: open lagoon, lagoon perimeter: occasional: 1 specimen from BananaRiver (Snelson and Bradley, 1978) and several from Indian River between Frontenacand Titusville.
140. Sphoeroidcs test,dinem (checkered puffer).Mesohaline: open lagoon: rare: I ,specimen from FP&L site on Indian River.
FAMILY DIODONTIDAE-- porcupinefishes141. Chilomycterus whoep]i (striped burrfish).
Mesohaline: open lagoon, lagoon perimeter: common: the related Diodo, hystrixw_s reported from Cocoa by Evermann and Bean (1,897) but has not been collectedanywhere in lagoon system in recent years (Gilmore, 1977a).
ill
O_GINAL PA(,_- _L:
OF PooR QUALITY


Form ApprovedREPORT DOCUMENTATION PAGE OM8_o, 0_o.-0,88i
PuDhc reoor_ltlCj ourden for this cotlectlo¢l of informatlct_ ps estlmatea to average + _out per ?esoonse, incluCling the t+me for reviewing tnsttuCl:lOn$, _earc_qncJ exlstln_ data source'.,
c_a_hefltlg afld maintaining the aata needed, and cOmOletli_cJ and rewewlng t_e collectLon of reformation Sen¢i cofflmeflt$ teg_i*dln 9 this burder_ esttmate or _ny oct_er aspect of trTi$cotlectlOr_ of Ir_forrrla_/On. _rlc_udltlg $ug_+L_tlOO$ POt re_Clr_g thqs Ouf(_en CO _V_shmqton He_lcIQuafter_ Serwc_. Oitectofate for Infort't_atlOt_ Ooer_ltlOnS and RpOO_'_, 1215 Jefferson
Dav_s Higt'.v,_v, Su,_e ]2C4 _,rilngtCn, _ ,'2202 a]02 +ocl to ',m_ ,]f_l_:e 7_ %_anacjem_t and Buc_get _oerwQrK Reductfom prr}tect ((]7{}4-0 BB). _i-3st_,ngton C,C 2_503
1. AGENCY USE ONLY {Leave Otank) j 2. REPORT DATE I 3. REPORT TYPE AND DATES COVERED
] IL=4, TITLE AND SUBTITLE 5. FUNDING NUMBERS
Mosquito Lagoon Environmental Resources Inventor' NASI0-I1624
6. AUTHOR(S)
Jane A. Provancha, Carlton R. Hall and
Donna M. Oddy
7. PERFORMING ORGANIZATION NAME(S) AND AOORESS(ES)
The Bionetics CorporationMail Code: BIO-2
Kennedy Space Center, FL 32899
9. SPONSORING�MONITORING AGENCY NAME(S) AND AODRESS(ES)
Biomedical Operations and Research OfficeMD
Kennedy Space Center, FL 32899
8. PERFORMING ORGANIZATIONREPORT NUMBER
10. SPONSORING / MONITORINGAGENCY REPORT NUMBER
TM 107548
11.SUPPLEMENTARYNOTES The document was prepared as a requirement to fulfill IPhase I of the Water Quality Inventory & Monitoring Program Canaveral _ISeashore. The Program was a cooperative agreement between the National
Aeronautics and Space Administration and the National Park Service.12a.DISTRIBUTION/AVAILABILITYSTATEMENT
Publicly available
12b, DISTRIBUTION CODE
13. ABSTRACT (Maximum 200 words)
This document provides a synopsis of biotic and abiotic data collected
in the Mosquito Lagoon area in relation to water quality. A holistic
ecological approach was used in this review to allow for summaries
of climate, land use, vegetation, geohydrology, water quality, fishes,
sea turtles, wading birds, marine mammals, invertebrates, shellfish
and mosquito control. The document includes a bibliographic database
list of 157 citations that have references to the Mosquito Lagoon,many of which were utilized in development of the text.
14. SUBJECT TERMS
Mosquito Lagoon, ecology, water quality,
bibliography, fisheries
17. SECURITYCLASSIFICAT}ON18. SECURITYCLASSIFICATIONOF REPORT OFTHISPAGEUnclassified Unclassified
NSN 7540-01-280-5500
19. SECURITY CLASSIFICATIONOF ABSTRACT
Unclassified
15. NUMBER OF PAGES
lll16. PRICE CODE
20. LIMITATION OF ABSTRACT
Stanciard Form 298 (Rev 2-89)Pre,.crll_cl _y ANSI _(d Z3g-18298-_02