mortgage insurance product shf’s white paper december 2006
TRANSCRIPT

Mortgage Insurance ProductSHF’s White Paper
December 2006

CONTENTS
2
I. PORTFOLIO
II. LOAN ORIGINATION
III. LOAN BEHAVIOR
IV. PREPAYMENT
V. BEHAVIOR SCORE
INTRODUCTION
3
• This document as intended to provided consolidated information on SHF´s guaranteed portfolio, and is aimed to any analysts interested in learning the main characteristics of the mortgage pool insured by SHF
• It contains portfolio and prepayment information as of December of 2006 and behavior information as of November of 2006
• The final chapter of this document has a more thorough description and analysis of the behavior score used in SHF to measure portfolio credit quality

SHF not – Securitized Portfolio vs Securitized Portfolio
4
Not securitized Number of
Loans% Number of
LoansLoans
Balance% Loans Balance
UDISProfivi 193,918 80.65% 62,815 85.95%Prosavi 27,817 11.57% 2,688 3.68%
PESOSProfivi 18,722 7.79% 7,580 10.37%Total 240,457 73,084
Guaranteed PortfolioPortfolio Statistics
Not securitized
Number of Loans % Number of LoansLoans
Balance% Loans Balance
UDISProfivi 36,752 97.12% 22,793 98.79%Prosavi 266 0.70% 20 0.08%
PESOSProfivi 823 2.17% 260 1.13%Total 37,841 23,072
Portfolio Statistics
Securitized Loans

PORTFOLIO: Loan Characteristics
5
Securitizated Not securitized
Total 1.82 1.84Profivi 1.82 1.9
Prosavi 1.7 1.39
Total 144.04 86.24Profivi 144.58 88.79
Prosavi 68.06 68.35
Total 0.85 0.81Profivi 0.85 0.84
Prosavi 0.48 0.58
Total 285,699 285,108Profivi 287,230 313,134
Prosavi 69,692 88,982
Total 26.31 25.85Profivi 26.28 25.62
Prosavi 30 27.37
Average Loan Spread
Average Years to Maturity of Loan at Origination **
Average Administration Fee *
Average Loan to Value at Origination
Average Initial Loan *
* In pesos** Months

Portfolio Concentration By Region
6
Securitized Loans
Guaranteed Portfolio
Nuevo León 11.60% 18.42 480.73 FormalJalisco 10.65% 20.28 480.78 Formal
Baja California 10.51% 24.46 480.65 FormalMéxico 8.15% 21.92 483.85 Formal
Quintana Roo 6.53% 21.93 477.09 FormalTamaulipas 5.20% 24.02 480.04 FormalChihuahua 4.81% 24.93 484.16 Formal
Sonora 4.48% 22.57 482.98 FormalSinaloa 4.01% 21.77 482.77 Formal
21.82 481.27 Formal
Employment
Guaranteed Portfolio Concentration
State % Concentration Mean Age Mean Score
Sector
Baja California 15.62% 51 466.49 FormalMéxico 14.13% 49.71 468.44 Formal
Distrito Federal 11.10% 54.51 467.17 FormalJalisco 9.00% 47.62 468.57 Formal
Nuevo León 8.54% 46.99 468.01 FormalQuintana Roo 6.42% 48.38 466.23 Formal
Chihuahua 5.40% 52.75 468.87 FormalTamaulipas 4.26% 48.54 466.68 Formal
Puebla 4.25% 48.99 469 Formal45.13 468.19 Formal
EmploymentState % Concentration Mean Age Mean Score
Sector
Securizated Portfolio Concentration
Not Securitized Portfolio

CONTENTS
7
I. PORTFOLIO
II. LOAN ORIGINATION
III. LOAN BEHAVIOR
IV. PREPAYMENT
V. BEHAVIOR SCORE
Portfolio Distribution By Activity of the Individual
8
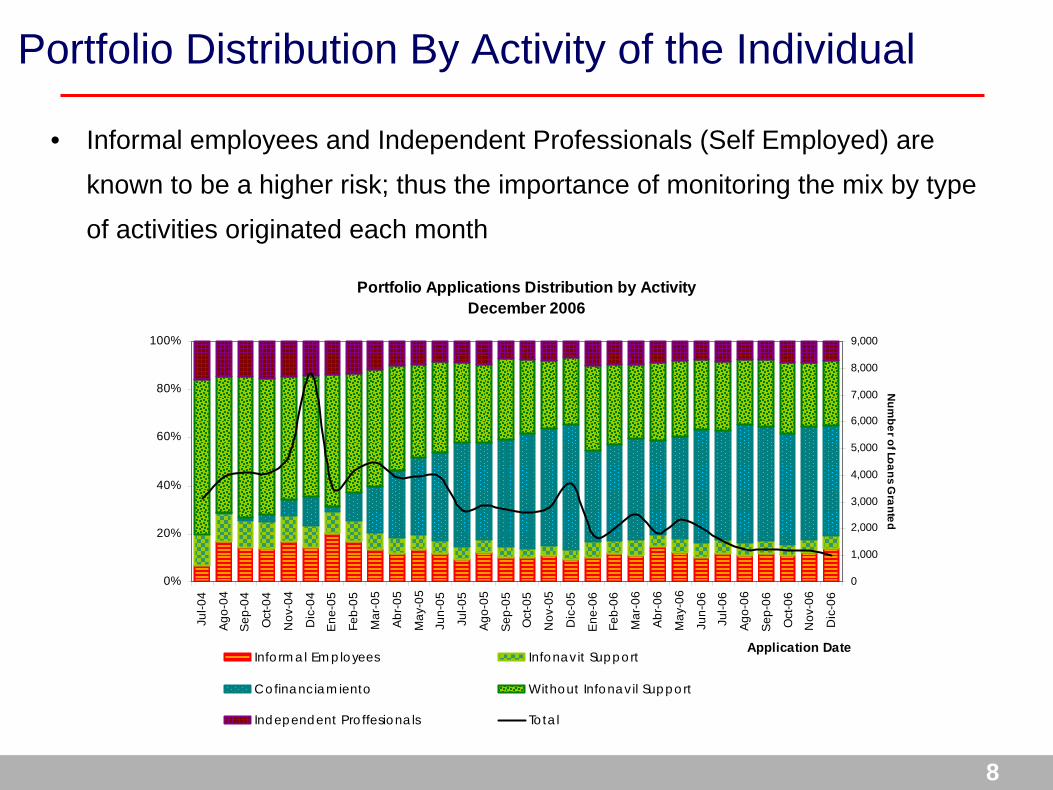
• Informal employees and Independent Professionals (Self Employed) are
known to be a higher risk; thus the importance of monitoring the mix by type
of activities originated each month
Portfolio Applications Distribution by ActivityDecember 2006
0%
20%
40%
60%
80%
100%
Jul-0
4
Ago
-04
Sep
-04
Oct
-04
Nov
-04
Dic
-04
Ene
-05
Feb-
05
Mar
-05
Abr
-05
May
-05
Jun-
05
Jul-0
5
Ago
-05
Sep
-05
Oct
-05
Nov
-05
Dic
-05
Ene
-06
Feb-
06
Mar
-06
Abr
-06
May
-06
Jun-
06
Jul-0
6
Ago
-06
Sep
-06
Oct
-06
Nov
-06
Dic
-06
Application Date
0
1,000
2,000
3,000
4,000
5,000
6,000
7,000
8,000
9,000
Num
ber of Loans Granted
Informal Employees Infonavit Support
Cofinanciamiento Without Infonavil Support
Independent Proffesionals Total

Credit Score Distribution
9
I
Application Score Distribution December 2006
459 480 500 520
0
1,000
2,000
3,000
4,000
5,000
424
431
436
441
446
451
456
461
466
471
476
481
486
491
496
501
506
511
516
521
Application Score
• At December 2006 most of the
guaranteed loans by SHF had
credit score between 459 and
500 points (the odds of having
bad behavior doubles every
20 points)
• Some guarantees were
originated with a credit score
below cut-off point (459), and
this is due to some
alternatives the individual has
in order to remediate a low
credit score (for example:
entering into a savings
program, lowering the LTV )
Application Distribution by Bucket Score
0.00%
10.00%
20.00%
30.00%
40.00%
50.00%
- 458 459 - 480 481 - 500 501 - 520 521 - +
Bucket Scorre
Loans below cutoff point and guaranteed
10
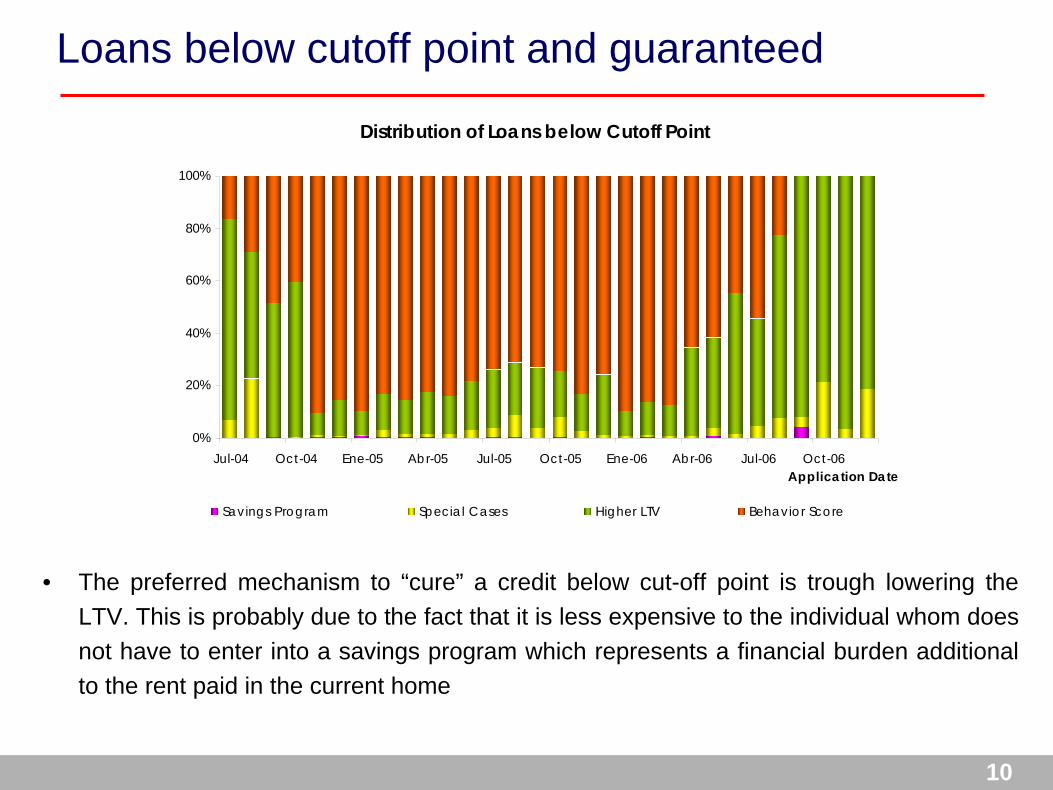
Distribution of Loans below Cutoff Point
0%
20%
40%
60%
80%
100%
Jul-04 Oct-04 Ene-05 Abr-05 Jul-05 Oct-05 Ene-06 Abr-06 Jul-06 Oct-06Application Date
Savings Program Special Cases Higher LTV Behavior Score
• The preferred mechanism to “cure” a credit below cut-off point is trough lowering the LTV. This is probably due to the fact that it is less expensive to the individual whom does not have to enter into a savings program which represents a financial burden additional to the rent paid in the current home

CONTENTS
11
I. PORTFOLIO
II. LOAN ORIGINATION
III. LOAN BEHAVIOR
IV. PREPAYMENT
V. BEHAVIOR SCORE

Portfolio Distribution by Number of Months Past Due
12
• The distribution of number of months past due is stabilizing as the age of the portfolio also becomes stable
Months Past Due June 06 July 06 August 06 September 06 October 06 November 06
0 73.04% 73.50% 74.28% 72.73% 64.09% 76.58%1 15.05% 14.61% 13.89% 14.63% 21.39% 9.41%2 4.49% 4.14% 3.82% 4.42% 5.81% 5.20%3 3.97% 4.18% 4.30% 4.23% 4.54% 4.49%4 0.50% 0.54% 0.54% 0.63% 0.64% 0.70%5 0.24% 0.27% 0.27% 0.35% 0.40% 0.34%
6+ 2.71% 2.76% 2.89% 3.01% 3.13% 3.27%

Transition Matrix of Current and Past Due Loans
13
• The Portfolio Transition Matrix has a tendency to maintain loans in the 0-3 months past due zone; however it is complicated for loans that reach 6+ payments due to recover in the short term
• The following is a monthly transition averaged form the 10th observed monthly transition matrices of 2006 (up to the Oct-Nov Transition)
K 0 1 2 3 4 5 6 +0 91.42 8.29 0.25 0.03 0.01 0.00 0.011 35.41 51.09 12.96 0.49 0.02 0.01 0.022 12.50 18.05 43.92 24.65 0.73 0.04 0.113 5.41 4.11 9.48 71.10 8.96 0.68 0.254 4.44 2.69 6.54 13.06 32.84 36.99 3.445 3.95 1.40 1.43 6.43 5.01 19.92 61.87
6 + 1.45 0.32 0.28 0.95 0.35 0.49 96.16
Transition Matrix of Current and Past Due Loansk + 1
Jan - Nov2006
Probability of Default – Analysis by vintages
14
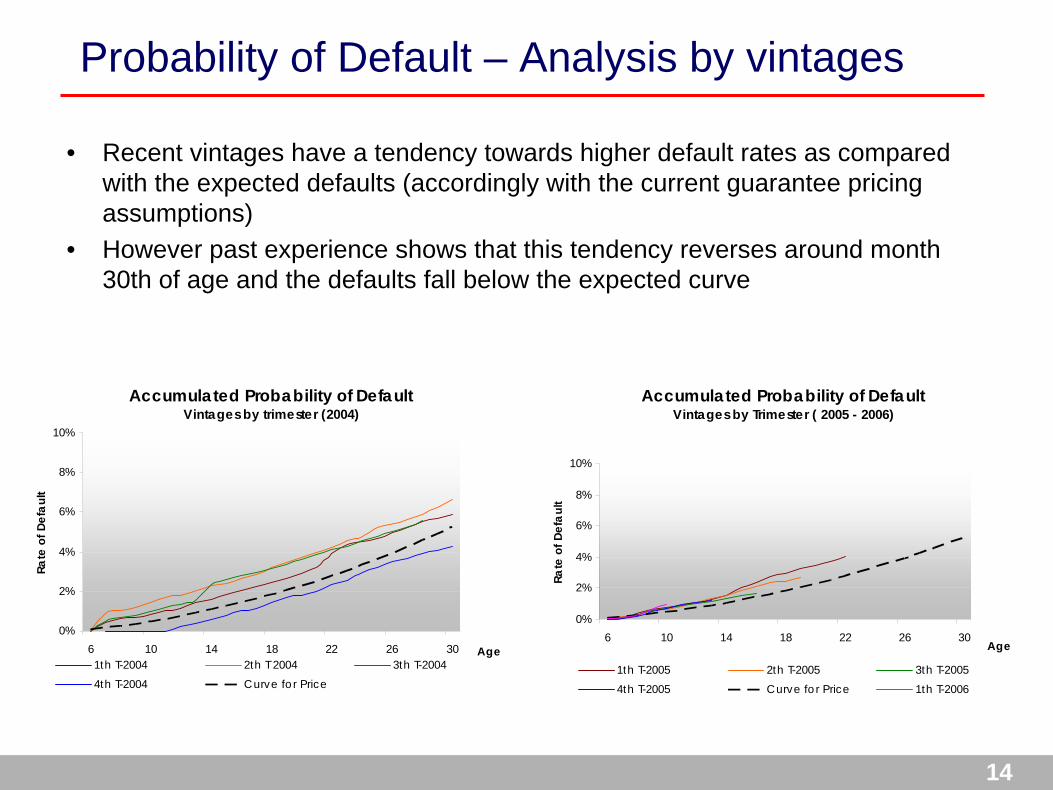
• Recent vintages have a tendency towards higher default rates as compared with the expected defaults (accordingly with the current guarantee pricing assumptions)
• However past experience shows that this tendency reverses around month 30th of age and the defaults fall below the expected curve
Accumulated Probability of DefaultVintages by trimester (2004)
0%
2%
4%
6%
8%
10%
6 10 14 18 22 26 30 Age
Rate
of D
efau
lt
1th T-2004 2th T 2004 3th T-20044th T-2004 Curve for Price
Accumulated Probability of DefaultVintages by Trimester ( 2005 - 2006)
0%
2%
4%
6%
8%
10%
6 10 14 18 22 26 30Age
Rate
of D
efau
lt
1th T-2005 2th T-2005 3th T-20054th T-2005 Curve for Price 1th T-2006

CONTENTS
15
I. PORTFOLIO
II. LOAN ORIGINATION
III. LOAN BEHAVIOR
IV. PREPAYMENT
V. BEHAVIOR SCORE

PREPAYMENT: General Statistics (UDIs)
16
The prepayment pattern tends to stabilize after month 30.
The spikes at the earlier vintages tend to be smoothed as further data pointsare registered.
GLOBAL PREPAYMENT RATE( UDI -DENOMINATED LOANS)
(08/1999 - 11/2006)
0.00%
0.15%
0.30%
0.45%
0.60%
0.75%
1 6 11 16 21 26 31 36 41 46 51 56 61 66 71 76 81 86
Age (Months)
Prep
aym
ent R
ate
CURTAILMENT PREPAYMENT RATE CPR = 2.37%
TOTAL PREPAYMENT RATE CPR = 4.46%
GLOBAL PREPAYMENTE RATE CPR = 6.71%

PREPAYMENT: General Statistics (PESOS)
17
The prepayment pattern tends to stabilize after month 30.
The spikes at the earlier vintages tend to be smoothed as further data pointsare registered.
GLOBAL PREPAYMENT RATE(PESOS- DENOMINATE LOANS)
(08/1999 - 11/2006)
0.00%
0.30%
0.60%
0.90%
1.20%
1.50%
1.80%
1 4 7 10 13 16 19 22 25 28 31 34 37
Age (Months)
Prep
aym
ent R
ate
CURTAILMENT PREPAYMENT RATE CPR = 2.36%
TOTAL PREPAYMENT RATE CPR = 3.87%
GLOBAL PREPAYMENT RATE CPR = 6.40%
CONTENTS
18
I. PORTFOLIO
II. LOAN ORIGINATION
III. LOAN BEHAVIOR
IV. PREPAYMENT
V. BEHAVIOR SCORE

Definition of the Behavior Score
19
• The Behavior Score is developed to evaluate the risk of debtors based in
their past behavior.
• The past experience is organized into a form which is amenable to
analysis. The most significant factors or variables which predict
behaviour are then determined.
• A numerical measure (an odds quote) is then developed (based on the
relevant factors) which allows a new applicant to be identified as a good
or poor risk

“Odds” Concepts and definitions
20
Once a score is calculated, it can be converted to odds. Odds represent the number of loans that will remain good for each account that will become bad. The odds - score relationship for these scorecards can be represented mathematically as follows:
ODDS = 20 x 2((SCORE - 500)/20)
For the sample account above, the odds would be calculated as shown:
ODDS = 20 x 2((480- 500)/20)
Therefore, ODDS = 10.
This means that for every 11 accounts that have a score of 480, we expect, based on past observation, that 10 accounts will perform satisfactorily for each account performing unsatisfactorily in the 12 months subsequent to scoring.

Description of Data
21
• The analysis of Behavior Score presented in this chapter is based on SHF’s warranty portfolio.
• The period of time considered goes form Jan-05 up to Oct-06, on a monthly frequency.
• The principal features of SHF’s Behavior Score are:Score Range between 360 and 548 (higher score, higher quality). The cut-off point was set equal to 503.Six months of data are needed to score a loanOnly applies to loans with less than four past due payments and at least six months of age.Odds double every 20 points
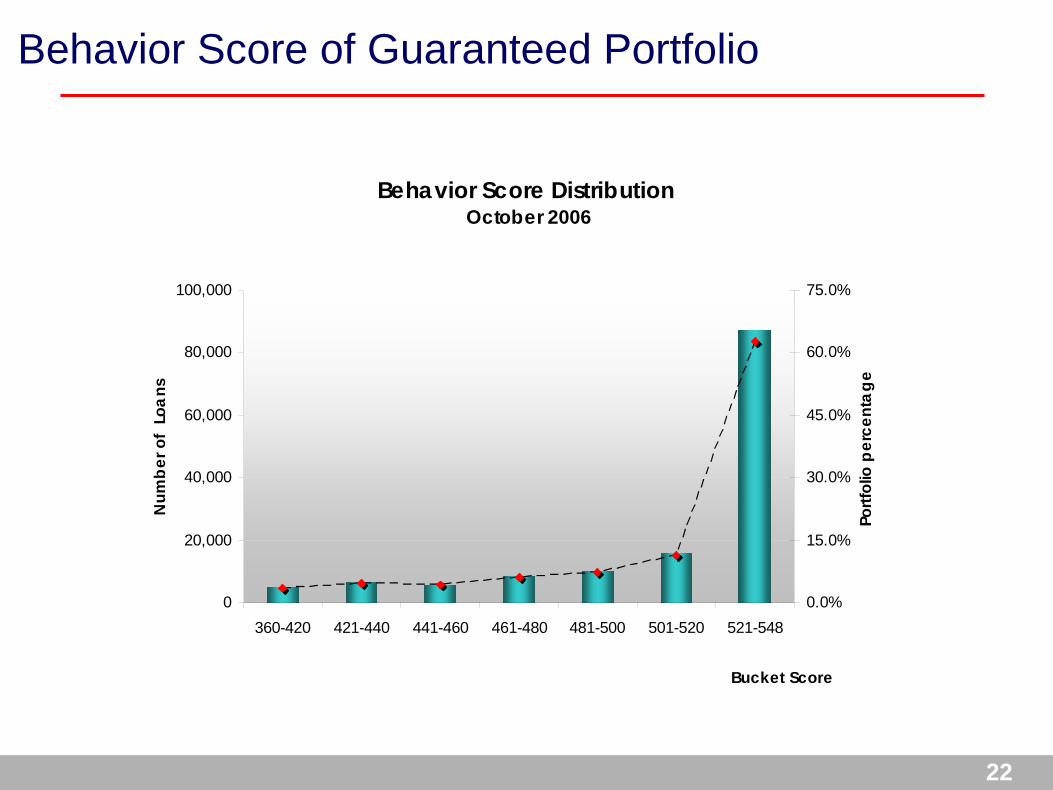
Behavior Score of Guaranteed Portfolio
22
Behavior Score Distribution October 2006
0
20,000
40,000
60,000
80,000
100,000
360-420 421-440 441-460 461-480 481-500 501-520 521-548
Bucket Score
Num
ber o
f Lo
ans
0.0%
15.0%
30.0%
45.0%
60.0%
75.0%
Portf
olio
per
cent
age

23
Behavior Score Transition Matrix: October 2006 –October 2005
• The Transition Matrix was constructed as an average of the monthly changes of loans along the score tranches.
• As expected, the main diagonal concentrates the maximum probability of transition, and the upper triangle of the matrix also shows large probabilities.
• These characteristics of the Behavior Score Transition Matrix imply a guaranteed portfolio with considerable stability along time, and a relatively good perspective to migrate to higher score tranches.
AverageTransition Matrix (%)Tranches of Score
360-400 401-420 421-440 441-460 461-480 481-500 501-520 521-548 Total
360-400 50.2 31.9 11.2 4.8 1.4 0.4 0.0 0.0 100401-420 7.5 40.6 28.3 14.1 6.3 3.0 0.2 0.0 100421-440 6.5 19.0 40.9 16.7 11.2 4.1 1.5 0.0 100441-460 1.9 8.3 13.8 34.0 23.8 12.2 5.7 0.5 100461-480 0.7 3.8 6.6 16.2 45.9 18.6 7.4 0.9 100481-500 0.0 0.3 1.0 3.5 20.5 45.6 22.6 6.3 100501-520 0.0 0.0 0.1 0.5 2.4 13.8 55.1 28.0 100521-548 0.0 0.0 0.0 0.0 0.0 0.4 7.9 91.6 100
Trach
es o
f Sco
re

Average Behavior Score by Loan to Value: Monthly
24
Behavior Score Evolution by Loan to Value
485
490
495
500
505
510
515
520
525
530
Jan-05
Mar-05
May-05
Jul-0
5
Sep-05
Nov-05
Jan-06
Mar-06
May-06
Jul-0
6
Sep-06
Month
Ave
rage
Sco
re
0-70% 70-85% 85-90% 90-100% Cut-off Point
• For LTV higher than 85%, the Behavior score is low, indeed below the cut-off point, because of the considerable risk of a loan with this feature.

25
Average Behavior Score by Loan to Value: October 2006
Average Behavior Score by Loan to Value October 06
400
420
440
460
480
500
520
540
560
0-70% 70-85% 85-90% 90-100%LTV
Ave
rage
Sco
re
0
10,000
20,000
30,000
40,000
50,000
60,000
Num
ber o
f Loa
ns
Mean Number of Loans
• Along the LTV tranches, the average behavior score remains relatively stable, although, the dispersion rises for the tranches of LTV higher than 85%.

Average Behavior Score by Creditor Activity: Monthly
26
Behavior Score Evolution by Activity
480
485
490
495
500
505
510
515
520
525
Jan-05
Mar-05
May-05
Jul-0
5Se
p-05Nov-0
5
Jan-06
Mar-06
May-06
Jul-0
6Se
p-06 Month
Ave
rage
Sco
re
Formal InformalInd. Professional Cut-off Point
• The Formal Sector, as debtor activity, has higher levels of Average Behavior Score.
• Clearly, debtors with formal jobs could face their liabilities in a better way than debtors with a non-formal job.

27
Average Behavior Score by Debtor Activity: October 2006
Behavior Score Evolution by Activity October 06
400
420
440
460
480
500
520
540
560
Formal Informal Ind. Professional
Activity
Ave
rage
Sco
re
0
10,000
20,000
30,000
40,000
50,000
60,000
70,000
80,000
90,000
Num
ber o
f Loa
ns
Mean Number of Loans
• The number debtors with loans in the non-formal sector is considerably small, relatively to those in the formal sector.

28
Average Behavior Score by Asset Manager Rating: Monthly
Behavior Score Evolution by Assets Manager
480
490
500
510
520
530
540
Jan-05
Mar-05
May-05
Jul-0
5Se
p-05Nov-0
5
Jan-06
Mar-06
May-06
Jul-0
6Se
p-06
Month
Ave
rage
Sco
re
Average Over Average Cut-off Point
• The Asset Manager rating is granted by rating agencies to evaluate the ability and expertise to originate, collect and manage mortgages

29
Average Behavior Score by Asset Manager Rating: October 2006
Behavior Score Evolution by Assets Manager October 06
400
420
440
460
480
500
520
540
560
Average Over Average
Assets Manager
Ave
rage
Sco
re
0
10,000
20,000
30,000
40,000
50,000
60,000
70,000
80,000
90,000
Num
ber o
f Loa
ns
Mean Loans
• As expected, the Over-Average group of SOFOLes has a higher average score, considerably less dispersion and a large number of loans than the Average group.

30
Average Behavior Score by Age of Loans: October 2006
• Behavior Score is dependent on the age of the portfolio
Behavior Score Distribution by Age
503
508
513
518
523
528
533
538
7 12 17 22 27 32 37 42 47 52 57 62 67 72Months
Ave
rage
Sco
re
Cut-off point

Average Score by State: October 2006
31
• Northern States tend to have lower behavior scores
Nevertheless, in all states,
the Average Behavior
Score is above the cut-off
point. (503 pts.)
Nuevo León 29.93 Formal 504.61 9.27%Durango 35.61 Formal 510.21 1.43%Chiapas 35.86 Formal 510.95 2.80%Sonora 34.43 Formal 511.26 4.42%
Guanajuato 33.15 Formal 512.67 3.48%Sinaloa 30.73 Formal 512.75 3.28%
Baja California 38.49 Formal 513.49 11.71%Tamaulipas 34.07 Formal 514.27 4.27%
Guerrero 35.69 Formal 514.31 0.54%Estado de México 38.78 Formal 514.88 9.73%
Average of theCountry 35.26 Formal 515.71
Average Age in Months Employment Average Score Concentration (by
Number of Loans)State