mortgage finance in kenya: survey analysis
TRANSCRIPT

Mortgage Finance in Kenya: Survey Analysis
November 2010
CENTRAL BANK OF KENYA & WORLD BANK
Document of the Central Bank of Kenya

I. Introduction
I. Introduction
A. Background
This survey analysis is part of an overall Housing Finance Study that profiles Kenya’s mortgage finance
market. The survey was conducted by the Central Bank in June 2010 and the analysis presents the findings
on the overall mortgage finance market, mortgage loan characteristics, and the main constraints to the
primary mortgage market in Kenya. A subsequent report is being prepared based on extensive interviews
with commercial banks, government agencies, property developers and fund managers that will examine in
detail the primary mortgage finance market, housing supply and demand constraints, and the potential for a
secondary mortgage finance market.
B. Survey Methodology
The analysis is based on survey of all the 44 banks in Kenya1. All banks responded to the request in
writing (9 banks indicated that they did not provide mortgage financing). The three-part questionnaire
requested the banks to answer questions related to the size of mortgage portfolio, loan characteristics and
mortgage market obstacles. The survey focuses exclusively on the primary residential mortgage market
which is mainly concentrated around the Nairobi region. Two key caveats regarding the survey results are:
(i) the data on total loans may be overstated due to the reporting of developer financing loans by some
institutions and (ii) the data on interest rates may be understated due to the inclusion of employee
mortgage loans which are typically provided at subsidized rates.
C. Report Structure
The report has three sections covering (i) Overall Market Characteristics - profile of the Kenyan mortgage
market, with a focus on the growth, segmentation and portfolio quality (ii) Mortgage Loan Characteristics
– profile of the typical Kenyan mortgage loan and (iii) Mortgage Market Constraints – summary of the
main constraints in the primary mortgage market identified by the commercial banks.
D. Definitions
For the purposes of this survey, we have used the following definitions:
Primary Mortgage - a bank loan made to an individual for the purpose of purchasing, renovating or
constructing a residential dwelling. The loan is secured by a mortgage lien over the property
Large/Medium/Small Banks – the CBK classifies banks based on assets size: large with assets above
Kshs. 15 billion; medium with assets valued at between Kshs. 5 - 15 billion; and small with assets
1 The survey included only banking institutions and other financial institutions such as SACCOs were not part of this survey

I. Introduction
valued at less than Kshs. 5 billion. Nineteen (19) financial institutions were classified as large,
fourteen (14) institutions were medium and twelve (12) institutions were small. Please refer to the
table below for bank size classifications.
Source: Central Bank of Kenya: Banking Supervision Annual Report 2009
E. Acknowledgements
Particular acknowledgements are due to all respondents from the banking sector for their prompt and
detailed responses to the survey questionnaires.
II. Overall Market Characteristics
II. Overall Market Characteristics
A. GROWTH
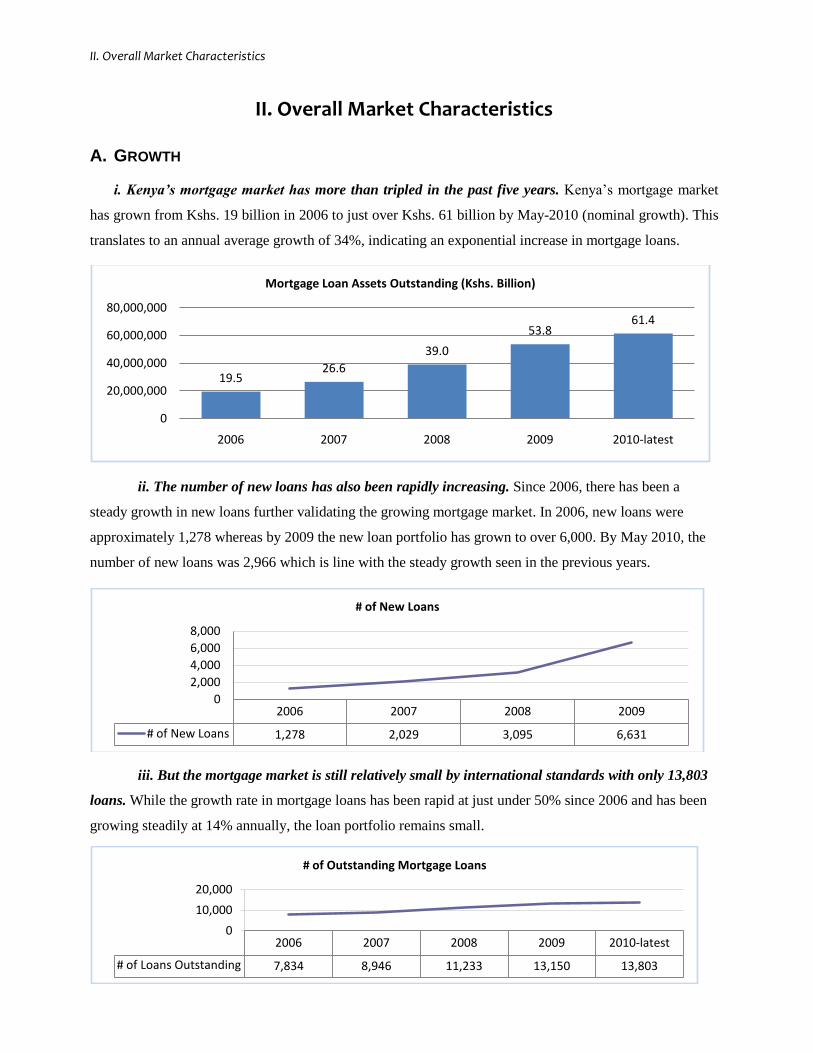
i. Kenya’s mortgage market has more than tripled in the past five years. Kenya’s mortgage market
has grown from Kshs. 19 billion in 2006 to just over Kshs. 61 billion by May-2010 (nominal growth). This
translates to an annual average growth of 34%, indicating an exponential increase in mortgage loans.
ii. The number of new loans has also been rapidly increasing. Since 2006, there has been a
steady growth in new loans further validating the growing mortgage market. In 2006, new loans were
approximately 1,278 whereas by 2009 the new loan portfolio has grown to over 6,000. By May 2010, the
number of new loans was 2,966 which is line with the steady growth seen in the previous years.
iii. But the mortgage market is still relatively small by international standards with only 13,803
loans. While the growth rate in mortgage loans has been rapid at just under 50% since 2006 and has been
growing steadily at 14% annually, the loan portfolio remains small.
19.526.6
39.0
53.861.4
0
20,000,000
40,000,000
60,000,000
80,000,000
2006 2007 2008 2009 2010-latest
Mortgage Loan Assets Outstanding (Kshs. Billion)
2006 2007 2008 2009
# of New Loans 1,278 2,029 3,095 6,631
0
2,000
4,000
6,000
8,000
# of New Loans
2006 2007 2008 2009 2010-latest
# of Loans Outstanding 7,834 8,946 11,233 13,150 13,803
0
10,000
20,000
# of Outstanding Mortgage Loans

II. Overall Market Characteristics
iv. In terms of mortgage debt to GDP ratios, Kenya is low by international standards but is on
par with its neighboring peers. Kenya’s mortgage debt compared to its GDP is better than its East African
neighbors, Tanzania and Uganda at just under 2.5% but is not as developed as its developing country peers
such as India (6%) and Colombia (7%). However, the mortgage debt to GDP ratio is around 50% in
Europe and over 70% in US indicating there is significant room to grow.
B. SEGMENTATION
i. Kenya’s mortgage market is dominated by the large banks, comprising 90% of the outstanding
loan assets portfolio. While Kenya’s mortgage market is growing, the industry is dominated by the large
banks indicating barriers to entry or high risk for medium and smaller banks. However, the growth rates
indicate that the small sized banks have the fastest growth rate of 38% on average, followed by medium
banks which are growing at 25% on average with large banks closely following at 24% on average.
2.48% 1.0% 0.2%
32.5%
0.4%6.0% 7.0%
0.00%
10.00%
20.00%
30.00%
40.00%
Kenya Uganda Tanzania South Africa Egypt India Colombia
Mortgage Debt/GDP Ratios
0
20,000,000,000
40,000,000,000
60,000,000,000
80,000,000,000
2006 2007 2008 2009 2010-latest
Share of Mortgage Market by Bank Size (Kshs)
Small (12)
Medium (14)
Large (18)
Mortgage Loan Assets (Kshs Billion)
2006 2007 2008 2009 2010-May
Large (18) 17.7 24.6 36.1 49.1 54.7
Medium (14) 1.6 1.7 2.5 4.3 5.2
Small (12) 0.2 0.2 0.4 0.4 1.5
TOTAL (44 Banks) 19.5 26.5 39.0 53.8 61.4

II. Overall Market Characteristics
ii. The market is further concentrated by having the top five lenders represent over 80% of the
total mortgage portfolio. The top two banks hold over 50% of the mortgage market share and only 9 banks
(6 large, 2 medium and 1 small bank) have a mortgage portfolio exceeding Kshs. 1 billion annually.
C. PORTFOLIO QUALITY
i. The strength of the growing market is highlighted by the low non-performing loans portfolio
which has not been increasing over time. Positively, the NPL portfolio has been relatively low indicating
prudent mortgage evaluations by the commercial banks but could be masked by the increasing portfolio of
outstanding loans. Compared to the number of outstanding loans, the number of NPLs has been decreasing
and is close to half its 2006 portfolio.
27%
30%
11%
10%
5%
Bank 1 Bank 2 Bank 3
Bank 4 Bank 5
0%
10%
20%
2006 2007 2008 2009 2010-latest
Number of NPLs over Total # of Outstanding Loans
Year 2006 2007 2008 2009 2010-May
Number of NPLs 1,388 1,124 1,107 1,215 1,099

III. Mortgage Loan Characteristics
III. Mortgage Loan Characteristics
A. Average Loan Size
i. The average mortgage loan is approximately Kshs. 4 million2 which reflects on the expensive
housing market3 or a predominance of high-income mortgage borrowers in Kenya. Since 2006, the
average mortgage loan size has been growing steadily but is still concentrated around the higher-end
clientele of Kenya’s mortgage market, based primarily in the Nairobi region. This illustrates that the
Kenyan mortgage market has yet to move downstream to the medium-to-low income mortgage market.
ii. Furthermore, the average loan size of approximately Kshs. 4 million is consistent among
large and small banks. While there are some outliers that can be attributed to developer financing and/or
employee mortgage loan financing, the average loans sizes among large and small banks do not vary,
indicating that all commercial banks are targeting the same higher end housing finance market. The
medium banks have a relatively higher average loan size that can be attributed to outliers.
Avg. Loan Size 2006 2007 2008 2009 2010-May
Large Banks 2,761,257 3,481,069 4,687,598 4,785,001 4,662,243
Medium Banks 3,656,155 4,135,900 4,508,117 5,830,687 5,391,285
Small Banks 1,897,583 2,382,204 2,688,523 2,467,694 4,049,658
2 Average loan size numbers may include developer financing and employee mortgage loans which can skew the average residential mortgage loan
size 3 Kshs 4 million mortgage loan assumes residential house prices in the range of Kshs. 5-7M (identified as high-income houses by adhoc interviews
with developers), based on an average 70-80% loan to value financing
2,486,671 2,969,958
3,475,4364,089,180
4,448,122
0
1,000,000
2,000,000
3,000,000
4,000,000
5,000,000
2006 2007 2008 2009 2010-latest
Avg Mortgage Loan Size (Kshs)

III. Mortgage Loan Characteristics
iii. The average mortgage loan size has also been steadily increasing. On average, the new
mortgage loan size is approximately Kshs. 6 million over the past few years indicating that the housing
finance market is yet to move downstream. This may be explained by the undeveloped medium-to-low
income housing market or the latent demand in the high-income housing market that is yet to be met.
B. Interest Rates
i. The weighted average mortgage interest rate reported by the institutions is 14.07% in 2010
which compares favorably to the average lending rate of 14.64% in Kenya. The mortgage rates are
consistent with commercial bank lending rates given the higher risk premiums associated with mortgages.
In 2010, the highest interest rate reported was 18.5% and the lowest interest rate was 6.5%.
5,189,360 5,452,699
7,685,520
0
2,000,000
4,000,000
6,000,000
8,000,000
10,000,000
2007 2008 2009
Avg Mortgage Size for New Loans (Kshs)
10.00%
12.00%
14.00%
16.00%
2006 2007 2008 2009 2010-latest
Mortgage Rates vs. Commercial Banks Lending Rate
Weighted Av Mortgage Rate
Commercial Bank Average Lending Rates
Year 2006 2007 2008 2009 2010
Weighted Avg. Mortgage Rate
12.45% 12.83% 13.54% 14.11% 14.07%
Commercial Banks Avg. Lending Rate
13.63% 13.33% 14.02% 14.80% 14.64%
III. Mortgage Loan Characteristics
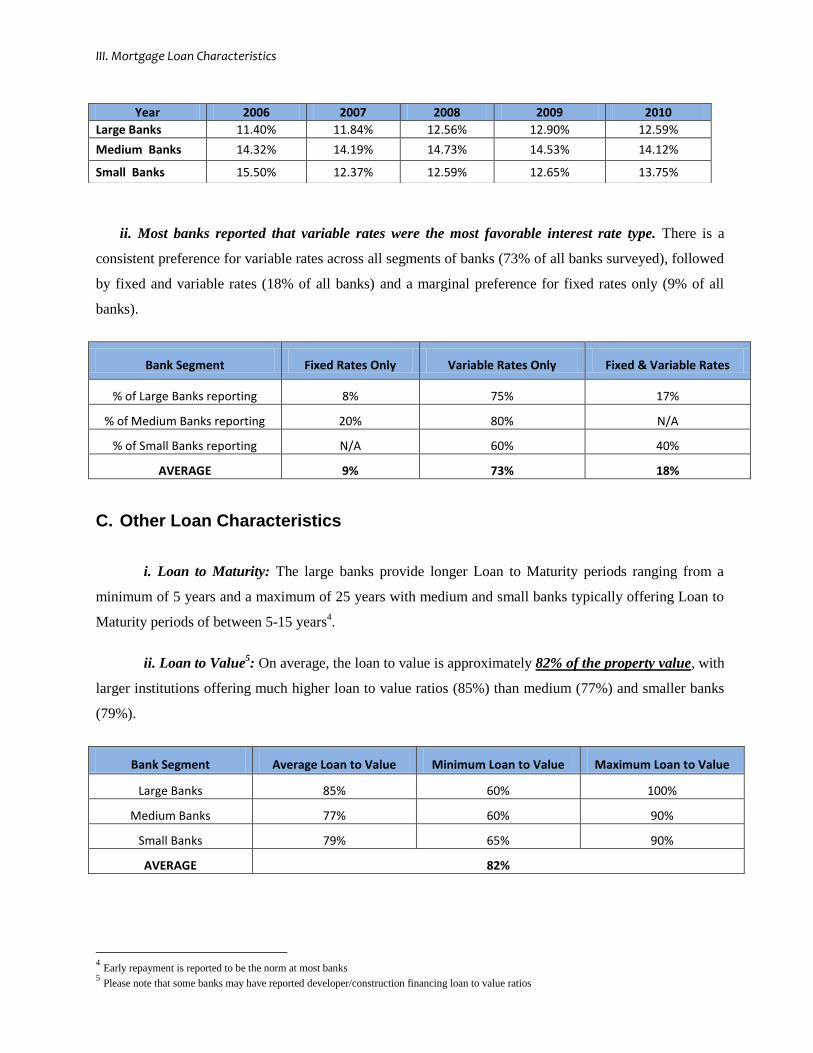
ii. Most banks reported that variable rates were the most favorable interest rate type. There is a
consistent preference for variable rates across all segments of banks (73% of all banks surveyed), followed
by fixed and variable rates (18% of all banks) and a marginal preference for fixed rates only (9% of all
banks).
Bank Segment Fixed Rates Only Variable Rates Only Fixed & Variable Rates
% of Large Banks reporting 8% 75% 17%
% of Medium Banks reporting 20% 80% N/A
% of Small Banks reporting N/A 60% 40%
AVERAGE 9% 73% 18%
C. Other Loan Characteristics
i. Loan to Maturity: The large banks provide longer Loan to Maturity periods ranging from a
minimum of 5 years and a maximum of 25 years with medium and small banks typically offering Loan to
Maturity periods of between 5-15 years4.
ii. Loan to Value5: On average, the loan to value is approximately 82% of the property value, with
larger institutions offering much higher loan to value ratios (85%) than medium (77%) and smaller banks
(79%).
Bank Segment Average Loan to Value Minimum Loan to Value Maximum Loan to Value
Large Banks 85% 60% 100%
Medium Banks 77% 60% 90%
Small Banks 79% 65% 90%
AVERAGE 82%
4 Early repayment is reported to be the norm at most banks
5 Please note that some banks may have reported developer/construction financing loan to value ratios
Year 2006 2007 2008 2009 2010
Large Banks 11.40% 11.84% 12.56% 12.90% 12.59%
Medium Banks 14.32% 14.19% 14.73% 14.53% 14.12%
Small Banks 15.50% 12.37% 12.59% 12.65% 13.75%

III. Mortgage Loan Characteristics
iii. Payment to Income: The average of the maximum allowable debt service ratio is
approximately 51%, with no discernible difference between bank segments.
Bank Segment Average Payment to
Income Ratio Minimum Payment to
Income Ratio Maximum Payment to
Income Ratio
Large Banks 54% 35% 70%
Medium Banks 50% 15% 67%
Small Banks 45% 33% 50%
AVERAGE 51%
iv. Acceptable Collateral: Most banks required both personal guarantees and mortgage lien, with
only 25% of banks reporting that personal guarantees were not required. Several banks also noted that the
first legal charge and personal guarantees were sufficient for collateral purposes.
v. Repayment Schedule: 86% of banks surveyed reported that fixed payments were the preferred
mode of repayment schedules for the duration of the loan, with only a few banks providing for fixed and/or
decreasing payment schedules.
vi. Purpose of Mortgage Loans: A majority of banks indicated that they offer mortgage financing
for house purchase, construction and refinancing purposes. More than 80% of banks provide financing for
home purchase in addition to a wider range of financing possibilities.
vii. Payable Fees6: The most common fees payable reported are:
Legal Fees
Valuation
Arrangement fees (1%)
Stamp Duty
Mortgage protection policy premium
6 Payable fees are estimated at approximately 10% of the mortgage cost

IV. Mortgage Market Constraints
IV. Mortgage Market Constraints
i. Long term access to funds was listed as the most important constraint to the mortgage market
in Kenya. Based on a ranking of mortgage market constraints, banks identified access to long-term funds
as the most important impediment to the growth of their mortgage portfolio. Overlapping constraints of
low level of incomes/informality and credit risk were listed as second and third respectively with high
interest rates also being regarded as a major constraint.
Mortgage Market Obstacles Frequency of
Response
Access to Long Term Funds 21
Low level of incomes/informality 15
Credit Risk (lack of credit histories, documented income, etc.) 11
High interest Rates 10
Difficulties with property registration/titling 7
Cost and time of foreclosing on a property 6
Burden of regulation (provisioning, capital requirements, liquidity rules, etc.) 4
Lack of housing supply - new construction 4
Lack of capacity/skills in banking sector to develop products, carry out loan underwriting 3
Lack of understanding of mortgage product by consumer – lack of financial literacy 2
AIDS/HIV as an inhibitor of long term lending 1
ii. Other Comments regarding constraints
Cost of housing remains one of the
most binding constraints to the
growth of the mortgage market”
High incidental costs of borrowing,
e.g. stamp duty fees, advocate fees,
valuation charges, insurance
premiums, etc”
“Apathy by lenders to finance
property outside urban areas”
“Complicated legislation for land
titling and registration”
“Lack of property price indices and
a lack of information on the property
market hinder mortgage
evaluations”
“Inadequate housing supply
especially in major towns such as
Nairobi, Mombasa and Kisumu
continues to be a challenge”

Annex: Survey Data
2006 2007 2008 2009 2010
Bank Name Bank
Segment
Mortgage Loan Assets
# of Loans
Mortgage Loan
Assets # of
Loans
Mortgage Loan Assets
# of Loans
Mortgage Loan
Assets # of
Loans
Mortgage Loan Assets
# of Loans
KCB Large 4,077,361,000 2,077 6,264,323,000 2,518 9,703,074,000 3,170 15,639,607,000 4,176 17,974,354,000 4051
HFCK Large 8,330,000,000 3,478 8,960,000,000 3,441 11,300,000,000 3,805 15,100,000,000 3,869 16,900,000,000 3988
CFC Stanbic Large 652,415,000 149 2,725,152,000 421 5,349,932,000 743 6,137,238,000 869 6,497,427,000 939
Standard Chartered Large 2,909,875,000 941 3,646,074,000 1,019 4,424,805,000 1,118 4,897,843,000 1,122 4,960,423,000 1107
Barclays Bank Large 968,525,109 254 1,701,917,328 449 2,365,937,424 618 2,913,833,384 726 3,055,270,533 742
Commercial Bank of Africa Large 361,584,000 49 446,911,000 77 911,488,000 150 1,113,257,000 220 1,158,811,000 238
I&M Bank Large 246,496,540 78 323,373,160 70 502,938,415 121 686,304,912 132 732,413,468 135
Equity Bank Large N/A N/A 29,560,000 4 299,272,183 70 537,699,122 129 673,267,179 151
National Bank of Kenya Large N/A N/A N/A N/A 272,877,637 14 452,703,776 36 568,277,703 57
Diamond Trust Bank Large N/A N/A 130,415,000 33 225,684,000 49 350,084,000 69 562,312,000 90
NIC Bank Large N/A N/A 122,897,000 28 379,780,000 52 477,341,000 96 517,096,000 112
Bank of India Large 27,591,000 65 42,890,000 79 109,026,000 93 355,130,000 116 310,215,000 125
Cooperative Bank of Kenya Large N/A N/A N/A N/A N/A N/A 55,515,840 5 246,317,981 27
Prime Bank Large 29,462,291 183 44,366,412 265 42,931,681 532 98,400,674 612 227,551,195 651
Imperial Bank Large 23,044,514 7 51,242,541 15 133,516,944 37 121,388,447 36 128,598,809 37
Bank of Africa Large 62,065,750 27 53,364,165 24 54,960,180 24 74,883,451 25 106,538,418 31
Bank of Baroda Large 52,068,000 67 42,007,000 54 45,263,000 49 45,263,000 88 51,341,000 84
Citibank N.A. Large N/A N/A N/A N/A N/A N/A N/A N/A N/A N/A
Development Bank Medium N/A N/A N/A N/A 683,812,000 60 1,709,598,985 185 1,711,007,860 322
Consolidated Bank of Kenya Medium N/A N/A N/A N/A N/A N/A 207,620,973 18 794,515,803 120
Family Bank Medium 21,954,411 7 89,357,219 22 164,006,996 49 694,779,916 124 663,260,138 154
Victoria Commercial Bank Medium 20,260,875 5 25,888,410 8 17,340,280 7 86,332,458 11 61,080,865 7
Chase Bank Medium 283,187,000 47 380,876,000 75 421,952,000 109 483,110,000 126 528,743,000 151
Fidelity Commercial Bank Medium N/A N/A 10,978,031 3 25,772,217 6 69,800,147 12 113,867,259 19
African Banking Corp Medium 22,331,000 10 31,357,000 11 36,228,000 12 33,243,000 13 58,238,000 15
Giro Bank Medium 19,712,000 8 51,414,000 13 52,306,000 18 48,539,892 14 43,171,609 11
EcoBank Medium 1,215,869,000 302 1,143,673,000 218 1,135,173,000 206 969,013,000 183 1,203,569,000 146
Guardian Bank Medium N/A N/A 10,000,000 2 7,500,000 2 6,219,000 2 3,400,000 1
Fina Bank Medium N/A N/A N/A N/A N/A N/A N/A N/A N/A N/A
Gulf African Bank Medium N/A N/A N/A N/A N/A N/A N/A N/A N/A N/A
Habib AG Zurich Medium N/A N/A N/A N/A N/A N/A N/A N/A N/A N/A
K-Rep Bank Medium N/A N/A N/A N/A N/A N/A N/A N/A N/A N/A
First Community Bank Small N/A N/A N/A N/A N/A N/A N/A N/A 1,162,295,656 157
Paramount Bank Small 108,427,589 51 122,616,638 59 179,146,023 63 160,014,052 72 193,781,768 78
Trans-National Bank Small 17,208,832 5 79,857,962 13 134,487,062 24 190,002,203 34 69,066,731 21
Credit Bank Small N/A N/A 2,707,328 2 10,782,401 5 12,748,830 7 45,897,330 9
Middle East Bank Small 4,166,000 3 5,133,000 4 12,864,000 8 17,734,000 7 34,528,000 9
Habib Bank Small 25,091,000 18 29,401,000 16 34,704,000 16 25,147,000 13 23,295,000 13
Oriental Commercial Bank Small 1,885,773 3 1,495,876 3 2,009,755 3 2,316,323 3 12,282,205 4
Equatorial Bank Small N/A N/A N/A N/A N/A N/A N/A N/A 5,209,000 1
UBA Kenya Small N/A N/A N/A N/A N/A N/A N/A N/A N/A N/A
Dubai Bank Small N/A N/A N/A N/A N/A N/A N/A N/A N/A N/A
City Finance Bank Small N/A N/A N/A N/A N/A N/A N/A N/A N/A N/A
Southern Credit Banking Corp Small N/A N/A N/A N/A N/A N/A N/A N/A N/A N/A
i
TOTAL 19,480,581,683 7,834 26,569,248,069 8,946 39,039,570,198 11,233 53,772,712,385 13,150 61,397,423,508 13,803
i Please note that developer financing loans may have been included in the survey data