mortality differentials by religion in the u.s
TRANSCRIPT
I would like to thank Kristen Harknett, Janice Madden, Robert Hummer, Melissa Wilde, Jason
Schnittker, Samuel Preston, and the participants of the 2007-08 demographic research seminar at the
University of Pennsylvania for their helpful comments.
Mortality Differentials by Religion in the U.S.
Allison R. Sullivan
September 2008
Please do not cite without permission from the author.
This paper examines the relationship between adult mortality and religious affiliation in the
contemporary U.S. using data from the Health and Retirement Study. Jews and Mainline
Protestants have longer life expectancies, even when controlling for background characteristics
such as gender and race. I test whether these mortality differences can be attributed to differences
in education, health behaviors, or psychosocial support. The first two reduce but do not eliminate
mortality differences. The effect of psychosocial support, measured separately by attendance and
importance, varies dramatically by religion. These results show that studies examining the effect
of “religiosity” on health and mortality need to consider differences by religious affiliation.
1 - Sullivan
Introduction
Mortality differentials exist by sex, socioeconomic status, race and ethnicity, and many other
characteristics in the U.S. Less is known about the effect of religion on mortality. Some research
points to a mortality advantage for the religious relative to the unreligious (Bagiella, Hong and
Sloan 2005; Hummer et al. 1999; Koenig, McCullough and Larson 2001; McCullough et al.
2000), but studies have not examined mortality differentials by religion. (Hummer et al. 2004;
Jarvis and Northcott 1987) Data that include both religious affiliation and mortality are difficult
to find, because neither the Census nor vital statistics collect affiliation information.
The Health and Retirement Study (HRS), is a longitudinal panel study of older Americans.
The HRS is representative of the population over age 50. Risks of developing chronic disease
and of dying start to increase after age 50, making the HRS particularly useful for analyzing how
religion affects mortality. Using HRS data, I find differences in life expectancy at age 55 by
religious affiliation as large as 4.5 years, with mainline Protestants having the lowest mortality of
any religious group. This gap is comparable to the difference between males and females (5.1
years) (National Center for Health Statistics 2007), Black and White males (6.2 years) (National
Center for Health Statistics 2007), and educational subgroups (4.5 years) (Hayward et al. 2008).
Many mechanisms may link mortality and religions. The differences in mortality may be due
to the socio-demographic composition of each religion or could be attributable to specific
characteristics of different religions. For example, the rules or norms of a religion may forbid
deleterious behaviors such as drinking or smoking and thus have strong effects on health. Being

2 - Sullivan
part of a religious community may provide social support, which can in turn affect health. I
document mortality differentials across Catholic, Jewish, three Protestant groups (Mainline,
Evangelical, and Black), and those with no religious preference and examine the impact of socio-
demographic composition, health behaviors, and psychosocial support to see how much these
mechanisms explain differences in mortality.
3 - Sullivan
Background
Much of what is known about religious differences in mortality is from historical studies.
Historical mortality differentials by religion are well-documented, particularly for Jews in the
U.S. in the early 20th
century, (Condran and Preston 1994) and Catholics and Protestants in
Europe in the 19th century (van Poppel, Schellekens and Liefbroer 2002). Most historical work
was in response to Durkheim‟s work on suicide and the social integration of Catholics and
Protestants. The mortality conditions today are very different than those 100 years ago. Effective
health behaviors are now more widely known and the risk of infectious disease is much lower.
Nonetheless, mortality differentials by religion have been observed recently in other parts of the
world and the U.S. even when controlling for biological, behavioral, and socioeconomic
differences (Lee and Newberg 2005; Koenig et al. 2001).
More recent studies on religious affiliation and mortality show an association but are based
on data from Europe. A Finnish study of middle-aged men finds higher mortality for Eastern
Orthodox over Lutheran and non-affiliated persons between 1984 and 1989 (Rasanen et al.
1996). Shkolnikov et al. (2004) find large life expectancy gaps (11 years for males) for Jews
relative to non-Jewish Russians in Moscow between 1993 and 1995. O‟Reilly and Rosato (2008)
found elevated mortality risks for Catholics relative to Protestant groups in Ireland, and also
large variations in mortality risks among Protestant sub-groups. These studies are in contexts that
do not fit the U.S. well. For example, the U.S. has more religious diversity than Finland or
Ireland.
4 - Sullivan
Recent U.S. studies are limited. Dwyer, Clarke, and Miller (1990) find mortality differentials
by concentration of religious affiliation by county, but do not address the direct effects of
affiliation at the individual level. Many other studies compare the mortality of one specific
religious subgroup to the rest of the population. Limited research on this subject restricts the
conclusions that can be drawn about the effects of any religion on mortality or how this
relationship may vary over time and place. (Lee and Newberg 2005; Rasanen et al. 1996) These
studies do, however, suggest mechanisms explaining differences.
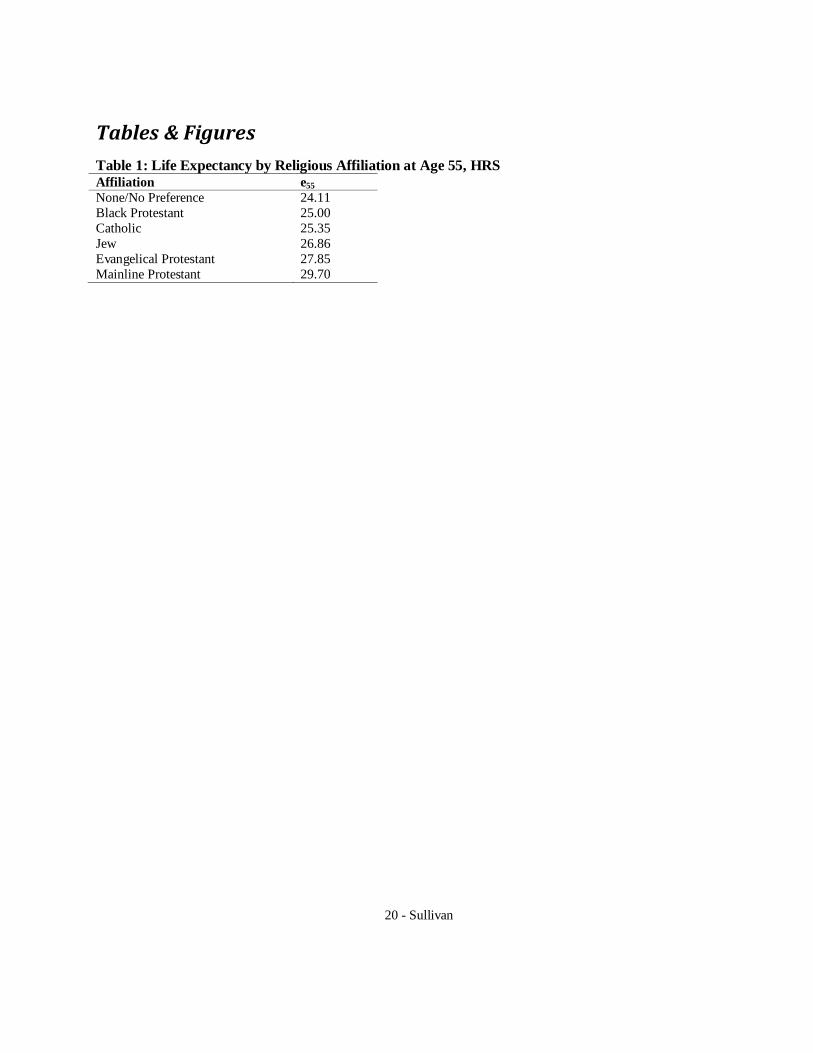
Table 1 shows the differences in life expectancy at age 55 by religious affiliation of the HRS
sample. Many religious groups exist in the U.S., here I look at the largest 6: Mainline
Protestants, Evangelical Protestants, Black Protestants, Catholics, Jews, and those with no
religious preference. Mainline Protestants have a clear mortality advantage over the other groups,
and those with no preference are at a mortality disadvantage.
First, socioeconomic status may partly explain mortality differentials by affiliation. Some
research on fertility differentials has pointed out that “what may seem to be a religious influence
often reflects the fact that the members of any denomination are typically concentrated in a very
few places in the social structure as defined by occupation, education, or any other of the usual
indices.” (Petersen in Mosher and Hendershot 1984). For example, the Russian and Irish studies
both found that the differences in mortality by religious affiliation were mostly accounted for by
the higher levels of socioeconomic status (O'Reilly and Rosato 2008; Shkolnikov et al. 2004).
Members of different religions in the U.S. have documented differences in demographic
composition and socioeconomic status (Smith and Faris 2005). Catholic and Protestant religions
5 - Sullivan
have a larger proportion of female members than Jews and the non-affiliated. Catholics also have
a higher proportion (29%) of Latinos than all other denominations in the HRS sample. Many
(23%) are immigrants from Mexico and other Latin American countries. On the other hand,
Protestants are almost all (94%) U.S.-born. Protestants have a higher proportion Black (16%)
than other denominations. (Pew Research Center 2008) Jews and liberal Protestants (such as
Presbyterians and Episcopalians) have more education and income than other religious groups in
the U.S. whereas those affiliated with Evangelical churches have a lower education distribution
and levels of income. (Lehrer 2004; Pew Research Center 2008; Smith and Faris 2005) The
mortality advantage of Mainline Protestants could be an artifact of their socioeconomic and
racial composition.
Second, denominations vary in their behavioral expectations, which may lead to systematic
health differences. Most contemporary work on religion and mortality differentials has focused
on denominations with strict behavioral codes that prohibit drinking or smoking, such as Seventh
Day Adventists (see Koenig et al. 2001 for a review) and Mormons (Enstrom and Breslow 2008;
Lyon et al. 1983); both these sects have unusually long life expectancies. More broadly, religious
involvement, particularly attendance, is inversely linked with alcohol use with important
differences by affiliation. Conservative Protestants have more abstainers than other religions;
Catholics and liberal Protestants have fewer abstainers and more heavy drinkers; and Jews drink
less. (Koenig et al. 2001). Clearly, excessive alcohol consumption is unhealthy; however,
evidence suggests that moderate alcohol consumption is protective. Religion may also affect how
members respect their bodies, in that many religions teach that gratitude for good health is an
important tenet. (George, Ellison and Larson 2002) Additionally, if religions differ in the amount
6 - Sullivan
of social regulation they exert over their members, the impact of the restrictions may vary. So,
the potential mortality impact of behavioral regulations is not quite clear.
Finally, psychosocial support may link religion and mortality. Involvement in religion is
positively related to psychological well-being (Schnittker 2001), perhaps through access to
supportive social networks and also spiritual comfort members derive from engaging in prayer
and other private activities.
Belonging to a religious group often implies a „community membership‟ or access to a social
network (Jarvis and Northcott 1987). Social support, often measured in terms of participation
and community activities, is known to be protective against mortality (House, Umberson and
Landis 1988; Thoits 1995). Plus, attendance may be a reflection of commitment and integration
into the religious community. Most famously, Durkheim theorized that religions with strong
social ties and behavioral norms deterred suicide. Since Catholics are required to attend religious
services more frequently than Protestants, Durkheim hypothesized that the increased social
contact would lead to greater social integration and lower rates of suicide. Increased social
contact and membership in a social network are both captured in variables that measure the
frequency people attend religious services.
Weekly attendance (versus less regular) at religious services has been shown to be protective
(McCullough et al. 2000; Strawbridge et al. 2001) but the effect of attendance by religious
affiliation is less clear. Given religious differences in values and norms as well as attendance
patterns between religions, it would seem that the effect of attendance would vary by religion. In
fact, many studies on the effect of religiosity ignore religious affiliation (Lehrer 2004). Increased
7 - Sullivan
attendance could plausibly be linked with greater internalization of teachings and a deeper
integration into religious networks, which in turn contribute to greater adherence to normative
behaviors. Other studies looking at religion and fertility have, in fact, found regular attendance to
be a better predictor of fertility than affiliation. (Philipov and Berghammer 2007) For Catholics,
attendance also is necessary for social service provisions to affect fertility levels, an effect not
found for Protestants, (Berman, Iannaccone and Ragusa 2007) implying that attendance may
have different effects for different affiliations.
Attendance at religious services is complicated by health status. Those in poor health are
both less physically able to attend services and more likely to die. Some studies have controlled
for baseline health status and still found significant results, but remembering the limitations of
this measure is important. Using denomination affiliation is advantageous because denomination
is not subject to the endogeneity of attendance with respect to health and mortality.
Religion may be correlated with marital status, another commonly used way to measure
social support (House et al. 1988). Marriage is strongly associated with better health and longer
life (Waite and Lehrer 2003). Being married generally means having a partner to provide
emotional support and leads to increases in economic well-being (Waite and Lehrer 2003).
Marriage is clearly an important factor in adult health, and religions may vary in how they
encourage and support marriage (Waite and Lehrer 2003), so this type of social support may be
different across religions.
Religion can also impact health through spiritual comfort. Religions differ in how they
approach problems; Lee & Newberg (2005) speculate that these differences may have
8 - Sullivan
implications for managing health problems. For example, they say that Buddhist beliefs lead
practitioners to endure pain “matter-of-factly”, Hindus may detach themselves from discomfort,
Jews and Muslims resist pain, and Christians seek “atonement and redemption” (p454). Although
these practices may not affect health directly, they seem to suggest different thresholds and
approaches to seeking medical care. These qualities, however, are difficult, if not impossible, to
measure well, but may explain differences in mortality that cannot be accounted for with
observed behaviors and characteristics.
The differences in psychosocial support by religion are less clear. If psychosocial support is
the mechanism through which religion affects health, then affiliation may be less important than
other indicators of religiosity. Mortality differentials may not be teachings or tenets but instead
members‟ involvement. If social support is the mechanism, then frequency of attendance may
matter more than affiliation. However, some religious groups are more community oriented
while others are more individualistic. To the extent these differences exist, levels of support will
vary by affiliation. Also, the differences between the religious and the unreligious should be
largely eliminated once attendance – not affiliation – is controlled. If spiritual strength and
comfort is the key mechanism through which religion affects health, then religious importance
(measured) and private religious practices (unmeasured) should have strong effects. The effects
might vary between religions, but controlling for importance should, in this instance, reduce the
penalty of the unreligious, who are not exposed to the positive benefits associated with attending
church. (Lehrer 2004)
9 - Sullivan
Drawing on the prior literature, I test three possible explanations for the variation in
longevity by religious affiliation.
Hypothesis 1: If mortality differentials by religion are an artifact of the different
socio-demographic compositions of religious affiliations, controlling for
socioeconomic status and demographic composition should reduce or eliminate the
advantage of Jews and Mainline Protestants. It should also reduce or eliminate the
disadvantage of those with no religious preference (who have a higher proportion of
males) and Black Protestants.
Hypothesis 2: If the relationship between religious affiliation and mortality is a result
of differing health behaviors, then controlling for smoking and drinking should
decrease the advantage of small, strict sects, found mostly in the Evangelical group. It
should also remove some of the disadvantage of the Evangelicals due to their
forgoing the health benefits of moderate alcohol consumption.
Hypothesis 3: If psychosocial support is the important mechanism explaining the
relationship between religion and mortality, then the main effects of attendance and
importance should be protective. It is difficult to predict how this may vary by
affiliation.
10 - Sullivan
Data & Methods
To analyze the mechanisms that may explain mortality differences by religion, I use data
from the HRS1, a panel study of older adults in the U.S. The HRS is representative of the non-
institutionalized adult population over the age of 50, starting in 1992. It includes detailed data on
respondents‟ health and health behaviors and financial and employment status, among other
topics. Respondents included in this study are those who were recruited into the study by 2002.
Those with missing data on key variables, such as religious affiliation, are excluded.2
Respondents who became lost to follow-up are censored at the date of their last interview.
To measure religion and religious affiliation, respondents were asked a series of questions
about religion, starting with, “what is your religious preference, are you Protestant, (Roman)
Catholic, Jewish, or something else?” Protestants were asked which denomination, and those
who said other were asked to specify. Protestants are a large and heterogeneous group. Thus, I
broke them into smaller, more theoretically interesting categories using the groups proposed by
Steensland et al. (2000) The HRS data for 1992, 1994, and 1996 give specific denominations for
Protestant respondents. For respondents from the AHEAD sample (1991 and 1993), as well as
those entering the study in 1998 or later, the HRS only provides affiliation groups,3 which are
inconsistent with literature on religion. Therefore, the Protestant sub-groups only come from
1 More information on the HRS is available elsewhere (http://hrsonline.isr.umich.edu/)
2 Future drafts of this paper will have more detailed information on missing data.
3 I am working to obtain access on the full spectrum of religion data collected by the HRS.
11 - Sullivan
respondents who entered the HRS in 1992, 1994, or 1996, whereas the non-Protestant religion
categories include all waves. Some religious groups were omitted. A few Protestant categories
had very few respondents and the “other religion” (e.g., Muslim, Buddhism) category was too
small and too diverse to be meaningful for analysis. Thus, the categories used here are Catholic,
Jewish, None/No Preference, mainline Protestants4, Evangelical Protestants
5, and Black
Protestants6.
Respondents were asked about religious attendance and importance. In some waves, they
were asked, “About how often have you attended religious services during the last year? (Would
you say more than once a week, once a week, two or three times a month, one or more times a
year, or not at all?)” Respondents who previously said they had no religious preference were not
asked this question in the second wave. In other waves respondents were asked, “How important
would you say religion is in your life; is it very important, somewhat important, or not too
important?”
Covariates used in this analysis include self-reported sex (male or female), race/ethnicity
(non-Hispanic White, non-Hispanic Black, Hispanic, and Other), years of education (0-17+),
marital status (married/partnered, divorced/separated, widowed, and never married), and
smoking and alcohol consumption. The HRS asks about current and former smoking behaviors,
as well as alcohol consumption. Due to slight changes in how respondents were asked about
4 Due to HRS data, “Reformed” Protestants are in the Evangelical, not mainline category
5 All non-denominational Protestants were included in this category.
6 Due to slight differences between HRS and Steensland categorization, 72 Black Protestants were assigned to
this category when they may be Evangelical Protestants.
12 - Sullivan
alcohol consumption, the categories used here are broad: those who never drink, those who drink
moderately, and those who drink heavily. For time-varying covariates, I use the respondent‟s
status at their first interview.
Table 2 presents characteristics of the sample by religion. Variation in mean year of birth by
affiliation is due to the limited availability of Protestant affiliation in select waves. The
proportion male in the no affiliation category is much higher than the others. Mainline
Protestants and Jews include higher proportions of white people and higher mean years of
education. Catholics include more Hispanics than the other groups, and the Black Protestant
group is (by definition) almost entirely Black.7 Black Protestants and those with no preference
have the highest proportion of current smokers; Evangelical Protestants, as expected, have the
highest proportion of those who do not drink. Mainline and Evangelical Protestants have the
highest proportion of currently married people, although this is due at least in part to the slightly
younger age distribution relative to Catholics, Jews, and those with No Preference. Black
Protestants and those with No Preference have higher proportions separated or divorced than the
other religions. Evangelical Protestants and Black Protestants report the highest proportion of
those who say religion is very important to them and also have the highest reported attendance of
all the groups, consistent with the literature on this subject (Lehrer 2004).
To estimate mortality differentials by religious affiliation, I use survival analysis (Cleves,
Gould and Gutierrez 2004). Respondents enter the analysis at the date of their first interview and
7 The religious categories, as mentioned above, are based on those by defined by Steensland
et al., not by race, so Black Protestant refers to denominations that are traditionally Black, not to
Blacks who are Protestants.

13 - Sullivan
continue until their death or the date of their last interview. I first estimate mortality by religion
unadjusted for other characteristics, and then adjusted for other characteristics: gender,
race/ethnicity, and years of education.
14 - Sullivan
Results
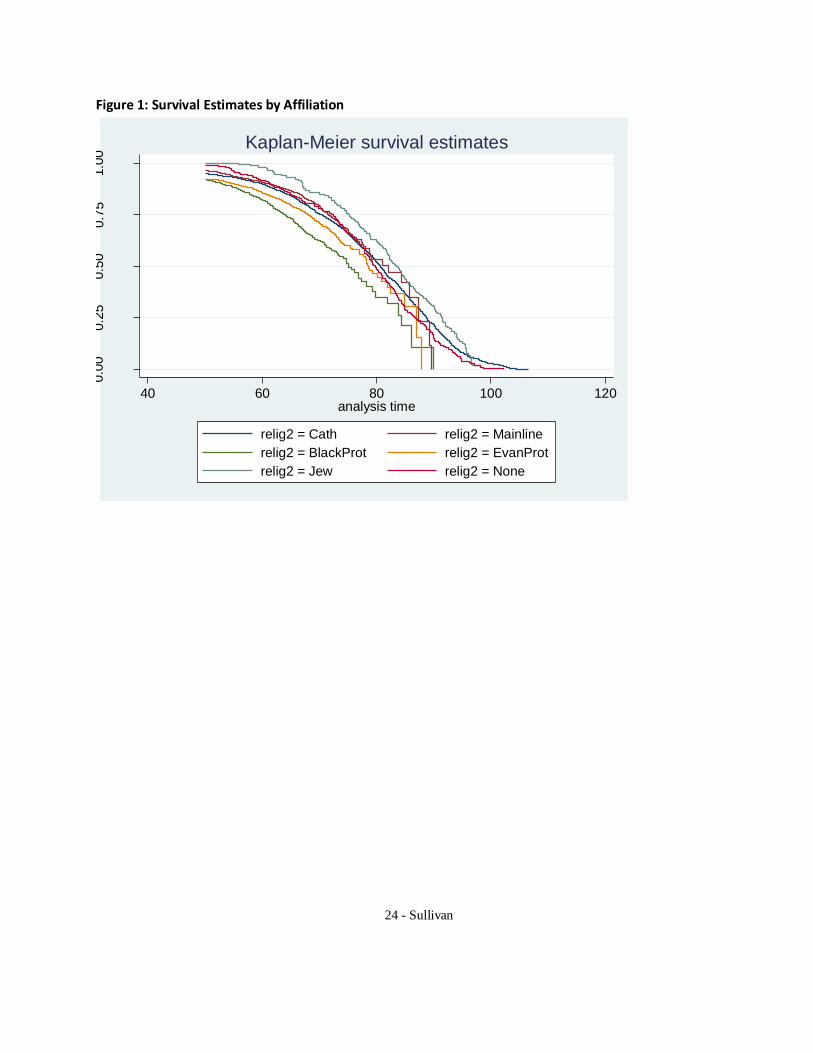
Figure 1 shows the survival rates of the various groups. Jews and Mainline Protestants have
lower mortality levels than their counterparts. Black Protestants, Evangelical Protestants, and
those who report no religious preference have higher levels of mortality than the other groups,
and those who report no religious affiliation have an earlier increase in mortality than those in
each religious group. The curves for the Protestant denominations are not as smooth because of
the smaller samples due to missing affiliation data in some waves. A log-likelihood ratio test
reports significant differences in hazard rates by affiliation.
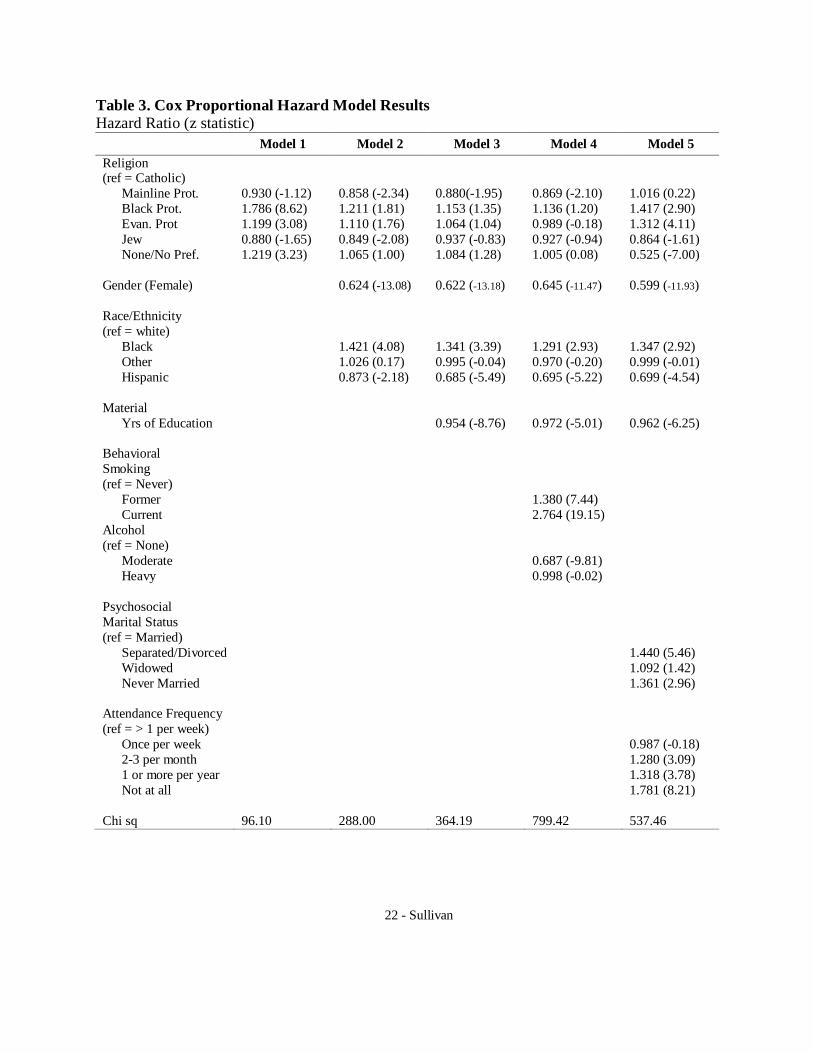
Table 3 shows the results from the Cox models. Model 1 shows the effects of religion on
mortality with no covariates. As compared to Catholics, Mainline Protestants and Jews
experience significantly lower mortality. Other types of Protestants and the non-religious have
significantly higher mortality rates.
Models 2 and 3 test the first hypothesis, the extent to which the gender and race composition
of religions explain mortality differences. This strengthens the effect of being a Mainline
Protestant or Jew, probably due to the higher proportion of Hispanics in the Catholic group. It
reduces the disadvantage for Black Protestants and those with no preference by over half,
probably due to the proportion male and/or Black.
I next test the hypothesis that socioeconomic status explains the religion-mortality variation
by including years of education. Education is very protective; each additional year of education
decreases one‟s hazard of dying by 4.5% and is highly significant. Controlling for education
15 - Sullivan
reduces the differences in relative risk of religious groups only modestly. Thus, socioeconomic
status does not seem to explain the disparities fully, but Jews‟ advantage disappears, and
Evangelical Protestants‟ disadvantage decreases but is still significant.
Health behaviors (hypothesis 2) also seem to explain a modest portion of the differences. Not
surprisingly, smoking increases the hazard of mortality. Former smokers have a highly elevated
risk of dying, and current smokers have an enormously elevated risk. Those who consume
alcohol at moderate levels have a much lower risk than those who do not drink at all. The
magnitude of the effect is hard to know for sure as some who do not drink at all abstain because
they are ill. The effect of heavy drinking is insignificant, probably due to the very low number of
respondents in this category. Controlling for health behaviors increases the advantage of
Mainline Protestants, even though they have among the best health behaviors. It again weakens
the disadvantage of the Black and Evangelical Protestants and those with no preference.
Next I investigate the effects of social support (hypothesis 3). Marriage is protective, relative
to being separated, divorced, widowed, or never married. Attendance displays a roughly u-
shaped pattern of effect. Attending more often than once a week is worse for longevity than once
per week. Attending 2-3 times per month or 1 or more times per year have approximately the
same effect. Not attending at all is associated with a much higher risk than attending regularly.
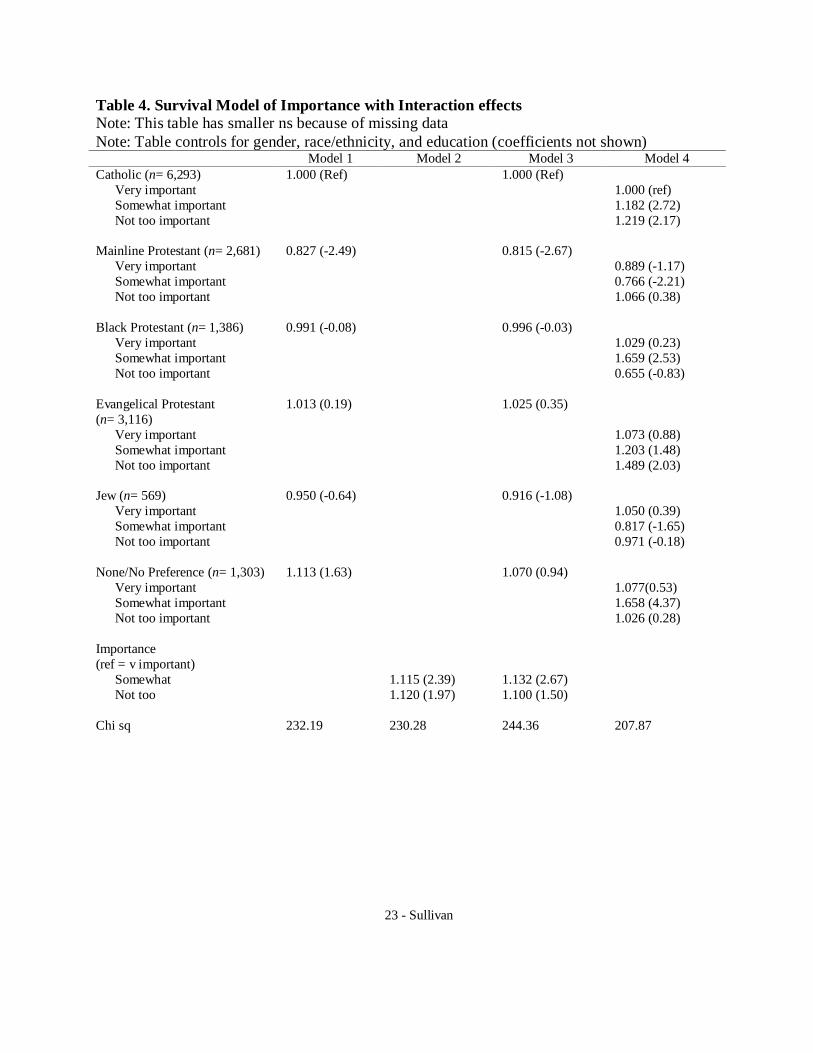
Table 4 focuses on the importance of religion. The models in Table 4 control for gender and
race/ethnicity. Respondents who had missing data for attendance are excluded from this model;
the sample is slightly unbalanced between table 3 and 4 so this has a small effect on the results.
Model 1 is the same as model 3 in the previous table except for the slightly smaller sample due
16 - Sullivan
to missings on importance. Model 2 controls for importance but not affiliation. If denomination
is causally affecting mortality, those who have the strongest feelings should have the biggest
effect; however, this does not seem to be the case. Although those who say religion is very
important have a lower risk of mortality than those who say religion is somewhat or not too
important, the effect of religion being somewhat or not too important is similar. It does not
appear that there is a dose-response relationship of religious importance and mortality. Model
three includes affiliation and importance. Controlling for both affiliation and importance does
not affect the denomination variables a lot, with the exception of Jews and the None/No
Preference group, both of whom see a small decrease in their hazard ratios relative to Catholics.
Given that importance is protective, the relatively low mortality of Jews is in spite of low
importance.
The effect of importance differs by affiliation, as shown in model 4.8 Model 4 has dummy
variables for importance by affiliation. For Catholics and Evangelical Protestants, the importance
of religion has a positive relationship with mortality. Mainline Protestants and Jews seem to have
the largest mortality advantage when religion is somewhat important. On the other hand, the
None/No Preference group is worst off when religion is somewhat important. Black Protestants
who say religion is not too important seem to have very low mortality, but this is probably an
artifact of the very small number of people in that category. Surprisingly, the effect of
importance of religion does not follow a consistent pattern across religions.
8 A future version of this paper will analyze the effect of importance in greater detail.
17 - Sullivan
Conclusion
I have examined mortality differentials by religious affiliation, an understudied subject, using
a large and representative longitudinal dataset from the U.S. I find that Mainline Protestants have
a large and robust mortality advantage over Black Protestants, Catholics, and Evangelical
Protestants. Jews also have a mortality advantage, although the advantage is mostly explained by
higher levels of education. I tested three different explanations of these differentials: socio-
demographic status, health behaviors, and psychosocial support.
Socio-demographic status reduces some of the differences. It reduces much of the
disadvantage of Black Protestants and those with no religious preference, and some of the
disadvantage for Evangelical Protestants. Surprisingly, the advantage of Mainline Protestants
increases when these controls are added.
Controlling for smoking and drinking behaviors (health behaviors that some religions
explicitly prohibit) also mediates the differentials. Mainline Protestants, however, still have a
sizeable, significant advantage. The Black and Evangelical Protestants are adversely affected by
their health behaviors. Controlling for drinking and smoking reduces their disadvantage.
Lastly, controlling for psychosocial support using marriage and attendance and importance
changes the story dramatically. These results tell us that mortality differentials by religion exist
beyond socioeconomic status, and that the psychosocial support that practicing members of a
denomination receive has large effects on mortality.

18 - Sullivan
These findings are similar to other research that has found protective effects for attendance,
but with large qualifications. Most other studies focus on only religiosity, looking at attenders
versus non-attenders. Little research has looked at the effects of any particular denomination.
The results here show that religiosity differs by affiliation, and that attendance and importance
have different effects for different affiliations. Hummer et al. (1999) point out that the effect of
religion disappears for those with 16+ years of education, an important qualifier given the
different educational distributions by religion. Using attendance to measure the relationship
between mortality and religion is inherently problematic; however, because illness may interfere
with one‟s ability to attend services. New research needs to consider these issues more carefully.
There are some important limitations to this research. The effect of religion, particularly on
health behaviors, is only effective to the extent that members obey guidelines. There are also
issues of reverse causation and selectivity. It seems likely that religious commitment may change
with age or with the onset of illness. Illness might affect religious commitment, although how so
is difficult to speculate. Also, we do not have information on the religion in which respondents
were raised. Religion switching may mask early life effects of membership in different religions,
and those who change religions may be unique.
Understanding more about how different religious affiliations impact health and mortality
can follow many directions. Future research should look into cause-specific mortality
differentials by religion to see if any diseases show an affiliation differential. Future research
should also address the specific psychosocial support from religion more directly. Is religion a
unique type of social support, or do other organized groups offer the same mortality advantage?

19 - Sullivan
The U.S. is a unique context to study religion because of its exceptional diversity and extent
of religious involvement. As religion continues to play in important role in American society, it
is important to understand more about the relationship between religion and health and mortality.
20 - Sullivan
Tables & Figures
Table 1: Life Expectancy by Religious Affiliation at Age 55, HRS Affiliation e55
None/No Preference 24.11
Black Protestant 25.00
Catholic 25.35
Jew 26.86
Evangelical Protestant 27.85
Mainline Protestant 29.70

21 - Sullivan
Table 2: Descriptive Statistics by Affiliation, HRS
Proportion or Mean (S.D.)
Mainline
Protestant
n = 2,846
Black
Protestant
n = 1,526
Evan-
gelical
Protestant
n = 3,364
Catholic
n =7,121
Jewish
n =663
None/
No Pref.
n =1,464
Year of Birth 1936.2
(5.7)
1936.6
(5.6)
1936.9
(5.7)
1930.7
(11.8)
1926.0
(12.6)
1933.3
(12.4)
% Male 47.3 41.6 45.8 42.8 44.3 59.9
Race/Ethnicity
% White 94.4 0.6 87.8 72.1 98.3 82.8
% Black 3.0 99.2 5.0 3.2 0.6 9.5
% Hispanic 0.8 0.0 4.9 22.9 0.8 4.3
% Other 1.8 0.2 2.2 1.8 0.3 3.4
SES
School Yrs (0-17) 13.1 (2.53) 11.0 (3.17) 11.7 (2.90) 11.2 (3.86) 13.8 (2.99) 12.4 (3.56)
Behaviors
Smoking
% Current 18.1 22.1 20.2 15.4 6.6 22.3
% Former 46.4 42.1 40.7 45.6 55.1 49.3
% Never 35.5 35.8 39.1 39.1 38.2 28.4
Drinking
% Never 27.0 48.6 57.4 36.2 33.0 32.0
% Moderate 71.4 49.4 41.1 62.2 66.5 64.1
% Frequent 1.6 2.0 1.5 1.6 0.4 3.9
Marital Status
% Married 84.7 64.7 84.5 73.4 74.5 72.9
% Separated/
Divorced 9.7 19.5 9.2 7.5 5.9 13.3
% Widowed 3.3 10.5 4.8 15.7 17.6 10.7
% Never Married 2.2 5.3 1.6 3.4 2.0 3.1
Importance of Religion
Very 51.3 88.2 72.8 64.0 32.2 21.5
Somewhat 36.2 9.9 21.1 27.4 44.1 25.9
Not very 12.5 2.0 6.1 8.6 23.8 52.6
Attendance Frequency
> 1 per week 6.4 20.5 26.1 11.7 4.3 2.3
Once per week 19.1 27.0 17.8 36.7 5.9 5.4
2-3 per month 18.0 24.4 12.0 13.4 11.7 4.5
1 or more per year 29.9 18.4 19.7 21.2 49.9 22.0
Not at all 26.6 9.7 24.5 16.9 28.2 65.9
# Deaths 351 323 493 1,596 188 321
22 - Sullivan
Table 3. Cox Proportional Hazard Model Results
Hazard Ratio (z statistic)
Model 1 Model 2 Model 3 Model 4 Model 5
Religion (ref = Catholic)
Mainline Prot. 0.930 (-1.12) 0.858 (-2.34) 0.880(-1.95) 0.869 (-2.10) 1.016 (0.22)
Black Prot. 1.786 (8.62) 1.211 (1.81) 1.153 (1.35) 1.136 (1.20) 1.417 (2.90)
Evan. Prot 1.199 (3.08) 1.110 (1.76) 1.064 (1.04) 0.989 (-0.18) 1.312 (4.11)
Jew 0.880 (-1.65) 0.849 (-2.08) 0.937 (-0.83) 0.927 (-0.94) 0.864 (-1.61)
None/No Pref. 1.219 (3.23) 1.065 (1.00) 1.084 (1.28) 1.005 (0.08) 0.525 (-7.00)
Gender (Female) 0.624 (-13.08) 0.622 (-13.18) 0.645 (-11.47) 0.599 (-11.93)
Race/Ethnicity
(ref = white)
Black 1.421 (4.08) 1.341 (3.39) 1.291 (2.93) 1.347 (2.92)
Other 1.026 (0.17) 0.995 (-0.04) 0.970 (-0.20) 0.999 (-0.01)
Hispanic 0.873 (-2.18) 0.685 (-5.49) 0.695 (-5.22) 0.699 (-4.54)
Material
Yrs of Education 0.954 (-8.76) 0.972 (-5.01) 0.962 (-6.25)
Behavioral
Smoking
(ref = Never)
Former 1.380 (7.44)
Current 2.764 (19.15)
Alcohol
(ref = None)
Moderate 0.687 (-9.81)
Heavy 0.998 (-0.02)
Psychosocial
Marital Status
(ref = Married)
Separated/Divorced 1.440 (5.46)
Widowed 1.092 (1.42)
Never Married 1.361 (2.96)
Attendance Frequency
(ref = > 1 per week)
Once per week 0.987 (-0.18)
2-3 per month 1.280 (3.09)
1 or more per year 1.318 (3.78)
Not at all 1.781 (8.21)
Chi sq 96.10 288.00 364.19 799.42 537.46
23 - Sullivan
Table 4. Survival Model of Importance with Interaction effects
Note: This table has smaller ns because of missing data
Note: Table controls for gender, race/ethnicity, and education (coefficients not shown) Model 1 Model 2 Model 3 Model 4
Catholic (n= 6,293) 1.000 (Ref) 1.000 (Ref)
Very important 1.000 (ref)
Somewhat important 1.182 (2.72)
Not too important 1.219 (2.17)
Mainline Protestant (n= 2,681) 0.827 (-2.49) 0.815 (-2.67)
Very important 0.889 (-1.17)
Somewhat important 0.766 (-2.21)
Not too important 1.066 (0.38)
Black Protestant (n= 1,386) 0.991 (-0.08) 0.996 (-0.03)
Very important 1.029 (0.23)
Somewhat important 1.659 (2.53)
Not too important 0.655 (-0.83)
Evangelical Protestant
(n= 3,116)
1.013 (0.19) 1.025 (0.35)
Very important 1.073 (0.88)
Somewhat important 1.203 (1.48)
Not too important 1.489 (2.03)
Jew (n= 569) 0.950 (-0.64) 0.916 (-1.08)
Very important 1.050 (0.39)
Somewhat important 0.817 (-1.65)
Not too important 0.971 (-0.18)
None/No Preference (n= 1,303) 1.113 (1.63) 1.070 (0.94)
Very important 1.077(0.53)
Somewhat important 1.658 (4.37)
Not too important 1.026 (0.28)
Importance
(ref = v important)
Somewhat 1.115 (2.39) 1.132 (2.67)
Not too 1.120 (1.97) 1.100 (1.50)
Chi sq 232.19 230.28 244.36 207.87
24 - Sullivan
Figure 1: Survival Estimates by Affiliation 0.0
00.2
50.5
00.7
51.0
0
40 60 80 100 120analysis time
relig2 = Cath relig2 = Mainline
relig2 = BlackProt relig2 = EvanProt
relig2 = Jew relig2 = None
Kaplan-Meier survival estimates

25 - Sullivan
References
Bagiella, E., V. Hong, and R.P. Sloan. 2005. "Religious attendance as a predictor of survival in the EPESE cohorts." International Journal of Epidemiology 34(2):443-451.
Berman, E., L.R. Iannaccone, and G. Ragusa. 2007. "From empty pews to empty cradles: Fertility decline among European Catholics."
Cleves, M.A., W.W. Gould, and R.G. Gutierrez. 2004. An Introduction to Survival Analysis Using Stata(R). College Station, TX: Stata Press.
Condran, G.and S.H. Preston. 1994. "Child mortality differences, personal health care practices, and medical technology: The United States, 1900-1930." in Health and Social Change in
International Perspective, edited by L.C. Chen, A. Kleinman, and N.C. Ware. Boston, MA: Harvard University Press.
Dwyer, J.W., L.L. Clarke, and M.K. Miller. 1990. "The effect of religious concentration and affiliation on county cancer mortality rates." Journal of Health and Social Behavior 31(2):185-202.
Enstrom, J.E.and L. Breslow. 2008. "Lifestyle and reduced mortality among active Califomia Mormons, 1980-2004." Preventive Medicine 46(2):133-136.
George, L.K., C.G. Ellison, and D.B. larson. 2002. "Explaining the relationships between religious involvement and health." Psychological Inquiry 13(3):190-200.
Hayward, M.D., E.M. Crimmins, R.A. Hummer, M. Hidajat, and D. Brown. 2008. "How much life does a good education buy?" in Population Association of America. New Orleans, LA.
House, J.S., D. Umberson, and K.R. Landis. 1988. "STRUCTURES AND PROCESSES OF SOCIAL SUPPORT." Annual Review of Sociology 14:293-318.
Hummer, R.A., C.G. Ellison, R.G. Rogers, B.E. Moulton, and R.R. Romero. 2004. "Religious involvement and adult mortality in the United States: Review and perspective." Southern Medical Journal 97(12):1223-1230.
Hummer, R.A., R.G. Rogers, C.B. Nam, and C.G. Ellison. 1999. "Religious involvement and US adult mortality." Demography 36(2):273-285.
Jarvis, G.K.and H.C. Northcott. 1987. "Religion and differences in morbidity and mortality." Social Science & Medicine 25(7):813-824.
Koenig, H.G., M.E. McCullough, and D.B. Larson. 2001. Handbook of religion and health. Oxford ; New York: Oxford University Press.
Lee, B.Y.and A.B. Newberg. 2005. "Religion and health: A review and critical analysis." Zygon 40(2):443-468.
Lehrer, E.L. 2004. "Religion as a determinant of economic and demographic behavior in the United States." Population and Development Review 30(4):707-+.
Lyon, J.L., M.R. Klauber, J.W. Gardner, and C.R. Smart. 1983. "Cancer Incidence in Mormons and Non-Mormons in Utah, 1966-1970." Ca-a Cancer Journal for Clinicians 33(5):309-316.
26 - Sullivan
McCullough, M.E., W.T. Hoyt, D.B. Larson, H.G. Koenig, and C. Thoresen. 2000. "Religious involvement and mortality: A meta-analytic review." Health Psychology 19(3):211-222.
Mosher, W.D.and G.E. Hendershot. 1984. "Religious Affiliation and the Fertility of Married-Couples." Journal of Marriage and the Family 46(3):671-677.
National Center for Health Statistics. 2007. "Health, United States, 2007." Hyattsville, MD.
O'Reilly, D.and M. Rosato. 2008. "Religious affiliation and mortality in Northern Ireland: Beyond Catholic and Protestant." Social Science & Medicine 66:1637-1645.
Pew Research Center. 2008. "U.S. Religious Landscape Survey 2008." Washington, DC: Pew Research Center.
Philipov, D.and C. Berghammer. 2007. "Religion and fertility ideals, intentions, and behavior: A comparative study of European countries." Vienna Yearbook of Population Research:271-305.
Rasanen, J., J. Kauhanen, T.A. Lakka, G.A. Kaplan, and J.T. Salonen. 1996. "Religious affiliation and all-
cause mortality: A prospective population study in middle-aged men in eastern Finland." International Journal of Epidemiology 25(6):1244-1249.
Schnittker, J. 2001. "When is faith enough? The effects of religious involvement on depression." Journal for the Scientific Study of Religion 40(3):393-411.
Shkolnikov, V.M., E.M. Andreev, J. Anson, and F. Mesle. 2004. "The peculiar pattern of mortality of Jews in Moscow, 1993-95." Population Studies-a Journal of Demography 58(3):311-329.
Smith, C.and R. Faris. 2005. "Socioeconomic inequality in the American religious system: An update and assessment." Journal for the Scientific Study of Religion 44(1):95-104.
Steensland, B., J.Z. Park, M.D. Regnerus, L.D. Robinson, W.B. Wilcox, and R.D. Woodberry. 2000. "The
Measure of American Religion: Toward Improving the State of the Art." Social Forces 79(1):291-318.
Strawbridge, W.J., S.J. Shema, R.D. Cohen, and G.A. Kaplan. 2001. "Religious attendance increases
survival by improving and maintaining good health behaviors, mental health, and social relationships." Annals of Behavioral Medicine 23(1):68-74.
Thoits, P.A. 1995. "STRESS, COPING, AND SOCIAL SUPPORT PROCESSES - WHERE ARE WE - WHAT NEXT." Journal of Health and Social Behavior:53-79.
van Poppel, F., J. Schellekens, and A.C. Liefbroer. 2002. "Religious differentials in infant and child mortality in Holland, 1855-1912." Population Studies-a Journal of Demography 56(3):277-289.
Waite, L.J.and E.L. Lehrer. 2003. "The benefits from marriage and religion in the United States: A comparative analysis." Population and Development Review 29(2):255-+.