mortality and ingrowth pattern of dipterocarps in forest recovery in
TRANSCRIPT

MORTALITY AND INGROWTH PATTERN OF DIPTEROCARPS IN FOREST RECOVERY IN EAST
KALIMANTANFARIDA H. SUSANTY, ENDANG SUHENDANG , I NENGAH SURATI JAYA2 2
and CECEP KUSMANA3
1Researcher on Dipterocarps Research Center, Samarinda 75119, Indonesia2Department of Forest Management, Institut Pertanian Bogor (IPB), Bogor 16680, Indonesia
3Department of Silviculture, Institut Pertanian Bogor (IPB), Bogor 16680, Indonesia
Received /Accepted 3 May 2013 24 November 2014
ABSTRACT
In primary and logged-over natural forest trees conditions tree structure, mortality and ingrowth rates , the such as will vary according to the species characteristic. Quantitative management variables become very important to support yield regulation tools for achieving sustainable forest management. The objective was to determine studymortality and ingrowth rates to formulate biometric characteristic variability Dipterocarps forest in logged-over of forests based on time series The was Labanan, East Kalimantan Province. Permanent data. study site located in measurement within -over were located to represent three , i.e plots logged forest different logging techniques . a) reduced impact logging with diameter limit 50 cm (RIL 50); b RIL 60; c conventional logging; and d) primary forest ) ) as control Total plot permanent area was 48 ha and was measured periodically every 2 years within 17 years after . aboutlogging. For data analysis purpose, trees were divided into Dipterocarps and non-Dipterocarps. two major groups, i.e. Range of mortality rates for all species in logged-over forest were 2.5-29.3% per ha per 2 years which was close very to primary forest at year-5 after logging. While range of ingrowth rate for all species in logged-over forest were 1.3-21.3% per ha per 2 years which were higher than those for the primary forest within 17 years. The mortality and ingrowth rates fluctuation of Dipterocarps species group were different from those of non-Dipterocarps.
: Keywords Dipterocarps, ingrowth, logged-over forest, mortality
INTRODUCTION
Lowland tropical rain forest is a natural forest with trees having typical characteristics, harboring the greatest species diversity in the world (Whitmore 1990; Richards 1996) and having numerous variations of tree's dimensions (Prodan 1968). Lowland tropical rain forests in Southeast Asia are dominated by Dipterocarpaceae (Ashton 1982), therefore, it is often referred to as the Dipterocarp forests. Dipterocarp forest is a tropical rainforest inhabiting type A and type B climate types area, covering Sumatera, Kalimantan, Sulawesi, North Maluku and Papua with the highest layer of forest canopy filled with family Dipterocarpaceae, especially genus Shorea,Dipterocarpus, Dryobalanops Hopea and (Ashton 1982). Dipterocarp forest in West Malesia region
is the most productive tropical forest types based on timber value (FAO 2001). In Indonesia, Dipterocarpaceae is the largest contributor (over 25%) to commercial timber forests in decades, with volume of 50-100 m per ha, especially in 3
Kalimantan (Sist . 2003)et al .In primary and logged-over natural forest, the
stand stand conditions having differences in structure, species composition, tree density, canopy structure, mortality and ingrowth, will have varied growth rates depending on tree the age after logging (Silva . 1995; Lewis . 2004; et al et alIshida . 2005). Recovery of a logged-over et al forest happens in a long period after logging (Smith & Nichols 2005), which varies depending on deforestation rate and environmental carrying capacity (Muhdin . 2008). Natural production et alforests in Indonesia have more than 50% of logged-over forests (Ditjen Planologi Kehutanan 2011). Therefore, it is very important to know * Corresponding author : [email protected]
BIOTROPIA Vol. 22 No. 1, 2015: 11 - 23 DOI: 10.11598/btb.2015.22.1.297
11
BIOTROPIA Vol. 22 No. 1, 2015
12
about the variation of tree characteristics in a logged-over forest. Biology and ecology information of Dipterocarps is needed as scientific basis for developing effective forest management policies (Naito . 2008).et al
Forest biometric characteristics is among quantitative approaches to study the properties or characteristics of forest trees in size (metric) for a specific biological dimension as the user identification by ratio and interval scale (Prodan 1968). Input variables to determine quantitative tools are mostly provided by classical forest inventories on plots (Vanclay 2003; Gourlet-Fleury . 2005). Most of the early biometric et alresearch are found in studies on plantations and temperate forests that do not have such complexity as tropical forests. The heterogeneity and complexity of obstacles occur in the forms of diversity and variation of conditions as well as limitations or lack of long term data observation. Average rate of mortality and its correlations to several reliable and measurable variables in size or site characteristics as input factors mostly determine the mortality model (Keister 1972; Hamilton & Edwards 1976; Monserud 1976; Hamilton 1994; Monserud & Sterba 1999; cited Flewelling & Monserud 2002). According to Chertov . (2005), a new paradigm in achieving et alsustainable forest management requires prediction of effective growth forest tree dynamics involving aspects of ecological characteristics.
To achieve sustainable forest management, preparation of quantitative management tools such as yield regulation models becomes very important. Important variables needed to build the models are mortality and ingrowth rates of forest trees. This aimed to determine studymortality and ingrowth rates of Dipterocarps and non-Dipterocarps spesies groups for 17 years after being logged, which rates will be used to
formulat biometric characteristics variability e of Dipterocarp forest in logged-over forests based on time series data.
MATERIALS AND METHODS
Study Site
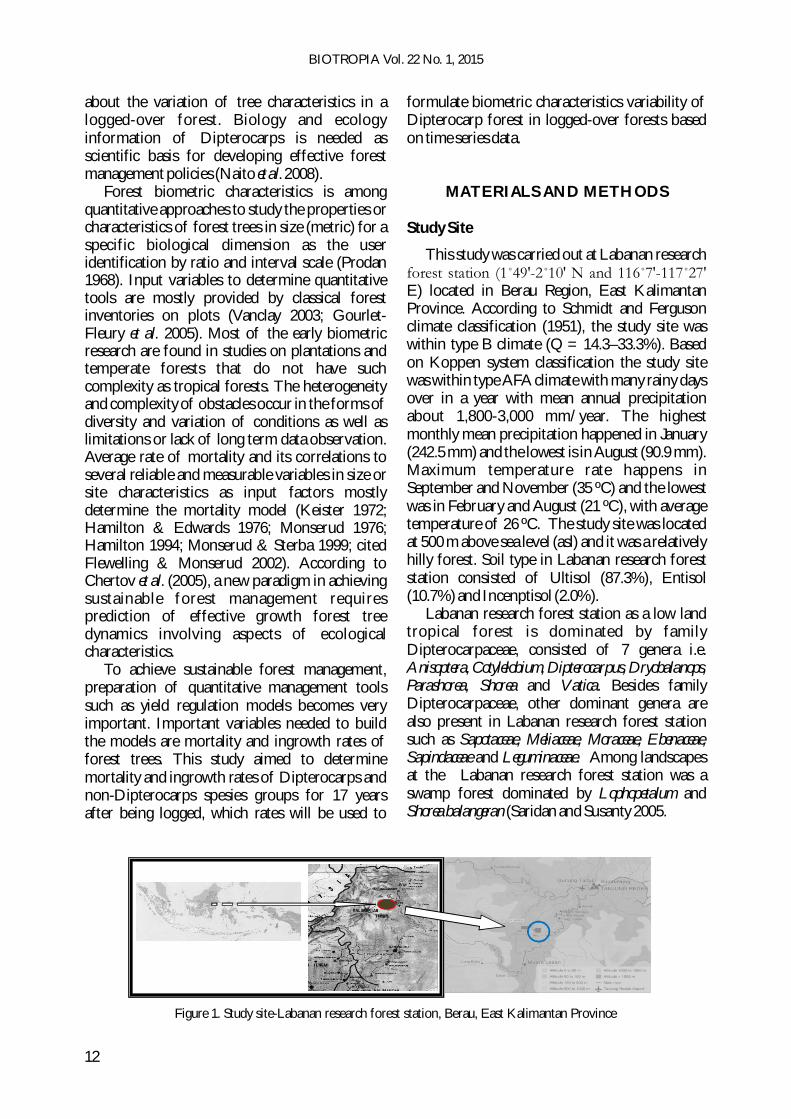
This study was carried out at Labanan research forest station (1˚49'-2˚10' N and 116˚7'-117˚27' E) located in Berau Region, East Kalimantan Province. According to Schmidt and Ferguson climate classification (1951), the study site was within type B climate (Q = 14.3–33.3%). Based on Koppen system classification the study site was within type AFA climate with many rainy days over in a year with mean annual precipitation about 1,800-3,000 mm/year. The highest monthly mean precipitation happened in January (242.5 mm) and the lowest is in August (90.9 mm). Maximum temperature rate happens in September and November (35 ºC) and the lowest was in February and August (21 ºC), with average temperature of 26 ºC. The study site was located at 500 m above sea level (asl) and it was a relatively hilly forest. Soil type in Labanan research forest station consisted of Ultisol (87.3%), Entisol (10.7%) and Incenptisol (2.0%). Labanan research forest station as a low land tropical forest is dominated by family Dipterocarpaceae, consisted of 7 genera i.e. Anisoptera, Cotylelobium, Dipterocarpus, Dryobalanops, Parashorea, Shorea Vatica and . Besides family Dipterocarpaceae, other dominant genera are also present in Labanan research forest station such as Sapotaceae, Meliaceae, Moraceae, Ebenaceae, Sapindaceae Leguminaceae and . Among landscapes at the Labanan research forest station was a swamp forest dominated by and Lophopetalum Shorea balangeran (Saridan and Susanty 2005.
Figure 1. Study site-Labanan research forest station, Berau, East Kalimantan Province

Mortality and ingrowth pattern of dipterocarps in forest recovery in East Kalimantan Farida H. Susanty – et al.
Data Collecting
Permanent plots were set up in the logged-over forest as well as in the primary forest. The size of each plot was 200x200 m (4 ha) which was divided into 4 square subplots with size of 100x100 m (1 ha). The permanent plots were built in 4 condition variations with total area of 48 ha. Measurements were carried out by census method for all species with limit diameter of 10 cm including number of trees, tree species, stem diameter (diameter at breast height or 20 cm above buttresses) and number of dead trees. Repeated measurements were performed every two years. Reduced impact logging can be defined as logging technique to minimize environment impact on forest trees and soils (Dykstra 2008). This technique is needed to preserve ecological aspect of forest trees and to ensure sustainable yield of production forest in the future. Data used in this study were data collected from 1990 to 2008. Treatments applied on research plots were as follows:a) RIL 50: reduced impact logging techniques
with limit diameter of 50 cm, skid trail planning was based on contour maps and tree position as well as supervision of tree felling and skidding (3 plots).
b) RIL 60: reduced impact logging techniques with limit diameter of 60 cm, skid trail planning was based on contour maps and tree position as well as supervision of tree felling and skidding (3 plots).
c) CNV: conventional logging techniques with limit diameter of 60 cm, no skid trail planning, conducted without considering contour line maps or tree position, felling was done by loggers experiences (3 plots).
d) PF: primary forest as controls (3 plots).
Data Analysis
Data organization was carried out using database software Microsoft Visual FoxPro 9.0, while data analysis was performed by using spreadsheet and SPSS 15.0. Data were analyzed based on tree density and tree structure (stems per ha) as well as basal area (m per ha) with two major 2
species groupings e.g. Dipterocarps and non-Dipterocarps species. Calculations of mortality and ingrowth rates were performed every 2 years. Residual tree characteristics assessment was done by comparing variations in forest conditions by
using different test mean values (t-test), analysis of variance (ANOVA) and regression analysis. Regression equation tested was linear equations, polynomials, exponential and logarithmic. Criteria used for selecting the best equation were based on the regression coefficient (r), determination coefficient (R ) and the highest 2
value of the smallest standard error (SE) (Steel & Torrie 1995)
RESULTS AND DISCUSSION
Tree Density
The dynamics of logged-over forest within 17 years were represented by number of trees per hectare and basal area per hectare against tree fluctuations after-logging using different logging techniques (Fig. 2). Mean values of tree density at the initial conditions (pre-harvest) were compared using t-test and the results showed no significant differences in all study plots (t <t ). Fluctuations of tree density calc tab(0:05; 6)
and basal area of logged-over forest would increase up to the initial conditions before logging (primary forest). Logged-over Dipterocarp forest recovery reached the conditions close to the primary forest at 9 years after-logging based on tree density and at 11 years after-logging based on basal area. According to Gourlet-Fleury . et al(2005) and Kao and Iida (2006), tree density extremely increases at 5 to 7 years after-logging, which was explained by the increasing growth of open canopy in after-logging periods. Range of tree density in the studied logged-over forest was 461-647 stems per ha with average value of 531 stems per ha. Sianturi and Kanninen (2005) stated that at the period of 2 years after-logging in Jambi forest, the tree density reached 90% compared with tree density at the same forest before logging. Tree density in a primary forest in Sangai, Central Kalimantan (478-738 stems per ; haaverage of 583 stems per ) was similar to tree hadensity in Labanan forest (Susanty 2006). This study results were also similar to the condition in eastern Amazon forest showing average tree density of 480±96.6 stems per ha (Sist & Ferreira 2007). While Gourlet-Fleury . (2005) et alpresented higher value of tree density for French Guiana forest (625 stems per ha).
13

Range of basal area value in the studied logged-over forest was 19.35-31.84 m per ha. As 2
comparisons, basal area value in a several years after-logging forest in Central Kalimantan ranged from 16.4 to 26.7 m per (Krisnawati 2001). A 2
study conducted by Setiawan (2013) showed that basal area value in a logged-over forest in Muara Wahau, East Kalimantan ranged from 12.63 to 32.57 m per ha, while basal area value in a 2
primary forest in Muara Wahau, East Kalimantan ranged from 27.80 to 32.57 m per ha. Basal area 2
value in Amazon forest had average of 28±4 m 2
per ha (Sist & Ferreira 2007). In logged-over forests, tree density was about 93-102% and basal area were about 81.0-88.8% compared with initial condition or before logging condition. Based on this result, the recovery pattern of forest seemed to have positive trend with similar variations. The tree density after-logging variable is important to know ecological sustainability (Sist . 2003; Smith & Nichols et al2005; Muhdin 2012). This variable may indicate the level of all logged-over forest which have well recovered, with assumption no interference or disturbance, thereafter. Different recovery patterns of logged-over forest influenced ecological factor and forest tree condition. Growth monitoring on a 24 ha permanent sample plots in silviculture experiments in Amazônia (1980-1989) indicated that even in the same block of concession area, forest recovery has different characteristics and patterns shown by fluctuations of tree dynamic (Silva 1995). Initial et al.succession process in logged-over forests started from the end of logging operational, followed by growing process in a time series function.
Mortality Rates
The mortality level in different logging techniques is influenced by logging intensity based on number of trees and volume per hectare which were felled by logging. Logging intensity in RIL 50 had felled trees of 10.7 4.9 stems per ha +with volume of 96.8 66.5 m ha per; RIL 60 had + 3
felled trees of 7.0 3.0 stems per ha with volume +of 56.5 23.3 m per ha and CNV had felled + 3
trees of 10.1 4.2 stems per ha with volume of +107.2 59.6 m per ha (Sist & Bertault 1998). + 3
These results indicated that logging intensity had a tendency to increase from RIL 60, RIL 50 and CNV logging techniques, respectively. In the logged-over forest, the mortality rates for all species ranged from 2.5 to 29.3% per ha per 2 years (Table 1). The highest mortality rates occurred in year-1 and year-3 after logging then declined or was similar to mortality rates at the primary forest in year-5 after logging. The mortality rates in this study were higher than those in some studies; for example mortality rate in year-2 after logging in East Kalimantan forest was 2.5% per year (Primack . 1985; Nguyen-et alThe . 1998); mortality rate in a logged-over et alforest in Papua New Guinea was 2.5% per ha per year (Mex 2005); mortality rate in a mixed Dipterocarp forests in Asia was 1.5% per year (Nguyen-The . 1998). Compared to other et alforest types, Dipterocarp forest has lower mortality rate than that of peat swamp forest which was 6.13% per year and of heath forests which was 4.26% per year (Nishimua . 2006).et al Mortality rates in forest with different logging techniques indicated higher logging intensity for both Dipterocarps and non-Dipterocarps (Fig. 3).
BIOTROPIA Vol. 22 No. 1, 2015
14
Figure . Forest trees for all species with different logging techniques based on (a) average tree density (stems per ha) and (b) 2average basal area (m per ha)2

Non-Dipterocarps species have a tendency to have higher mortality rate than Dipterocarps. Mortality rate for both Dipterocarps and non-Dipterocarps in primary forest ranged from 2.0 to 6.0% per ha per 2 years with average of 3.29% per ha per 2 years. The increasing logging intensity was negatively correlated with stem densities, species abundance and biodiversity, where prior changes in the logged-over forest for the first 5–10 years after logging were gradually occurred in successive samples (Kariuki . 2006). The et almortality rates of trees in a forest is relatively high within 7 years, indicating that damaging effects of logging would permanently influence trees, either directly or indirectly. In other words, within 7 years after logging, the remaining trees will begin to recover. Fluctuations of mortality rate within 17 years after logging indicated that the mortality rates decreased over years for both Dipterocarps and
non-Dipterocarps. A theoretical frame for ingrowth limitations, climatic variation or many factors became the constraints to predict tree-level change (Harcombe . 2002). Several et alvariables causing differences of mortality rates were logging intensity, initial structure and dominant species composition. The mortality degree is different for every tree's stage in the forests.
Ingrowth Rates Ingrowth rates in logged-over forest have the same tendency with mortality rates that correlate with level of logging intensity (Table 2). In this case, conventional logging technique can still control the total felled trees to only cut down trees having limit diameter of 60 cm. The ingrowth rates in logged-over forest (1.3-21.3% per ha per 2 years) were higher than those in primary forest (0.6-4.7% per ha per 2 years). The highest
15
Table . Tree mortality rates (% per ha per 2 years) for all species1
Forest Condition
PAL1 PAL3 PAL5 PAL7 PAL9 PAL11 PAL13 PAL15 PAL17(% per ha per 2 years)
RIL50 Mean 23.7 10.9 4.3 5.8 3.0 2.9 2.7 3.4 3.3 SD 10.6 6.2 1.4 1.2 0.7 1.1 1.1 1.7 1.5RIL60 Mean 22.3 8.3 4.4 5.5 3.3 2.5 2.5 2.5 3.5 SD 8.1 3.5 1.1 1.3 0.9 0.8 1.1 1.3 2.0CNV Mean 29.3 12.8 2.8 6.8 3.3 3.6 2.8 2.9 4.3 SD 9.2 8.0 1.3 2.3 0.9 2.1 1.0 1.9 0.4
P1 P3 P5 P7 P9 P11 P13 P15 P17 PF Mean 2.9 3.2 4.7 6.0 3.2 3.4 2.7 2.0 3.2 SD 1.0 1.3 5.1 1.8 1.2 1.5 1.5 1.4 2.0Notes : PAL = period after logging (years) SD = Standard deviation P = monitoring period (years)
Figure . Mortality rates (stems per ha per 2 years) of trees with different logging techniques for species group (a) 3Dipterocarps and (b) non-Dipterocarps
Mortality and ingrowth pattern of dipterocarps in forest recovery in East Kalimantan Farida H. Susanty – et al.

ingrowth rate for all species occurred at year-5 to year-7 (Table 2). After logging, the ingrowth rates increased substantially during the first 5 years. During the next five years, there was a sharp decrease. Hardiansyah . (2005) stated that at et alyear-1 after logging in Jambi, ingrowth rate was 0.19-2.89% per year with average 2.1% per year. Meanwhile, in Papua New Guinea Mex (2005) stated that at year-13 after logging the trees had smaller ingrowth rate with mean of 41 stems per ha. In the primary forest, ingrowth rate fluctuation were relatively low i.e. 2.0-4.7% per ha per 2 years with average of 2.5% per ha per 2 years. Fluctuations of ingrowth rates for Dipterocarps and non-Dipterocarps species in logged-over forest with different logging techniques had different patterns (Fig. 4). In this study 68 tree families had been identified (Appendix 1), in which there were 8 genera of Dipterocarps (Appendix 2) namely Anisoptera, Cotylelobium, Dipterocarpus, Dryobalanops, Hopea, Parashorea, Shorea, Vatica and consisted of 92
species. Non-Dipterocarpaceae trees dominating the logged-over forest were especially pioneer species such as sp. This result was Macarangasimilar to the research results in Brazilian Amazon forest which showed that the ingrowth rate increased in the first 8 years after logging provided there were more light in the under- storey which stimulated ingrowth (Silva . et al1995). Ingrowth can soar through the canopy opening after logging provided there were more growing space and ingrowth would decrease in line with the competition among trees (Gourlet-Fleury . 2005). Logged-over forests et alwould have good recovery with high growth rate at year-3 after logging (Kao & Iida 2006). The first highest ingrowth rate occurred in year-7 indicating high growth regeneration which in line with the beginning of mortality rate decline in year-7. The second highest ingrowth rate occurred in year-15 which might be caused by recovery process of forest trees after being logged-over.
BIOTROPIA Vol. 22 No. 1, 2015
16
Table . Tree ingrowth rates (% per ha per 2 years) for all species2
Forest Condition
PAL1 PAL3 PAL5 PAL7 PAL9 PAL11 PAL13 PAL15 PAL17(% per ha per 2 years1)
RIL50 Mean 1.8 9.0 21.3 14.5 8.8 2.8 3.4 6.5 0.6
SD 0.6 4.9 25.3 8.9 4.4 2.4 1.7 2.7 0.2RIL60 Mean 2.1 6.3 9.0 10.5 7.9 1.6 3.5 9.8 0.7
SD 1.0 2.3 2.3 3.3 3.8 1.0 1.4 5.7 0.1CNV Mean 1.3 12.7 19.1 19.6 7.8 3.5 5.2 5.4 0.7
SD 0.6 8.5 13.4 8.2 4.8 1.2 2.6 1.9 0.2
P1 P3 P5 P7 P9 P11 P13 P15 P17 PF Mean 2.1 3.8 3.7 4.7 2.0 1.1 1.6 4.5 0.7
SD 1.0 1.9 1.9 2.2 1.1 1.1 0.9 2.7 0.6
Figure . Ingrowth rates (stems per ha per 2 years) of trees with different logging techniques for species group (a) 4Dipterocarps and (b) non-Dipterocarps
Notes : PAL = period after logging (years) SD = Standard deviation P = monitoring period (years)

Species grouping Regression equation r R2 SE
D LOF y(M) = -0.039x3 + 1.295x2 - 13.177x + 43.501 0.8955 0.8020 4.855
y(I) = 0.011x3 - 0.3676x2 + 3.2295x + 0.2946 0.5326 0.2837 3.552
PF y(M) = 0.0073x3 - 0.2272x2 + 1.8366x + 0.8951 0.6448 0.4158 1.577
y(I) = 5.107e-0.133x 0.4106 0.1686 0.371
ND LOF y(M) = -0.0779x3 + 2.6842x2 - 28.4x + 101.3 0.9071 0.8229 9.985
y(I) = 0.0667x3 - 2.1667x2 + 18.792x - 11.094 0.6317 0.3990 14.765
PF y(M) = 0.0196x3 - 0.5982x2
+ 4.8012x + 4.3734 0.6118 0.3743 4.142
y(I)
= 13.873e-0.082x
0.4900
0.2401
0.339
All species LOF y(M) = -0.1174x3 + 3.9793x2 - 41.577x + 144.81 0.9160 0.8391 13.686
y(I) = 0.0778x3 - 2.5343x2 + 22.022x - 10.799 0.6363 0.4049 17.288
PF y(M) = 0.0269x3 - 0.8254x2 + 6.6378x + 5.2685 0.6375 0.4064 5.474y(I) = 17.636e-0.078x 0.4775 0.2280 0.3359
Canopy gap occurred in a logged-over forest can function as a catalyst for tree ingrowth until certain condition. This phenomenon would then decrease due to competition in population (Gourlet-Fleury . 2005; Kao & Iida 2006), et alwhich would explain why natural ingrowth formed in the period of 11-17 years in the forest recovery. Different species group will be affected variably to competition for light based on respective tolerable range (Harcombe . 2002). et alResearch on forest tree in Peninsular Malaysia showed variations in regenerated tree by class diameter of trees in the logged-over forest area (Seng . 2004).et al
Period after Logging to Mortality and Ingrowth Pattern
Results of analysis of variance (ANOVA) showed that different harvesting techniques had no significant effect on mortality rate and ingrowth rate for all species. However, descriptively, the mortality and ingrowth rates were higher at year-1 and year-3 after logging (Tables 1 and 2). From this study it was indicated that RIL 50 seemed to be the best technique to increase ingrowth rate, but RIL 60 was the selected technique to decrease the mortality rate after logging. Regression equations were developed to show relationship between after-logging period to
mortality and ingrowth rates for each species group (Table 3). These equations showed that after-logging period correlated with mortality rate in logged-over forest for both Dipterocarps and non-Dipterocarps. Recovery period after logging will affect the level of mortality and ingrowth rates for Dipterocarps, non-Dipterocarps and all species groups (Fig. 4). All species group in logged-over forest had polynomial regression pattern for mortality and ingrowth rates, but ingrowth rates on primary forest had negative exponential pattern. High mortality rate was shown to happen in Dipterocarps in early years of logging and seemed to be caused by Dipterocarps being a major commercial species. Meanwhile, high mortality rate for non-Dipterocarps seemed to be due to forest area clearing related to skidding trails and logging yard as well as to logging operation. Mortality rates for Dipterocarps and non-Dipterocarps as either direct or indirect effect of logging was continued until the third year. Ingrowth rates of non-Dipterocarps species group was higher than that of Dipterocarps. This was correlated with general growth or increment characteristics of total tree basal area increment of non-Dipterocarps which was higher than that of Dipterocarps species groups (Silva . 2002; Susanty & Suhendang et al2013).
17
Table . Regression equations between after-logging period (x) to mortality rates (M) and ingrowth rates (I) for Dipterocarps 3(D), non-Dipterocarps (ND) and all species
Notes: LOF : Logged-over forest; PF : Primary Forest; x : after-logging period (years); y(M) : Mortality rates (stems per ha per 2 years); y
(I) : Ingrowth rates (stems per ha per 2 years)
Mortality and ingrowth pattern of dipterocarps in forest recovery in East Kalimantan Farida H. Susanty – et al.
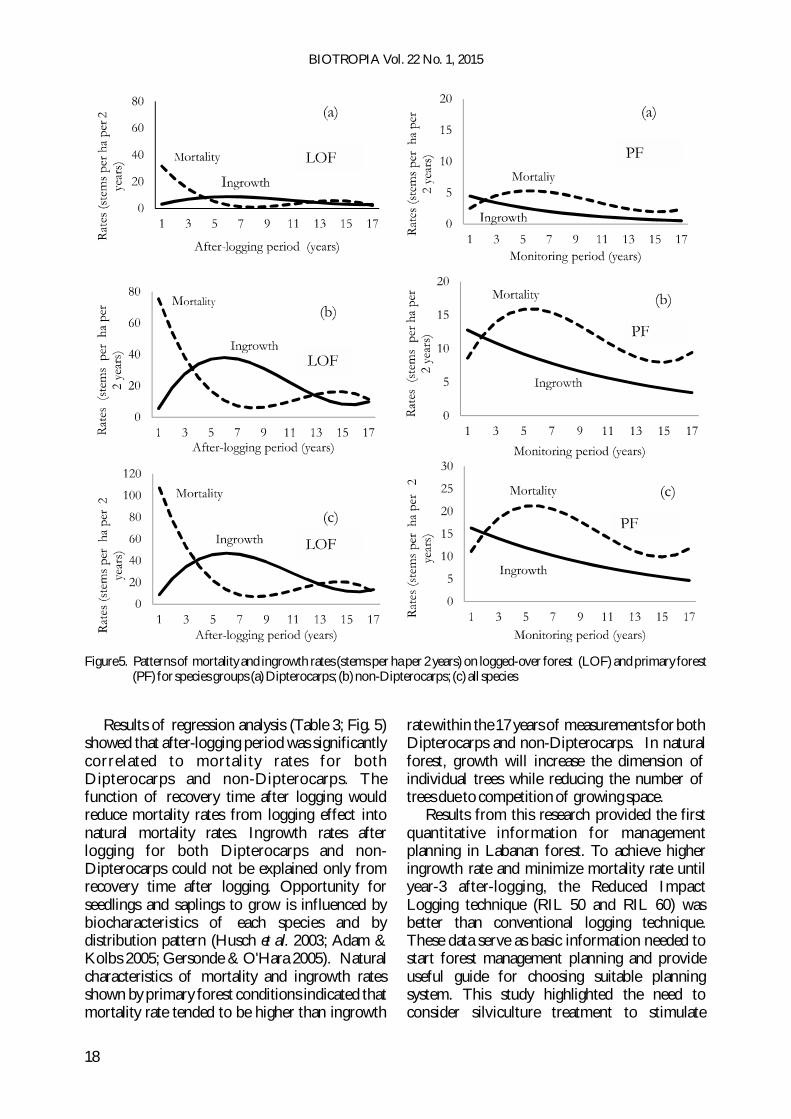
Results of regression analysis (Table 3; Fig. 5) showed that after-logging period was significantly correlated to mortality rates for both Dipterocarps and non-Dipterocarps. The function of recovery time after logging would reduce mortality rates from logging effect into natural mortality rates. Ingrowth rates after logging for both Dipterocarps and non-Dipterocarps could not be explained only from recovery time after logging. Opportunity for seedlings and saplings to grow is influenced by biocharacteristics of each species and by distribution pattern (Husch 2003; Adam & et al.Kolbs 2005; Gersonde & O'Hara 2005). Natural characteristics of mortality and ingrowth rates shown by primary forest conditions indicated that mortality rate tended to be higher than ingrowth
rate within the 17 years of measurements for both Dipterocarps and non-Dipterocarps. In natural forest, growth will increase the dimension of individual trees while reducing the number of trees due to competition of growing space. Results from this research provided the first quantitative information for management planning in Labanan forest. To achieve higher ingrowth rate and minimize mortality rate until year-3 after-logging, the Reduced Impact Logging technique (RIL 50 and RIL 60) was better than conventional logging technique. These data serve as basic information needed to start forest management planning and provide useful guide for choosing suitable planning system. This study highlighted the need to consider silviculture treatment to stimulate
BIOTROPIA Vol. 22 No. 1, 2015
18
Figure . Patterns of mortality and ingrowth rates (stems per ha per 2 years) on logged-over forest (LOF) and primary forest 5(PF) for species groups (a) Dipterocarps; (b) non-Dipterocarps; (c) all species

growth rates in forest areas, especially to increase wood production. The methods described in this study can be enhanced to involve a more detail species grouping for increasing model accuracy and to accommodate high species diversity (Phillips . 2002; Valle . 2006). In et al et alDipterocarp forest, valuation of tree recovery could be assessed by tree structure model, mortality rate and ingrowth rate, involving species characteristic by species grouping.
CONCLUSIONS
Residual trees in Dipterocarp forest in year-17 after-logging based on had been well recovereddensity and basal area value that reached more than 85% close to the initial condition. Mortality rates in logged-over forest would be similar to that in the primary forest at year-7 after-logging, while ingrowth rate in logged-over forest would be similar to that in the primary forest at year-17 after- logging. Fluctuations in mortality and ingrowth rates in logged-over forest reached equilibrium conditions at year-7 after-logging. In the subsequent years, ingrowth rate was higher than mortality rate. Fluctuations of mortality and ingrowth rates in the primary forests were relatively low. Recovery period for trees in logged-over forest had an important effect to decrease mortality rates for both Dipterocarps and non-Dipterocarps. Different types of logging techniques (RIL 50, RIL 60 and conventional logging) with variations in logging intensity 7-14 stems per hectare did not have significant influence on recovery of density and basal area value, as well as on mortality and ingrowth rates. The Reduced Impact Logging technique was better than conventional logging technique to achieve higher ingrowth rate and minimize mortality rate until year-3 after-logging. Quantitative dimensions of forest trees at 17 years after logging will be close with the primary forests, but still dominated by the non-Dipterocarps species.
ACKNOWLEDGEMENTS
The authors thanked the Forest Research and Deve l op ment Ag ency ( FORDA) an d Dipterocarps Research Center (DIREC) for
permitting the use of data measurement of permanent sample plots in the Labanan forest station.
REFERENCES
Adams HD, Kolbs TE. 2005. Tree growth response to drought and temperature in a mountain landscape in Northern Arizona, USA. J Biogeogr 32:1629-40.
Ashton PS. 1982. Dipterocarpaceae. Flora Malesiana The Netherlands 1(9): 237-552.
Chertov O, Komarov A, Mikhailov A, Andrienko G, Andrienko N, Gatalsky P. 2005. Geovisualization of forest simulation modeling results: A case study of carbon sequestration and biodiversity. Comput Electron Agr 49: 175-91.
Davis LS, Johnson KN, Bettinger PS, Howard TE. 2001. Forest Management: To Sustain Ecological, Economic and Social Value. Fourth Edition. New York (US): McGraw-Hill.
Direktorat Jenderal Planologi Kehutanan, Kementerian Kehutanan. 2011. Data dan Informasi Pemanfaatan Hutan Tahun 2011. Jakarta(ID): Direktorat Jenderal Planologi Kehutanan, Kementerian Kehutanan.
Dykstra DP. 2002. Reduced impact logging : concepts and issue. In: Enters T, Durst PB, Applegate GB, Kho PCS, Man G, editor. Applying Reduced Impact Logging to Advance Sustainable Forest Management. Rome(IT): FAO. p 23-40.
Food and Agricultural Organization of the United Nations .2001. . Rome.State of The World Forest
Flewelling JW, Monserud RA. 2002. Comparing methods for modelling tree mortality. In: 2 Forest nd
Vegetation Simulator Conference. Proceedings: 2002 Feb 12-14; Fort Collins(US). p 168-77.
Gersonde RF, O'Hara KL. 2005. Comparative tree growth efficiency in Sierra Nevada mixed-conifer forests. Forest Ecol Manag 219:95–108.
Gourlet-Fleury S, Cornu G, Jesel S, Dessard H, Jourget JG, Blanc L, Picard N. 2005. Using models to predict recovery and assess tree species vulnerability in logged tropical forests : a case study from French Guiana. Forest Ecol Manag 209:69-86.
Harcombe PA, Bill CJ, Fulton M, Glitzenstein JS, Marks PL, Elsik IS. 2002. Stand dynamics over 18 Years in a southern mixed hardwood forest, Texas, USA. J Ecol 90: 947-57.
Hardiansyah G, Hardjanto T, Mulyana M. 2005. A brief note on TPTJ (Modified Indonesia Selective Cutting System) from experience of PT. Sari Bumi Kusuma (PT SBK) timber concessionaire. In: International Workshop on Promoting Permanent Sample Plots in Asia and The Pacific Region. Proceedings: 2005 August 3-5; Bogor(ID): Center for International Forestry Research (CIFOR). p 23-31.
19
Mortality and ingrowth pattern of dipterocarps in forest recovery in East Kalimantan Farida H. Susanty – et al.
Husch B, Beers TW, Kershaw Jr JA. 2003. Forest Mensuration. Fourth Edition. New Jersey (US): John Wiley & Sons Inc.
Ishida H, Hattori T, Takeda Y. 2005. Comparison of species composition and richness between primary and secondary lucidophyllous forests in two altitudinal zones of Tsushima Island, Japan. Forest Ecol Manag 213: 273-87.
Kao D, Iida S. 2006. Structural characteristics of logged evergreen forests in Preah Vihear, Cambodia, 3 years after logging. Forest Ecol Manag 225: 62-73.
Kariuki M, Robert MK, Smith RGB, Johnson GW, Vanclay JK. 2006. Regeneration changes in tree species abundance, diversity and structure in logged and unlogged subtropical rainforest over a 36-year period. Forest Ecol Manag 236:162-76.
Krisnawati H. 2001. Pengaturan hasil hutan tidak seumur dengan pendekatan dinamika struktur tegakan (kasus hutan alam bekas tebangan). . Bogor(ID): tesisInstitut Pertanian Bogor.
Lewis SL, Oliver LP, Douglas S, Barbara V, Timothy RB, Sandra B, Andrew WG, Niro H, David WH, William FL, Jean L, Yadvinder M, Abel M, Percy NV, Bonaventure S, Nur SMN, John W, Terborgh, Rodolfo VM. 2004. Tropical forest tree mortality, recruitment and turnover rates: calculation, interpretation and comparison when census intervals vary. J Ecol 92: 929-44.
Mex PM. 2005. Progress on the studies of growth of logged over natural forest in Papua New Guinea. In: International Workshop on Promoting Permanent Sample Plots in Asia and The Pacific Region. Proceedings: 2005 Aug 3-5; Bogor(ID): Center for International Forestry Research (CIFOR). p 70-86.
Muhdin, E, D, H, , Suhendang Wahjono Purnomo IstomoSimangunsong . Keragaman struktur BCH 2008. tegakan hutan alam sekunder. J Man Hut Trop 16 : (2)81 7- .
Muhdin 12 Dinamika struktur tegakan hutan tidak . 20 . seumur untuk pengaturan hasil hutan kayu berdasarkan jumlah pohon (kasus pada areal bekas tebangan hutan alam hujan tropika dataran rendah tanah kering di Kalimantan) . disertasi. Bogor (ID): Institut Pertanian Bogor.
Naito Y, Kanzaki M, Iwata H, Obayashi K, Lee SL, Muhammad N, Okuda T, Tsumura Y. 200 . 8 Density-dependent selfing and its effects on seed performance in a tropical canopy tree species, Shorea acuminata (Dipterocarpaceae). Forest Ecol Manag 256 375 83: - .
Nguyen-The, N, Favrichon V, Sist P, Houde L, Bertault JG, Fauvet N. 1998. Growth and mortality pattern before and after logging. In: Bertault JG, Kadir K, editor. Silvicultural Research in A Lowland Mixed Dipterocarp Forest of East Kalimantan. The Contribution of STREK Project. Jakarta(ID): CIRAD-Forêt-FORDA-PT Inhutani I. p181-84.
Nishimua TB, Suzuki E, Kohyama T, Tsuyuzaki S. 2006. Mortality and growth of trees in peat-swamp and heath forests in Central Kalimantan after severe drought. Plant Ecol 188: 165-77.
Phillips PD, Yasman I, Brash TE, van Gardingen PR. 2002. Grouping tree species for analysis of forest data in Kalimantan (Indonesian Borneo). Forest Ecol Manag 157:205-16.
Primack RB, Ashton P, Chai P, Lee HS. 1985. Growth rates and population structure of Moraceae trees in Sarawak, East Malaysia. Ecol 66: 577-88.
Prodan M. 1968. . Sabine H. Gardiner, Forest Biometricstranslator Oxford(UK) Pergamon Press.. :
Richards PW. 1996. . The Tropical Rain Forest: Second editionCambridge(UK): Cambridge University Press.
Saridan A, Susanty FH. 2005. Plot STREK : Teknik Silvikultur untuk Pemuliaan Hutan Bekas Tebangan di Kalimantan Timur. Samarinda(ID): Departemen Kehutanan. Balai Penelitian dan Pengembangan Kehutanan Kalimantan.
Schmidt FH, Ferguson JHA. 1951. Rainfall Type Based on Wet and Dry Period Ratio for Indonesia with Western New Guinea. Jakarta(ID): Kementerian Perhubungan. Jawatan Meteorologi dan Geofisika.
Seng HW, Wickneswari R, Shukor MN, Mahani MC. 2004. The effects of the timing and method of logging on forest structure in Peninsular Malaysia. Forest Ecol Manag 203: 209-8.
Setiawan A 2013 Keragaan struktur tegakan dan kepadatan . . tanah pada tegakan tinggal di hutan alam produksi. disertasi. Bogor(ID): Institut Pertanian Bogor.
Sianturi P, Kanninen M. 2005. Indonesian natural tropical forests would not be sustainable under the current silvicultural guidelines – TPTI (a simulation study). In: International Workshop on Promoting Permanent Sample Plots in Asia and The Pacific Region. Proceedings: 2005 August 3-5; Bogor(ID): Center for International Forestry Research (CIFOR). p32-46.
Simon H. 2007. . Yogyakarta (ID): Metode Inventore HutanPenerbit Pustaka Pelajar.
Silva JNM, deCarvalhoa JOP, Lopes JCA, de Almeidaa BF, Costa DHM, de Oliveira LC, Vanclay JK, Skovsgaardd JP. Growth and yield of a 1995. tropical rain forest in the Brazilian Amazon 13 years after logging. Forest Ecol Manag 71:267-74.
Silva RP, dos Santos J, Tribuzy ES, Chambers JQ, Nakamura S, Higuchi N. 2002. Diameter increment and growth patterns for individual tree growing in Central Amazon, Brazil. Forest Ecol Manag 166:295-301.
Sist P, Bertault JG. 1998. Reduced impact logging experiments: impact of harvesting intensities and logging techniques on stand damage. In: Bertault JG, Kadir K, editor. Silvicultural Research in a Lowland
BIOTROPIA Vol. 22 No. 1, 2015
20

Mixed Dipterocarp Forest of East Kalimantan. The Contribution of STREK Project. Jakarta(ID): CIRAD-Forêt-FORDA-PT Inhutani I. p 139-61.
Sist P, Fimbel R, Sheil D, Nasi R, Chevallier MH. 2003. Towards sustainable management of mixed Dipterocarp orests of South-East Asia: oving f mbeyond minimum diameter cutting limits. Environ Conserv - . 30(4): 364 74
Sist P, Ferreira FN. 2007. Sustainability of reduced-impact logging in the Eastern Amazon. Forest Ecol Manag 243: 199-209.
Smith RGB, Nichols JD. 2005. Patterns of basal area increment, mortality and recruitment were related to logging intensity in subtropical rainforest in Australia over 35 years. Forest Ecol Manag 218: 319-28.
Steel RGD, Torrie JH. 1995. Prinsip dan Prosedur Statistika: Suatu Pendekatan Biometrik. Sumantri B, penerjemah. Jakarta (ID): PT Gramedia Pustaka Utama. Terjemahan dari: Principles and Procedures of Statistics. Edisi ke-2.
Susanty FH, Suhendang E. 2013. Riap individu dan tegakan periodik hutan Dipterocarpaceae setelah penebangan. In: Ngatiman, Wahyudi A, editor. Restorasi ekosistem Dipterokarpa dalam rangka peningkatan produktivitas hutan. Prosiding: 2013 Oktober 22; Samarinda (ID): Kementerian Kehutanan. Balai Besar Penelitian Dipterokarpa. p156-67.
Vanclay JK. 2003. Growth modelling and yield prediction for sustainable forest management. The Malaysian Forester 66(1):58-69.
Valle D, Mark S, Edson V, James G, Marcio S. 2006. Identifying bias in stand-level growth and yield estimations : a case study in Eastern Brazilian Amazonia. Forest Ecol Manag 236: 127-35.
Whitmore TC. 1990. Tropical rain forest dynamics and its implications for management. In: Gomez-Pompa A, Whitmore TC , Hadley M, editor. Rain Forest Regeneration and Management: Man and the Biosphere Series Volume 6. Paris(FR): Parthenon Publishing Group. p 67-89.
21
Mortality and ingrowth pattern of dipterocarps in forest recovery in East Kalimantan Farida H. Susanty – et al.

Appendix 1. List of species by family in Labanan Forest
Family Famil y Famil y Famil y Actinidiaceae Dilleniaceae Moraceae Saxifragaceae Alangiaceae Dipterocarpaceae Myristicaceae Simaroubaceae Amonaceae Ebenaceae Myrsinaceae Sonneratiaceae Anacardiaceae Elaeocarpaceae Myrtaceae Sterculiaceae Annonaceae Euphorbiaceae Ochnaceae Symplocaceae Apocynaceae Fagaceae Olacaceae Theaceae Aquifoliaceae Flacourtiaceae Oleaceae Thymelaeaceae Araucariaceae Clusiaceae Oxalidaceae Tiliaceae Bignoniaceae Hypericaceae Polygalaceae Ulmaceae Bombacaceae Icacinaceae Proteaceae Urticaceae Burseraceae Juglandaceae Rhamnaceae Verbenaceae Caesalpiniaceae Lauraceae RhizophoraceaeCelastraceae Lecythidaceae Rosaceae Chrysobalanaceae Fabaceae Rubiaceae Combretaceae Loganiaceae Rutaceae Connaraceae Lythraceae Sapindaceae Convolvulaceae
Magnoliaceae
Sapotaceae
Crypteroniceae
Melastomataceae
Sapuidaceae Datiscaceae Meliaceae Sarcotheca
BIOTROPIA Vol. 22 No. 1, 2015
22

47 Shorea bentongenensis 48 Shorea confusa 49 Shorea exelliptica50 Shorea faguetiana51
Shorea falciferoides
52 Shorea fallax
53 Shorea guiso
54 Shorea hopeifolia
55 Shorea inappendiculata
56 Shorea johorensis
57 Shorea laevis
58 Shorea lamellata
59 Shorea leprosula
60 Shorea leptoderma
61 Shorea longisperma
62 Shorea macrophylla
63 Shorea macroptera
64 Shorea maxwelliana
65 Shorea mecistopteryx
66 Shorea multiflora
67 Shorea ochracea
68 Shorea ovalis ssp ovalis
69 Shorea parvifolia
70 Shorea parvistipulata
Appendix 2. List of Dipterocarps species
No Species No Species 1 Anisoptera costata 2 Anisoptera laevis3 Anisoptera sp 4 Cotylelobium melanoxylon5 Cotylelobium sp 6 Dipterocarpus acutangulus7 Dipterocarpus caudiferus8 Dipterocarpus confertus9 Dipterocarpus conformis
10 Dipterocarpus costulatus11 Dipterocarpus elongatus12 Dipterocarpus fusiformis13 Dipterocarpus glabrigemmatus14 Dipterocarpus gracilis15 Dipterocarpus grandiflorus16 Dipterocarpus hasseltii17
Dipterocarpus humeratus
18
Dipterocarpus mundus19
Dipterocarpus pachyphyllus
20
Dipterocarpus palembanica21
Dipterocarpus stellatus
22
Dipterocarpus tempehes23
Dipterocarpus verrucosus
24
Dipterocarpus sp 25
Dryobalanops beccarii
26
Dryobalanops lanceolata27
Dryobalanops sp
28
Hopea bracteata 29
Hopea cernua
30
Hopea dryobalanoides31
Hopea ferruginea
32
Hopea mengarawan33
Hopea nervosa
34
Hopea pachycarpa35 Hopea rudiformis 82 Shorea sp
83 Vatica albiramis 84 Vatica micrantha 85 Vatica nitens 86 Vatica oblongifolia87 Vatica odorata88 Vatic a rassak89 Vatica sarawakensis90 Vatica umbonata91 Vatica vinosa92 Vatica sp
36 Hopea sangal37 Hopea semicuneata38 Hopea sp 39 Parashorea malaanonan40 Parashorea smythiesii41 Parashorea sp 42 Shorea agamii ssp agamii43 Shorea almon44 Shorea angustifolia45 Shorea atrinervosa46 Shorea beccariana
71 Shorea patoiensis 72 Shorea pauciflora 73 Shorea pinanga 74 Shorea scrobiculata 75 Shorea semicuneata 76 Shorea seminis 77 Shorea smithiana 78 Shorea superba 79 Shorea symingtonii 80 Shorea virescens 81 Shorea xanthophylla
23
Mortality and ingrowth pattern of dipterocarps in forest recovery in East Kalimantan Farida H. Susanty – et al.