morphometric analysis – a tool to identify the different ... · etroplus maculatus, a ......
TRANSCRIPT
INTERNATIONAL JOURNAL OF ENVIRONMENTAL SCIENCES Volume 1, No 4, 2010
© Copyright 2010 All rights reserved Integrated Publishing services
Research article ISSN 0976 – 4402
481
Morphometric Analysis – A Tool to Identify the Different Variants in a Fish Species E.Maculatus
Manimegalai M 1 , Karthikeyeni S 2 , Vasanth S 2 , Arul Ganesh S 2 , Siva Vijayakumar T 2 , Subramanian P 2
1 Department of Zoology, Seetha Lakshmi Ramaswamy College, Trichirappalli620024. 2 Department of Animal Science, Bharathidasan University, Tiruchirappalli620024.
ABSTRACT
Etroplus maculatus, a fresh water cichlid fish popularly known as orange chromid, commonly found in rivers, streams and canals of India. E.maculatus was collected from Kollidam a branch of Cauvery river of Trichy (Dt), Tamil Nadu. Depending upon the number of black spots, their arrangements and other characters, ten different variants had been identified. Morphometric analysis were made for all ten variants and compared. Among the 15 parameters noted, body weight and body length showed high level of significant positive relationship with total length when compared to all other parameters. This analysis will help to understand the morphometric of different variants which is the most easily perceivable means of assessing the evolutionary adaptation of a species to its environment. Close monitoring is needed to determine its effects on the local environment. The different level of significance between body features of various variants reveals the possibility of segregation of variants of this species.
Keywords: Etroplus maculatus, chichlid, fish, morphometric analysis, morphological variations.
1. Introduction
Etroplus maculatus is one among the three Cichlid species native to Asia (the other being E.canarensis Day and E.suratensis). Etroplus maculatus, a fresh water fish species commonly known as Orange chromid found in rivers, streams and canals of India. Because of its unique body shape dots and other features besides abundances deserve projection to the ornamental fish industry. In this line Etroplus maculatus (Bloch) an endemic species of southern India, very common to lotic water system.Morphometric studies are not only essential to understand the taxonomy but also the health of a species (including reproduction) in an environment. The shape and structures are unique to the species and the variations in its feature are probably related to the habit and habitat among the variants of this species (Cavalcanti, et al. 1999). The new landmarks based on the other hand, poise no restriction in the direction of variation and localisation of the shape changes and are much more effective in capturing information about the shape of an organism. When combined with multi variant statistical procedure, they offer most powerful tools for testing and graphically displaying difference in the shape (Loy et al 1993, Rohlf and Marcus 1993, Rohlf et al 1996).Morphological characters are phenotipically plastic and are influenced each year by the physical environment during spawning and early juvenile stages (Austin 1999). But no significant difference exist between length and weight in immature forms (or) juvenile was already demonstrated (Prabakara Rao (1967) in fishes captured from Chilka

INTERNATIONAL JOURNAL OF ENVIRONMENTAL SCIENCES Volume 1, No 4, 2010
© Copyright 2010 All rights reserved Integrated Publishing services
Research article ISSN 0976 – 4402
482
Lake).Morphometric investigations of an animal species revealed the inter relation between the various bodily parameters like length, weight, fecunditiy etc (Rahim 1982). Morphometric analysis help to understand the relation between body parts (Carpenter, 1996) in Lettrinid fishes (Mauro Jose Cavalcanti,1999) in Penaeid prawns (Subramanian 1987). This type of measurement analysis scheme restricted to document the direction of size of variation (Bookstain, 1991) further the Morphometric study is a suitable technique for recognising the degree of reproductive maturation without sacrificing the animals.Generally lengthweight relationships (LWR) have both applied and basic uses (Picter and Hart 1982). There are cases that fish landed in the market gutted, headless or without elongated jaw (eg. Species belonging to the family Belonidae). There are also circumstances in which the researcher is only able to measure length of fish samples in the field. These constrains can be overcome, if there is a pre determined LWR available to estimate the live weight of a fish given the length or viceversa. There are several ongoing fish resource assessments around fisheries and fish markets in India and also in other countries. Although we can make use of the LWR of similar species from other areas or countries (Kulbicki et al., 1993, Letourneur 1998 and Duarate et al., 1999), local information is the best for quantitative assessments in the area. Therefore this type of work still claim significance, as many species lack this information on the LWR particularly on E.maculatus.The length–weight relationship (WtLt) has been widely used in fish biology for several purposes. The length weight equation was also a quantitative expression of the development at corporal level of an organism. The condition factor ‘K’ (Lecren 1951) is a quantitative parameter of the well being state of the fish and reflects recent feeding conditions as well as reproductive status. Anderson and Neumann (1966), refer the lengthweight data of population, as a basic parameter for any monitoring study of fisheries, since it provide an important information connecting the structure and function of population.The length –weight relationship would mostly vary with species could be considered for their management. Among the freshwater fishes, the length – weight relationship of different fishes has been carried out by many researchers, viz, Tilapia mossambicus (Dhoa and Dewan, 1967) Puntius stigma (Islam and Hossain,199119) Alia coila (Alam et al,1994) Chanda nama and Chanda ranga (Iqbal et al 199596), Botia lohachata (Mortuza and Motarrama 2000), Rhinomugil corsula (Murtuza and Tawfeequa,2006), Labeo boga (Rokshanara pervin and Golam Mortiza 2008), freshwater fairy shrimp (Amutha et al ,2007), marine prawn (Subramanian 1987).A study of length – weight relationship will have two purposes, first to establish the mathematical relation between the known, the other would be computed and the second to measure the variations from the expected weight for length of individual prawn groups an indication of fatness (or) health (Lecren,1951) in aquaculture.The general health of a population can be assessed through its growth features i.e. the length weight relationship of organism (Gulland 1983, Richardasin, 2000). The possible variation in the measurable and countable characters reveals the adaptation to environmental condition and help in clarifying their identity in the location of population (Prasath et al 1994).The body shape of Etroplus maculatus is slightly deviates as ovoid besides exhibiting phenotypic variations in colour ,stripes and spots all that indulge us to take up the study to understand the length related bodily parameters such as weight, head length, fin length etc. Further this study was extended to underscore any variations among the different colour variants of this species. Above 15 parameters were statistically treated to establish their interrelationship and arrived the formulae for length –related body measures. These formulae would form as the basis for interconversion, to evaluate the age and health of the animal, fertility of the in situ biomass of the population etc. Similarly too

INTERNATIONAL JOURNAL OF ENVIRONMENTAL SCIENCES Volume 1, No 4, 2010
© Copyright 2010 All rights reserved Integrated Publishing services
Research article ISSN 0976 – 4402
483
many fishes and shell fishes sexual maturity were determined through its length class. Therefore the present study provides information on some aspects of the biology and biometry of different variants of Etroplus maculatus.The present study was conceived and undertaken to bridge the gap that exists in the above said aspects. In this study, differences in various morphological characters of the fish are found between the variants. So we can refine the technique, supply the stock and suggest to the local unemployed and under employed women folk to take up this venture as back yard industry.
2. Materials and Methods
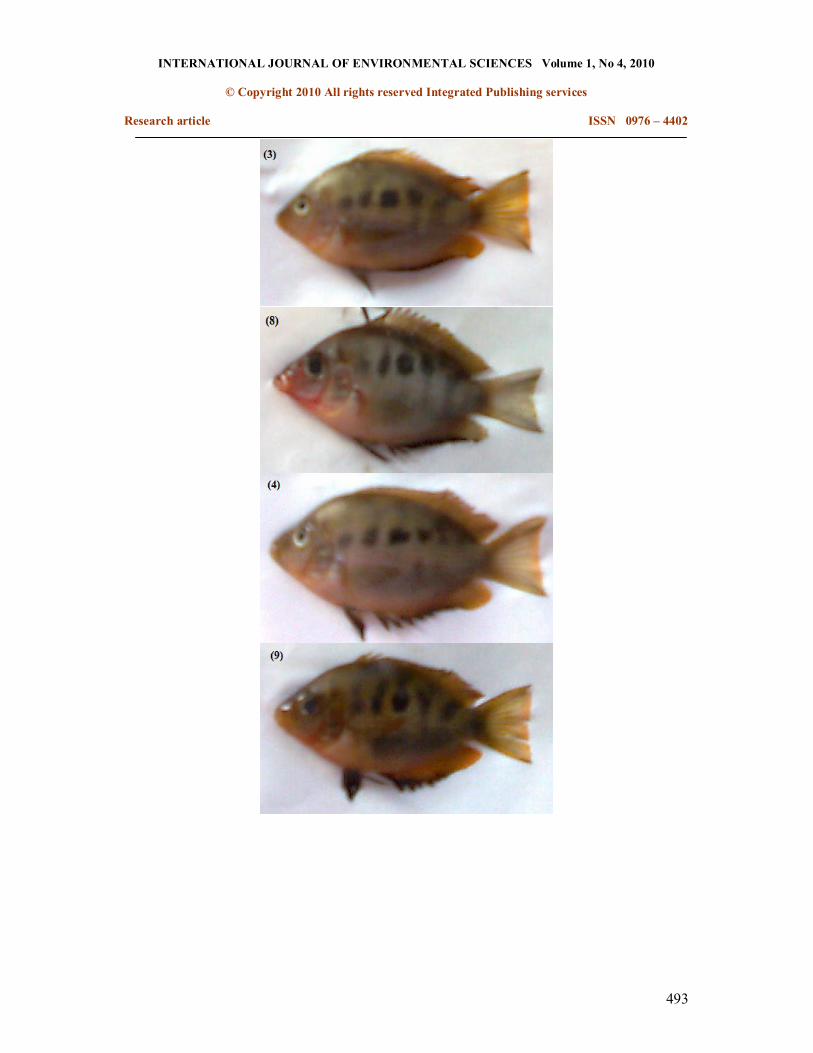
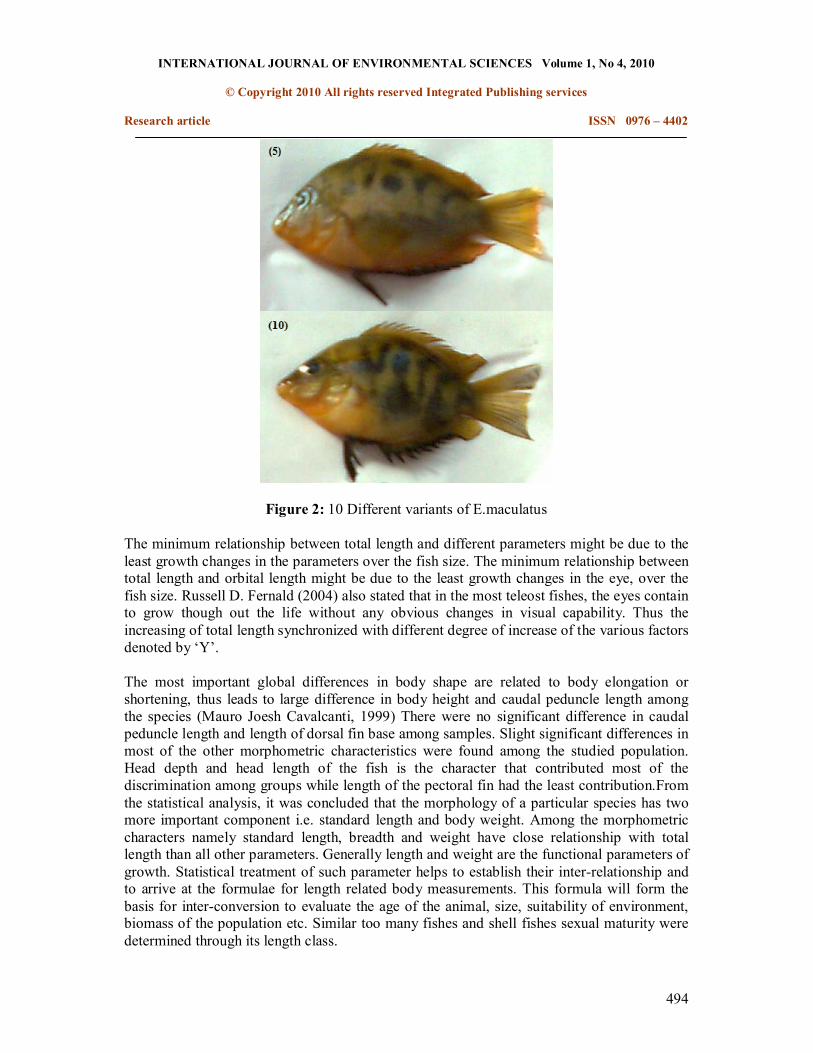
The ornamental quality bearing endemic fish species Etroplus maculatus was collected from Cauvery river. Two sites were selected among Kollidam rivernear TollGate one and another at Thudaiyur, Trichy(dist) at random sampled using screen drag net during 2006 2009.No significant sexual dimorphism with respect to the selected morphometrics was observed, therefore the data analysis was performed without taking the sex of the individual into consideration. The equipment used was selected according to the layout of sampling locality and the type of substratum. The frequencies of sampling varied according to the site because of accessibility of captured fish were brought back to the laboratory in plastic container with aerator. A total of 510 E.maculatus fishes were used to generate the following meristic characters.Among the samples, 10 different variants have been identified depending upon their morphological differences. All the fishes have the following common features. E. maculatus is a slightly elongated, deep bodied ovalshape fish with dots. Abdomenrounded, headmoderately compressed. Mouth terminal ceftsmall; snoutspouts like, eyeslarge, lateral in middle of head, lips thin, jaws equal, villiform teeth in two or three rows on jaws; compressed and lobate at their summit. Palate edendate, Dorsal fin inserted above base of pectoral fins with 1518 spines and 48 rays spinous portion larger than soft part. Pelvic fins thoracic with 13 spines and 26 soft rays.Anal fin with 1013 spines and 614 rays, caudal fin lunate or emarginated. Scales vary slightly ctninoid of moderate size extending to base of the soft dorsal and anal fin, lateral line interrupted or abruptly ceasing and there after continuing small open pores with 3040 scales. Air bladder is large and simple.The body of the adult is yellow to bright orange in colour with several rows of small redorange dots marking the body. The belly is light orange while the fins are transparent with an orange tint. The fins are close to the body and the tail is slightly forked. The eyes are dark and large. In male, in between the rays of pelvic fin, small barbs are present and they are absent in female fish.Based on the number of black spots and transverse lines the variants were categorized. 10 different variants have been identified. They are as follows:
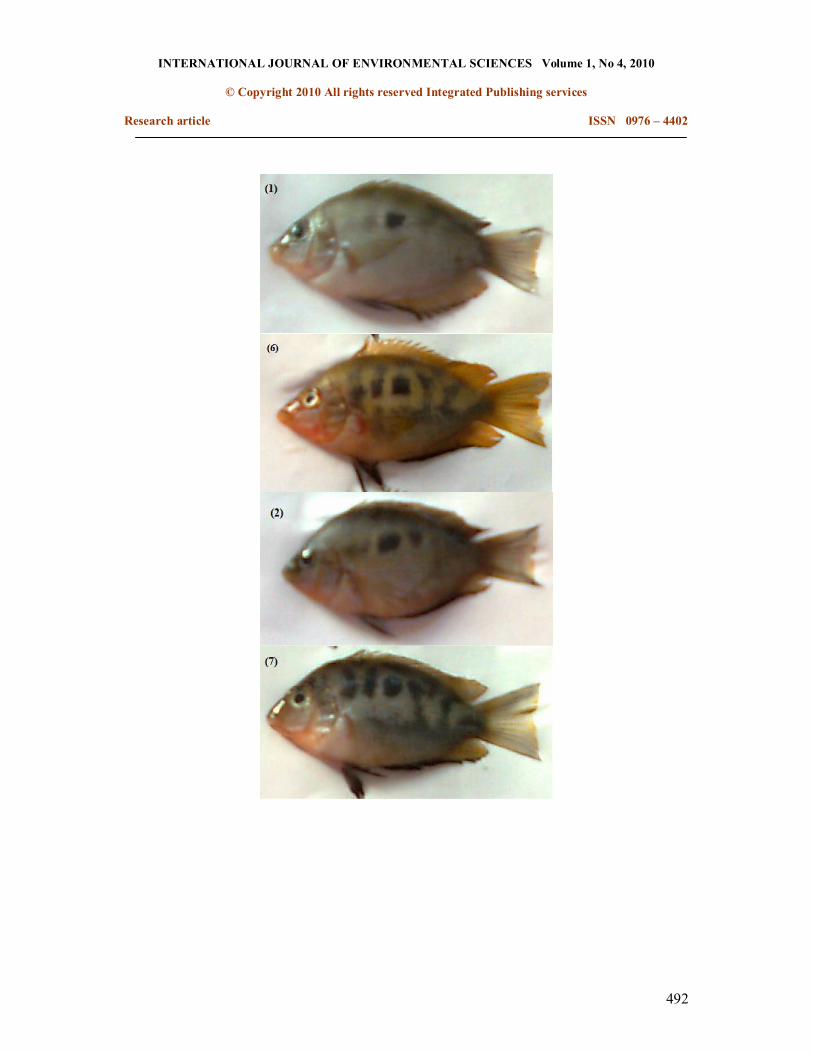
Variant 1: Body fully covered with small orange colour dots with single black spot. Variant 2: Orange colour small dots with three black spots. Variant 3: Orange colour small dots with four black spots. Variant 4: Orange colour small dots with five black spots. Variant 5: Two rows of black spots. Variant 6: Single black spot with transverse lines from the dorsal region. Variant 7: Single black spot with transverse lines from the abdominal region. Variant 8: Three black spots with transverse lines from the dorsal side. Variant 9: Black spots with black colour band in the abdomen.
INTERNATIONAL JOURNAL OF ENVIRONMENTAL SCIENCES Volume 1, No 4, 2010
© Copyright 2010 All rights reserved Integrated Publishing services
Research article ISSN 0976 – 4402
484
Variant 10: Black spots in the centre region of the abdomen and transverse lines on either side.
Body weight was measured with the help of an electronic weighing balance. All body measurements were taken from the lateral side of the fish to the nearest 0.1 mm using a vernier caliper and the distance between the verticals or horizontal lines made across the identified superficial landmark points. These landmark points were utilised to maintain the character homology between specimens as much as possible all length (L) were taken parallel to the antero posterior body axis.Head depth (HD) was taken perpendicularly to the body axis between dorsal and ventral margins of the head, starting from the point where the ventral edge of the operculum intersects the ventral body margin. The length of the fin bases of dorsal and anal fin was measured between the verticals made across the externally visible origins of the first spine and the last ray of the fin. Like that, measurement was made for standard length from mouth tip to the midpoint of caudal fin origin. For caudal peduncle length, from the anal fin intersect to the midpoint of the caudal peduncle for head length from mouth top to the posterior edge of operculum, for dorsal fin base length between the visible origins of the first spine and the last ray of the dorsal fin, for anal fin base line between the visible origins of the first spine and last ray of the anal fin and pectoral fin length from dorso posterior part of fin base to the edge of the fin.
3. Results
The above said measurement data were subjected to following analysis. Number of observation for morphometric analysis is 510.
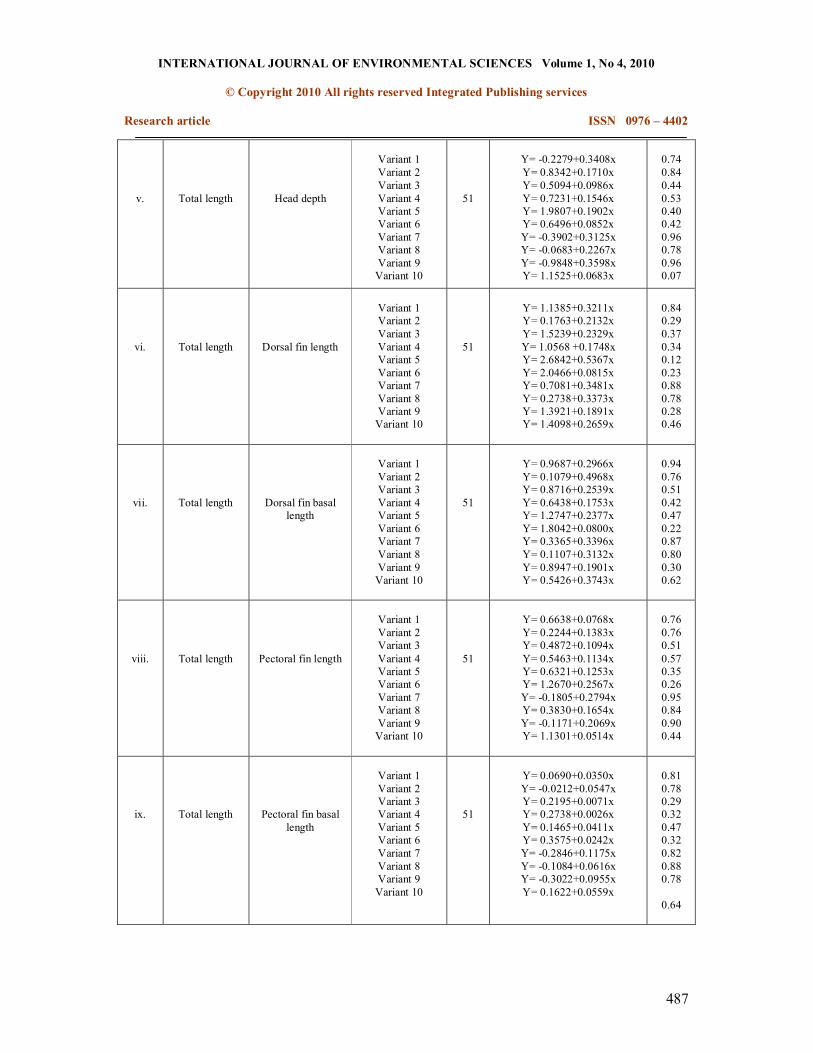
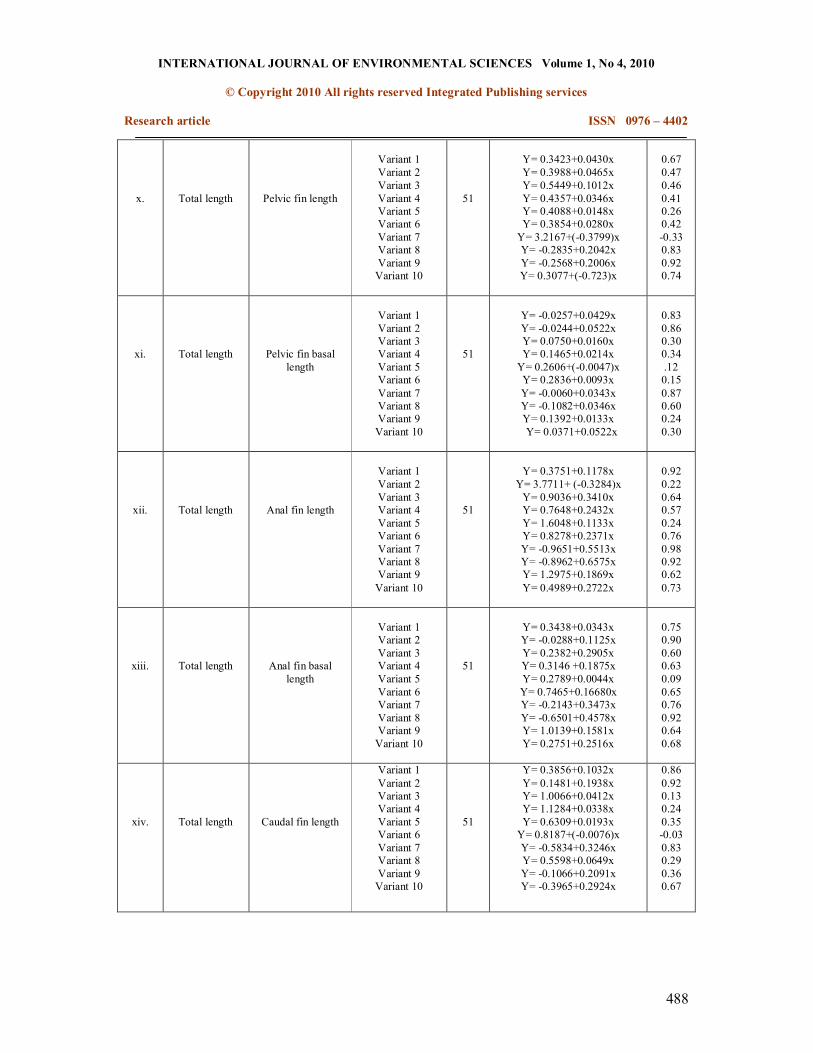
Let ‘X’ be the total length. Let ‘Y’ be the different body parameters. Let us related X and Y using the regression formula: Y=a+bx whereas the value of a and b for various Y are given in the following table (Table.1). Here ‘r’ denotes the correlation status between X and Y.
Among the ten variants of E.maculatus, variant 1, exerts a highly positive correlation (r=0.96) between body weight and total length. Variant 8 exhibit a highly positive correlation of r =0.96 between standard length and total length.Similarly caudal peduncle length Vs total length impart a highly positive correlation r =0.95 in variant 10.Correlation between head length and total length is highly positive in variant 2, r =0.94.Significant positive relation was noted between head depth Vs total length in variant 7, r=0.96. Correlation coefficient r =0.88 was yielded in variant 7 between head length and total length. Correlation between dorsal fin basal length and total length provided a highly positive relationship in variant 1 and r =0.94. The regression equation for the length of pectoral fin over the total length is positive and correlation coefficient r =0.95 in variant 7, shows the length of pectoral fin influences total length better than most other variants.Pectoral fin basal length Vs total length in Variant 8 is higher than other variants and r =0.88 showing positive correlation with increase of total length.r =0.92 in variant 9 where pelvic fin length Vs total length showing positive regression equation.Pelvic fin basal length Vs total length in Variant 7 is higher than other variants and r =0.87 showing positive correlation with increase of total length.The regression equation for the length of anal fin versus total length r =0.90 in variant 2 influences the total length.
INTERNATIONAL JOURNAL OF ENVIRONMENTAL SCIENCES Volume 1, No 4, 2010
© Copyright 2010 All rights reserved Integrated Publishing services
Research article ISSN 0976 – 4402
485
Correlation coefficient r =0.92 in variant 2 for caudal fin length versus total length influences the total length in the same manner as in anal fin. Regression equation for caudal fin basal length versus total length in variant 7 is highly positive where r =0.85 than other variants. In the morphometric analysis, all the characters were assumed as Y, show a positive correlation with total length (X). It would indicate the growth of individual organs in relation to overall growth of the fish. But the varying significance at different levels indicates the disproportionate growth of these organs studied, when compared to total length. Among the 10 variants, high level (r >0.85) moderate level (r =0.600.85) and low level (r<0.60) have been noted. Relationship between the parameters total length Vs body weight, high level of relationship exhibit in variant 1, 7 and 10. Moderate level in 8 th and 9 th variant and low level in variant 2,3,4,5 and 6 (Table 1i).In total length Vs standard body length variants 1, 2,6,7,8 and 10 show high level of relationship whereas Variant 4 and 9 show moderate level and variant 3 and 5 has very low level of relationship (Table 1ii).High level of relationship exhibited between total length and caudal peduncle length in variants 1, 7, 8 and 10 whereas moderate level in Variant 3, 4, 5 and 9 and low level by 2 nd and 6 th variants (Table 1 iii).Maximum level of relationship shown by 2 nd ,7 th and 8 th variants in total length Vs head length, moderate level in 1 st variant and minimum level in variants 3,4,5,6,9 and 10 (Table 1 iv).High level of relationship noted between total length and head depth in variants 2,9 and 7, moderate level in Variant 1and 8 and low level in variants 3,4,5,6 and 10 (Table 1v).Total length and dorsal fin length relationship showed maximum level in variants1 and 7, moderate level in variant 8 and minimum level in variants 2,3,4,,5,6,9 and 10 (Table 1vi).
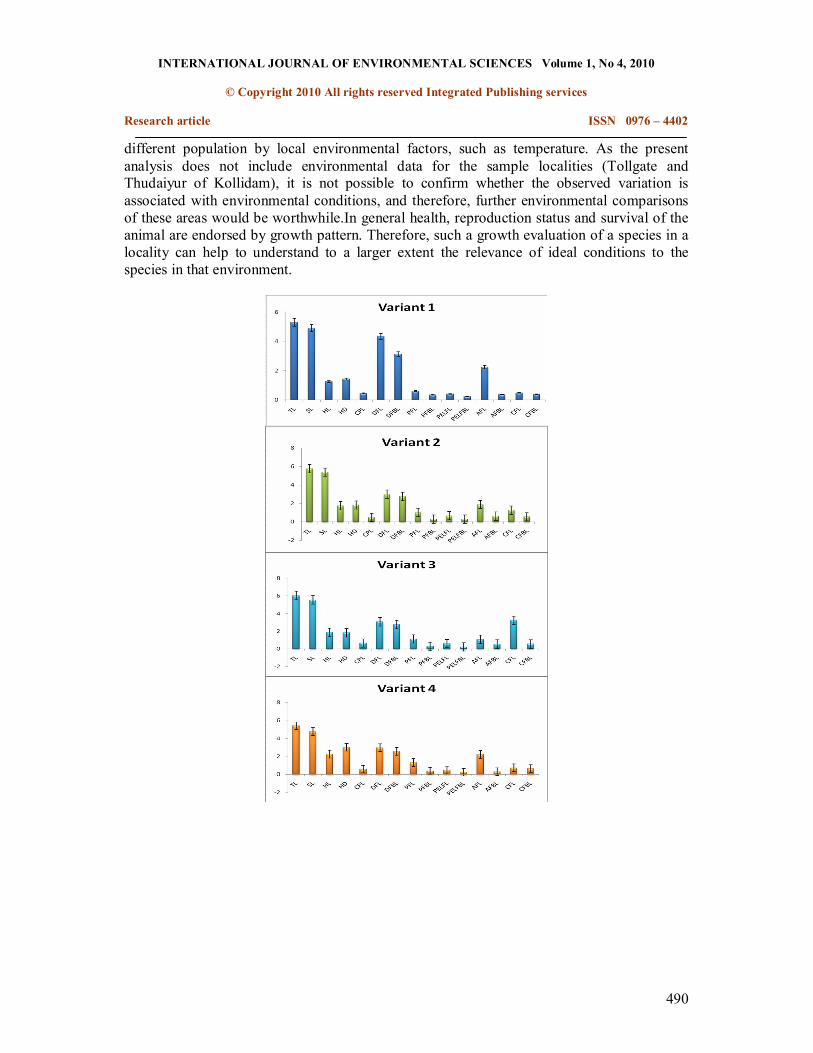
Maximum level of relationship between total length and dorsal fin basal length showed maximum level in variants 7 and 8, moderate level in variants 2 and 10 and minimum level in variants 3,4,5,6 and 8(Table 1vii).Total length and pectoral fin length relationship exhibited high level in variants 7, 8 and 9, moderate level in variants 1 and 2 and low level in variants 3,4,5,6 and 10 (Table 1viii).High level of relationship had been shown in total length and pectoral fin basal length in variants 1 and 3, moderate level in 2 nd ,9 th and 10 th whereas variants 3,4,5 and 6 showed low level (Table 1ix).Relationship between total length and pelvic fin length was high in variants 8 and 9, moderate level in variants 1 and 10, low levels in variants 2,3,4,5,6 and 7 (Table 1x).Total length and pelvic fin basal length relationship showed in high level in variants 1,2 and 7, moderate level in variant 8 and low level in variants 3,4,5,6 and 9 (Table 1xi).Maximum level of significant relationship had been shown in total length and anal fin in variants 1,7 and 8 moderate level in variants 3,6,9 and 10 and low level in variants 2,4 and 5 (Table 1xii).High level relationship had seen in total length and anal fin basal length in variants 2 and 8, moderate level in variants 1,3,4,5,6,7,9 and 10. No low level significance had noted (Table 1xiii).Total length and caudal fin length relationship had shown high level in variants 1,2 and 7, moderate level in 10 th variant and low level in variants 3,4,5,6,8 and 9 (Table 1xiv). In variant 2 and 7 maximum level of relationship between total length and caudal fin basal length had noted whereas low level in variants 1,3,4,5,6,8, 9 and 10. No moderate level variants (Table 1xv).It can be noticed from the bar diagram that the points are indicating close relationship between total length and standard length than in other parameters. It is understood that the relationship between the length and body weight shows the high relationship and low significant relationship between the total length and preorbital length next to standard length, the weight has close relationship.
INTERNATIONAL JOURNAL OF ENVIRONMENTAL SCIENCES Volume 1, No 4, 2010
© Copyright 2010 All rights reserved Integrated Publishing services
Research article ISSN 0976 – 4402
486
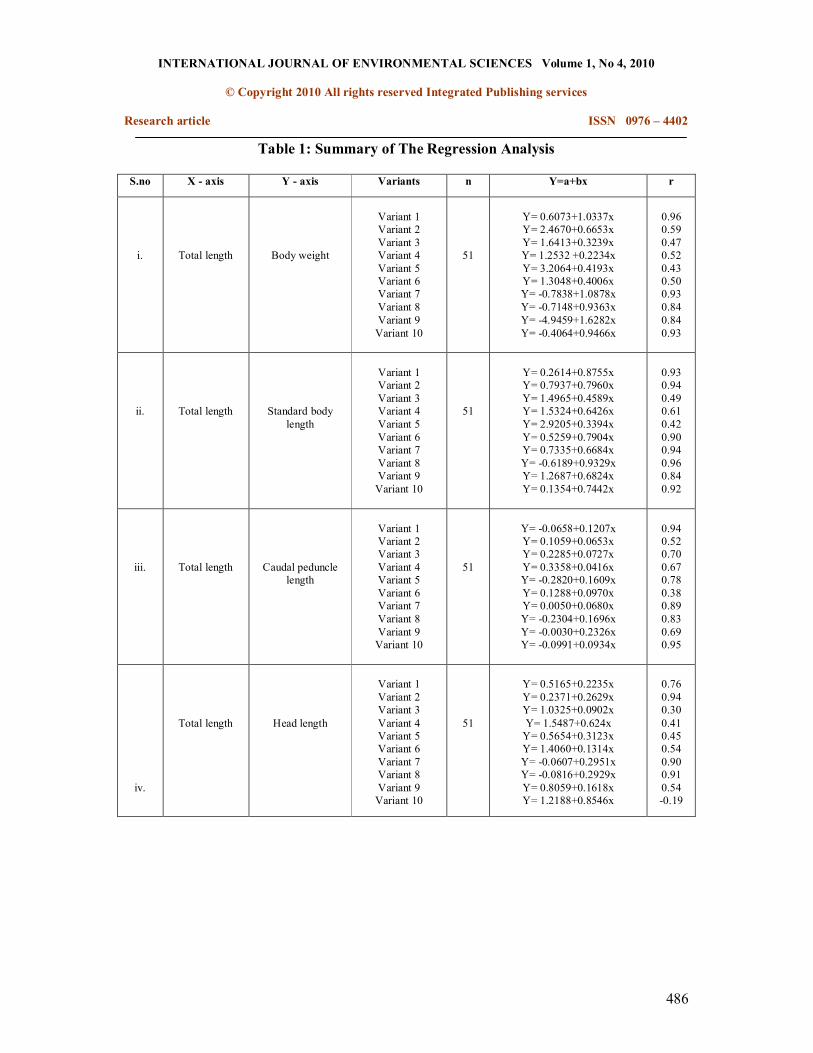
Table 1: Summary of The Regression Analysis
S.no X axis Y axis Variants n Y=a+bx r
i. Total length Body weight
Variant 1 Variant 2 Variant 3 Variant 4 Variant 5 Variant 6 Variant 7 Variant 8 Variant 9 Variant 10
51
Y= 0.6073+1.0337x Y= 2.4670+0.6653x Y= 1.6413+0.3239x Y= 1.2532 +0.2234x Y= 3.2064+0.4193x Y= 1.3048+0.4006x Y= 0.7838+1.0878x Y= 0.7148+0.9363x Y= 4.9459+1.6282x Y= 0.4064+0.9466x
0.96 0.59 0.47 0.52 0.43 0.50 0.93 0.84 0.84 0.93
ii. Total length Standard body length
Variant 1 Variant 2 Variant 3 Variant 4 Variant 5 Variant 6 Variant 7 Variant 8 Variant 9 Variant 10
51
Y= 0.2614+0.8755x Y= 0.7937+0.7960x Y= 1.4965+0.4589x Y= 1.5324+0.6426x Y= 2.9205+0.3394x Y= 0.5259+0.7904x Y= 0.7335+0.6684x Y= 0.6189+0.9329x Y= 1.2687+0.6824x Y= 0.1354+0.7442x
0.93 0.94 0.49 0.61 0.42 0.90 0.94 0.96 0.84 0.92
iii. Total length Caudal peduncle length
Variant 1 Variant 2 Variant 3 Variant 4 Variant 5 Variant 6 Variant 7 Variant 8 Variant 9 Variant 10
51
Y= 0.0658+0.1207x Y= 0.1059+0.0653x Y= 0.2285+0.0727x Y= 0.3358+0.0416x Y= 0.2820+0.1609x Y= 0.1288+0.0970x Y= 0.0050+0.0680x Y= 0.2304+0.1696x Y= 0.0030+0.2326x Y= 0.0991+0.0934x
0.94 0.52 0.70 0.67 0.78 0.38 0.89 0.83 0.69 0.95
iv.
Total length Head length
Variant 1 Variant 2 Variant 3 Variant 4 Variant 5 Variant 6 Variant 7 Variant 8 Variant 9 Variant 10
51
Y= 0.5165+0.2235x Y= 0.2371+0.2629x Y= 1.0325+0.0902x Y= 1.5487+0.624x Y= 0.5654+0.3123x Y= 1.4060+0.1314x Y= 0.0607+0.2951x Y= 0.0816+0.2929x Y= 0.8059+0.1618x Y= 1.2188+0.8546x
0.76 0.94 0.30 0.41 0.45 0.54 0.90 0.91 0.54 0.19
INTERNATIONAL JOURNAL OF ENVIRONMENTAL SCIENCES Volume 1, No 4, 2010
© Copyright 2010 All rights reserved Integrated Publishing services
Research article ISSN 0976 – 4402
487
v. Total length Head depth
Variant 1 Variant 2 Variant 3 Variant 4 Variant 5 Variant 6 Variant 7 Variant 8 Variant 9 Variant 10
51
Y= 0.2279+0.3408x Y= 0.8342+0.1710x Y= 0.5094+0.0986x Y= 0.7231+0.1546x Y= 1.9807+0.1902x Y= 0.6496+0.0852x Y= 0.3902+0.3125x Y= 0.0683+0.2267x Y= 0.9848+0.3598x Y= 1.1525+0.0683x
0.74 0.84 0.44 0.53 0.40 0.42 0.96 0.78 0.96 0.07
vi. Total length Dorsal fin length
Variant 1 Variant 2 Variant 3 Variant 4 Variant 5 Variant 6 Variant 7 Variant 8 Variant 9 Variant 10
51
Y= 1.1385+0.3211x Y= 0.1763+0.2132x Y= 1.5239+0.2329x Y= 1.0568 +0.1748x Y= 2.6842+0.5367x Y= 2.0466+0.0815x Y= 0.7081+0.3481x Y= 0.2738+0.3373x Y= 1.3921+0.1891x Y= 1.4098+0.2659x
0.84 0.29 0.37 0.34 0.12 0.23 0.88 0.78 0.28 0.46
vii. Total length Dorsal fin basal length
Variant 1 Variant 2 Variant 3 Variant 4 Variant 5 Variant 6 Variant 7 Variant 8 Variant 9 Variant 10
51
Y= 0.9687+0.2966x Y= 0.1079+0.4968x Y= 0.8716+0.2539x Y= 0.6438+0.1753x Y= 1.2747+0.2377x Y= 1.8042+0.0800x Y= 0.3365+0.3396x Y= 0.1107+0.3132x Y= 0.8947+0.1901x Y= 0.5426+0.3743x
0.94 0.76 0.51 0.42 0.47 0.22 0.87 0.80 0.30 0.62
viii. Total length Pectoral fin length
Variant 1 Variant 2 Variant 3 Variant 4 Variant 5 Variant 6 Variant 7 Variant 8 Variant 9 Variant 10
51
Y= 0.6638+0.0768x Y= 0.2244+0.1383x Y= 0.4872+0.1094x Y= 0.5463+0.1134x Y= 0.6321+0.1253x Y= 1.2670+0.2567x Y= 0.1805+0.2794x Y= 0.3830+0.1654x Y= 0.1171+0.2069x Y= 1.1301+0.0514x
0.76 0.76 0.51 0.57 0.35 0.26 0.95 0.84 0.90 0.44
ix. Total length Pectoral fin basal length
Variant 1 Variant 2 Variant 3 Variant 4 Variant 5 Variant 6 Variant 7 Variant 8 Variant 9 Variant 10
51
Y= 0.0690+0.0350x Y= 0.0212+0.0547x Y= 0.2195+0.0071x Y= 0.2738+0.0026x Y= 0.1465+0.0411x Y= 0.3575+0.0242x Y= 0.2846+0.1175x Y= 0.1084+0.0616x Y= 0.3022+0.0955x Y= 0.1622+0.0559x
0.81 0.78 0.29 0.32 0.47 0.32 0.82 0.88 0.78
0.64
INTERNATIONAL JOURNAL OF ENVIRONMENTAL SCIENCES Volume 1, No 4, 2010
© Copyright 2010 All rights reserved Integrated Publishing services
Research article ISSN 0976 – 4402
488
x. Total length Pelvic fin length
Variant 1 Variant 2 Variant 3 Variant 4 Variant 5 Variant 6 Variant 7 Variant 8 Variant 9 Variant 10
51
Y= 0.3423+0.0430x Y= 0.3988+0.0465x Y= 0.5449+0.1012x Y= 0.4357+0.0346x Y= 0.4088+0.0148x Y= 0.3854+0.0280x Y= 3.2167+(0.3799)x Y= 0.2835+0.2042x Y= 0.2568+0.2006x Y= 0.3077+(0.723)x
0.67 0.47 0.46 0.41 0.26 0.42 0.33 0.83 0.92 0.74
xi. Total length Pelvic fin basal length
Variant 1 Variant 2 Variant 3 Variant 4 Variant 5 Variant 6 Variant 7 Variant 8 Variant 9 Variant 10
51
Y= 0.0257+0.0429x Y= 0.0244+0.0522x Y= 0.0750+0.0160x Y= 0.1465+0.0214x Y= 0.2606+(0.0047)x Y= 0.2836+0.0093x Y= 0.0060+0.0343x Y= 0.1082+0.0346x Y= 0.1392+0.0133x Y= 0.0371+0.0522x
0.83 0.86 0.30 0.34 .12 0.15 0.87 0.60 0.24 0.30
xii. Total length Anal fin length
Variant 1 Variant 2 Variant 3 Variant 4 Variant 5 Variant 6 Variant 7 Variant 8 Variant 9 Variant 10
51
Y= 0.3751+0.1178x Y= 3.7711+ (0.3284)x Y= 0.9036+0.3410x Y= 0.7648+0.2432x Y= 1.6048+0.1133x Y= 0.8278+0.2371x Y= 0.9651+0.5513x Y= 0.8962+0.6575x Y= 1.2975+0.1869x Y= 0.4989+0.2722x
0.92 0.22 0.64 0.57 0.24 0.76 0.98 0.92 0.62 0.73
xiii. Total length Anal fin basal length
Variant 1 Variant 2 Variant 3 Variant 4 Variant 5 Variant 6 Variant 7 Variant 8 Variant 9 Variant 10
51
Y= 0.3438+0.0343x Y= 0.0288+0.1125x Y= 0.2382+0.2905x Y= 0.3146 +0.1875x Y= 0.2789+0.0044x Y= 0.7465+0.16680x Y= 0.2143+0.3473x Y= 0.6501+0.4578x Y= 1.0139+0.1581x Y= 0.2751+0.2516x
0.75 0.90 0.60 0.63 0.09 0.65 0.76 0.92 0.64 0.68
xiv. Total length Caudal fin length
Variant 1 Variant 2 Variant 3 Variant 4 Variant 5 Variant 6 Variant 7 Variant 8 Variant 9 Variant 10
51
Y= 0.3856+0.1032x Y= 0.1481+0.1938x Y= 1.0066+0.0412x Y= 1.1284+0.0338x Y= 0.6309+0.0193x Y= 0.8187+(0.0076)x Y= 0.5834+0.3246x Y= 0.5598+0.0649x Y= 0.1066+0.2091x Y= 0.3965+0.2924x
0.86 0.92 0.13 0.24 0.35 0.03 0.83 0.29 0.36 0.67

INTERNATIONAL JOURNAL OF ENVIRONMENTAL SCIENCES Volume 1, No 4, 2010
© Copyright 2010 All rights reserved Integrated Publishing services
Research article ISSN 0976 – 4402
489
xv. Total length Caudal fin basal length
Variant 1 Variant 2 Variant 3 Variant 4 Variant 5 Variant 6 Variant 7 Variant 8 Variant 9 Variant 10
51
Y= 0.2891+0.0447x Y= 0.0567+0.1048x Y= 0.6434+0.0443x Y= 0.7324+0.0511x Y= 0.5921+0.0098x Y= 0.2586+0.0342x Y= 0.5554+0.2399x Y= 0.4749+0.0083x Y= 0.5393+0.1332x Y= 0.0572+0.0473x
0.58 0.80 0.17 0.21 0.17 0.26 0.85 0.08 0.56 0.43
4. Discussion
Along the stretch of Kollidam, a branch of river Cauvery, two sites were fixed between upper anicut and grand anicut. Over the period of two years (20072009) and a total of 510 individuals of E.maculatus representing all the sizes (0.5 cm 13.0cms length) were selected and measured. Of the 15 morphometric characters examined, all exhibit a significantly positive correlation (p<0.01) between X and Y, indicates the growth in all organs of the fish but the level of significance vary with features indicate that different organs grow differently in different variants (Table.1). Among 15 parameters some features of some variants showed significant relationship eg: the total length and body weight (r=0.96), Total length and standard length (r=0.96) in variant 8, Total length and head depth (r=0.96) in variant 7, Total length and anal fin length (r=0.98) in variant 7 yielded maximum relationship among 10 different variants. Thus the increase of total length synchronized with different degree of the increase to the various factors denoted by “Y”.Similar lengthweight significance was reported in Serrasalmus spilopleura and S.maculatus (Jegu et al., 2001) in Galician three spine stickleback (Hermida et al., 2005) in Micropogonia furnieri (Marcus Rodrigues da coasta and Francisco Gerson Araujo, 2003) in Penaeid prawns (Subramanian 1987) and in lates calcariferous (Swamidoss Daniel, 1997). Morphometric analysis of E. maculatus was attempted by Kurup (1982) in kerala waters and Cecilia pandian (1994) in muthupet estury ,but their data restricted to 20 fishes of larger size only. Thus their data may not suitable for comparison here using the regression equation (Y=a+bx) the relationship of total length. Simiarly Subramanian (1987) also compared the Carpace length with four other body characters of the prawn Penaeus indicus. Presently arrived regression formula (Table.1) would help the interconversion of total length data with other morphometric characters including weight. Here the influence of various factors and total length of 10 variants of E.maculatus was listed with correlation coefficient and regression equation.Morphometric measurements have been widely used to discriminate the populations of various fish species (Elliolt et al., 1995 and Hurlbut and Clav 1998) the conventional approach for such analysis is based on measurement along the anteroposterior body axis and the depth measurement. In this study variation in the vari0us morphological characters of the 10 different variants of the fishes was found.Morphological divergence has been reported in the estuarine fish population that are not completely geographically separated, suggesting that partial isolation may play a role in population sub divisions. The results of the present study can also explain that E.maculatus living in the same place showed morphological divergence. It would indicate the possibility for microhabitat restriction that may influence this variation. Population differentiation may also occur despite opportunity for extensive gene flow between populations then there are relatively strong differential selective pressures exerted on the
INTERNATIONAL JOURNAL OF ENVIRONMENTAL SCIENCES Volume 1, No 4, 2010
© Copyright 2010 All rights reserved Integrated Publishing services
Research article ISSN 0976 – 4402
490
different population by local environmental factors, such as temperature. As the present analysis does not include environmental data for the sample localities (Tollgate and Thudaiyur of Kollidam), it is not possible to confirm whether the observed variation is associated with environmental conditions, and therefore, further environmental comparisons of these areas would be worthwhile.In general health, reproduction status and survival of the animal are endorsed by growth pattern. Therefore, such a growth evaluation of a species in a locality can help to understand to a larger extent the relevance of ideal conditions to the species in that environment.

INTERNATIONAL JOURNAL OF ENVIRONMENTAL SCIENCES Volume 1, No 4, 2010
© Copyright 2010 All rights reserved Integrated Publishing services
Research article ISSN 0976 – 4402
491
Figure 1:Morphometric Measurements in E.maculatus
INTERNATIONAL JOURNAL OF ENVIRONMENTAL SCIENCES Volume 1, No 4, 2010
© Copyright 2010 All rights reserved Integrated Publishing services
Research article ISSN 0976 – 4402
492
INTERNATIONAL JOURNAL OF ENVIRONMENTAL SCIENCES Volume 1, No 4, 2010
© Copyright 2010 All rights reserved Integrated Publishing services
Research article ISSN 0976 – 4402
493
INTERNATIONAL JOURNAL OF ENVIRONMENTAL SCIENCES Volume 1, No 4, 2010
© Copyright 2010 All rights reserved Integrated Publishing services
Research article ISSN 0976 – 4402
494
Figure 2: 10 Different variants of E.maculatus
The minimum relationship between total length and different parameters might be due to the least growth changes in the parameters over the fish size. The minimum relationship between total length and orbital length might be due to the least growth changes in the eye, over the fish size. Russell D. Fernald (2004) also stated that in the most teleost fishes, the eyes contain to grow though out the life without any obvious changes in visual capability. Thus the increasing of total length synchronized with different degree of increase of the various factors denoted by ‘Y’.
The most important global differences in body shape are related to body elongation or shortening, thus leads to large difference in body height and caudal peduncle length among the species (Mauro Joesh Cavalcanti, 1999) There were no significant difference in caudal peduncle length and length of dorsal fin base among samples. Slight significant differences in most of the other morphometric characteristics were found among the studied population. Head depth and head length of the fish is the character that contributed most of the discrimination among groups while length of the pectoral fin had the least contribution.From the statistical analysis, it was concluded that the morphology of a particular species has two more important component i.e. standard length and body weight. Among the morphometric characters namely standard length, breadth and weight have close relationship with total length than all other parameters. Generally length and weight are the functional parameters of growth. Statistical treatment of such parameter helps to establish their interrelationship and to arrive at the formulae for length related body measurements. This formula will form the basis for interconversion to evaluate the age of the animal, size, suitability of environment, biomass of the population etc. Similar too many fishes and shell fishes sexual maturity were determined through its length class.

INTERNATIONAL JOURNAL OF ENVIRONMENTAL SCIENCES Volume 1, No 4, 2010
© Copyright 2010 All rights reserved Integrated Publishing services
Research article ISSN 0976 – 4402
495
Acknowledgement
The authors wish to record their thanks to UGC, DOD, DBT, Ministry of Earth Sciences, MoEF, Govt. of India for the financial support, DSTFIST and UGCSAP for Instrumentation facilities.
5. References
1. Amutha, C., Subramanian, P., and Bupesh, G. 2007. Biology and biometry of a beautiful and forageable freshwater crustacean Streptocephalus dichotomus. Tropical Freshwater Biology, 16(2),pp 3543.
2. Anderson, R.O. and R.M. Neumann. 1996. Length, weight and associated structural indices. pp 447482.
3. Austin, M. 1999. Morphometric separation of annual cohorts within mid– Atlantic bluefish, Pomatomus saltatrix, using discriminant function analysis. 97: pp 411420.
4. Beyer, J.E. 1987. On length – weight relationships part I : Computing the mean weight of the fish of a given length class. Fish byte, Manila, 5: pp 1113.
5. Bolger, T. and Connolly P.L. 1989. Selection of suitable indices for the measurement and analysis of fish condition. Journal of fish Biology, Dumfries, 34: pp 171 – 182.
6. Bookstein F. L . 1991. Morphometric tools for land mark data Geometry and biology. Cambridge: Cambridge university press
7. Carpenter, K, E. HJ Sommer III, LF Marcus. 1996. Converting truss interlandmark distances to Cartesian Coordinates. In LF Marcus, M corti, A loy, G.Naylor, DE slice, eds. Advances in morphometrics. ATO ASI series A; Life Sciences, New York Plenum publ.284: pp 103111.
8. Cecilia Pandian,1994. Ichthyofauna of Muthupet estuary with reference to pearl spot Etroplus suretensis.PhD thesis, Bharathidasan University. pp 5989.
9. Doha. S. & Dewan, S. 1967. Studies on the biology of Tilapia, length weight relationship and condition factor. Pakistan J. Sci. 19: pp 1423.
10. Durate, L.O. C.B. Garcia, N.Sandoval, D.Von Schiller, G.Melo and P.Narajas. 1999. Length – weight relationship of demersal fishes from the Gulf of Salamanca, colombia. Naga: ICLARM Q. 22: pp 3436.
11. Elliott, N. G., Haskard, K. & Koslow J. A. (1986). Morphometric analysis of orange roughy(Haplostethus atlanticus) off the continental slope of southern Australia. Journal of Fish Biology 46, 202220.

INTERNATIONAL JOURNAL OF ENVIRONMENTAL SCIENCES Volume 1, No 4, 2010
© Copyright 2010 All rights reserved Integrated Publishing services
Research article ISSN 0976 – 4402
496
12. Gulland, J.A. (1983). Fish stock assessment: A manual of basic methods New York: Wiley.
13. Hermida, Miguel; Fernández, José; Amaro, Rafaela; Miguel, Eduardo, 2005 Morphometric and meristic variation in Galician threespine stickleback populations, northwest Spain Environmental Biology of Fishes, 73 (2): pp 189200.
14. Hurlbut, T. and D. Clay. (1998). Morphometric and meristic differences between shallow and deepwater populations of White hake (Urophycis tenuis) in the southern Gulf of St Lawrence. Can. J. Fish. Aquat. Sci., 55: pp 22742282.
15. Islam, M.W., M. Tariq, A.M. Ageel, M.S. AlSaid and M.A. AlYahya. 1991. Effect of Salvia haematodes on sexual behaviour of male rats. Journal of Ethnopharmacology, 33: pp 6772.
16. Iqbal, M.S., Mortuza, M.G. Parween, S. & M.A. Hossain.(199596). Lengthweight relationship and condition factor of Chanda nama (Hamilton) and Chada ranga (Hamilton). Rajshahi Univ. Std. PartB 2324: pp 237 242.
17. Jégu, Michel., Dos Santos, Geraldo Mendes., 2001, Mise Au Point À Propos de Serrasalmus spilopleura Kner, 1858 et Réhabilitation de S. maculatus Kner, 1858(Characidae: Serrasalminae) Cybium, 25(2): pp 119143.
18. Kulbicki, M.G. Mou Tham, P.Thollot and L.Wanting. 1993 Lengthweight relationships of fish from the lagoon of New Caledonia. Naga : ICLARM Q. 16: pp 2630.
19. Kurup, B.M 1982. Studies on systematics and biology of the fishes of the Vembanad Lake. Ph.D. Thesis , University of cochin, Cochin
20. Le Cren , C.P. 1951. The length weight relationship and seasonal cycle in gonad weights and condition in the Perch (Perca fluviatili). J.Anim. Ecol; 16: pp 187 204.
21. Letourneur,Y. 1998. Length – weight relationship of some marine fish speices in Reunion Island, New Caledonia. Naga : ICLARM Q.21:3946.
22. Loy, A., Corti, M., Marcus, L.F. 1993. Landmark data: size and shape analysis in systematic. A case study on old world Talidae (Mammalia, Insectivora). In LF Marcus, E.Bellow, A.Garcia – Valdacases, (eds). Contributions to morphometrics. pp 213240.
23. Marcus Rodrigues da costa 2003 Lengthweight relationship and condition factor of Micropogonias furnieri.Rev. Bras.Zool. .20 (4).
24. Mauro José Cavalcanti,, Leandro Rabello Monteiro and Paulo Roberto Duarte Lopes. 1999. Landmarkbased Morphometric Analysis in Selected Species of Serranid Fishes (Perciformes: Teleostei) Zool.stud. 38(3): pp 287294.
INTERNATIONAL JOURNAL OF ENVIRONMENTAL SCIENCES Volume 1, No 4, 2010
© Copyright 2010 All rights reserved Integrated Publishing services
Research article ISSN 0976 – 4402
497
25. Mortuza, M.G. & Tawfeequa, R. 2006. Lengthweight relationship, condition factor and sexration of freshwater fish, Rhinomugil corsula (Hamilton) (Mugiliformes:Mugilidae) from Rajshahi, Bangladesh. J. biosci. 14: pp 139141.
26. Pitcher, T.J. and P.J Hart. 1982. Fisheries Ecology. Chapman and Hall, London.
27. Prabhakara Rao, A.V. (1968) Observations on the food and feeding habits of Gerres oyena (Forskal) and G. filamentosus Cuvier from the Pulicat Lake, with notes on the food of allied species. Journal of the Marine Biological Association of India 10: pp 332346.
28. Prasad, T.K., Anderson, Marc D., Martin, B.A., Steward, C.R. (1994): Evidence for chilling induced oxidative stress in maize seedlings and a regulatory role for hydrogen peroxide.Plant Cell 6: pp 6574.
29. Richardson AJ, Lamberts C, Isaacs G, Moloney CL, Gibbons MJ (2000) Length weight regressions for some important forage crustaceans from South Africa. NAGA 23: pp 2933.
30. Rohlf, F. J. and L. F. Marcus. 1993. A revolution in morphometrics. Trends in Ecology and Evolution, 8: pp 129132.
31. Rohlf, F.J. 1996. Morphometric spaces, shape components and the effects of linear transformations. In LF Marcus, M.Corti, A.Loy, G.Naylor, DE Slice (eds). Advances in morphometrics. NATO ASI series. A life sciences Vol.284. New York: plenum. pp 117129.
32. Rokshanara Pervin M, Golam Mortuza M, 2008. Notes on LengthWeight Relationship and Condition Factor of Fresh Water Fish, Labeo boga (Hamilton) (Cypriniformes: Cyprinidae) Univ. j. zool. Rajshahi Univ. 27: pp. 9798
33. Russell D. Fernald, 2004 Growth of the teleost eye: novel solutions to complex constraints Environmental Biology of Fishes, 13(2) : pp 113123.
34. Subramanian, P. 1987. Spawner recruit distribution on Penaeus indicus in Parangipetti Coastal Ecosystem. J. Mar.Biol. Ass. India 29 (1&2): pp 2336.
35. Swamidoss Daniel, G. 1997. On some aspects of feeding biology of Lates calcarifer (Bloch) of Muthupet estuary. Ph.D., thesis, Bharathidasan University