morphological charts: a systematic exploration of
TRANSCRIPT
Clemson UniversityTigerPrints
All Theses Theses
12-2007
MORPHOLOGICAL CHARTS: ASYSTEMATIC EXPLORATION OFQUALITATIVE DESIGN SPACEGregory SmithClemson University, [email protected]
Follow this and additional works at: https://tigerprints.clemson.edu/all_theses
Part of the Engineering Mechanics Commons
This Thesis is brought to you for free and open access by the Theses at TigerPrints. It has been accepted for inclusion in All Theses by an authorizedadministrator of TigerPrints. For more information, please contact [email protected].
Recommended CitationSmith, Gregory, "MORPHOLOGICAL CHARTS: A SYSTEMATIC EXPLORATION OF QUALITATIVE DESIGN SPACE"(2007). All Theses. 274.https://tigerprints.clemson.edu/all_theses/274
MORPHOLOGICAL CHARTS: A SYSTEMATIC EXPLORATION
OF QUALITATIVE DESIGN SPACE ______________________________
A Thesis
Presented to the Graduate School of
Clemson University ______________________________
In Partial Fulfillment
of the Requirements for the Degree Master of Science
Mechanical Engineering ______________________________
by
Gregory P. Smith December 2007
______________________________
Accepted by: Dr. Joshua Summers, Committee Chair
Dr. Georges Fadel Dr. Vincent Blouin
ii
ABSTRACT
A morphological chart is a tool that represents a large qualitative design space.
These charts list the functions identified for the design problem, and the means
(solutions) that can perform each function. Combining one means for each function will
produce a potential integrated conceptual design solution. Repeating this process with
every possible combination contained in the morphological chart will generate a long list
of conceptual design solutions. Not all of these solutions will be practical, or even
physically possible.
As it is difficult to analyze a long list of design solutions and as at present, there
are no systematic design tools to aid in such an analysis, a systematic study of
morphological charts is explored in this thesis to build the foundation for developing
future systematic exploration tools. Existing tools operate by eliminating possibilities at
higher levels, such as with Axiomatic Design. Designers may sift through a
morphological chart and create concepts based on what experience shows has worked in
the past. Two experiments were conducted to determine relationships between
morphological chart sizes and topologies with respect to the quality of design concepts
generated from the charts. The findings from these experiments suggest that reducing the
number of functions represented allowed designers to discover higher quality solutions.
Based on these findings, recommendations are made to further filter morphological charts
to sizes and shapes that are more easily explored by the designers.
iii
ACKNOWLEDGEMENTS
Thank you, Dr. Summers for your assistance and guidance throughout this
project.
Thank you, Dr. Fadel and Dr. Blouin for your time and assistance in reviewing
this work.
Thank you to all the CREDO and AID members who assisted with and
participated as judges in these experiments.
Thank you to all the ME202 undergraduate students who participated in these
experiments.
iv
DEDICATION
This dissertation is dedicated to my wife, Sarah. Thank you for your love, your
help, and your encouragement.
v
TABLE OF CONTENTS
Page
TITLE PAGE....................................................................................................................... i
ABSTRACT........................................................................................................................ ii
ACKNOWLEDGEMENTS............................................................................................... iii
DEDICATION................................................................................................................... iv
LIST OF TABLES........................................................................................................... viii
LIST OF FIGURES ............................................................................................................ x
Chapter 1 Morphological Charts: Use Context and Research Motivation ......................... 1
Use Context............................................................................................................. 1
Description of Morphological Charts ..................................................................... 2
Statement of the Problem........................................................................................ 3
Hypothesis............................................................................................................... 3
Experimental Constraints........................................................................................ 4
Chapter 2 Morphological Charts: Solution Space Expansion and Exploration Tools........ 6
Function Identification............................................................................................ 6
Function Decomposition......................................................................................... 9
Means Generation ................................................................................................. 20
Morphological Chart Detail .................................................................................. 21
Chapter 3 Experimental Study With Two Morphological Charts .................................... 30
Experimental Method............................................................................................ 30
Participants............................................................................................................ 32
vi
Design Problem..................................................................................................... 33
Procedure .............................................................................................................. 34
Data Collection ..................................................................................................... 35
Data Analysis ........................................................................................................ 39
User Study Results................................................................................................ 42
Discussion............................................................................................................. 44
Chapter 4 Experimental Study With Four Morphological Charts .................................... 47
Experimental Method............................................................................................ 47
Participants............................................................................................................ 52
Design Problem..................................................................................................... 52
Procedure .............................................................................................................. 54
Data Collection ..................................................................................................... 55
Data Analysis ........................................................................................................ 58
User Study Results................................................................................................ 73
Discussion............................................................................................................. 83
Chapter 5 Comparison of the Experimental Studies......................................................... 85
Design Problem..................................................................................................... 85
Participants............................................................................................................ 86
Morphological Charts ........................................................................................... 87
Experimental Procedure........................................................................................ 88
Discussion............................................................................................................. 90
Chapter 6 Conclusions ...................................................................................................... 91
vii
Contributions......................................................................................................... 92
Judging Systems.................................................................................................... 92
Future Work .......................................................................................................... 94
LIST OF REFERENCES.................................................................................................. 99
viii
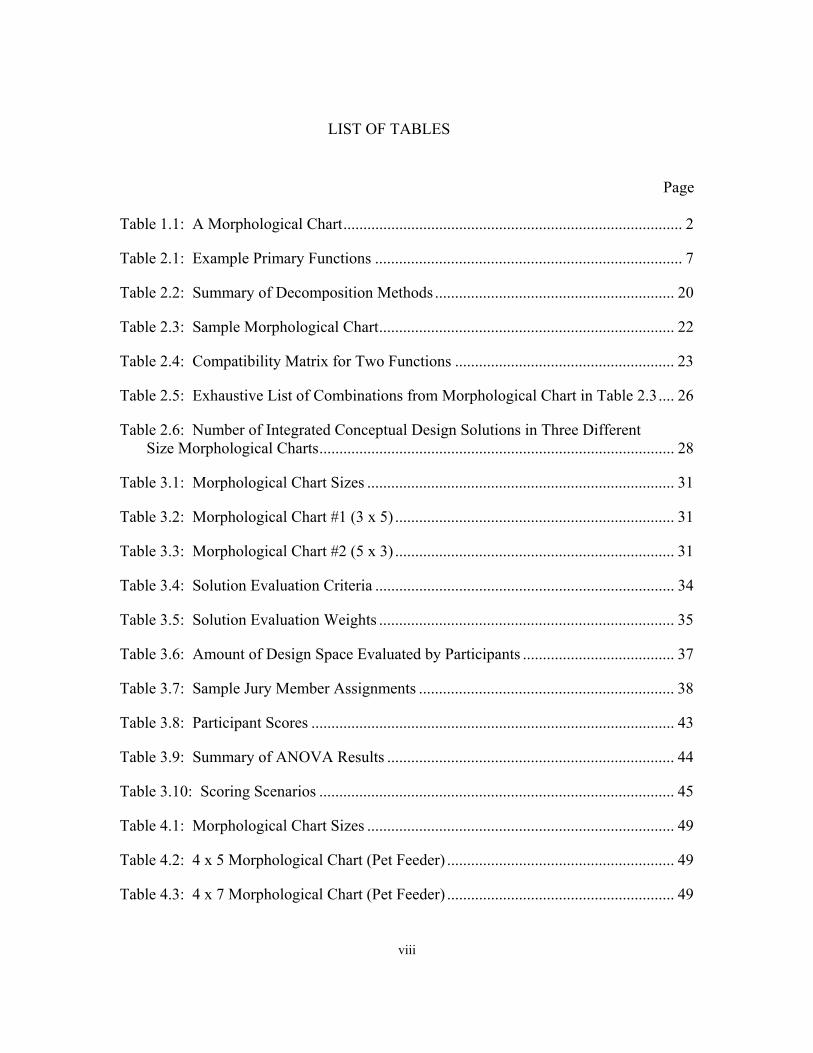
LIST OF TABLES
Page
Table 1.1: A Morphological Chart..................................................................................... 2
Table 2.1: Example Primary Functions ............................................................................. 7
Table 2.2: Summary of Decomposition Methods ............................................................ 20
Table 2.3: Sample Morphological Chart.......................................................................... 22
Table 2.4: Compatibility Matrix for Two Functions ....................................................... 23
Table 2.5: Exhaustive List of Combinations from Morphological Chart in Table 2.3.... 26
Table 2.6: Number of Integrated Conceptual Design Solutions in Three Different Size Morphological Charts......................................................................................... 28
Table 3.1: Morphological Chart Sizes ............................................................................. 31
Table 3.2: Morphological Chart #1 (3 x 5) ...................................................................... 31
Table 3.3: Morphological Chart #2 (5 x 3) ...................................................................... 31
Table 3.4: Solution Evaluation Criteria ........................................................................... 34
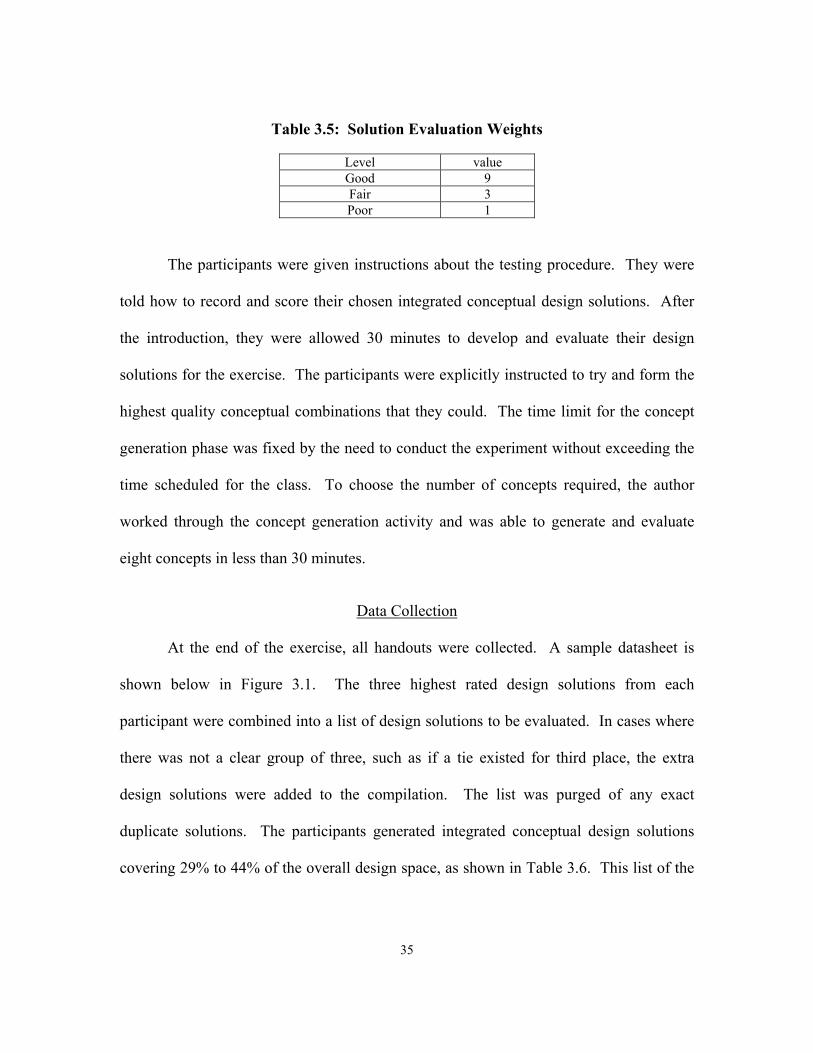
Table 3.5: Solution Evaluation Weights .......................................................................... 35
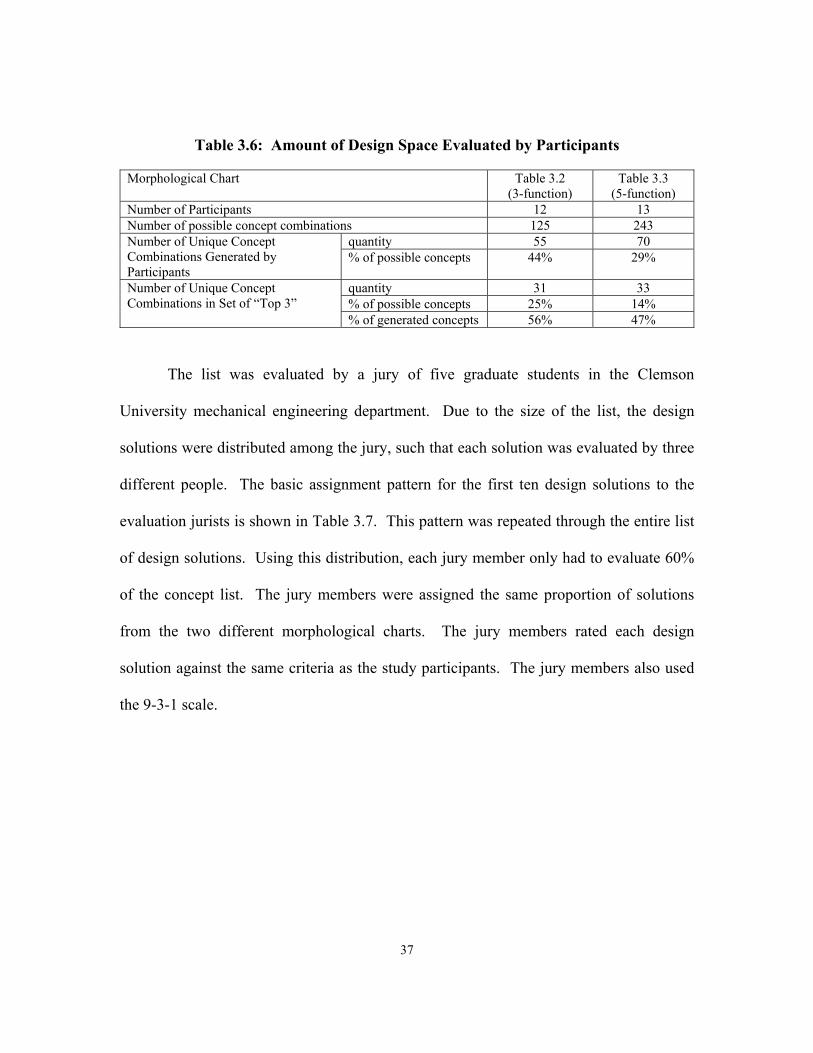
Table 3.6: Amount of Design Space Evaluated by Participants ...................................... 37
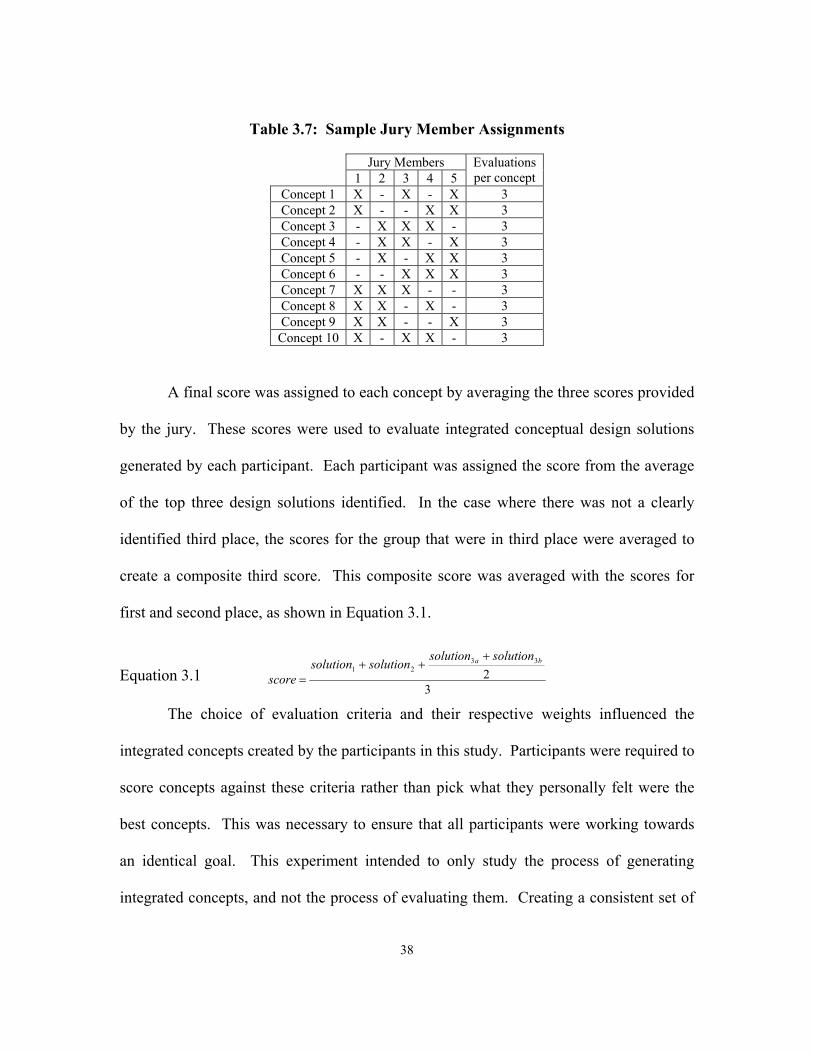
Table 3.7: Sample Jury Member Assignments ................................................................ 38
Table 3.8: Participant Scores ........................................................................................... 43
Table 3.9: Summary of ANOVA Results ........................................................................ 44
Table 3.10: Scoring Scenarios ......................................................................................... 45
Table 4.1: Morphological Chart Sizes ............................................................................. 49
Table 4.2: 4 x 5 Morphological Chart (Pet Feeder) ......................................................... 49
Table 4.3: 4 x 7 Morphological Chart (Pet Feeder) ......................................................... 49
ix
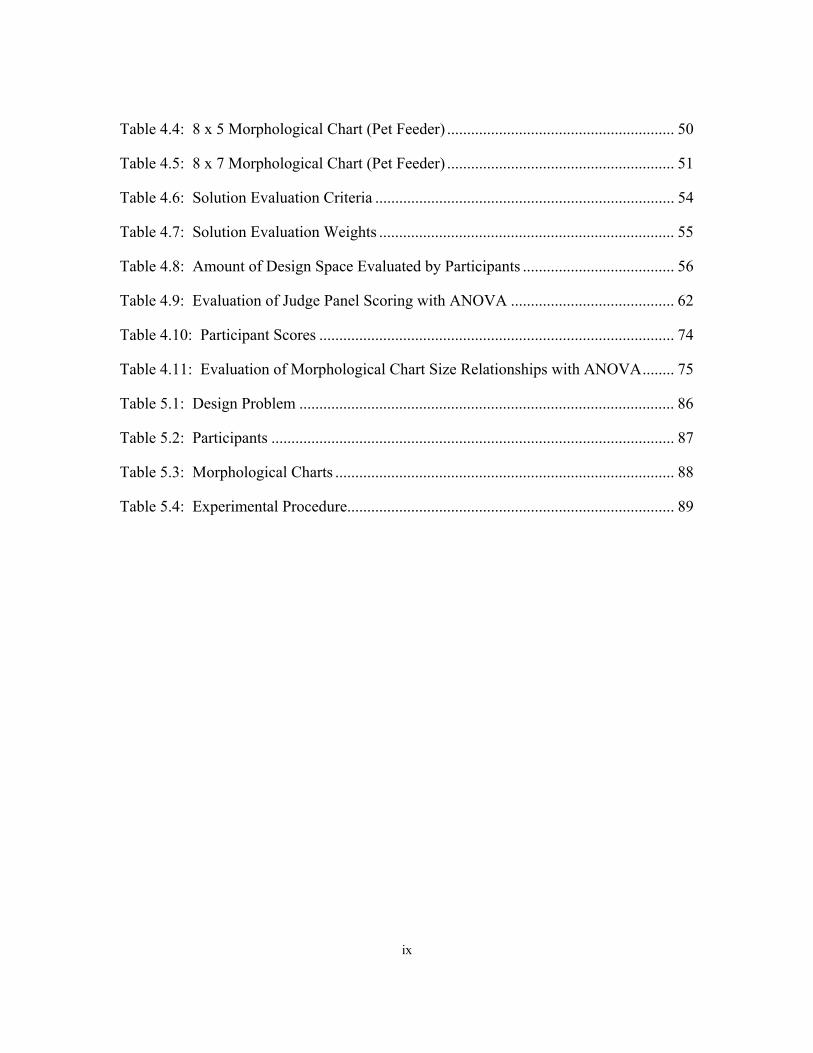
Table 4.4: 8 x 5 Morphological Chart (Pet Feeder) ......................................................... 50
Table 4.5: 8 x 7 Morphological Chart (Pet Feeder) ......................................................... 51
Table 4.6: Solution Evaluation Criteria ........................................................................... 54
Table 4.7: Solution Evaluation Weights .......................................................................... 55
Table 4.8: Amount of Design Space Evaluated by Participants ...................................... 56
Table 4.9: Evaluation of Judge Panel Scoring with ANOVA ......................................... 62
Table 4.10: Participant Scores ......................................................................................... 74
Table 4.11: Evaluation of Morphological Chart Size Relationships with ANOVA........ 75
Table 5.1: Design Problem .............................................................................................. 86
Table 5.2: Participants ..................................................................................................... 87
Table 5.3: Morphological Charts ..................................................................................... 88
Table 5.4: Experimental Procedure.................................................................................. 89
x
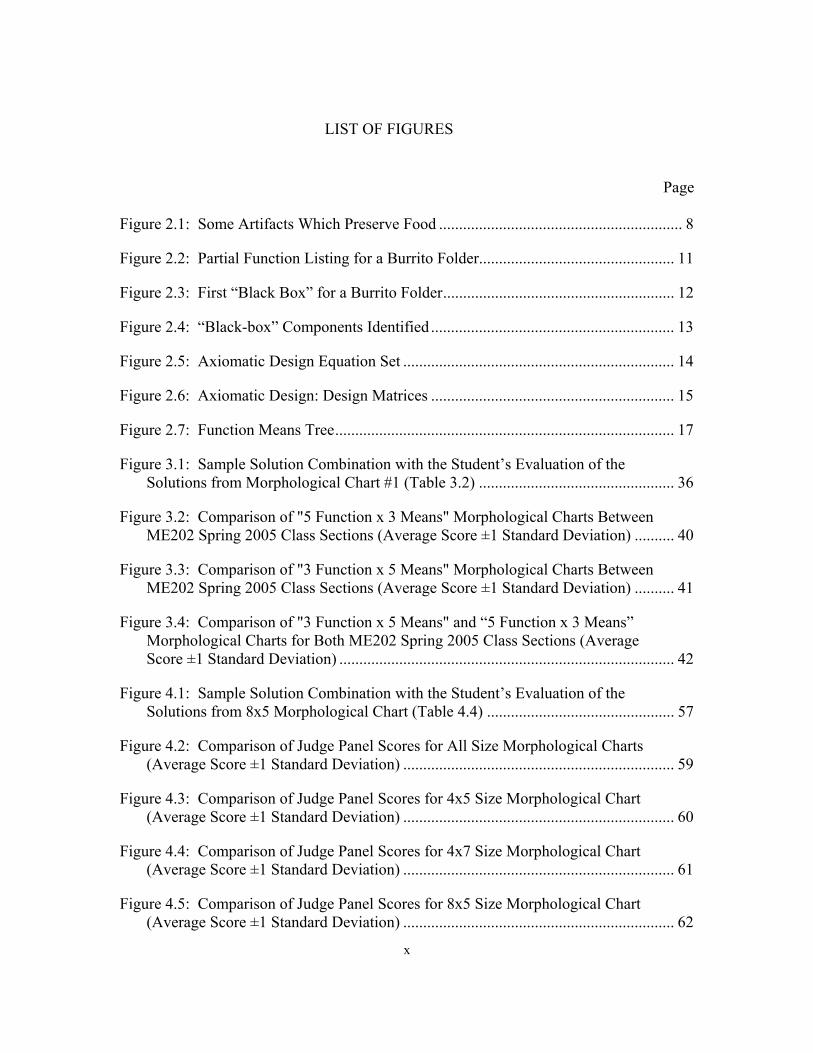
LIST OF FIGURES
Page
Figure 2.1: Some Artifacts Which Preserve Food ............................................................. 8
Figure 2.2: Partial Function Listing for a Burrito Folder................................................. 11
Figure 2.3: First “Black Box” for a Burrito Folder.......................................................... 12
Figure 2.4: “Black-box” Components Identified ............................................................. 13
Figure 2.5: Axiomatic Design Equation Set .................................................................... 14
Figure 2.6: Axiomatic Design: Design Matrices ............................................................. 15
Figure 2.7: Function Means Tree..................................................................................... 17
Figure 3.1: Sample Solution Combination with the Student’s Evaluation of the Solutions from Morphological Chart #1 (Table 3.2) ................................................. 36
Figure 3.2: Comparison of "5 Function x 3 Means" Morphological Charts Between ME202 Spring 2005 Class Sections (Average Score ±1 Standard Deviation) .......... 40
Figure 3.3: Comparison of "3 Function x 5 Means" Morphological Charts Between ME202 Spring 2005 Class Sections (Average Score ±1 Standard Deviation) .......... 41
Figure 3.4: Comparison of "3 Function x 5 Means" and “5 Function x 3 Means” Morphological Charts for Both ME202 Spring 2005 Class Sections (Average Score ±1 Standard Deviation) .................................................................................... 42
Figure 4.1: Sample Solution Combination with the Student’s Evaluation of the Solutions from 8x5 Morphological Chart (Table 4.4) ............................................... 57
Figure 4.2: Comparison of Judge Panel Scores for All Size Morphological Charts (Average Score ±1 Standard Deviation) .................................................................... 59
Figure 4.3: Comparison of Judge Panel Scores for 4x5 Size Morphological Chart (Average Score ±1 Standard Deviation) .................................................................... 60
Figure 4.4: Comparison of Judge Panel Scores for 4x7 Size Morphological Chart (Average Score ±1 Standard Deviation) .................................................................... 61
Figure 4.5: Comparison of Judge Panel Scores for 8x5 Size Morphological Chart (Average Score ±1 Standard Deviation) .................................................................... 62
xi
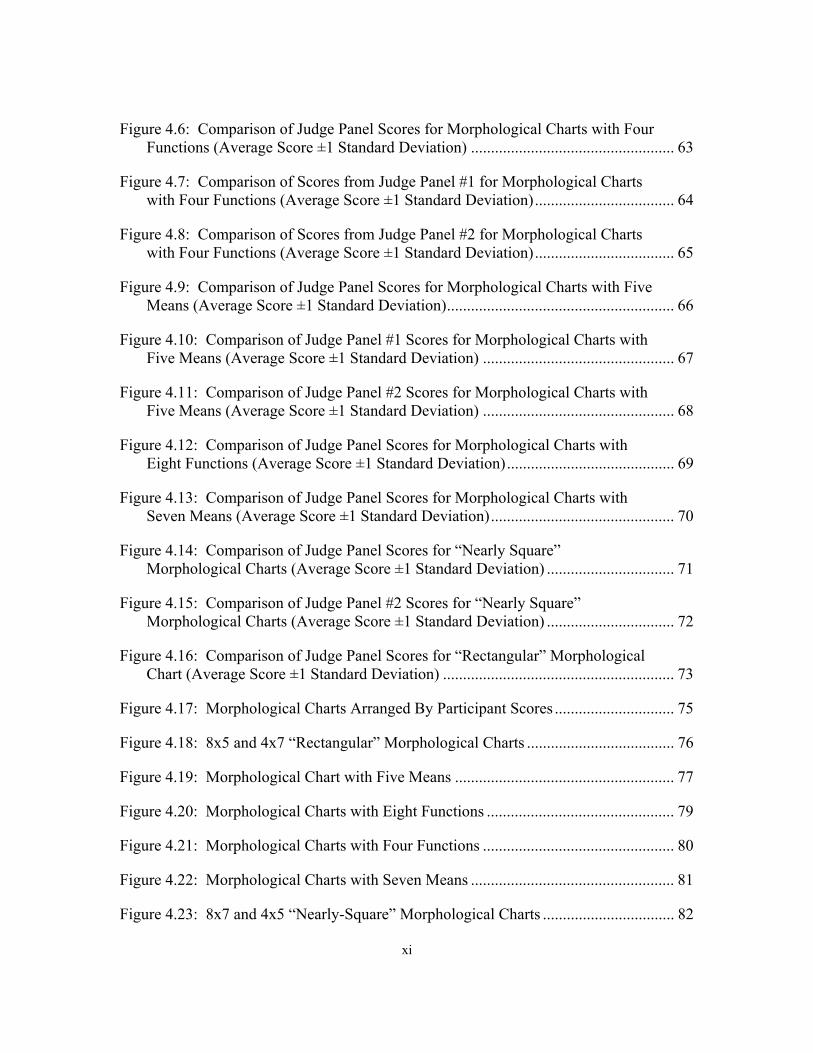
Figure 4.6: Comparison of Judge Panel Scores for Morphological Charts with Four Functions (Average Score ±1 Standard Deviation) ................................................... 63
Figure 4.7: Comparison of Scores from Judge Panel #1 for Morphological Charts with Four Functions (Average Score ±1 Standard Deviation)................................... 64
Figure 4.8: Comparison of Scores from Judge Panel #2 for Morphological Charts with Four Functions (Average Score ±1 Standard Deviation)................................... 65
Figure 4.9: Comparison of Judge Panel Scores for Morphological Charts with Five Means (Average Score ±1 Standard Deviation)......................................................... 66
Figure 4.10: Comparison of Judge Panel #1 Scores for Morphological Charts with Five Means (Average Score ±1 Standard Deviation) ................................................ 67
Figure 4.11: Comparison of Judge Panel #2 Scores for Morphological Charts with Five Means (Average Score ±1 Standard Deviation) ................................................ 68
Figure 4.12: Comparison of Judge Panel Scores for Morphological Charts with Eight Functions (Average Score ±1 Standard Deviation).......................................... 69
Figure 4.13: Comparison of Judge Panel Scores for Morphological Charts with Seven Means (Average Score ±1 Standard Deviation).............................................. 70
Figure 4.14: Comparison of Judge Panel Scores for “Nearly Square” Morphological Charts (Average Score ±1 Standard Deviation) ................................ 71
Figure 4.15: Comparison of Judge Panel #2 Scores for “Nearly Square” Morphological Charts (Average Score ±1 Standard Deviation) ................................ 72
Figure 4.16: Comparison of Judge Panel Scores for “Rectangular” Morphological Chart (Average Score ±1 Standard Deviation) .......................................................... 73
Figure 4.17: Morphological Charts Arranged By Participant Scores .............................. 75
Figure 4.18: 8x5 and 4x7 “Rectangular” Morphological Charts ..................................... 76
Figure 4.19: Morphological Chart with Five Means ....................................................... 77
Figure 4.20: Morphological Charts with Eight Functions ............................................... 79
Figure 4.21: Morphological Charts with Four Functions ................................................ 80
Figure 4.22: Morphological Charts with Seven Means ................................................... 81
Figure 4.23: 8x7 and 4x5 “Nearly-Square” Morphological Charts ................................. 82

xii
Figure 6.1: Rigorous Set of Functions from a Single Functional Decomposition........... 95
1
CHAPTER 1
MORPHOLOGICAL CHARTS: USE CONTEXT AND RESEARCH MOTIVATION
Use Context
The contemporary design process can be broken down into general phases:
conceptual design, embodiment design, and detail design (Pahl and Beitz, 1996). In
some works, embodiment design and detail design are combined into a single product
development phase (Ullman, 2003). In the conceptual design phase, the principle
solution is created. In the embodiment design phase, the physical layout of the solution is
determined. During the detail design phase, the materials are specified and the
production systems are finalized (Pahl and Beitz, 1996). This work, in dealing with
morphological charts, examines the conceptual design phase.
The concept design phase is further broken down into the following steps. First,
the specification is examined and the design problem is identified. Once the problem is
understood, function decomposition begins. Solutions for each sub-function must be
identified and combined to create a potential integrated conceptual design.
Morphological charts may be used in this combination step. Multiple designs are
evaluated, and a principle solution is selected. This principle solution will be further
explored in the embodiment and detail design phases.
2
Description of Morphological Charts
A morphological chart in essence is a table of functions and solutions for each
function. Normal convention is to list the functions in a column in the left hand side of
the table, and list the solutions to each function to the right of the function. Various terms
exist for these solutions. Dym and Little use the term means (Dym and Little, 2000).
The English translation of Pahl and Beitz uses the term working principle (Pahl and
Beitz, 1995). Suh (2001) uses the term design parameters. Throughout this paper,
means will be used to define the solution to a specific function.
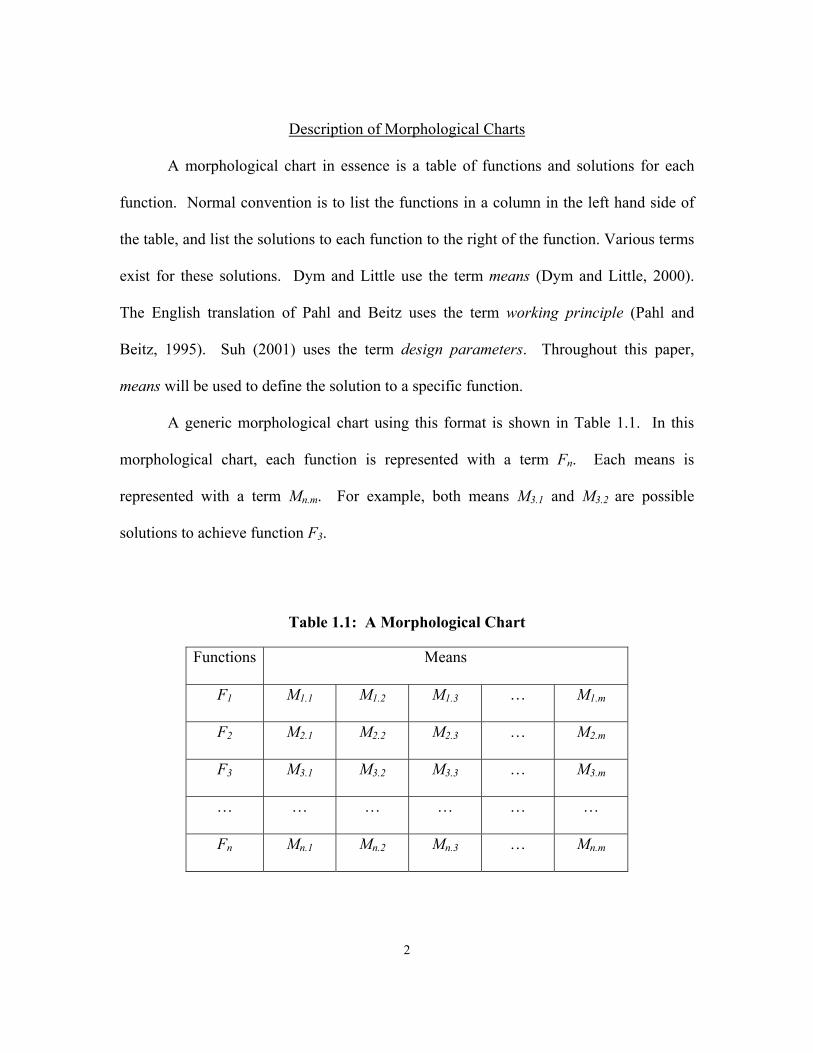
A generic morphological chart using this format is shown in Table 1.1. In this
morphological chart, each function is represented with a term Fn. Each means is
represented with a term Mn.m. For example, both means M3.1 and M3.2 are possible
solutions to achieve function F3.
Table 1.1: A Morphological Chart
Functions Means
F1 M1.1 M1.2 M1.3 … M1.m
F2 M2.1 M2.2 M2.3 … M2.m
F3 M3.1 M3.2 M3.3 … M3.m
… … … … … …
Fn Mn.1 Mn.2 Mn.3 … Mn.m
3
Statement of the Problem
Idea generation tools are either intuitive or logical. Intuitive idea generation tools
attempt to promote creativity (Shah, 1998). Logical idea generation tools have a process
of steps to follow (Shah, 1998). Today, morphological charts are intuitive idea
generation tools (Shah, 1998). A process for using them to generate high quality design
concepts does not exist. This work seeks to support development of a process of steps
that will enable morphological charts to be used as logical idea generation tools. In
working towards that goal, this work examines the quality of integrated conceptual
design solutions generated by undergraduate mechanical engineering students. This work
will show that there is a statistically significant difference in the quality of concepts
generated from different size morphological charts.
Hypothesis
This work proposes that in a fixed period of time, higher quality integrated
conceptual design solutions can be created using morphological charts which contains
fewer integrated conceptual design solutions. This claim is investigated through two
experiments described in Chapter 3 and Chapter 4.
The following chapter discussed morphological charts as defined in the literature.
Limitations to the use of morphological charts are extracted, specifically the randomness
of exploring the design space. It is this limitation that forms the motivation for the
experiments that are detailed in Chapter 3 and Chapter 4. Following the individual
experiments, a comparison of the two approaches is found in Chapter 5. Finally, a
4
summary, concluding remarks, and possible future extensions are discussed in the closing
chapter.
Experimental Constraints
There are many aspects related to the use of morphological charts worthy of
study. This work examines the impact of morphological chart size on the quality of
integrated concepts generated. Other items which might impact the quality of integrated
concepts include the amount of time permitted for a designer to consider the
morphological chart, the experience of the designer, and the presence of known good or
bad solutions in the charts. The process of generating a morphological chart also could
be served by further study.
This work was limited to just the size and shape of morphological charts because
these aspects are directly related to the number of functions and the number of means per
function in the charts. The number of functions and the number of means per function
directly influence the number of possible integrated concepts that the morphological chart
may produce. Additional areas of impact, such as having the participants develop their
own morphological chart, or using participants with a wide variation in experience were
not investigated because those factors would introduce much more variation into the
experiment, and make statistical analysis more difficult without increasing the number of
participants.
Each experiment conducted for this work required a population of participants
with similar backgrounds, but who had not already participated in this experiment. Using
participants only once reduces any impact that a participant’s familiarity with the

5
experiment may have on the results. This limits the number of trials that may be run,
because the pool of available participants is limited.
6
CHAPTER 2
MORPHOLOGICAL CHARTS: SOLUTION SPACE EXPANSION AND
EXPLORATION TOOLS
A morphological chart is a tool that represents possible solutions to a design
problem. It consists of a list of the decomposed sub-functions of a design and the means
by which each sub-function may be realized. Typically, a morphological chart is shown
in tabular form. The sub-functions are listed in the left-most column. The means are
listed to the right of the sub-functions. To create a morphological chart, one must
identify the primary function, decompose this function, and then generate ideas for how
to achieve each sub-function. Once the chart is populated, the designer combines the
possible means to form connected solutions. This chapter discusses the steps of creating
morphological charts and evaluates their usage in design.
Function Identification
The first step in generating a morphological chart is identification of the primary
function. When a need is identified, the search for a design solution can begin. Many
works in design theory relate that the functions needed in the design solution must be
identified (Pahl and Beitz, 1995; Otto and Wood, 2001; Ulrich and Eppinger, 1995; Dym
and Little, 2000). Functions are the relationships between the inputs and outputs of a
designed system. In basic form, they are a pair consisting of an action verb and a noun
(Dym and Little, 2000; Suh, 2001; Otto and Wood, 2001; Stone and Wood, 1999; Hirtz et
al., 2001). For most of this work, the examples will use two novel devices, a burrito
7
folding machine, and an automatic pet food dispenser. In some cases, the more common
kitchen refrigerator is used when familiarity with the device is desired. For the case of a
refrigerator, several functions come to mind. A partial list includes cool food, store food,
preserve food, display food, and hold food. However, the primary function of a
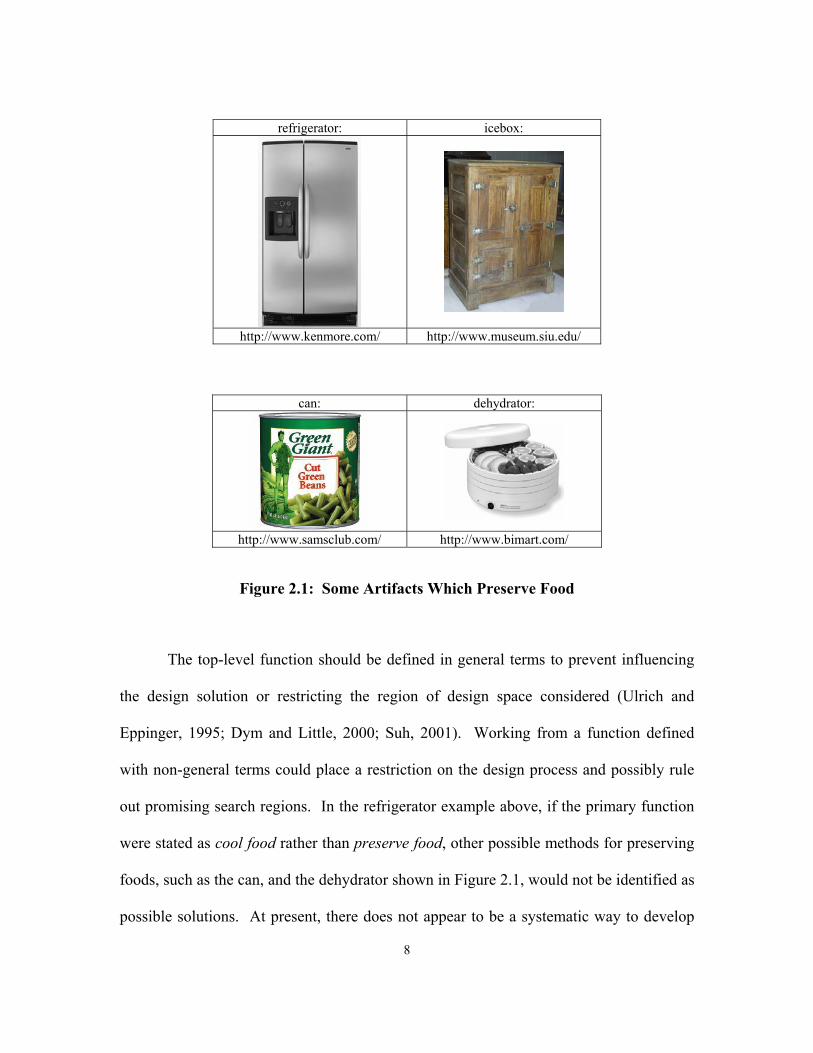
refrigerator is to preserve food. Some devices which preserve food are shown below in
Figure 2.1. The action, or verb, is to preserve; while the target of the action is the noun
food. Once this primary function is identified, the designer may begin the search for
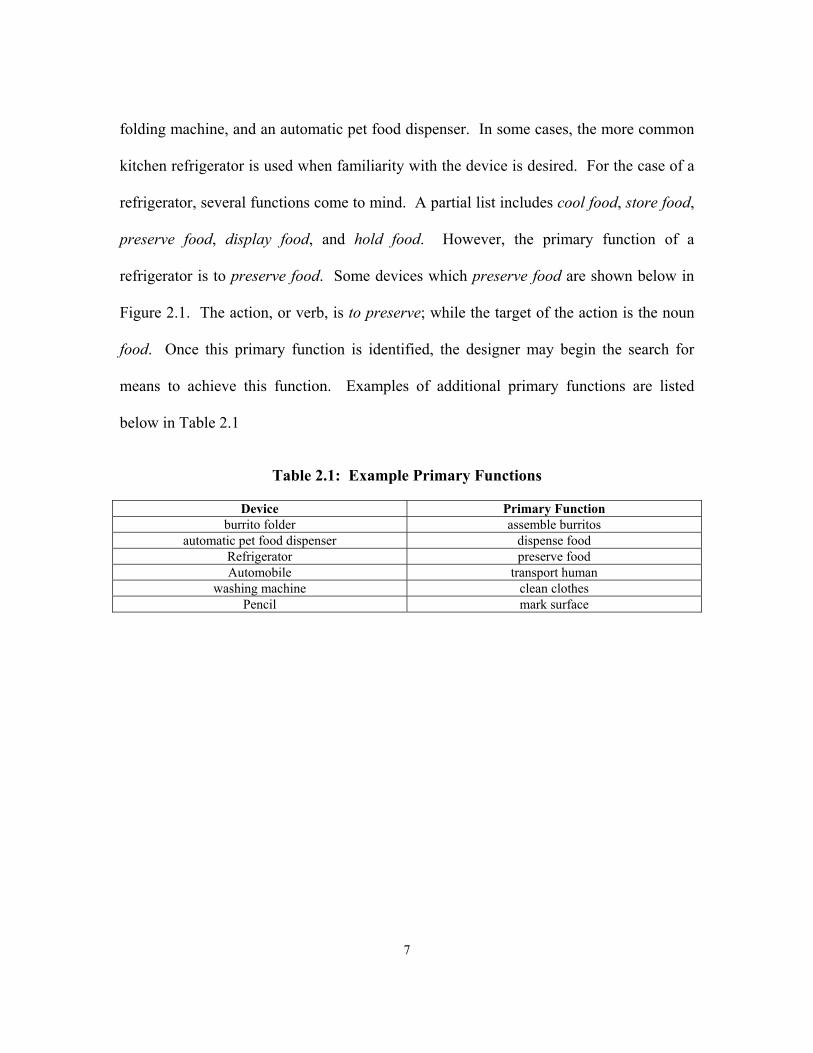
means to achieve this function. Examples of additional primary functions are listed
below in Table 2.1
Table 2.1: Example Primary Functions
Device Primary Function burrito folder assemble burritos
automatic pet food dispenser dispense food Refrigerator preserve food Automobile transport human
washing machine clean clothes Pencil mark surface
8
refrigerator: icebox:
http://www.kenmore.com/ http://www.museum.siu.edu/
can: dehydrator:
http://www.samsclub.com/ http://www.bimart.com/
Figure 2.1: Some Artifacts Which Preserve Food
The top-level function should be defined in general terms to prevent influencing
the design solution or restricting the region of design space considered (Ulrich and
Eppinger, 1995; Dym and Little, 2000; Suh, 2001). Working from a function defined
with non-general terms could place a restriction on the design process and possibly rule
out promising search regions. In the refrigerator example above, if the primary function
were stated as cool food rather than preserve food, other possible methods for preserving
foods, such as the can, and the dehydrator shown in Figure 2.1, would not be identified as
possible solutions. At present, there does not appear to be a systematic way to develop
9
the function in a general way (Maier and Fadel, 2002). At best, the rule of thumb to
“keep it general” (Dym and Little, 2000) provides a guide but no measure to evaluate
success.
Function Decomposition
Once a high level primary function is identified, it may be decomposed into
simpler sub-functions. It is generally agreed that decomposition of a complicated
function is a good practice (Ulrich and Eppinger, 1995; Dym and Little, 2000; Pahl and
Beitz, 1996). Systematic decomposition methods provide some assistance in doing this.
Examples of such methods include function listing (Dym and Little, 2000; Otto and
Wood, 2001), black box (Ulrich and Eppinger, 1995; Dym and Little, 2000; Suh, 2001;
Hyman, 2003), axiomatic design (Suh, 2001), function-means tree (Dym and Little,
2000), reverse engineering (Dym and Little, 2000; Otto and Wood, 2001), and
benchmarking (Dym and Little, 2000; Otto and Wood, 2001). A more detailed
discussion of these methods follows below.
Sub-functions either support the higher-level function directly or deal with the
byproducts of the means to achieve the higher-level function (Dym and Little, 2000; Pahl
and Beitz, 1996). In the refrigerator example above, the higher-level function of preserve
food is supported by the functions cool food and hold food. A byproduct of the standard
kitchen refrigerator is waste heat, produced by the compressor motor. The compressor is
a means employed to cool the food. A sub-function dealing with this byproduct could be
dissipate heat. In contrast, an ice box would not require a sub-function to dissipate heat,
because it does not generate heat while in operation.
10
In some cases, the order in which sub-functions occur and the relationships
between them is important to the higher-level function (Ulrich and Eppinger, 1995; Pahl
and Beitz, 1996). In an example morphological chart used in a user study, and described
in greater detail in Chapter 3, an automatic burrito folding machine has functions which
must occur in a specific order. The device must fold the burrito and then later dispense
the burrito. If the order of these two functions is not respected in the design, the device
will not function properly.
Further, there may not be just one single result for the decomposition of a
particular function (Kurfman et al., 2000; Ulrich and Eppinger, 1995). The
decomposition process requires decisions and evaluations that will rely on the personal
experience of the designer. The anticipation of byproducts to include influences the sub-
functions included. The tools used may also impact the functional decomposition
produced. Starting with a different decomposition may result in a different integrated
conceptual design solution. The following are existing methods for decomposing
functions.
Function Listing
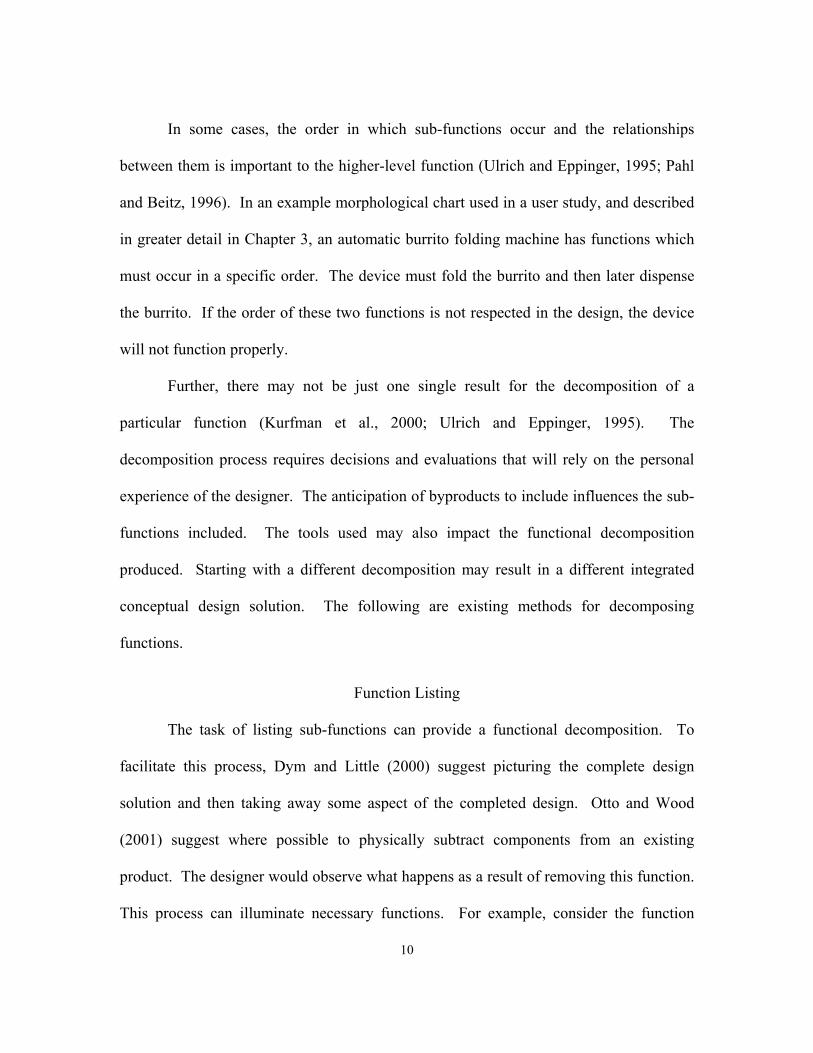
The task of listing sub-functions can provide a functional decomposition. To
facilitate this process, Dym and Little (2000) suggest picturing the complete design
solution and then taking away some aspect of the completed design. Otto and Wood
(2001) suggest where possible to physically subtract components from an existing
product. The designer would observe what happens as a result of removing this function.
This process can illuminate necessary functions. For example, consider the function
11
prepare burrito, which can be satisfied by a burrito folding machine. If the machine is
unable to fold a tortilla, it will be unable to prepare a burrito. A necessary sub-function
of prepare burrito is fold tortilla. A partial function listing for a burrito folding device is
shown below in Figure 2.2. In general, listing functions can be difficult because there is
no representation of how the sub-functions relate to each other. Otto and Wood (2001)
propose constructing a function tree, which will be discussed below, with the functions
observed in this process. This adds more structure to the list of functions.
• fold tortilla • dispense filling • dispense burrito • collect raw materials • …
Figure 2.2: Partial Function Listing for a Burrito Folder
Black Box
A common decomposition tool is to create a “black box” model of the system
(Ulrich and Eppinger, 1995; Dym and Little, 2000; Suh, 2001; Hyman, 2003). First, the
designer pictures the function as a black box with inputs and outputs. The term “black
box” is used because at this stage, no attempt is made to describe what is inside the
system (Ulrich and Eppinger, 1995; Dym and Little, 2000; Suh, 2001; Hyman, 2003). By
directly addressing the inputs and outputs, this method closely matches the definition of
function outlined above. The inputs and outputs to the system consist of material,
12
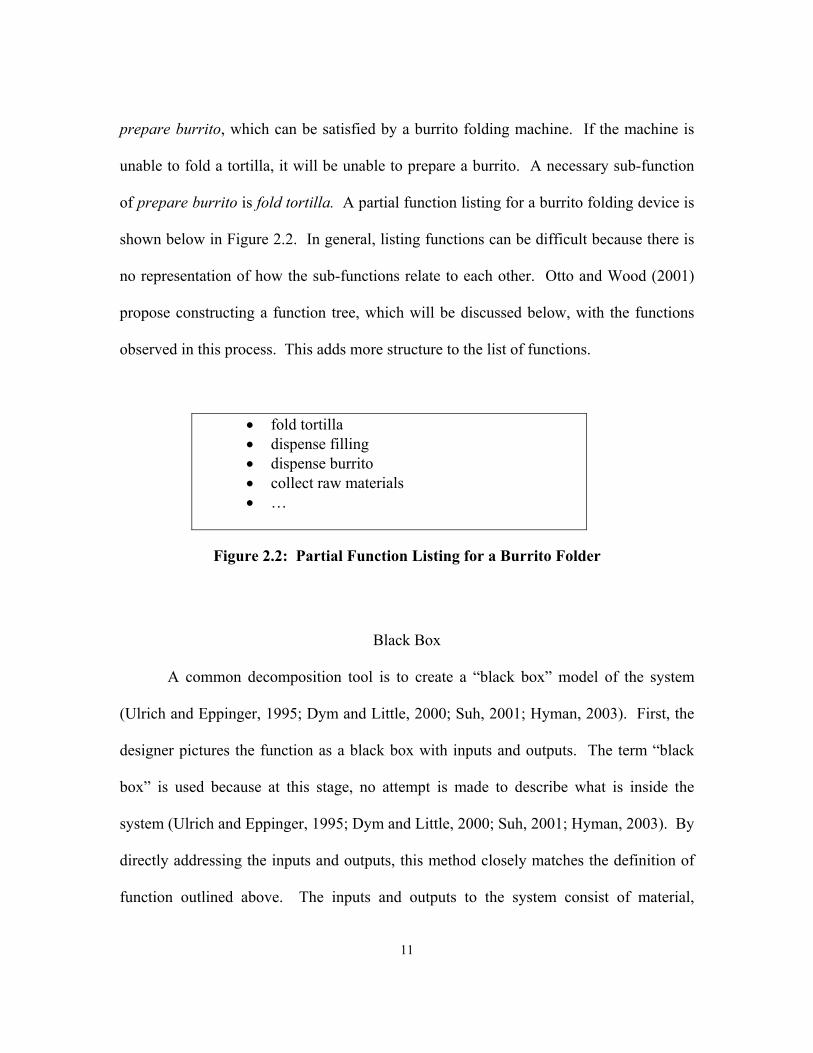
energy, and signals. Convention is to use a heavy line for material, a light line for energy
and a dashed line for signal as illustrated by the inputs to the black box in Figure 2.3.
Dym and Little (2000) suggest that all inputs and outputs must be considered. This
includes undesired outputs, such as byproducts or waste.
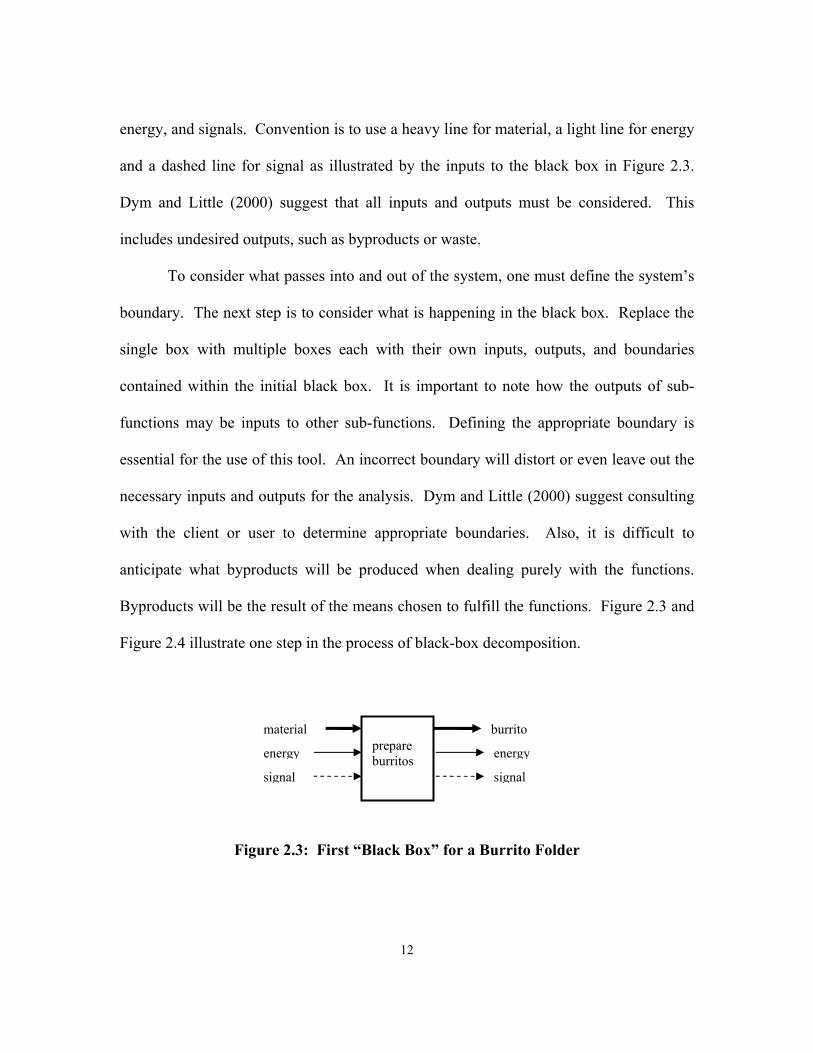
To consider what passes into and out of the system, one must define the system’s
boundary. The next step is to consider what is happening in the black box. Replace the
single box with multiple boxes each with their own inputs, outputs, and boundaries
contained within the initial black box. It is important to note how the outputs of sub-
functions may be inputs to other sub-functions. Defining the appropriate boundary is
essential for the use of this tool. An incorrect boundary will distort or even leave out the
necessary inputs and outputs for the analysis. Dym and Little (2000) suggest consulting
with the client or user to determine appropriate boundaries. Also, it is difficult to
anticipate what byproducts will be produced when dealing purely with the functions.
Byproducts will be the result of the means chosen to fulfill the functions. Figure 2.3 and
Figure 2.4 illustrate one step in the process of black-box decomposition.
Figure 2.3: First “Black Box” for a Burrito Folder
prepare burritos
material
energy
burrito
signal
energy
signal
13
Figure 2.4: “Black-box” Components Identified
One possible way to capture information about byproducts is to consider what
each means affords the system (Maier and Fadel, 2001). Byproducts are any negative, or
undesirable affordances provided by a means. It is possible that byproducts can be
compensated by the affordances of other means already in the system. If none exist to
handle the byproduct, then another sub-function must be added specifically to address
this byproduct. In contrast, Weber and Condoor suggest that designers should defer
handling byproducts until later in the analysis and design process stating that it is
sufficient to analyze only those inputs and outputs that are independent of the design
solution (Weber and Condoor, 1999). This permits leaving out byproducts that are the
result of a particular means.
Axiomatic Design
Axiomatic Design (Suh, 2001) provides another tool for decomposition. Suh’s
process captures both the functions and the means that can perform them. Again, one
starts with a primary function in general terms. This primary function is set at the top of
a tree that will grow to contain sub-functions. Next, one defines a primary means to
obtain this function. The primary means is set at the top of a second tree. The
receive materials
burrito energy signal
fold burrito
dispense burrito
material energy signal
14
decomposition process in axiomatic design is described as a “zig-zag” process where
attention switches back and forth between the two trees. After a level in the function tree
is defined, the corresponding level in the means tree is defined. Next, return to the
function tree and decompose further any sub-functions that require it. Suh states that
decomposition should continue “until the design is completed so that it can be
implemented.” For each of these functions, one must find a corresponding mean. At
each step the preferred means should be chosen when there are multiple options. Suh
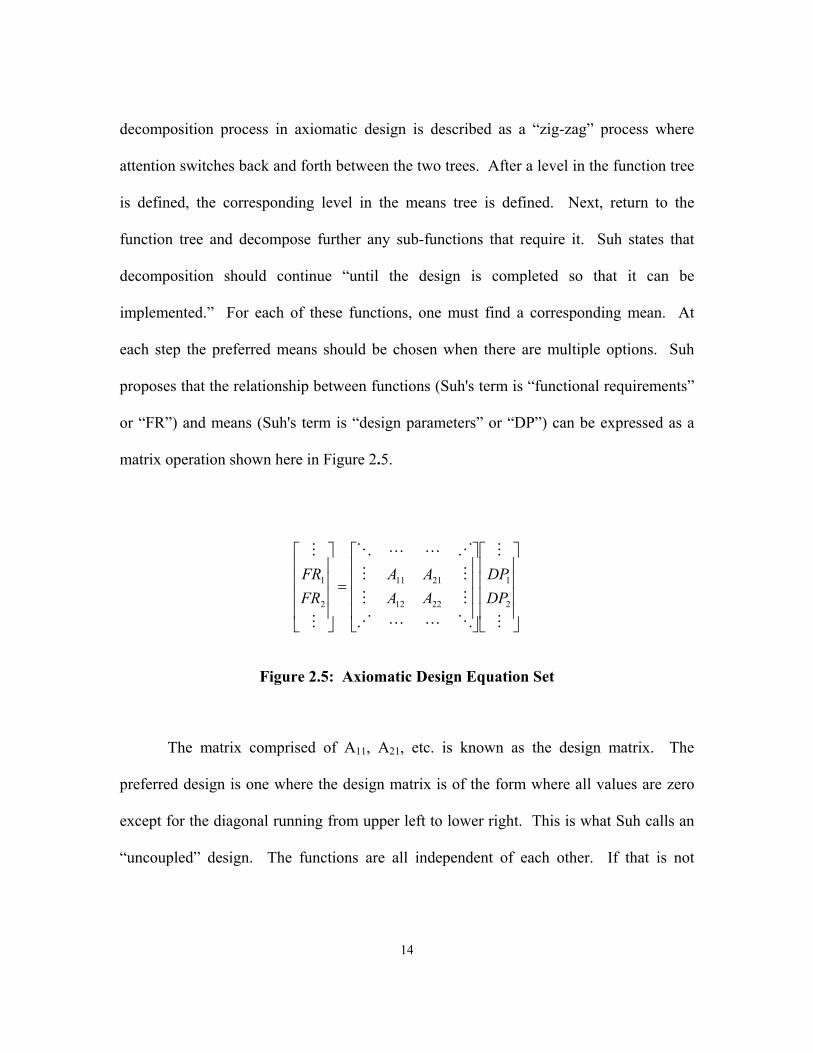
proposes that the relationship between functions (Suh's term is “functional requirements”
or “FR”) and means (Suh's term is “design parameters” or “DP”) can be expressed as a
matrix operation shown here in Figure 2.5.
=
M
M
OLLN
MM
MM
NLLO
M
M
2
1
2212
2111
2
1
DPDP
AAAA
FRFR
Figure 2.5: Axiomatic Design Equation Set
The matrix comprised of A11, A21, etc. is known as the design matrix. The
preferred design is one where the design matrix is of the form where all values are zero
except for the diagonal running from upper left to lower right. This is what Suh calls an
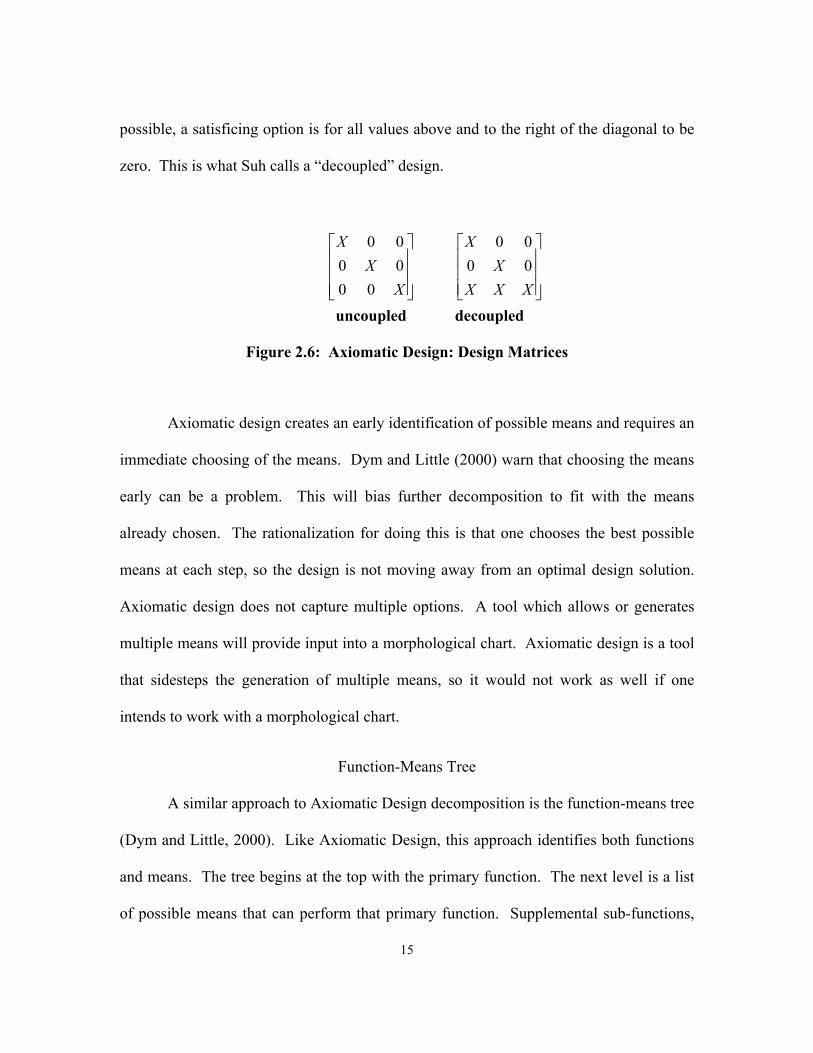
“uncoupled” design. The functions are all independent of each other. If that is not
15
possible, a satisficing option is for all values above and to the right of the diagonal to be
zero. This is what Suh calls a “decoupled” design.
XX
X
000000
XXXX
X0000
uncoupled decoupled
Figure 2.6: Axiomatic Design: Design Matrices
Axiomatic design creates an early identification of possible means and requires an
immediate choosing of the means. Dym and Little (2000) warn that choosing the means
early can be a problem. This will bias further decomposition to fit with the means
already chosen. The rationalization for doing this is that one chooses the best possible
means at each step, so the design is not moving away from an optimal design solution.
Axiomatic design does not capture multiple options. A tool which allows or generates
multiple means will provide input into a morphological chart. Axiomatic design is a tool
that sidesteps the generation of multiple means, so it would not work as well if one
intends to work with a morphological chart.
Function-Means Tree
A similar approach to Axiomatic Design decomposition is the function-means tree
(Dym and Little, 2000). Like Axiomatic Design, this approach identifies both functions
and means. The tree begins at the top with the primary function. The next level is a list
of possible means that can perform that primary function. Supplemental sub-functions,
16
both to achieve the function and to address and mitigate any byproducts of the means, are
listed under each means. Means are listed under each new sub-function. The process
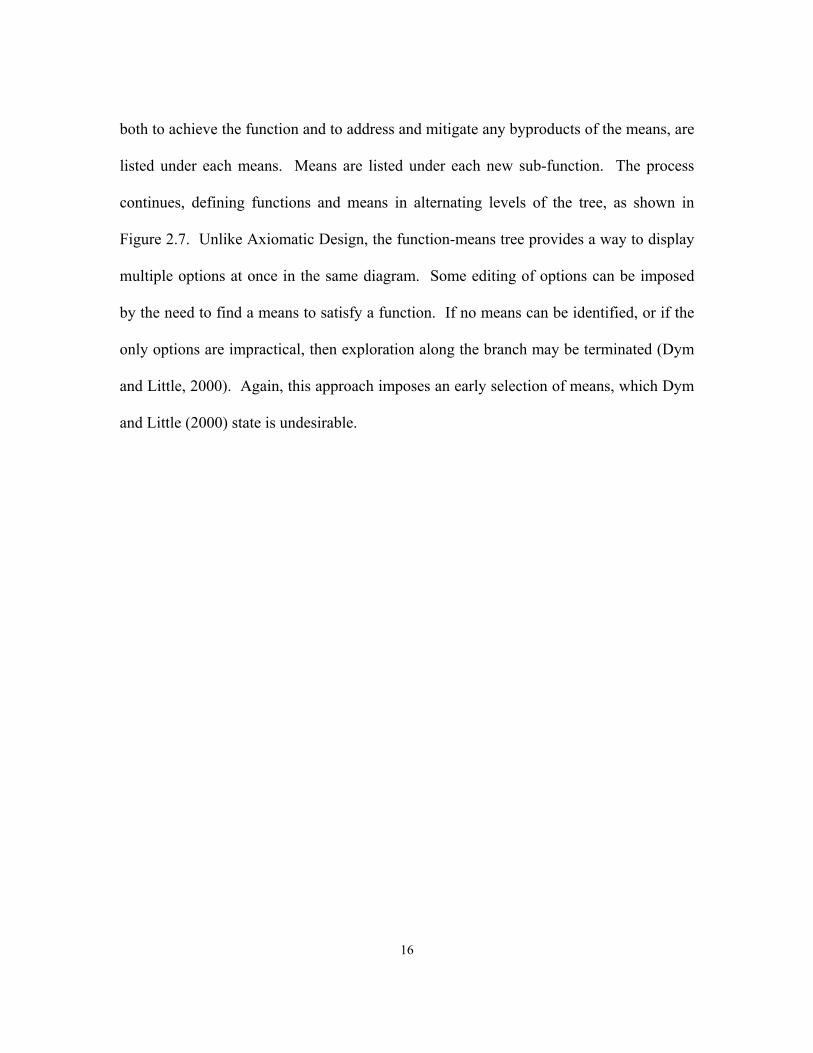
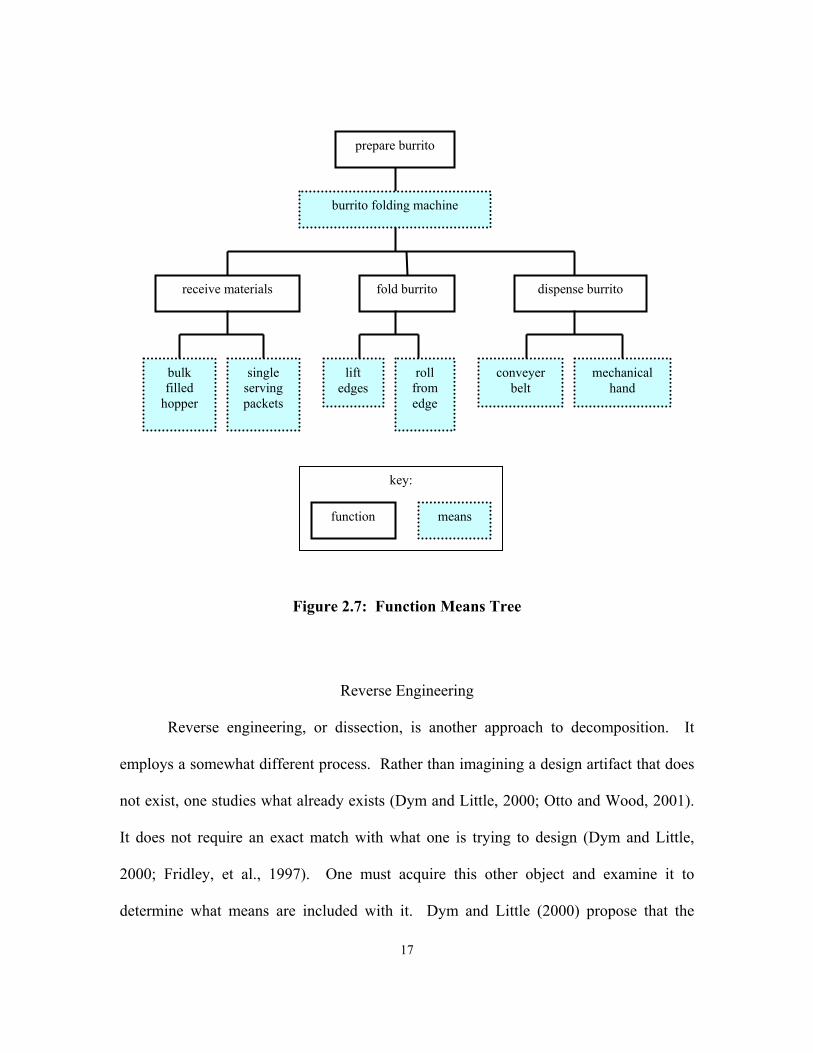
continues, defining functions and means in alternating levels of the tree, as shown in
Figure 2.7. Unlike Axiomatic Design, the function-means tree provides a way to display
multiple options at once in the same diagram. Some editing of options can be imposed
by the need to find a means to satisfy a function. If no means can be identified, or if the
only options are impractical, then exploration along the branch may be terminated (Dym
and Little, 2000). Again, this approach imposes an early selection of means, which Dym
and Little (2000) state is undesirable.
17
Figure 2.7: Function Means Tree
Reverse Engineering
Reverse engineering, or dissection, is another approach to decomposition. It
employs a somewhat different process. Rather than imagining a design artifact that does
not exist, one studies what already exists (Dym and Little, 2000; Otto and Wood, 2001).
It does not require an exact match with what one is trying to design (Dym and Little,
2000; Fridley, et al., 1997). One must acquire this other object and examine it to
determine what means are included with it. Dym and Little (2000) propose that the
prepare burrito
burrito folding machine
receive materials fold burrito dispense burrito
bulk filled
hopper
single serving packets
lift edges
roll from edge
conveyer belt
mechanical hand
key:
function means
18
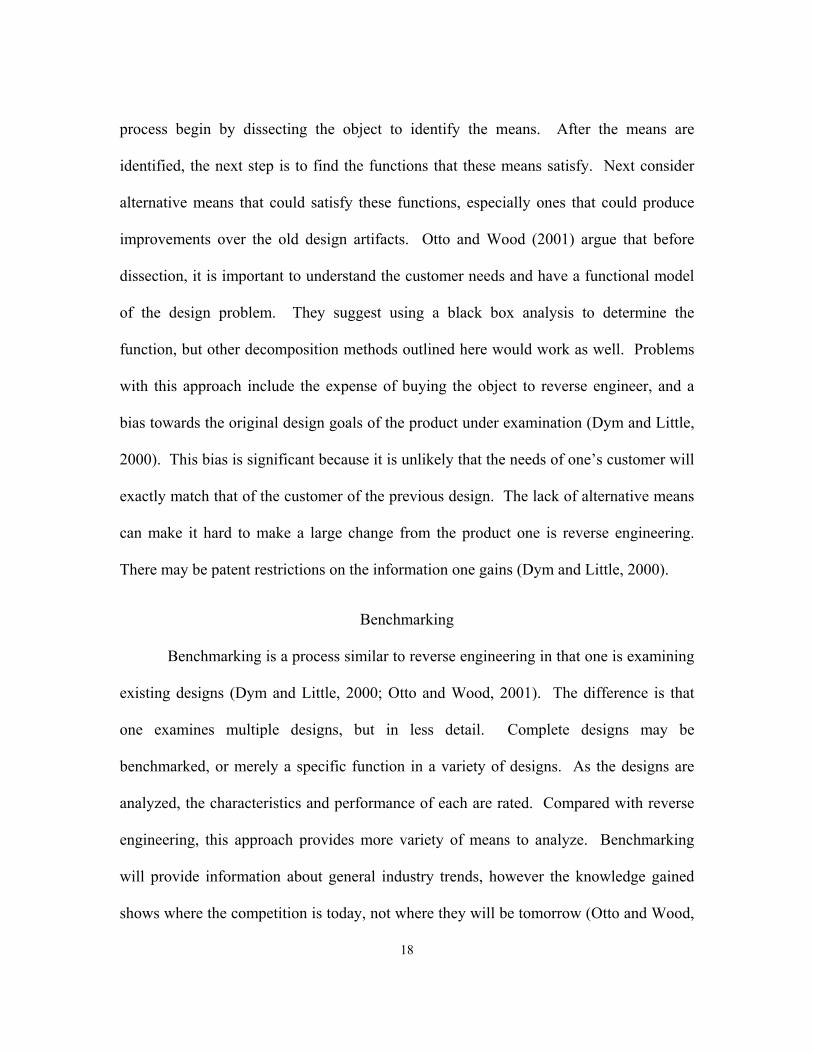
process begin by dissecting the object to identify the means. After the means are
identified, the next step is to find the functions that these means satisfy. Next consider
alternative means that could satisfy these functions, especially ones that could produce
improvements over the old design artifacts. Otto and Wood (2001) argue that before
dissection, it is important to understand the customer needs and have a functional model
of the design problem. They suggest using a black box analysis to determine the
function, but other decomposition methods outlined here would work as well. Problems
with this approach include the expense of buying the object to reverse engineer, and a
bias towards the original design goals of the product under examination (Dym and Little,
2000). This bias is significant because it is unlikely that the needs of one’s customer will
exactly match that of the customer of the previous design. The lack of alternative means
can make it hard to make a large change from the product one is reverse engineering.
There may be patent restrictions on the information one gains (Dym and Little, 2000).
Benchmarking
Benchmarking is a process similar to reverse engineering in that one is examining
existing designs (Dym and Little, 2000; Otto and Wood, 2001). The difference is that
one examines multiple designs, but in less detail. Complete designs may be
benchmarked, or merely a specific function in a variety of designs. As the designs are
analyzed, the characteristics and performance of each are rated. Compared with reverse
engineering, this approach provides more variety of means to analyze. Benchmarking
will provide information about general industry trends, however the knowledge gained
shows where the competition is today, not where they will be tomorrow (Otto and Wood,

19
2001). Benchmarking shares the potential pitfall of patent restrictions with reverse
engineering.
Function Decomposition Summary
All of these approaches outlined above and illustrated in Table 2.2 have a
common unresolved problem: How far should the design problem be decomposed? At
present, there are only guidelines and “rules of thumb” to answer this question. Stopping
at too high a level can lead to means that are overly complicated. There may be
fundamental problems in the underlying means that are not brought to light because the
analysis is stopped too soon. Carrying out the analysis too far is a waste of time and
effort. For any situation there will be a point where the returns from additional work are
not justified by the effort necessary to achieve them. Ulrich and Eppinger (1995) propose
that generating three to ten sub-functions is sufficient. Suh (2001) states that
decomposition should continue “until the design is completed so that it can be
implemented.” The decomposition should be done until the point where the means are
specific enough to permit an analysis. This works for axiomatic design and could also
work for a function-means tree, where the means are identified as part of the functional
decomposition.
20
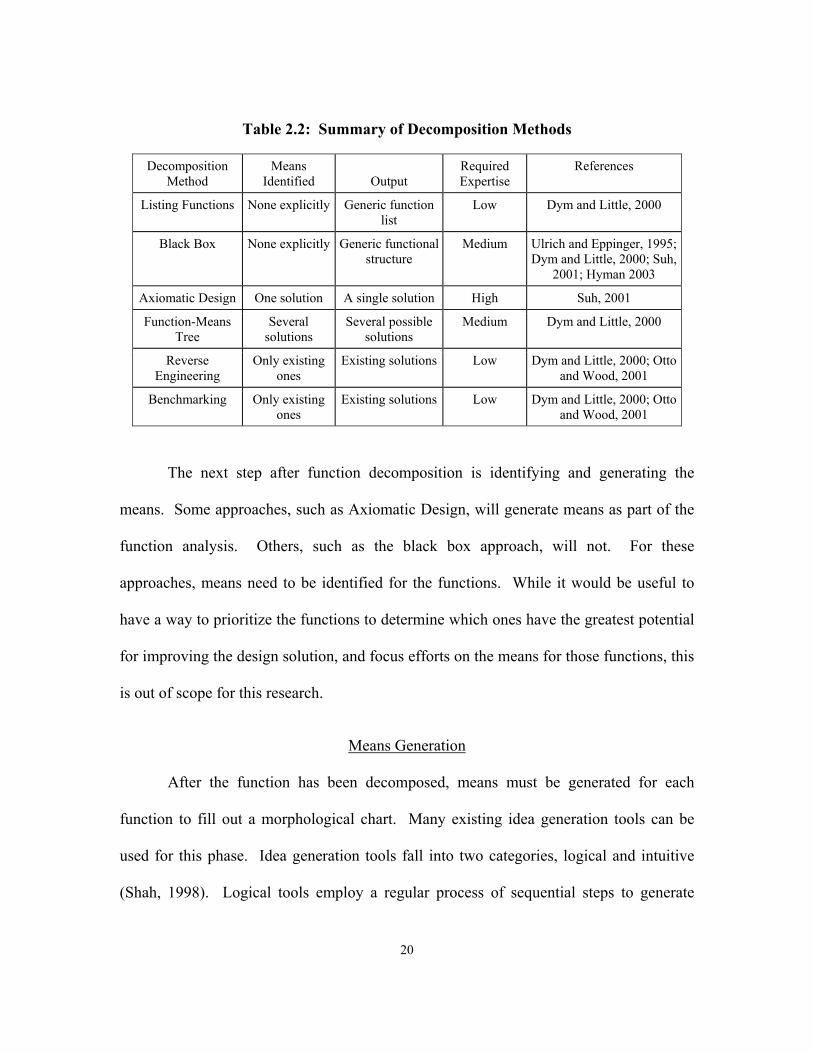
Table 2.2: Summary of Decomposition Methods
Decomposition Method
Means Identified Output
Required Expertise
References
Listing Functions None explicitly Generic function list
Low Dym and Little, 2000
Black Box None explicitly Generic functional structure
Medium Ulrich and Eppinger, 1995; Dym and Little, 2000; Suh,
2001; Hyman 2003
Axiomatic Design One solution A single solution High Suh, 2001
Function-Means Tree
Several solutions
Several possible solutions
Medium Dym and Little, 2000
Reverse Engineering
Only existing ones
Existing solutions Low Dym and Little, 2000; Otto and Wood, 2001
Benchmarking Only existing ones
Existing solutions Low Dym and Little, 2000; Otto and Wood, 2001
The next step after function decomposition is identifying and generating the
means. Some approaches, such as Axiomatic Design, will generate means as part of the
function analysis. Others, such as the black box approach, will not. For these
approaches, means need to be identified for the functions. While it would be useful to
have a way to prioritize the functions to determine which ones have the greatest potential
for improving the design solution, and focus efforts on the means for those functions, this
is out of scope for this research.
Means Generation
After the function has been decomposed, means must be generated for each
function to fill out a morphological chart. Many existing idea generation tools can be
used for this phase. Idea generation tools fall into two categories, logical and intuitive
(Shah, 1998). Logical tools employ a regular process of sequential steps to generate
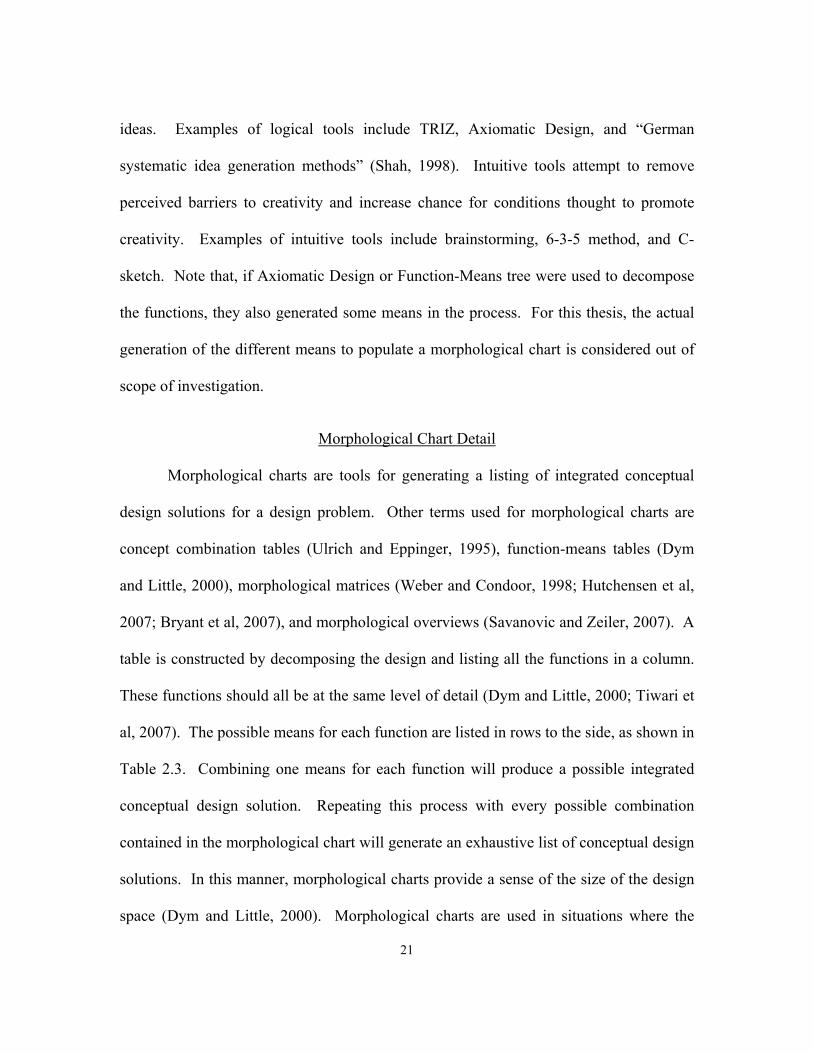
21
ideas. Examples of logical tools include TRIZ, Axiomatic Design, and “German
systematic idea generation methods” (Shah, 1998). Intuitive tools attempt to remove
perceived barriers to creativity and increase chance for conditions thought to promote
creativity. Examples of intuitive tools include brainstorming, 6-3-5 method, and C-
sketch. Note that, if Axiomatic Design or Function-Means tree were used to decompose
the functions, they also generated some means in the process. For this thesis, the actual
generation of the different means to populate a morphological chart is considered out of
scope of investigation.
Morphological Chart Detail
Morphological charts are tools for generating a listing of integrated conceptual
design solutions for a design problem. Other terms used for morphological charts are
concept combination tables (Ulrich and Eppinger, 1995), function-means tables (Dym
and Little, 2000), morphological matrices (Weber and Condoor, 1998; Hutchensen et al,
2007; Bryant et al, 2007), and morphological overviews (Savanovic and Zeiler, 2007). A
table is constructed by decomposing the design and listing all the functions in a column.
These functions should all be at the same level of detail (Dym and Little, 2000; Tiwari et
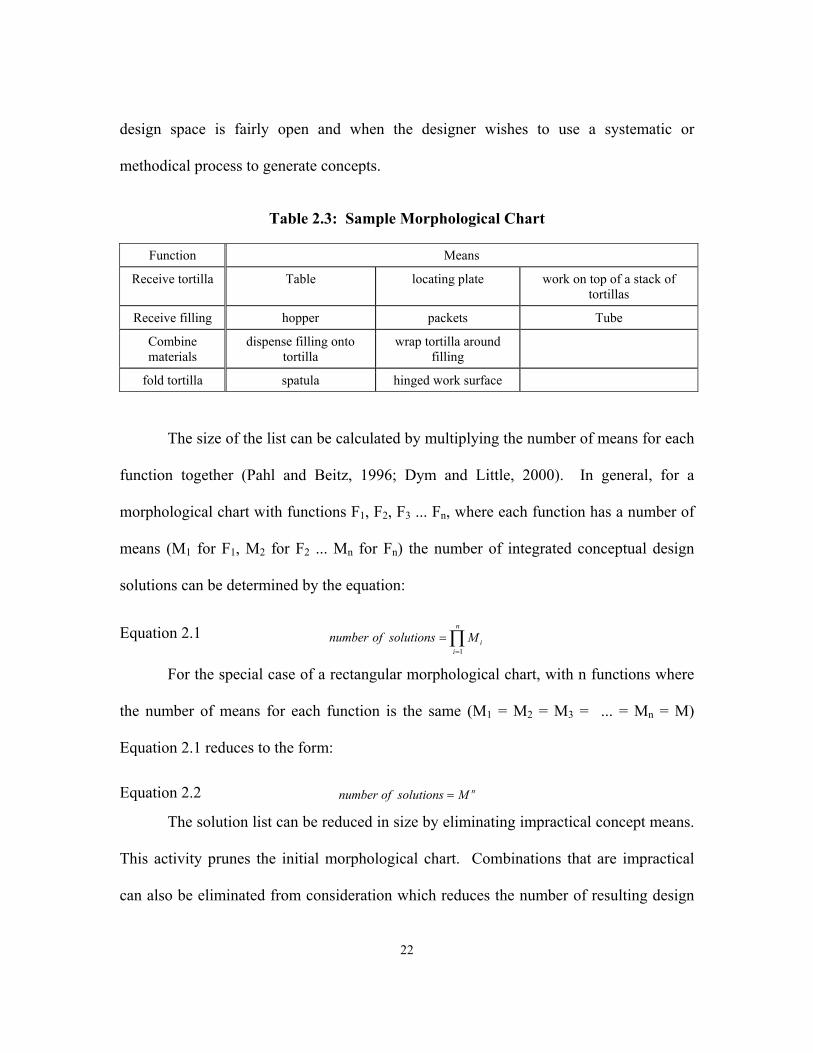
al, 2007). The possible means for each function are listed in rows to the side, as shown in
Table 2.3. Combining one means for each function will produce a possible integrated
conceptual design solution. Repeating this process with every possible combination
contained in the morphological chart will generate an exhaustive list of conceptual design
solutions. In this manner, morphological charts provide a sense of the size of the design
space (Dym and Little, 2000). Morphological charts are used in situations where the
22
design space is fairly open and when the designer wishes to use a systematic or
methodical process to generate concepts.
Table 2.3: Sample Morphological Chart
Function Means
Receive tortilla Table locating plate work on top of a stack of tortillas
Receive filling hopper packets Tube
Combine materials
dispense filling onto tortilla
wrap tortilla around filling
fold tortilla spatula hinged work surface
The size of the list can be calculated by multiplying the number of means for each
function together (Pahl and Beitz, 1996; Dym and Little, 2000). In general, for a
morphological chart with functions F1, F2, F3 ... Fn, where each function has a number of
means (M1 for F1, M2 for F2 ... Mn for Fn) the number of integrated conceptual design
solutions can be determined by the equation:
Equation 2.1 ∏=
=n
iiMsolutionsofnumber
1
For the special case of a rectangular morphological chart, with n functions where
the number of means for each function is the same (M1 = M2 = M3 = ... = Mn = M)
Equation 2.1 reduces to the form:
Equation 2.2 nMsolutionsofnumber =
The solution list can be reduced in size by eliminating impractical concept means.
This activity prunes the initial morphological chart. Combinations that are impractical
can also be eliminated from consideration which reduces the number of resulting design
23
solutions (Ulrich and Eppinger, 1995; Dym and Little, 2000; Pahl and Beitz, 1996;
Aygün, 2000). Impractical combinations are those with interactions that imperil the rest
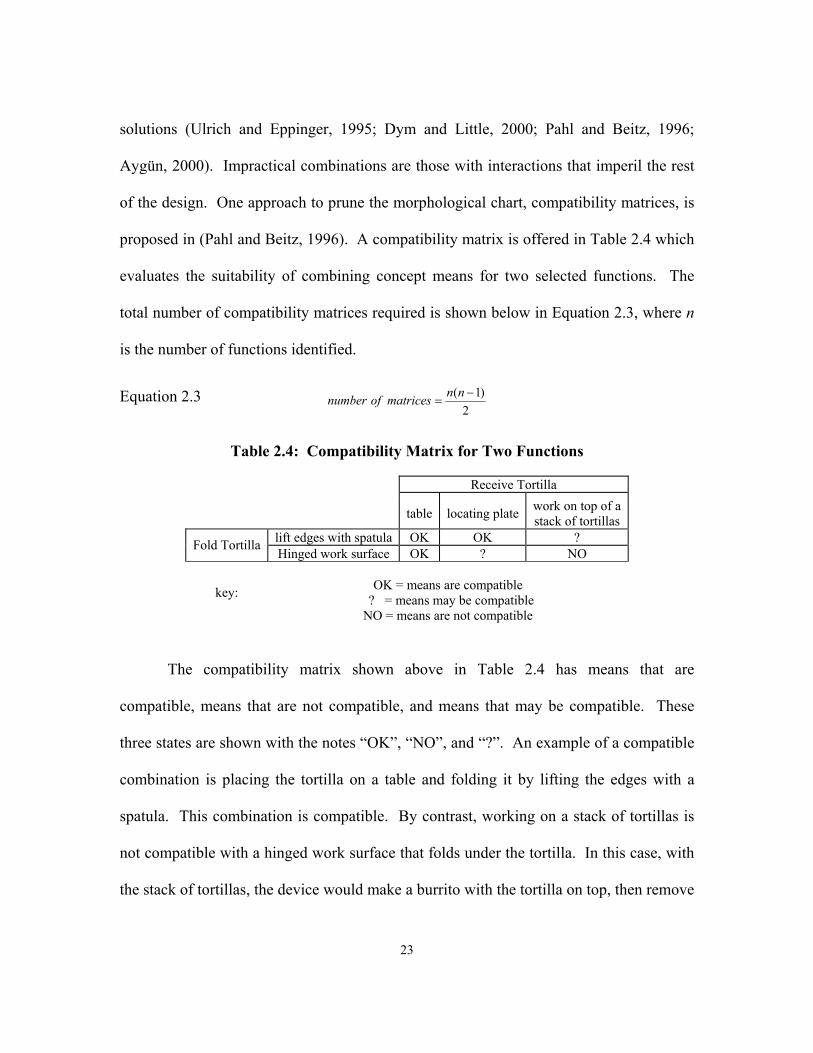
of the design. One approach to prune the morphological chart, compatibility matrices, is
proposed in (Pahl and Beitz, 1996). A compatibility matrix is offered in Table 2.4 which
evaluates the suitability of combining concept means for two selected functions. The
total number of compatibility matrices required is shown below in Equation 2.3, where n
is the number of functions identified.
Equation 2.3 2
)1( −=
nnmatricesofnumber
Table 2.4: Compatibility Matrix for Two Functions
Receive Tortilla
table locating plate work on top of a stack of tortillas
lift edges with spatula OK OK ? Fold Tortilla Hinged work surface OK ? NO
key:
OK = means are compatible
? = means may be compatible NO = means are not compatible
The compatibility matrix shown above in Table 2.4 has means that are
compatible, means that are not compatible, and means that may be compatible. These
three states are shown with the notes “OK”, “NO”, and “?”. An example of a compatible
combination is placing the tortilla on a table and folding it by lifting the edges with a
spatula. This combination is compatible. By contrast, working on a stack of tortillas is
not compatible with a hinged work surface that folds under the tortilla. In this case, with
the stack of tortillas, the device would make a burrito with the tortilla on top, then remove
24
the burrito and work on the next tortilla in the stack. Using a hinged work surface under
the tortillas would not work because the hinged surface needs to be in direct contact with
the tortilla you want to fold. If there is a whole stack of tortillas on top of the hinged
work surface, the device will not function properly.
Advantages/Disadvantages
Based on the reviewed limited literature discussing morphological charts, some
advantages of morphological charts include their ability to show unexpected pairings of
features (Ulrich and Eppinger, 1995). In this way, they can lead to the creation of new
concepts that may not have otherwise been thought of by the designer (Dym and Little,
2000). Further, they provide a perspective of the overall design space.
Generating all these new options is a disadvantage of morphological charts. With
only a few functions and means, the number of integrated conceptual design solutions can
grow quite extensive (Dym and Little, 2000). Some of the combinations generated will
not be good solutions to the design problem (Dym and Little, 2000). Morphological
charts provide a good method for generating a list of integrated conceptual design
solutions, but do not have a useful way to choose the promising solutions for further
evaluation.
Bohm, et al. (2005) discuss a tool that can automatically fill a morphological chart
with means for each function, once properly identified. The procedure requires a certain
formatting of the function requires a functional decomposition. The information is drawn
from a repository of existing solutions. In this experiment, the morphological charts were
generated manually by the author.
25
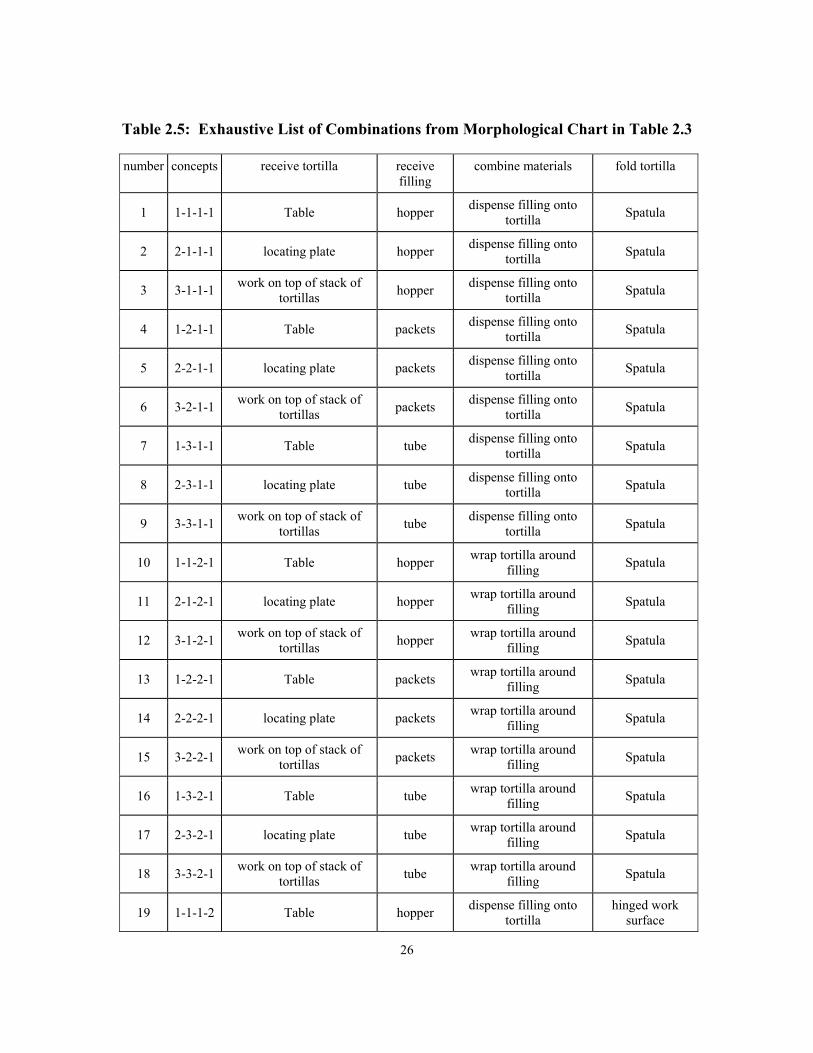
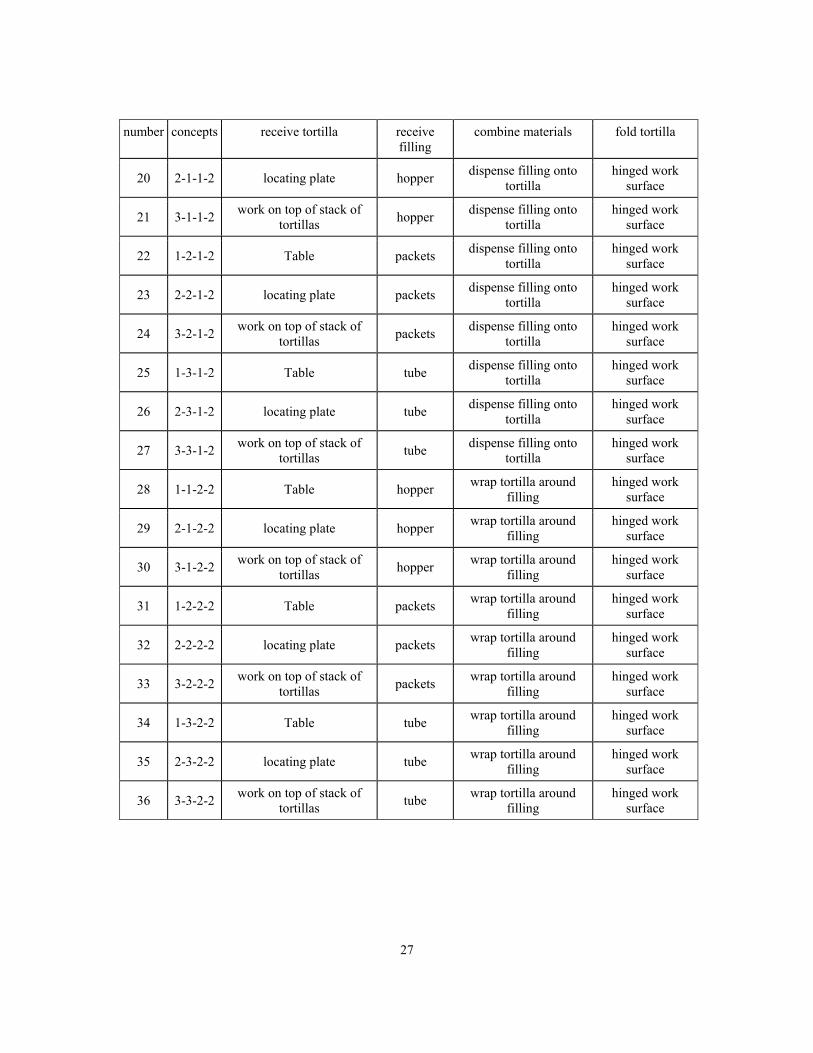
To continue the example of Table 2.3, there are three means for the function
“receive tortilla”, three means for the function “receive filling”, two means for the
function “combine filling” and two means for the function “fold tortilla”. As shown by
Equation 2.1, the total number of possible combination is the product of 3, 3, 2, and 2,
which equals 36. This agrees with the number of integrated conceptual design solutions
listed in Table 2.5.
26
Table 2.5: Exhaustive List of Combinations from Morphological Chart in Table 2.3
number concepts receive tortilla receive filling
combine materials fold tortilla
1 1-1-1-1 Table hopper dispense filling onto tortilla Spatula
2 2-1-1-1 locating plate hopper dispense filling onto tortilla Spatula
3 3-1-1-1 work on top of stack of tortillas hopper dispense filling onto
tortilla Spatula
4 1-2-1-1 Table packets dispense filling onto tortilla Spatula
5 2-2-1-1 locating plate packets dispense filling onto tortilla Spatula
6 3-2-1-1 work on top of stack of tortillas packets dispense filling onto
tortilla Spatula
7 1-3-1-1 Table tube dispense filling onto tortilla Spatula
8 2-3-1-1 locating plate tube dispense filling onto tortilla Spatula
9 3-3-1-1 work on top of stack of tortillas tube dispense filling onto
tortilla Spatula
10 1-1-2-1 Table hopper wrap tortilla around filling Spatula
11 2-1-2-1 locating plate hopper wrap tortilla around filling Spatula
12 3-1-2-1 work on top of stack of tortillas hopper wrap tortilla around
filling Spatula
13 1-2-2-1 Table packets wrap tortilla around filling Spatula
14 2-2-2-1 locating plate packets wrap tortilla around filling Spatula
15 3-2-2-1 work on top of stack of tortillas packets wrap tortilla around
filling Spatula
16 1-3-2-1 Table tube wrap tortilla around filling Spatula
17 2-3-2-1 locating plate tube wrap tortilla around filling Spatula
18 3-3-2-1 work on top of stack of tortillas tube wrap tortilla around
filling Spatula
19 1-1-1-2 Table hopper dispense filling onto tortilla
hinged work surface
27
number concepts receive tortilla receive filling
combine materials fold tortilla
20 2-1-1-2 locating plate hopper dispense filling onto tortilla
hinged work surface
21 3-1-1-2 work on top of stack of tortillas hopper dispense filling onto
tortilla hinged work
surface
22 1-2-1-2 Table packets dispense filling onto tortilla
hinged work surface
23 2-2-1-2 locating plate packets dispense filling onto tortilla
hinged work surface
24 3-2-1-2 work on top of stack of tortillas packets dispense filling onto
tortilla hinged work
surface
25 1-3-1-2 Table tube dispense filling onto tortilla
hinged work surface
26 2-3-1-2 locating plate tube dispense filling onto tortilla
hinged work surface
27 3-3-1-2 work on top of stack of tortillas tube dispense filling onto
tortilla hinged work
surface
28 1-1-2-2 Table hopper wrap tortilla around filling
hinged work surface
29 2-1-2-2 locating plate hopper wrap tortilla around filling
hinged work surface
30 3-1-2-2 work on top of stack of tortillas hopper wrap tortilla around
filling hinged work
surface
31 1-2-2-2 Table packets wrap tortilla around filling
hinged work surface
32 2-2-2-2 locating plate packets wrap tortilla around filling
hinged work surface
33 3-2-2-2 work on top of stack of tortillas packets wrap tortilla around
filling hinged work
surface
34 1-3-2-2 Table tube wrap tortilla around filling
hinged work surface
35 2-3-2-2 locating plate tube wrap tortilla around filling
hinged work surface
36 3-3-2-2 work on top of stack of tortillas tube wrap tortilla around
filling hinged work
surface
28
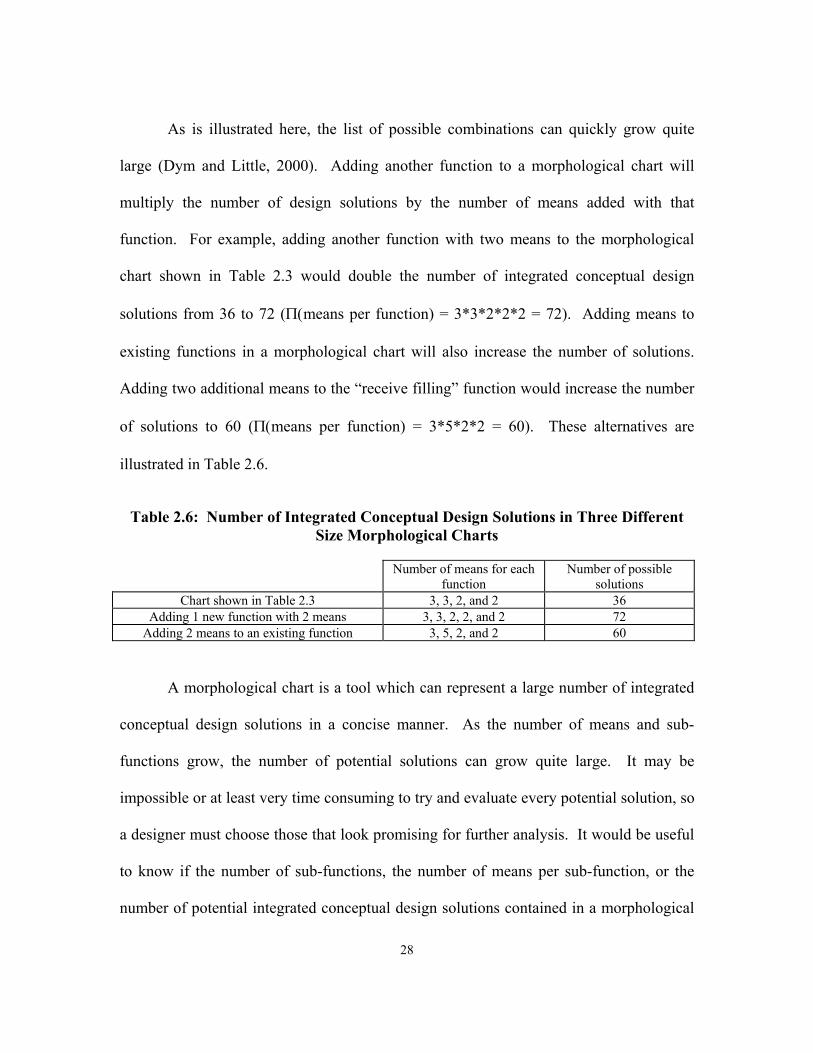
As is illustrated here, the list of possible combinations can quickly grow quite
large (Dym and Little, 2000). Adding another function to a morphological chart will
multiply the number of design solutions by the number of means added with that
function. For example, adding another function with two means to the morphological
chart shown in Table 2.3 would double the number of integrated conceptual design
solutions from 36 to 72 (Π(means per function) = 3*3*2*2*2 = 72). Adding means to
existing functions in a morphological chart will also increase the number of solutions.
Adding two additional means to the “receive filling” function would increase the number
of solutions to 60 (Π(means per function) = 3*5*2*2 = 60). These alternatives are
illustrated in Table 2.6.
Table 2.6: Number of Integrated Conceptual Design Solutions in Three Different Size Morphological Charts
Number of means for each function
Number of possible solutions
Chart shown in Table 2.3 3, 3, 2, and 2 36 Adding 1 new function with 2 means 3, 3, 2, 2, and 2 72
Adding 2 means to an existing function 3, 5, 2, and 2 60
A morphological chart is a tool which can represent a large number of integrated
conceptual design solutions in a concise manner. As the number of means and sub-
functions grow, the number of potential solutions can grow quite large. It may be
impossible or at least very time consuming to try and evaluate every potential solution, so
a designer must choose those that look promising for further analysis. It would be useful
to know if the number of sub-functions, the number of means per sub-function, or the
number of potential integrated conceptual design solutions contained in a morphological
29
chart has an impact on the ability of a designer to find the promising design solutions
contained in a morphological chart. The experimental studies detailed in subsequent
chapters of this document seek to study these effects.
30
CHAPTER 3
EXPERIMENTAL STUDY WITH TWO MORPHOLOGICAL CHARTS
If one is to use a morphological chart to generate integrated conceptual design
solutions, it would be useful to know if the structure of the morphological chart impacts
how easily one can find promising design solutions contained in the morphological chart.
To develop understanding of this, the author conducted an experiment to determine the
effects of morphological chart shape on the quality of design solutions chosen from the
morphological chart. Two morphological charts were created, one with five functions,
and one with three functions. Both charts contained the same number of means, or sub
solutions. These charts were then used by participants to form different concepts with an
emphasis on identifying high quality concepts. These concepts were then evaluated by a
panel of judges to determine which configuration of morphological charts yielded the
higher quality concepts. The following sections detail this experimental exercise.
Experimental Method
For this study, the author prepared rectangular morphological charts for the
burrito folder design problem discussed above. For the first chart, the design problem
was decomposed into three separate functions. For the second, the problem was
decomposed into five separate functions. The process of generating means for each
function was deliberately fixed such to prepare a certain number of means for each
function, as shown in Table 3.1. The chart with three functions had five means for each
function, and the chart with five functions had three means for each. This produced two
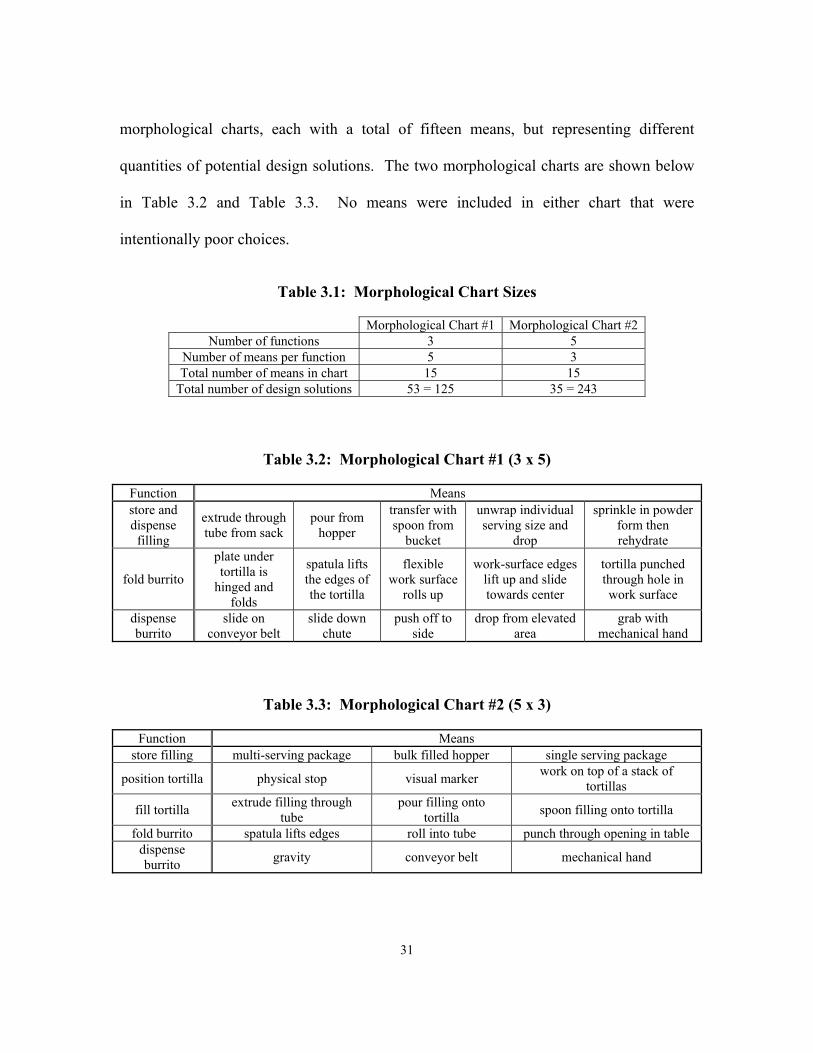
31
morphological charts, each with a total of fifteen means, but representing different
quantities of potential design solutions. The two morphological charts are shown below
in Table 3.2 and Table 3.3. No means were included in either chart that were
intentionally poor choices.
Table 3.1: Morphological Chart Sizes
Morphological Chart #1 Morphological Chart #2 Number of functions 3 5
Number of means per function 5 3 Total number of means in chart 15 15
Total number of design solutions 53 = 125 35 = 243
Table 3.2: Morphological Chart #1 (3 x 5)
Function Means store and dispense filling
extrude through tube from sack
pour from hopper
transfer with spoon from
bucket
unwrap individual serving size and
drop
sprinkle in powder form then rehydrate
fold burrito
plate under tortilla is
hinged and folds
spatula lifts the edges of the tortilla
flexible work surface
rolls up
work-surface edges lift up and slide towards center
tortilla punched through hole in work surface
dispense burrito
slide on conveyor belt
slide down chute
push off to side
drop from elevated area
grab with mechanical hand
Table 3.3: Morphological Chart #2 (5 x 3)
Function Means store filling multi-serving package bulk filled hopper single serving package
position tortilla physical stop visual marker work on top of a stack of tortillas
fill tortilla extrude filling through tube
pour filling onto tortilla spoon filling onto tortilla
fold burrito spatula lifts edges roll into tube punch through opening in table dispense burrito gravity conveyor belt mechanical hand
32
Participants
The participants employed in this experiment possessed a similar educational
background. They were all students enrolled in a required sophomore level mechanical
engineering design and kinematics class at Clemson University. The students had
exposure to morphological charts in the class through both lectures and in class exercises.
However, not all the students had used morphological charts in their semester long design
projects. Some students may have possessed outside experience with morphological
charts. The extent of outside knowledge was not captured in this experiment.
Two different groups participated in this study; students from two different class
sections. The two sections were taught by different instructors. The inclusion of two
sections was done to increase the number of participants. Differences between the groups
were minimized by both being from the same course and both meeting in their usual
classrooms and at the usual class time on the same day. Analysis was done to verify if
the different sections were significant in this research. Participants were randomly
assigned either Morphological Chart #1 or Chart #2. The chart assignments were done
such that the same number of participants worked with each morphological chart in each
class period. In the event that the number of participants was not exactly divisible by the
number of groups, the difference between group sizes did not exceed one. There was
some risk in this method as if a significant number of students elected not to participate
after accepting a chart assignment; it could skew the group sizes. As can be seen below
in Table 3.8, there was some disruption in this manner, but the total number of
participants is nearly equal for the two charts.
33
Design Problem
The design problem chosen for this study was to create a burrito folding device.
This was a project from the same sophomore mechanical engineering course these
participants were taking, but from an earlier semester. The burrito folding device was
chosen to ensure that the design problem was of a similar scope to the project these
participants were currently studying in class, but to have a design problem they were not
likely to have preconceived thoughts about in advance of the experiment. If some
participants knew more about the design problem than others, that would introduce an
additional variable into the study.
The author reviewed several final reports from the burrito folding device class.
These reports included functional decompositions and morphological charts. Although
the author prepared new morphological charts, the review of the old reports was useful.
By reading these reports, effectively, the input of several designers went into the creation
of the morphological charts for this study. The assumption was made that this input
reduced the likelihood that critical functions were left out of the morphological charts.
In this study, transforming from one morphological chart to the other required
changes both to the means and the functions. To reduce the number of functions, one
pair of functions was merged (store filling and fill tortilla were replaced by store and
dispense filling), and a third function was omitted (position tortilla). To add means, the
level of detail was increased. These transformations do not guarantee the exact same
solution set for the two morphological charts. The goal of this work was to study the
effect of morphological chart size on the quality of integrated concepts generated from
34
the chart. The method chosen to change the chart size was to change the number of
functions and the number of means per function. Changing these will change the number
of possible integrated concepts, which presents a different set of solutions to the designer.
Procedure
During the semester, the students had an overview of functional decomposition,
means generation, and morphological charts as part of their regular lectures. On the day
of the study, the author provided a reminder of the details of morphological charts.
The participants were given a packet of information containing a morphological
chart and an answer form. The form contains room for the participant to list eight
integrated conceptual design solutions and rate them against criteria provided by the
author. These criteria are shown in Table 3.4. The participants were instructed to use a
9-3-1 scale in their ratings, as shown in Table 3.5. Participants who used values other
than those provided were not excluded from the results. The nonstandard values were
accepted as they were, and were not mapped to the standard 9-3-1 values. The
participant ratings and criteria weightings were used in a decision matrix to determine a
final score for each solution generated. The participants were randomly assigned either a
chart with three functions, as shown in Table 3.2, or one with five functions, as shown in
Table 3.3.
Table 3.4: Solution Evaluation Criteria
Criteria Weight low cost 9
easy to clean 3 number of parts 1
35
Table 3.5: Solution Evaluation Weights
Level value Good 9 Fair 3 Poor 1
The participants were given instructions about the testing procedure. They were
told how to record and score their chosen integrated conceptual design solutions. After
the introduction, they were allowed 30 minutes to develop and evaluate their design
solutions for the exercise. The participants were explicitly instructed to try and form the
highest quality conceptual combinations that they could. The time limit for the concept
generation phase was fixed by the need to conduct the experiment without exceeding the
time scheduled for the class. To choose the number of concepts required, the author
worked through the concept generation activity and was able to generate and evaluate
eight concepts in less than 30 minutes.
Data Collection
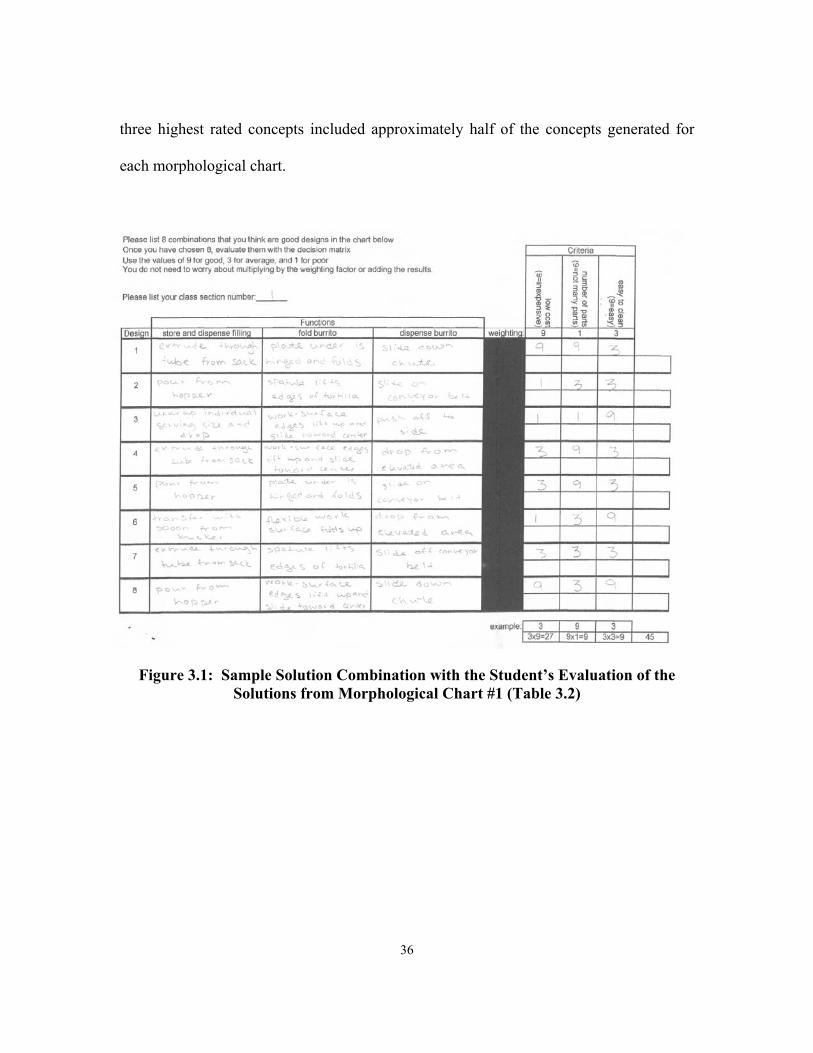
At the end of the exercise, all handouts were collected. A sample datasheet is
shown below in Figure 3.1. The three highest rated design solutions from each
participant were combined into a list of design solutions to be evaluated. In cases where
there was not a clear group of three, such as if a tie existed for third place, the extra
design solutions were added to the compilation. The list was purged of any exact
duplicate solutions. The participants generated integrated conceptual design solutions
covering 29% to 44% of the overall design space, as shown in Table 3.6. This list of the
36
three highest rated concepts included approximately half of the concepts generated for
each morphological chart.
Figure 3.1: Sample Solution Combination with the Student’s Evaluation of the Solutions from Morphological Chart #1 (Table 3.2)
37
Table 3.6: Amount of Design Space Evaluated by Participants
Morphological Chart Table 3.2 (3-function)
Table 3.3 (5-function)
Number of Participants 12 13 Number of possible concept combinations 125 243
quantity 55 70 Number of Unique Concept Combinations Generated by Participants
% of possible concepts 44% 29%
quantity 31 33 % of possible concepts 25% 14%
Number of Unique Concept Combinations in Set of “Top 3”
% of generated concepts 56% 47%
The list was evaluated by a jury of five graduate students in the Clemson
University mechanical engineering department. Due to the size of the list, the design
solutions were distributed among the jury, such that each solution was evaluated by three
different people. The basic assignment pattern for the first ten design solutions to the
evaluation jurists is shown in Table 3.7. This pattern was repeated through the entire list
of design solutions. Using this distribution, each jury member only had to evaluate 60%
of the concept list. The jury members were assigned the same proportion of solutions
from the two different morphological charts. The jury members rated each design
solution against the same criteria as the study participants. The jury members also used
the 9-3-1 scale.
38
Table 3.7: Sample Jury Member Assignments
Jury Members 1 2 3 4 5
Evaluations per concept
Concept 1 X - X - X 3 Concept 2 X - - X X 3 Concept 3 - X X X - 3 Concept 4 - X X - X 3 Concept 5 - X - X X 3 Concept 6 - - X X X 3 Concept 7 X X X - - 3 Concept 8 X X - X - 3 Concept 9 X X - - X 3 Concept 10 X - X X - 3
A final score was assigned to each concept by averaging the three scores provided
by the jury. These scores were used to evaluate integrated conceptual design solutions
generated by each participant. Each participant was assigned the score from the average
of the top three design solutions identified. In the case where there was not a clearly
identified third place, the scores for the group that were in third place were averaged to
create a composite third score. This composite score was averaged with the scores for
first and second place, as shown in Equation 3.1.
Equation 3.1 3
233
21ba solutionsolution
solutionsolutionscore
+++
=
The choice of evaluation criteria and their respective weights influenced the
integrated concepts created by the participants in this study. Participants were required to
score concepts against these criteria rather than pick what they personally felt were the
best concepts. This was necessary to ensure that all participants were working towards
an identical goal. This experiment intended to only study the process of generating
integrated concepts, and not the process of evaluating them. Creating a consistent set of
39
criteria for the participants and judges minimizes the variation between what participants
would identify as the best integrated concepts without these specific criteria.
Data Analysis
In order to involve more participants, two separate class sessions were involved in
this experiment. To determine if this mixing of class sections had an impact on the
analysis, the variation between classes will be examined with the ANOVA statistical tool.
ANOVA can compare the means of two different samples to determine if they are equal
or not. Common practice is to test at a 90% confidence level, or α = (100% - 90%) =
0.10. The ANOVA tool calculates several parameters, but for this analysis, the useful
one is the “p-value”. When the p-value is found to be larger than α, the means of the
analyzed groups are likely the same. When the p-value is less than α, the means are not
the same (Daniel and Terrell, 1995). In these experiments, consideration was given at an
80% confidence level, or α = 0.20. When a p-value is found to be 0.10 or less, there is a
statistically significant relation. When a p-value is greater than 0.10, but less than or
equal to 0.20, there is likely a relation (Wetmore and Summers, 2004).
40
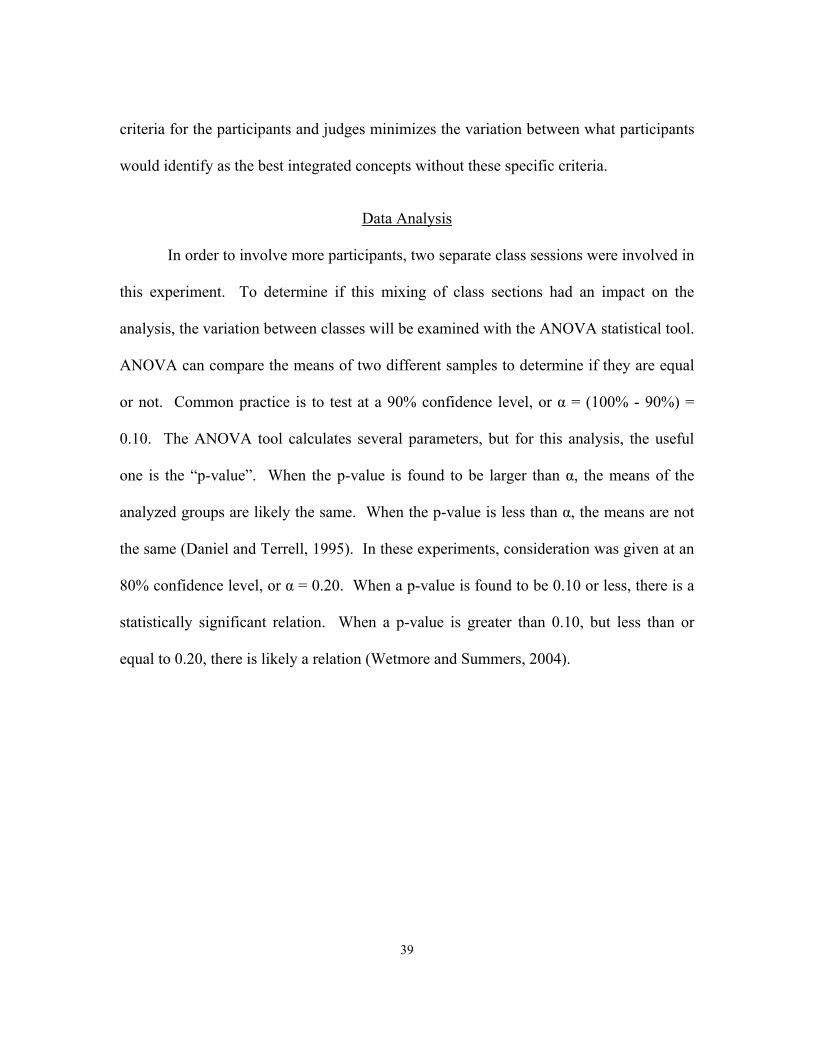
Figure 3.2: Comparison of "5 Function x 3 Means" Morphological Charts Between ME202 Spring 2005 Class Sections (Average Score ±1 Standard Deviation)
The p-value for this group was calculated as 0.44. Since the p-value for this pair
is greater than α, the means of the two groups are the same. Therefore, they may be
pooled together for further analysis.
Comparison of "5 function x 3 means" Morphological Charts (between class sections -- ME202 -- Spring 2005)
average score ± 1 standard deviation
avg. +s avg. +s
avg. -s
avg. -s
averageaverage
0
10
20
30
40
50
60
70
80
Section 1 Section 2
41
Comparison of "3 function x 5 means" Morphological Charts(between class sections -- ME202 -- Spring 2005)
average score ± 1 standard deviation
avg. +s avg. +s
avg. -s avg. -s
average average
0
10
20
30
40
50
60
70
80
Section 1 Section 2
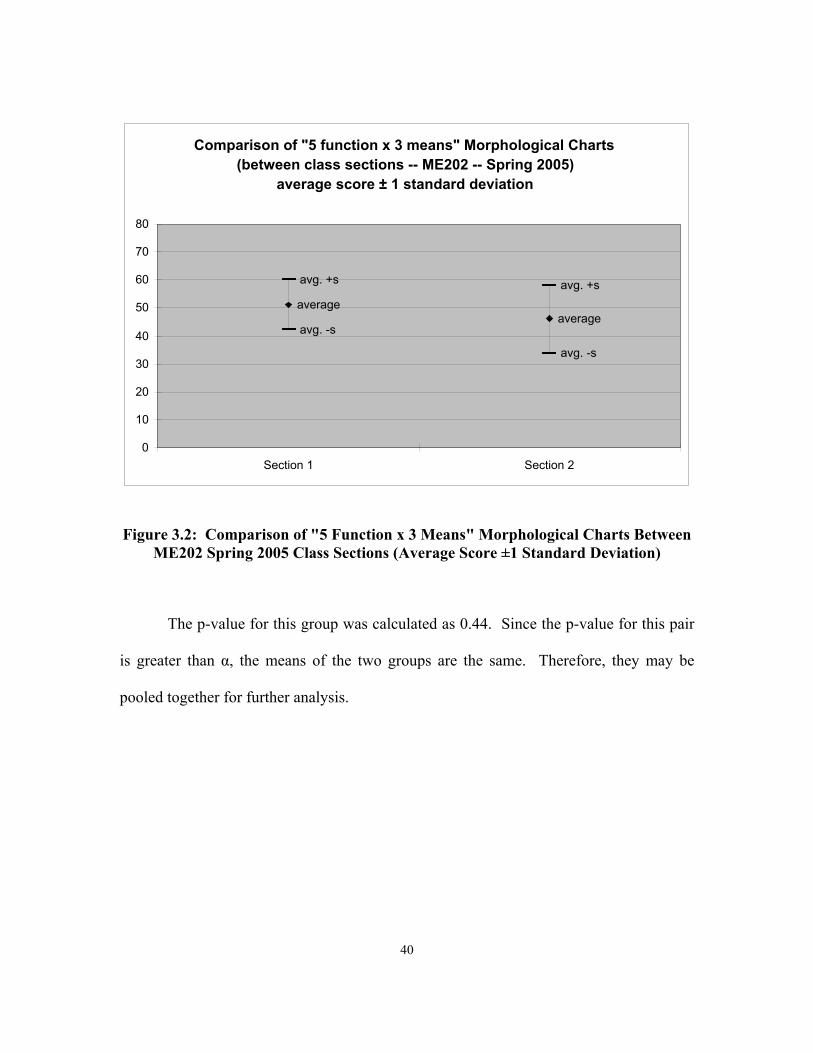
Figure 3.3: Comparison of "3 Function x 5 Means" Morphological Charts Between ME202 Spring 2005 Class Sections (Average Score ±1 Standard Deviation)
The p-value for this group was calculated as 0.94. Since the p-value for this pair
is greater than α, the means of the two groups are the same. Therefore, they may be
pooled together for further analysis.
Since both class sections showed comparable means, they will be combined and
treated as one group.
42
Comparison of 3x5 and 5x3 Morphological Charts(ME202 -- Spring 2005)
average score ± 1 standard deviation
avg. +s
avg. +s
avg. -s
avg. -s
average
average
0
10
20
30
40
50
60
70
80
3F x 5M (short) 5F x 3M (skinny)
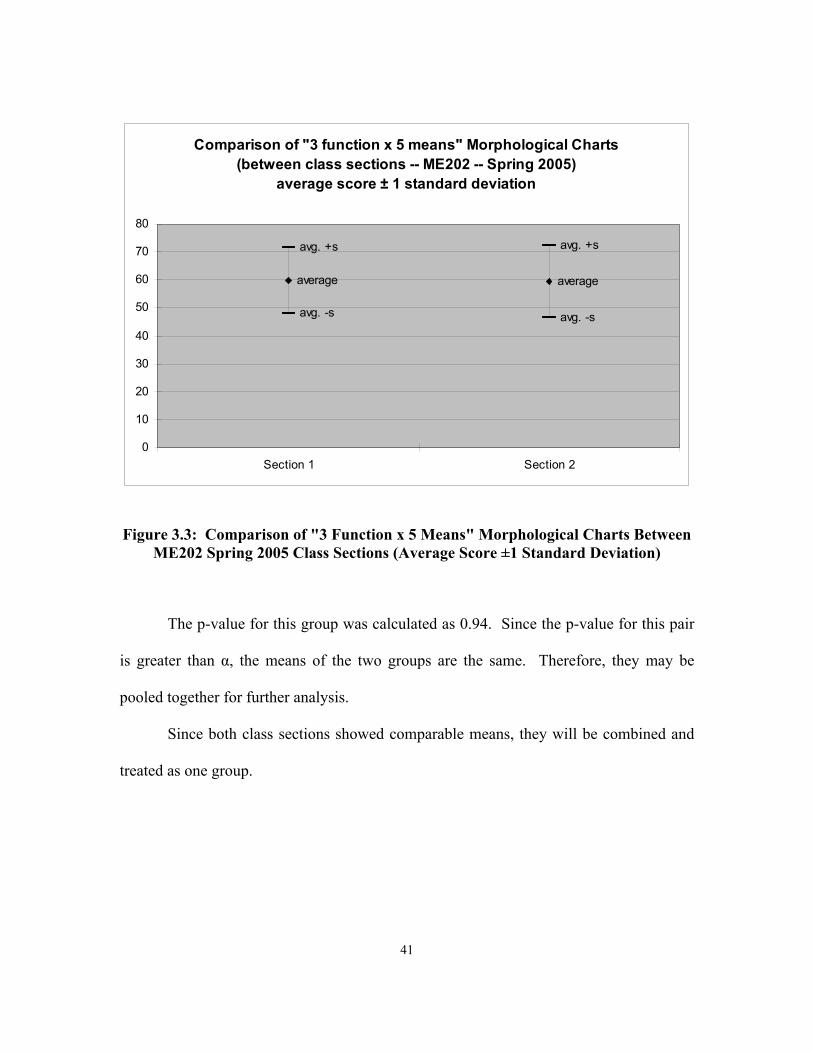
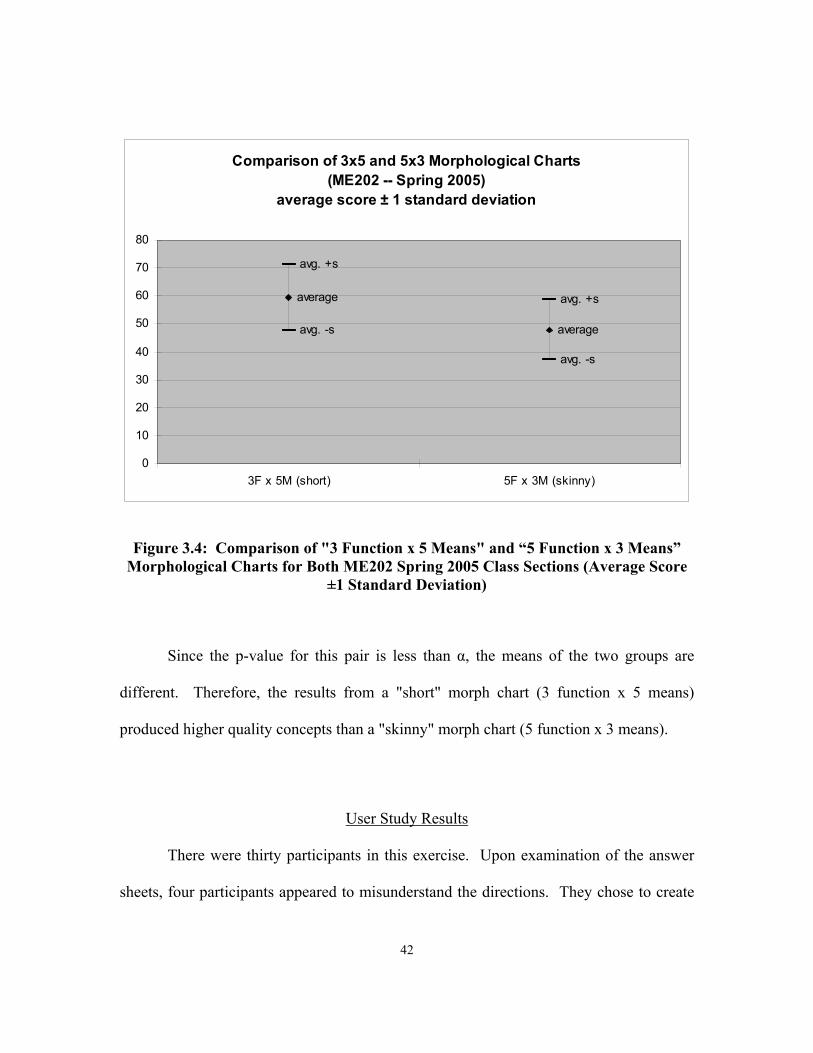
Figure 3.4: Comparison of "3 Function x 5 Means" and “5 Function x 3 Means” Morphological Charts for Both ME202 Spring 2005 Class Sections (Average Score
±1 Standard Deviation)
Since the p-value for this pair is less than α, the means of the two groups are
different. Therefore, the results from a "short" morph chart (3 function x 5 means)
produced higher quality concepts than a "skinny" morph chart (5 function x 3 means).
User Study Results
There were thirty participants in this exercise. Upon examination of the answer
sheets, four participants appeared to misunderstand the directions. They chose to create
43
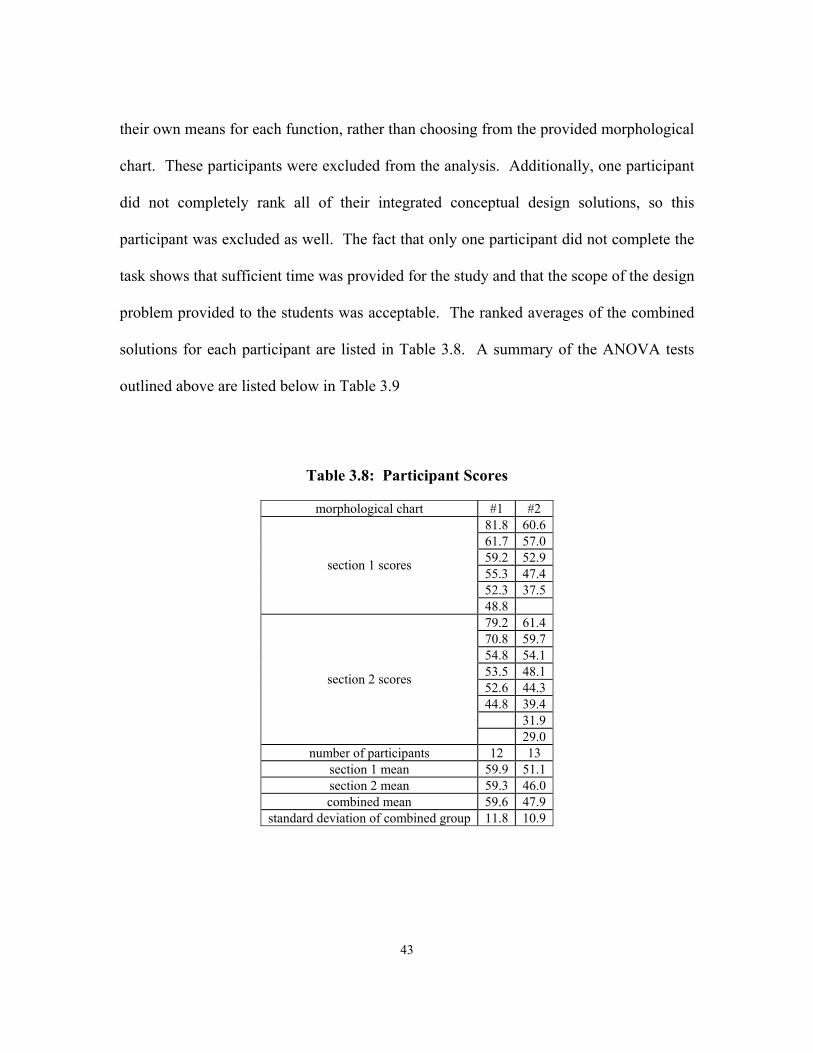
their own means for each function, rather than choosing from the provided morphological
chart. These participants were excluded from the analysis. Additionally, one participant
did not completely rank all of their integrated conceptual design solutions, so this
participant was excluded as well. The fact that only one participant did not complete the
task shows that sufficient time was provided for the study and that the scope of the design
problem provided to the students was acceptable. The ranked averages of the combined
solutions for each participant are listed in Table 3.8. A summary of the ANOVA tests
outlined above are listed below in Table 3.9
Table 3.8: Participant Scores
morphological chart #1 #2 81.8 60.6 61.7 57.0 59.2 52.9 55.3 47.4 52.3 37.5
section 1 scores
48.8 79.2 61.4 70.8 59.7 54.8 54.1 53.5 48.1 52.6 44.3 44.8 39.4
31.9
section 2 scores
29.0 number of participants 12 13
section 1 mean 59.9 51.1 section 2 mean 59.3 46.0 combined mean 59.6 47.9
standard deviation of combined group 11.8 10.9
44
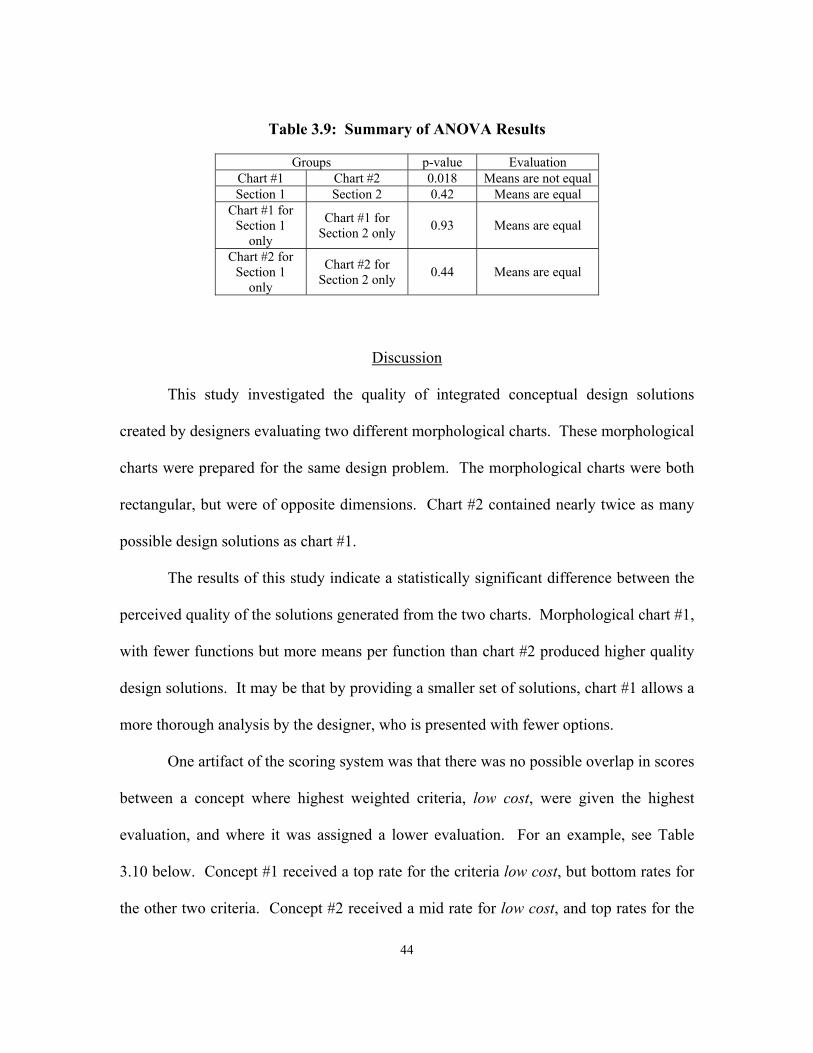
Table 3.9: Summary of ANOVA Results
Groups p-value Evaluation Chart #1 Chart #2 0.018 Means are not equal Section 1 Section 2 0.42 Means are equal
Chart #1 for Section 1
only
Chart #1 for Section 2 only 0.93 Means are equal
Chart #2 for Section 1
only
Chart #2 for Section 2 only 0.44 Means are equal
Discussion
This study investigated the quality of integrated conceptual design solutions
created by designers evaluating two different morphological charts. These morphological
charts were prepared for the same design problem. The morphological charts were both
rectangular, but were of opposite dimensions. Chart #2 contained nearly twice as many
possible design solutions as chart #1.
The results of this study indicate a statistically significant difference between the
perceived quality of the solutions generated from the two charts. Morphological chart #1,
with fewer functions but more means per function than chart #2 produced higher quality
design solutions. It may be that by providing a smaller set of solutions, chart #1 allows a
more thorough analysis by the designer, who is presented with fewer options.
One artifact of the scoring system was that there was no possible overlap in scores
between a concept where highest weighted criteria, low cost, were given the highest
evaluation, and where it was assigned a lower evaluation. For an example, see Table
3.10 below. Concept #1 received a top rate for the criteria low cost, but bottom rates for
the other two criteria. Concept #2 received a mid rate for low cost, and top rates for the
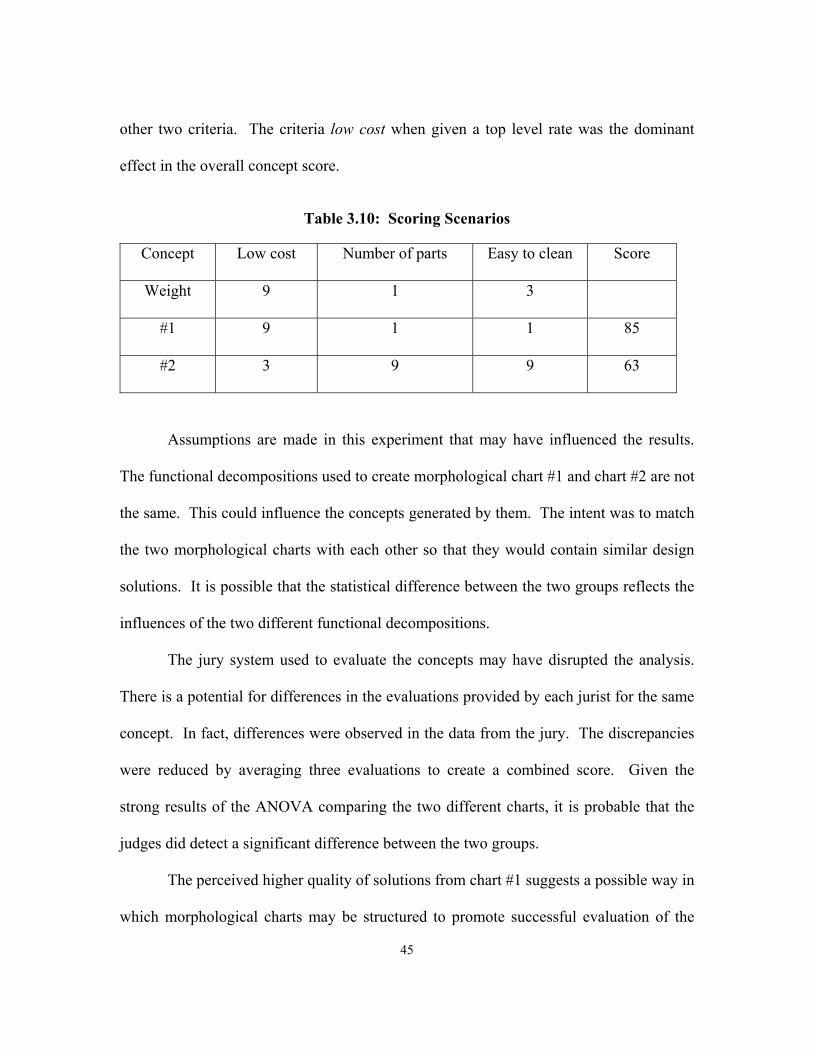
45
other two criteria. The criteria low cost when given a top level rate was the dominant
effect in the overall concept score.
Table 3.10: Scoring Scenarios
Concept Low cost Number of parts Easy to clean Score
Weight 9 1 3
#1 9 1 1 85
#2 3 9 9 63
Assumptions are made in this experiment that may have influenced the results.
The functional decompositions used to create morphological chart #1 and chart #2 are not
the same. This could influence the concepts generated by them. The intent was to match
the two morphological charts with each other so that they would contain similar design
solutions. It is possible that the statistical difference between the two groups reflects the
influences of the two different functional decompositions.
The jury system used to evaluate the concepts may have disrupted the analysis.
There is a potential for differences in the evaluations provided by each jurist for the same
concept. In fact, differences were observed in the data from the jury. The discrepancies
were reduced by averaging three evaluations to create a combined score. Given the
strong results of the ANOVA comparing the two different charts, it is probable that the
judges did detect a significant difference between the two groups.
The perceived higher quality of solutions from chart #1 suggests a possible way in
which morphological charts may be structured to promote successful evaluation of the
46
design solutions contained within them. Structuring charts with fewer functions appears
to aid in the analysis of the integrated conceptual design solutions contained in them.
47
CHAPTER 4
EXPERIMENTAL STUDY WITH FOUR MORPHOLOGICAL CHARTS
The previous chapter detailed an experiment with two different sized
morphological charts. A second experiment was performed to build upon what was
discovered in the first and to improve on limitations observed. This second experiment
separated the effects of morphological chart size and morphological chart shape. The
impact of changing just the number of functions, or just the number of means per
function was explored. Larger morphological charts, up to eight functions and seven
means, were used to provide a larger design space. Lastly, the concept selection criteria
weighting and decision systems were changed to reduce the impact of the weighting
criteria. As was discussed in Chapter 3, there was no possible overlap in scores between
a concept where highest weighted criteria, low cost, was given the highest evaluation, and
where it was assigned a lower evaluation. This correction was achieved by adjusting the
relative weightings of the criteria and by using a 9-6-3-1 scale in place of a 9-3-1 scale
for the allowable evaluations. As in the previous experiment, these morphological charts
were used by participants to form different concepts, which were evaluated by a panel of
judges to determine which configuration of morphological charts yielded the highest
quality concepts. The following sections detail this experimental exercise.
Experimental Method
Rectangular morphological charts were prepared for an automatic pet feeding
machine. The design problem for the device was as follows:
48
“Design a device to feed a dog or cat. The device should allow the pet owners the
flexibility of filling a reservoir at the beginning of a week without the worry of
monitoring the status of the food in the bowl. Specifically, the device should regulate the
food dependant upon the type of animal (dog, cat), size of the animal (small, medium,
large), and the dietary needs (normal, fat). Generally, the device should be able to detect
when the new food is required in the bowl and detect when the reservoir is getting low
and notify the pet owner. Further, the device should remain stationary.”
Four different morphological sizes were generated, as outlined in Table 4.1. The
individual morphological charts are shown in Table 4.2 through Table 4.5. The
morphological charts have either four or eight functions. They have either five or seven
means per function. In this experiment, for a given number of functions, the
morphological chart with seven means has all the means listed in the chart with five
means. The additional means are scattered throughout the morphological chart, not just
added to the right hand side. Therefore, all the concepts which can be generated from
Table 4.2 are a subset of those which can be generated from Table 4.3. All concepts
which can be generated from Table 4.4 are a subset of those which can be generated from
Table 4.5. No means were incorporated into the charts that were intentionally bad
choices.
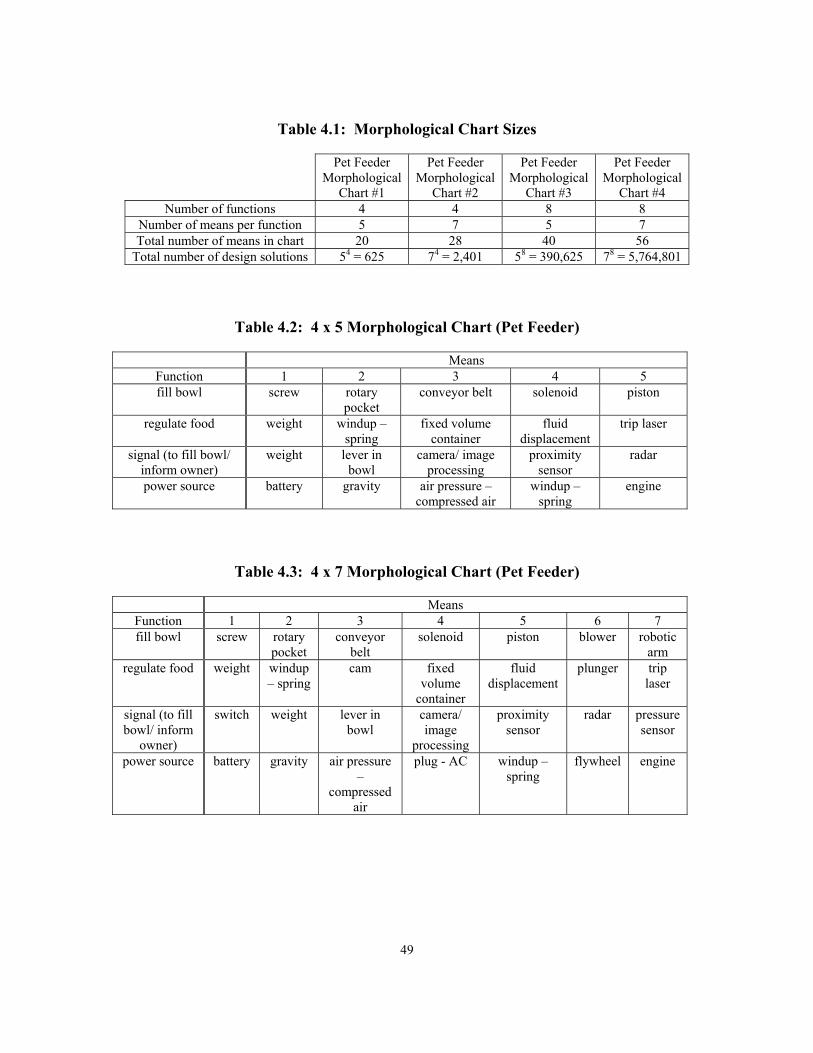
49
Table 4.1: Morphological Chart Sizes
Pet Feeder
Morphological Chart #1
Pet Feeder Morphological
Chart #2
Pet Feeder Morphological
Chart #3
Pet Feeder Morphological
Chart #4 Number of functions 4 4 8 8
Number of means per function 5 7 5 7 Total number of means in chart 20 28 40 56
Total number of design solutions 54 = 625 74 = 2,401 58 = 390,625 78 = 5,764,801
Table 4.2: 4 x 5 Morphological Chart (Pet Feeder)
Means Function 1 2 3 4 5 fill bowl screw rotary
pocket conveyor belt solenoid piston
regulate food weight windup –spring
fixed volume container
fluid displacement
trip laser
signal (to fill bowl/ inform owner)
weight lever in bowl
camera/ image processing
proximity sensor
radar
power source battery gravity air pressure – compressed air
windup –spring
engine
Table 4.3: 4 x 7 Morphological Chart (Pet Feeder)
Means Function 1 2 3 4 5 6 7 fill bowl screw rotary
pocket conveyor
belt solenoid piston blower robotic
arm regulate food weight windup
– spring cam fixed
volume container
fluid displacement
plunger trip laser
signal (to fill bowl/ inform
owner)
switch weight lever in bowl
camera/ image
processing
proximity sensor
radar pressure sensor
power source battery gravity air pressure –
compressed air
plug - AC windup – spring
flywheel engine
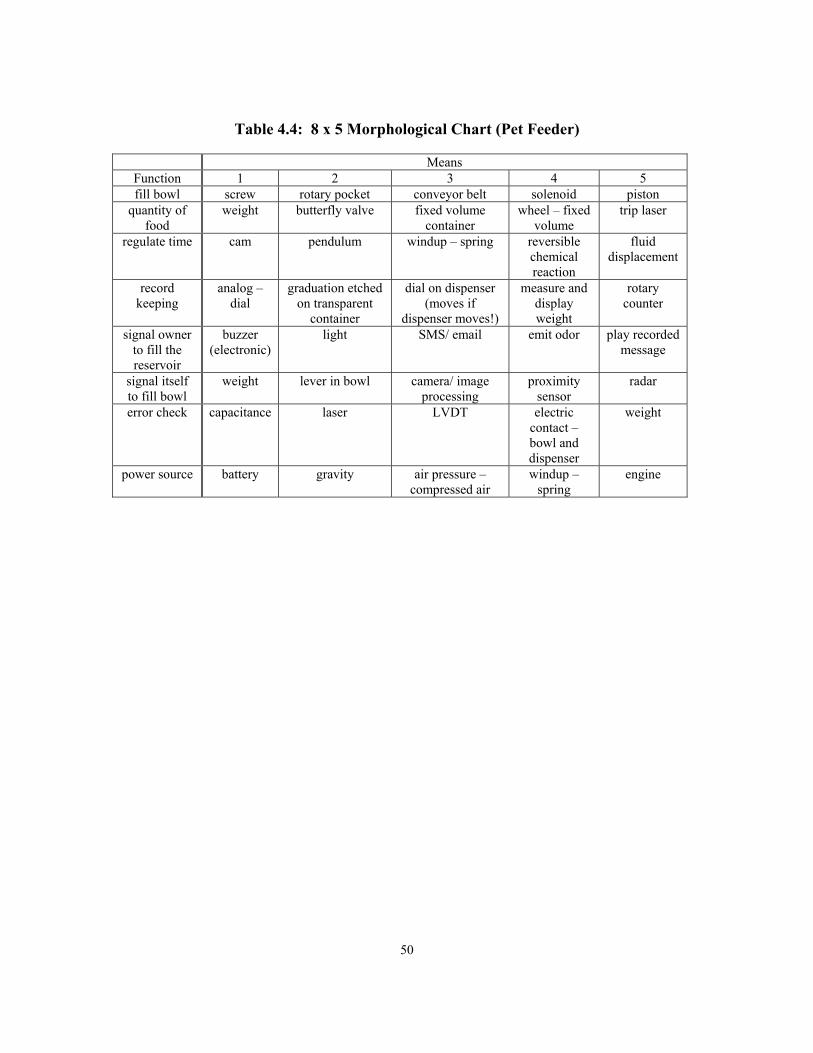
50
Table 4.4: 8 x 5 Morphological Chart (Pet Feeder)
Means Function 1 2 3 4 5 fill bowl screw rotary pocket conveyor belt solenoid piston
quantity of food
weight butterfly valve fixed volume container
wheel – fixed volume
trip laser
regulate time cam pendulum windup – spring reversible chemical reaction
fluid displacement
record keeping
analog –dial
graduation etched on transparent
container
dial on dispenser (moves if
dispenser moves!)
measure and display weight
rotary counter
signal owner to fill the reservoir
buzzer (electronic)
light SMS/ email emit odor play recorded message
signal itself to fill bowl
weight lever in bowl camera/ image processing
proximity sensor
radar
error check capacitance laser LVDT electric contact – bowl and dispenser
weight
power source battery gravity air pressure – compressed air
windup – spring
engine
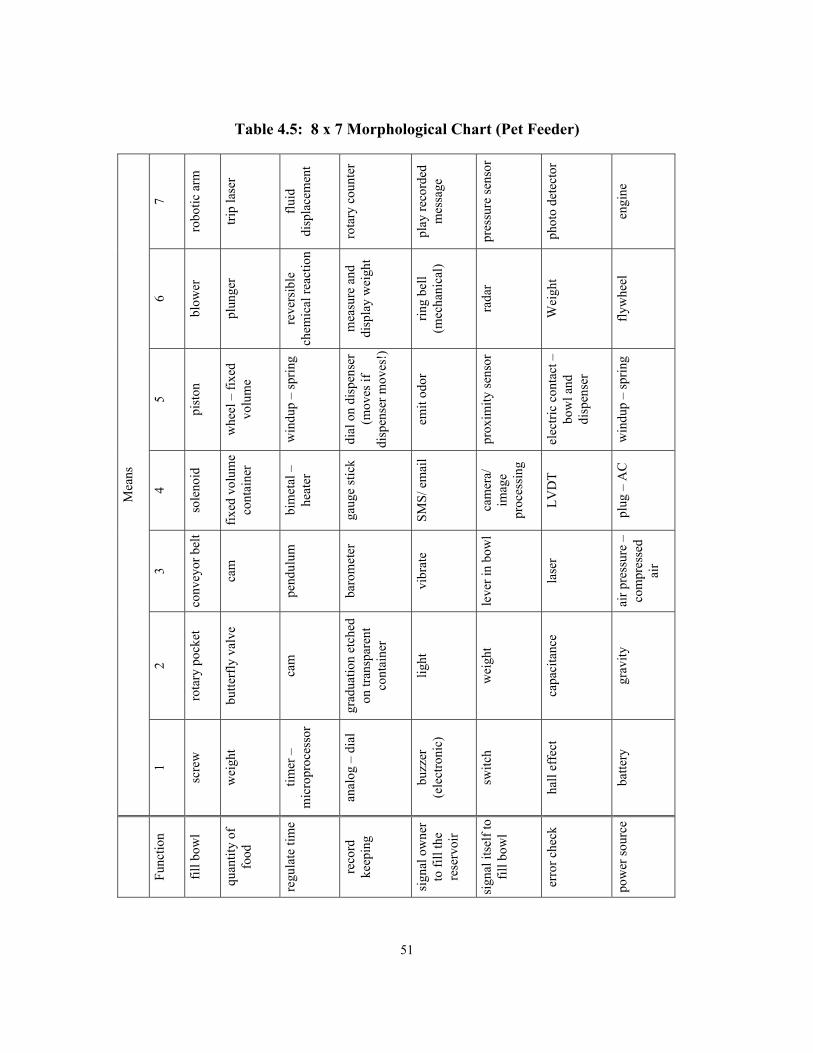
51
Table 4.5: 8 x 7 Morphological Chart (Pet Feeder)
7
robo
tic a
rm
trip
lase
r
fluid
di
spla
cem
ent
rota
ry c
ount
er
play
reco
rded
m
essa
ge
pres
sure
sens
or
phot
o de
tect
or
engi
ne
6
blow
er
plun
ger
reve
rsib
le
chem
ical
reac
tion
mea
sure
and
di
spla
y w
eigh
t
ring
bell
(mec
hani
cal)
rada
r
Wei
ght
flyw
heel
5
pist
on
whe
el –
fixe
d vo
lum
e
win
dup
– sp
ring
dial
on
disp
ense
r (m
oves
if
disp
ense
r mov
es!)
emit
odor
prox
imity
sens
or
elec
tric
cont
act –
bo
wl a
nd
disp
ense
r
win
dup
– sp
ring
4
sole
noid
fixed
vol
ume
cont
aine
r
bim
etal
–
heat
er
gaug
e st
ick
SMS/
em
ail
cam
era/
im
age
proc
essi
ng
LVD
T
plug
– A
C
3
conv
eyor
bel
t
cam
pend
ulum
baro
met
er
vibr
ate
leve
r in
bow
l
lase
r
air p
ress
ure
–co
mpr
esse
d ai
r
2
rota
ry p
ocke
t
butte
rfly
val
ve
cam
grad
uatio
n et
ched
on
tran
spar
ent
cont
aine
r
light
wei
ght
capa
cita
nce
grav
ity
Mea
ns
1
scre
w
wei
ght
timer
–m
icro
proc
esso
r
anal
og –
dia
l
buzz
er
(ele
ctro
nic)
switc
h
hall
effe
ct
batte
ry
Func
tion
fill b
owl
quan
tity
of
food
regu
late
tim
e
reco
rd
keep
ing
sign
al o
wne
r to
fill
the
rese
rvoi
r
sign
al it
self
to
fill b
owl
erro
r che
ck
pow
er so
urce
52
Participants
The participants employed in this experiment possessed a similar educational
background to each other and to the group used in Chapter 3. They were all students
enrolled in a required sophomore level mechanical engineering design and kinematics
class at Clemson University. The students had exposure to morphological charts in the
class through a lecture two days before the experiment. Unlike in the previous
experiment, all of the participants were from the same class section, so they all received
the same lecture at the same time. Some students may have possessed outside experience
with morphological charts in addition to what was gained through this lecture, however
the extent of outside knowledge was not captured in this experiment. The participants in
this experiment were taking the same course as those in the experiment in Chapter 3, but
one year later. It is unlikely that any of these students participated in the morphological
chart study with the burrito folder, although they were not directly asked.
Design Problem
The design problem chosen for this study was to create an automatic pet feeder, as
was mentioned above. Unlike in the previous study, this was not a project previously
used for the sophomore mechanical engineering course. It was believed to be of a similar
scope to what the participants were currently working with in their class. It was also
believed to be a new problem for the participants so that they would all be equally
familiar with the design problem.
As this design problem was not previously studied by a design class, the
functional decompositions and morphological charts were new. A team of ten graduate
53
students in the Mechanical Engineering department considered the design problem and
prepared the morphological charts. In this way, the input of several designers was
solicited for the creation of the morphological charts. The assumption was made that this
input reduced the likelihood that critical functions were left out of the morphological
charts.
This study presented changes in the number of functions and means per function
separately and together. The four morphological charts represent all the possible
combinations of two levels of numbers of functions, and two levels of the number of
means per function. For a given number of functions in a chart, individual means were
added to the chart to make the transition from five means per function to seven means per
function. The new means were added at various places in row for each function, not just
at the end of the row.
For the transition from eight functions to four functions, some functions were
merged (the functions quantity of food and regulate time were merged into a new
function regulate food, and the functions signal owner to fill the reservoir and signal
itself to fill bowl were merged into a new function signal (to fill bowl / inform owner)).
As was the case in the previous study, these changes to the morphological charts do not
guarantee the same solution sets. Changing the number of functions or means per
function will change the number of possible integrated concepts, which presents a
different set of solutions to the designer.
54
Procedure
During the semester, the participants had an overview of functional
decomposition and means generation in their class. The participants received a lecture on
morphological charts two days before this experiment. On the day of the study, the
participants received a brief reminder of how to use a morphological chart. Participants
were given a morphological chart and an answer form. The answer form contained room
for the participant to list ten integrated conceptual design solutions and rate them against
criteria provided. The criteria and relative weights are shown in Table 4.6. The
participants were instructed to use the rating scale shown in Table 4.7. Many, but not all,
participants followed this instruction. Participants who used values other than those
listed in Table 4.7 were not excluded from the results. Participants were assigned to
work with one of the morphological chart sizes. As can be seen from the number of
participants listed for each morphological chart below in Table 4.8, the experiment had
between six and eight participants for each chart size.
Table 4.6: Solution Evaluation Criteria
criteria weight cost 7
not many parts 1 easy to clean 9
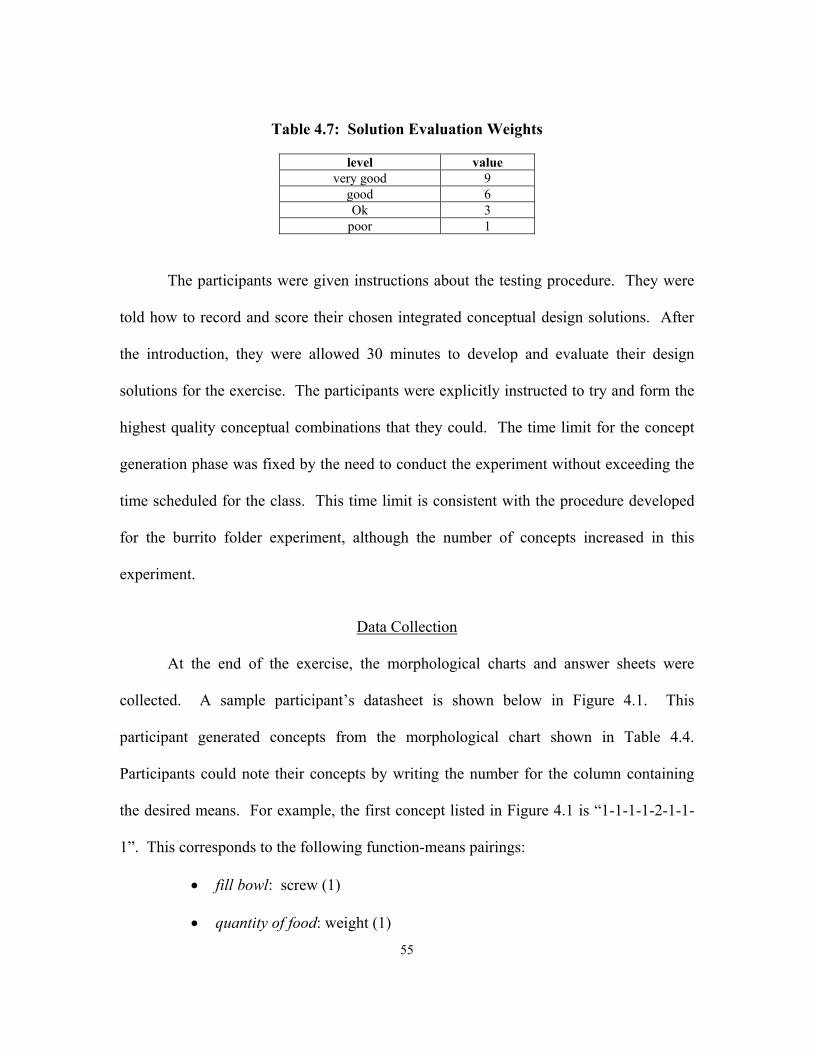
55
Table 4.7: Solution Evaluation Weights
level value very good 9
good 6 Ok 3
poor 1
The participants were given instructions about the testing procedure. They were
told how to record and score their chosen integrated conceptual design solutions. After
the introduction, they were allowed 30 minutes to develop and evaluate their design
solutions for the exercise. The participants were explicitly instructed to try and form the
highest quality conceptual combinations that they could. The time limit for the concept
generation phase was fixed by the need to conduct the experiment without exceeding the
time scheduled for the class. This time limit is consistent with the procedure developed
for the burrito folder experiment, although the number of concepts increased in this
experiment.
Data Collection
At the end of the exercise, the morphological charts and answer sheets were
collected. A sample participant’s datasheet is shown below in Figure 4.1. This
participant generated concepts from the morphological chart shown in Table 4.4.
Participants could note their concepts by writing the number for the column containing
the desired means. For example, the first concept listed in Figure 4.1 is “1-1-1-1-2-1-1-
1”. This corresponds to the following function-means pairings:
• fill bowl: screw (1)
• quantity of food: weight (1)
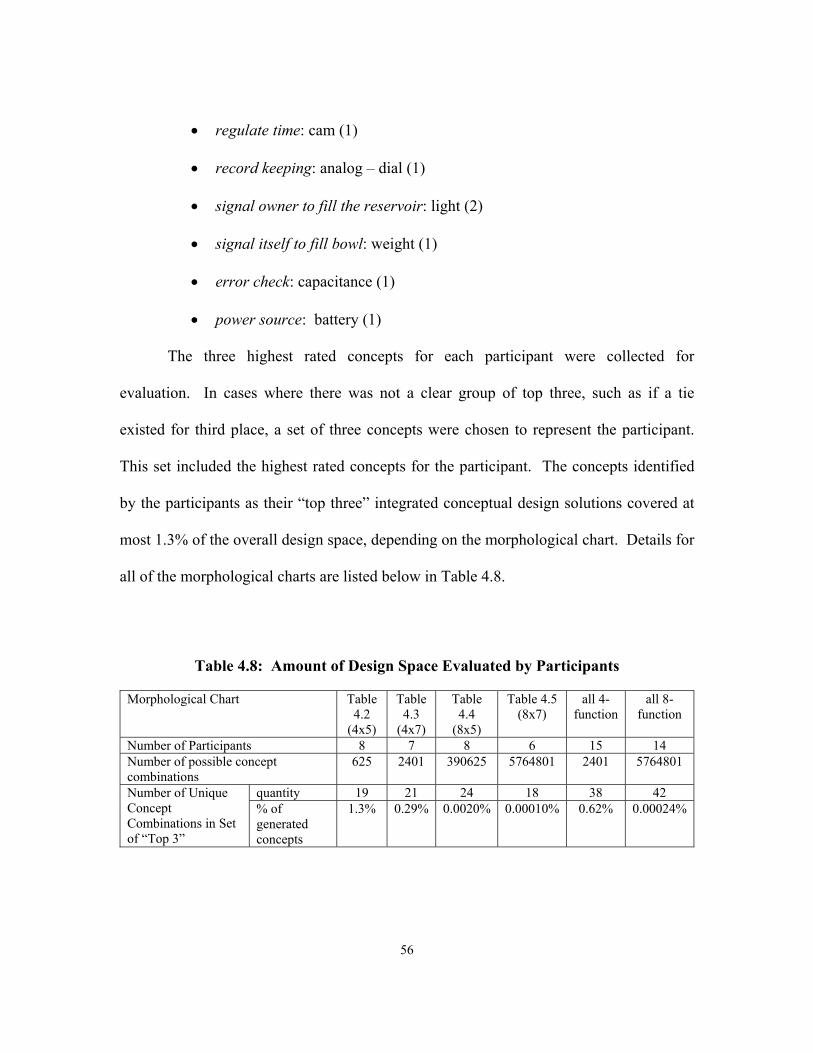
56
• regulate time: cam (1)
• record keeping: analog – dial (1)
• signal owner to fill the reservoir: light (2)
• signal itself to fill bowl: weight (1)
• error check: capacitance (1)
• power source: battery (1)
The three highest rated concepts for each participant were collected for
evaluation. In cases where there was not a clear group of top three, such as if a tie
existed for third place, a set of three concepts were chosen to represent the participant.
This set included the highest rated concepts for the participant. The concepts identified
by the participants as their “top three” integrated conceptual design solutions covered at
most 1.3% of the overall design space, depending on the morphological chart. Details for
all of the morphological charts are listed below in Table 4.8.
Table 4.8: Amount of Design Space Evaluated by Participants
Morphological Chart Table 4.2
(4x5)
Table 4.3
(4x7)
Table 4.4
(8x5)
Table 4.5 (8x7)
all 4-function
all 8-function
Number of Participants 8 7 8 6 15 14 Number of possible concept combinations
625 2401 390625 5764801 2401 5764801
quantity 19 21 24 18 38 42 Number of Unique Concept Combinations in Set of “Top 3”
% of generated concepts
1.3% 0.29% 0.0020% 0.00010% 0.62% 0.00024%
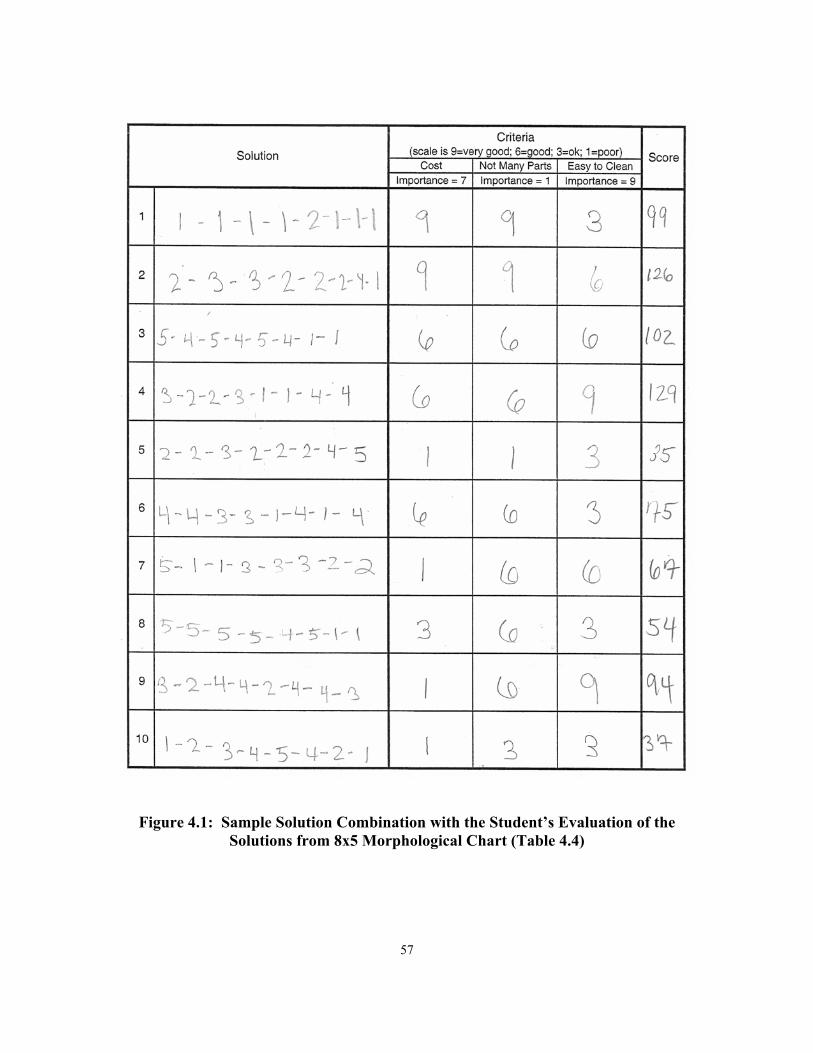
57
Figure 4.1: Sample Solution Combination with the Student’s Evaluation of the Solutions from 8x5 Morphological Chart (Table 4.4)
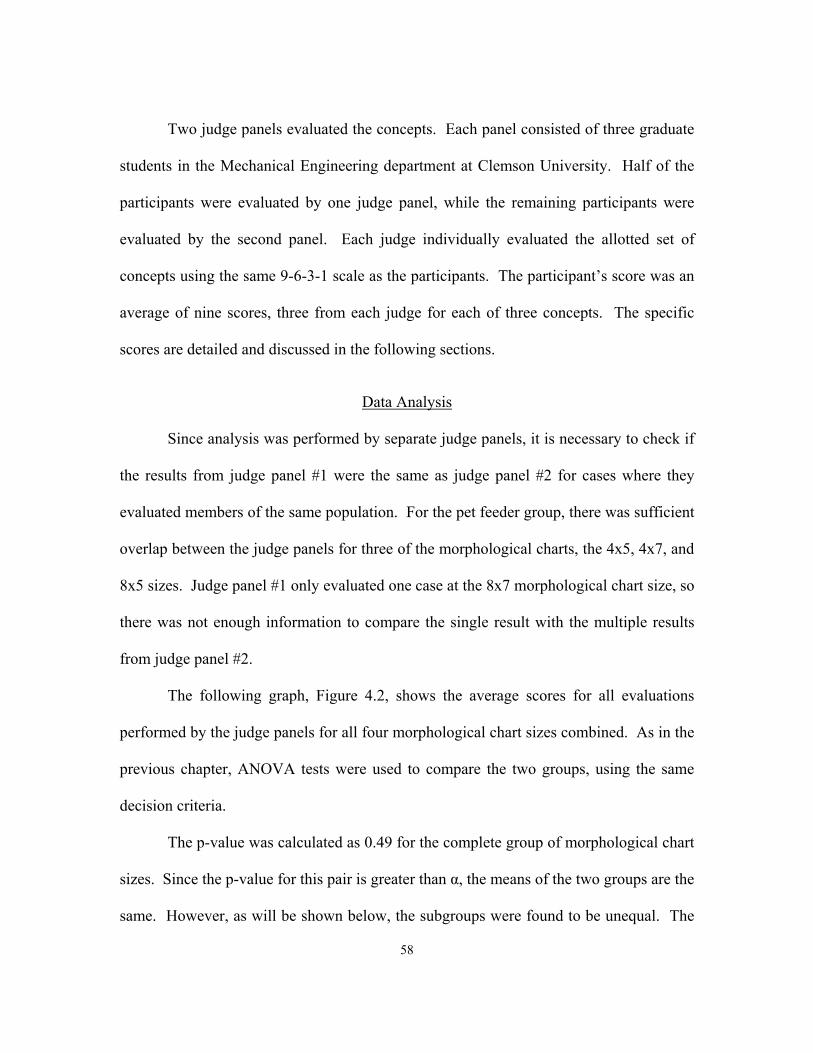
58
Two judge panels evaluated the concepts. Each panel consisted of three graduate
students in the Mechanical Engineering department at Clemson University. Half of the
participants were evaluated by one judge panel, while the remaining participants were
evaluated by the second panel. Each judge individually evaluated the allotted set of
concepts using the same 9-6-3-1 scale as the participants. The participant’s score was an
average of nine scores, three from each judge for each of three concepts. The specific
scores are detailed and discussed in the following sections.
Data Analysis
Since analysis was performed by separate judge panels, it is necessary to check if
the results from judge panel #1 were the same as judge panel #2 for cases where they
evaluated members of the same population. For the pet feeder group, there was sufficient
overlap between the judge panels for three of the morphological charts, the 4x5, 4x7, and
8x5 sizes. Judge panel #1 only evaluated one case at the 8x7 morphological chart size, so
there was not enough information to compare the single result with the multiple results
from judge panel #2.
The following graph, Figure 4.2, shows the average scores for all evaluations
performed by the judge panels for all four morphological chart sizes combined. As in the
previous chapter, ANOVA tests were used to compare the two groups, using the same
decision criteria.
The p-value was calculated as 0.49 for the complete group of morphological chart
sizes. Since the p-value for this pair is greater than α, the means of the two groups are the
same. However, as will be shown below, the subgroups were found to be unequal. The
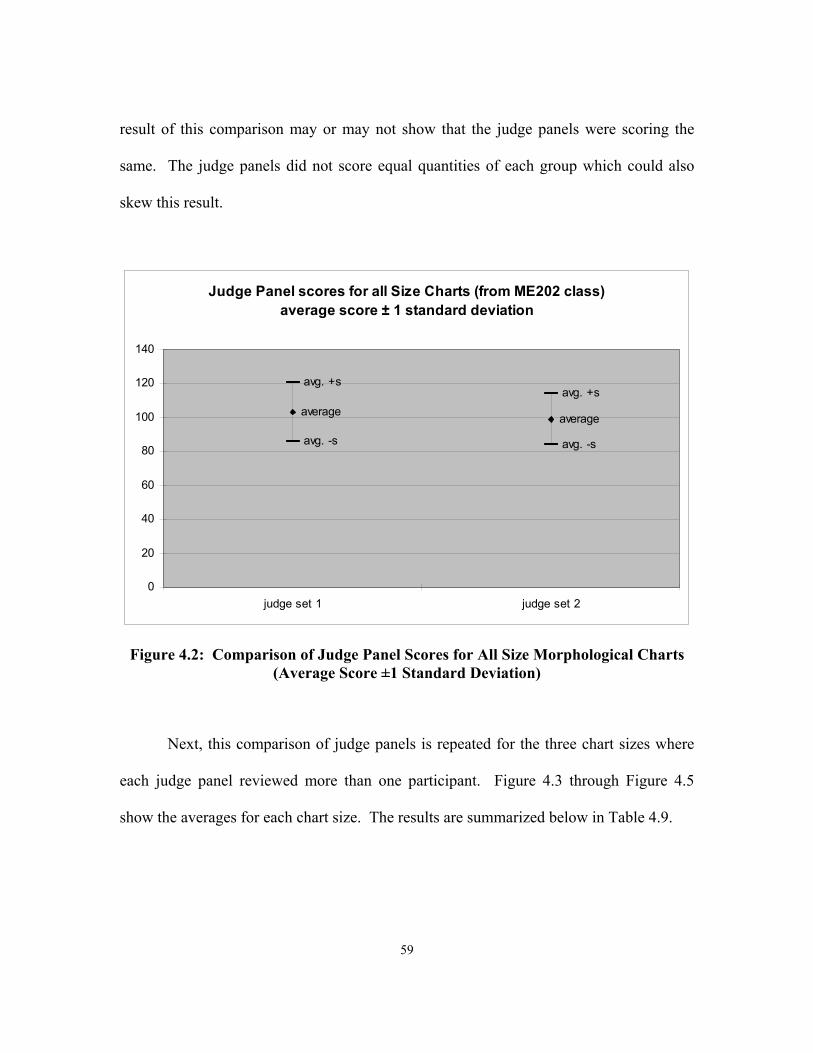
59
result of this comparison may or may not show that the judge panels were scoring the
same. The judge panels did not score equal quantities of each group which could also
skew this result.
Judge Panel scores for all Size Charts (from ME202 class)average score ± 1 standard deviation
avg. +savg. +s
avg. -s avg. -s
average average
0
20
40
60
80
100
120
140
judge set 1 judge set 2
Figure 4.2: Comparison of Judge Panel Scores for All Size Morphological Charts (Average Score ±1 Standard Deviation)
Next, this comparison of judge panels is repeated for the three chart sizes where
each judge panel reviewed more than one participant. Figure 4.3 through Figure 4.5
show the averages for each chart size. The results are summarized below in Table 4.9.
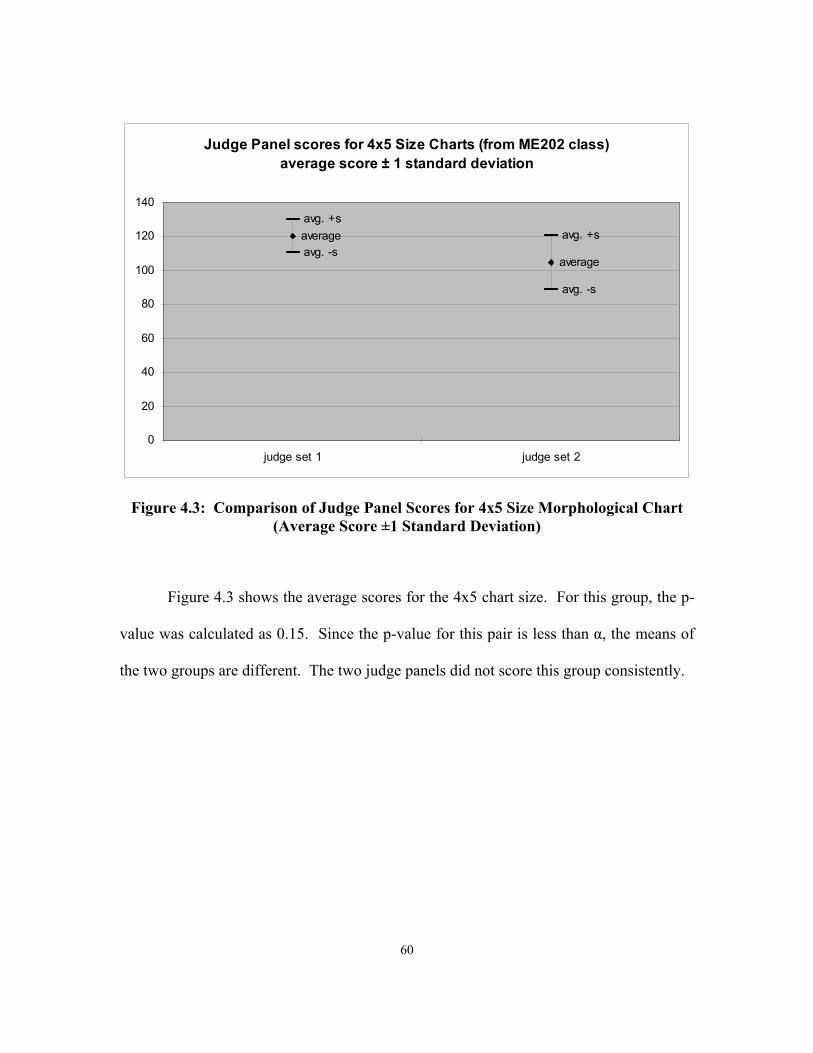
60
Judge Panel scores for 4x5 Size Charts (from ME202 class)average score ± 1 standard deviation
avg. +savg. +s
avg. -s
avg. -s
average
average
0
20
40
60
80
100
120
140
judge set 1 judge set 2
Figure 4.3: Comparison of Judge Panel Scores for 4x5 Size Morphological Chart (Average Score ±1 Standard Deviation)
Figure 4.3 shows the average scores for the 4x5 chart size. For this group, the p-
value was calculated as 0.15. Since the p-value for this pair is less than α, the means of
the two groups are different. The two judge panels did not score this group consistently.
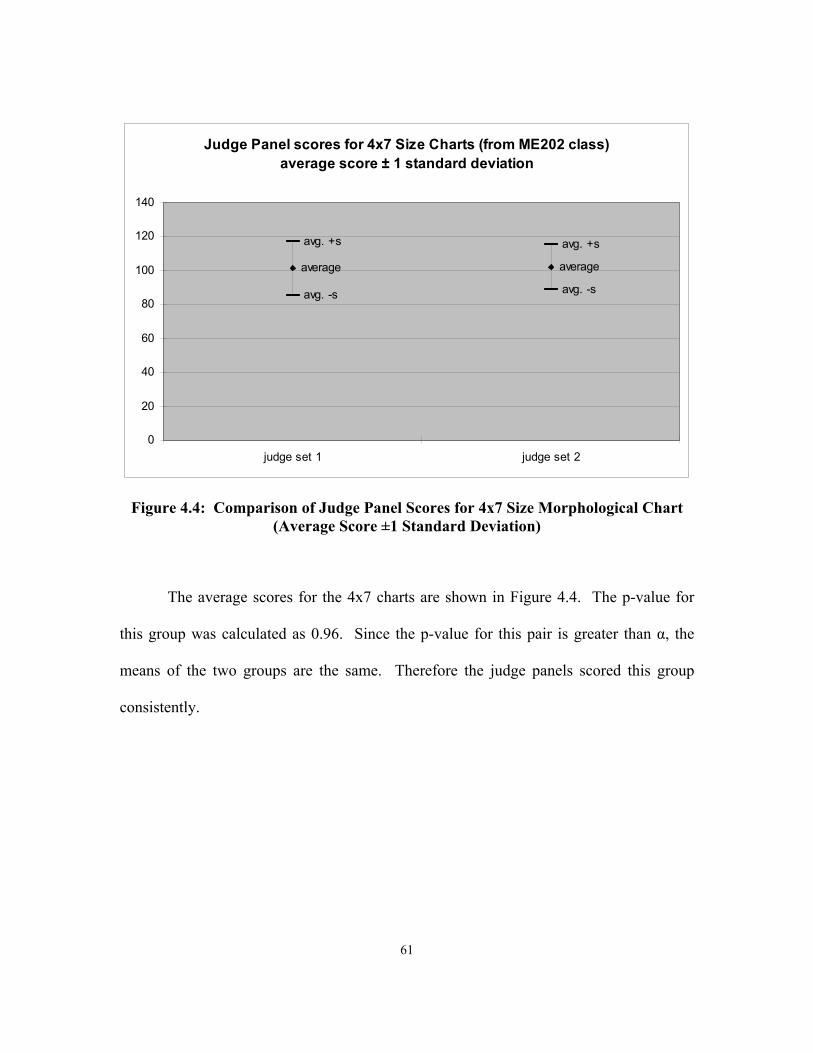
61
Judge Panel scores for 4x7 Size Charts (from ME202 class)average score ± 1 standard deviation
avg. +s avg. +s
avg. -s avg. -s
average average
0
20
40
60
80
100
120
140
judge set 1 judge set 2
Figure 4.4: Comparison of Judge Panel Scores for 4x7 Size Morphological Chart (Average Score ±1 Standard Deviation)
The average scores for the 4x7 charts are shown in Figure 4.4. The p-value for
this group was calculated as 0.96. Since the p-value for this pair is greater than α, the
means of the two groups are the same. Therefore the judge panels scored this group
consistently.
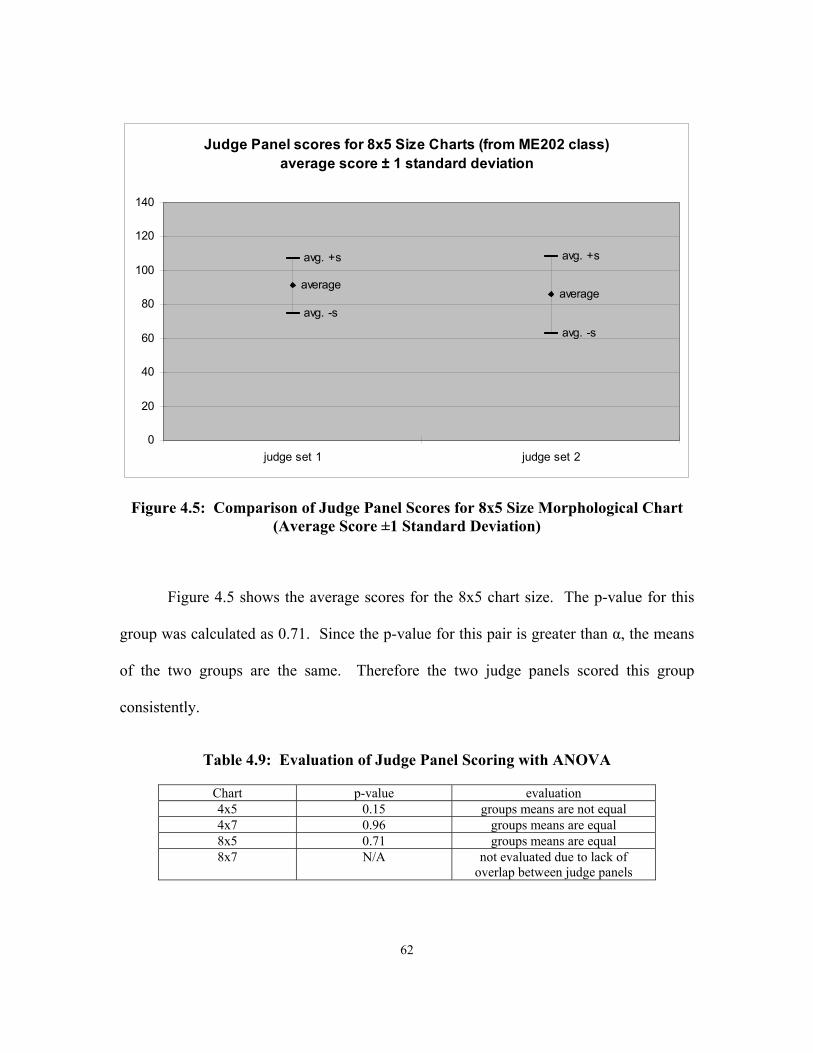
62
Judge Panel scores for 8x5 Size Charts (from ME202 class)average score ± 1 standard deviation
avg. +s avg. +s
avg. -s
avg. -s
averageaverage
0
20
40
60
80
100
120
140
judge set 1 judge set 2
Figure 4.5: Comparison of Judge Panel Scores for 8x5 Size Morphological Chart (Average Score ±1 Standard Deviation)
Figure 4.5 shows the average scores for the 8x5 chart size. The p-value for this
group was calculated as 0.71. Since the p-value for this pair is greater than α, the means
of the two groups are the same. Therefore the two judge panels scored this group
consistently.
Table 4.9: Evaluation of Judge Panel Scoring with ANOVA
Chart p-value evaluation 4x5 0.15 groups means are not equal 4x7 0.96 groups means are equal 8x5 0.71 groups means are equal 8x7 N/A not evaluated due to lack of
overlap between judge panels
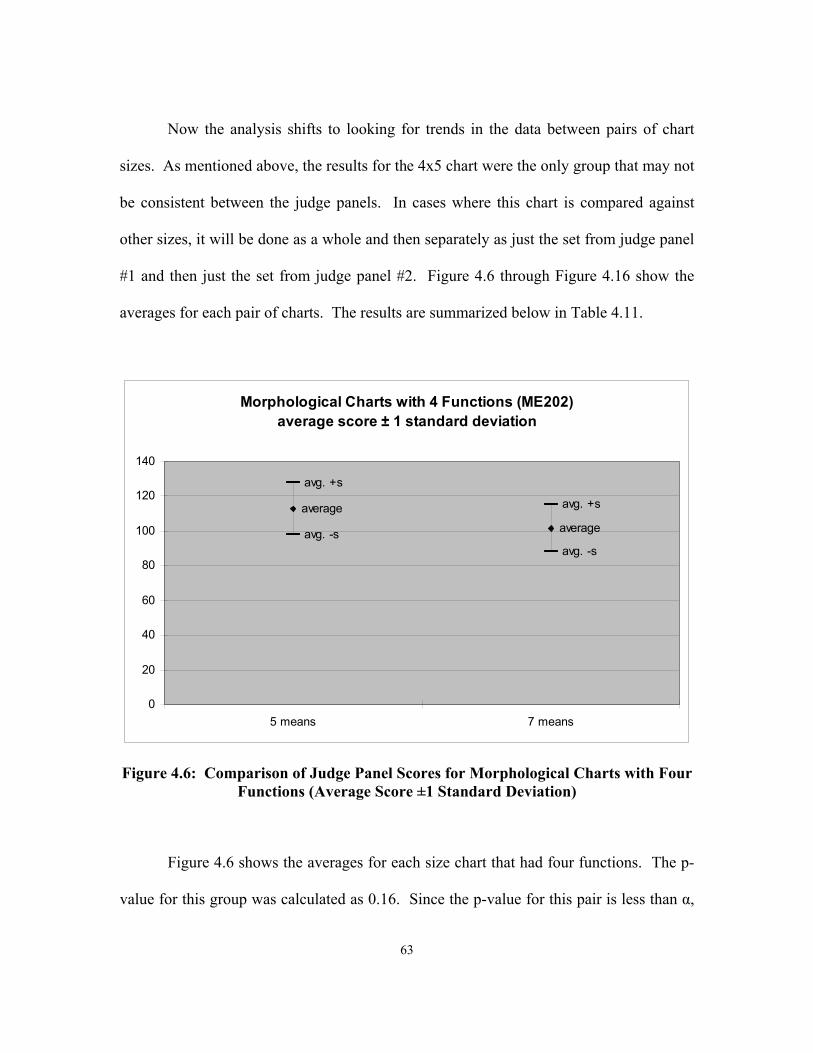
63
Now the analysis shifts to looking for trends in the data between pairs of chart
sizes. As mentioned above, the results for the 4x5 chart were the only group that may not
be consistent between the judge panels. In cases where this chart is compared against
other sizes, it will be done as a whole and then separately as just the set from judge panel
#1 and then just the set from judge panel #2. Figure 4.6 through Figure 4.16 show the
averages for each pair of charts. The results are summarized below in Table 4.11.
Morphological Charts with 4 Functions (ME202)average score ± 1 standard deviation
avg. +s
avg. +s
avg. -savg. -s
averageaverage
0
20
40
60
80
100
120
140
5 means 7 means
Figure 4.6: Comparison of Judge Panel Scores for Morphological Charts with Four Functions (Average Score ±1 Standard Deviation)
Figure 4.6 shows the averages for each size chart that had four functions. The p-
value for this group was calculated as 0.16. Since the p-value for this pair is less than α,
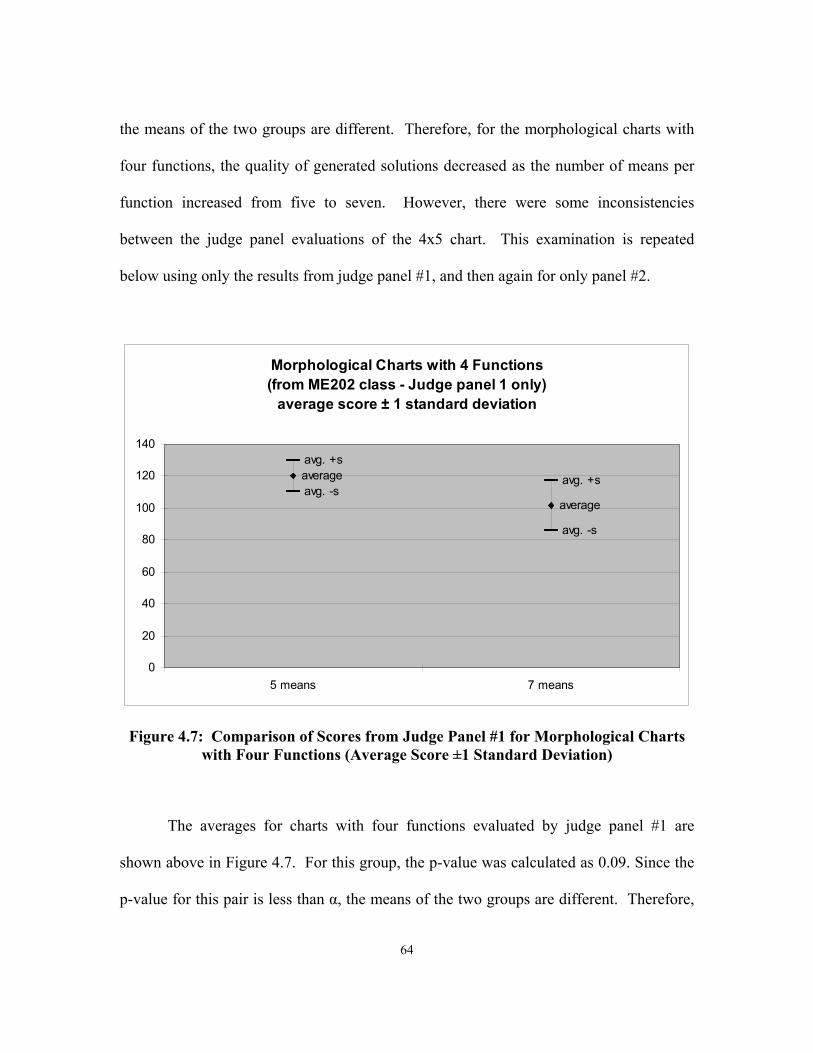
64
the means of the two groups are different. Therefore, for the morphological charts with
four functions, the quality of generated solutions decreased as the number of means per
function increased from five to seven. However, there were some inconsistencies
between the judge panel evaluations of the 4x5 chart. This examination is repeated
below using only the results from judge panel #1, and then again for only panel #2.
Morphological Charts with 4 Functions(from ME202 class - Judge panel 1 only)
average score ± 1 standard deviation
avg. +s
avg. +savg. -s
avg. -s
average
average
0
20
40
60
80
100
120
140
5 means 7 means
Figure 4.7: Comparison of Scores from Judge Panel #1 for Morphological Charts with Four Functions (Average Score ±1 Standard Deviation)
The averages for charts with four functions evaluated by judge panel #1 are
shown above in Figure 4.7. For this group, the p-value was calculated as 0.09. Since the
p-value for this pair is less than α, the means of the two groups are different. Therefore,
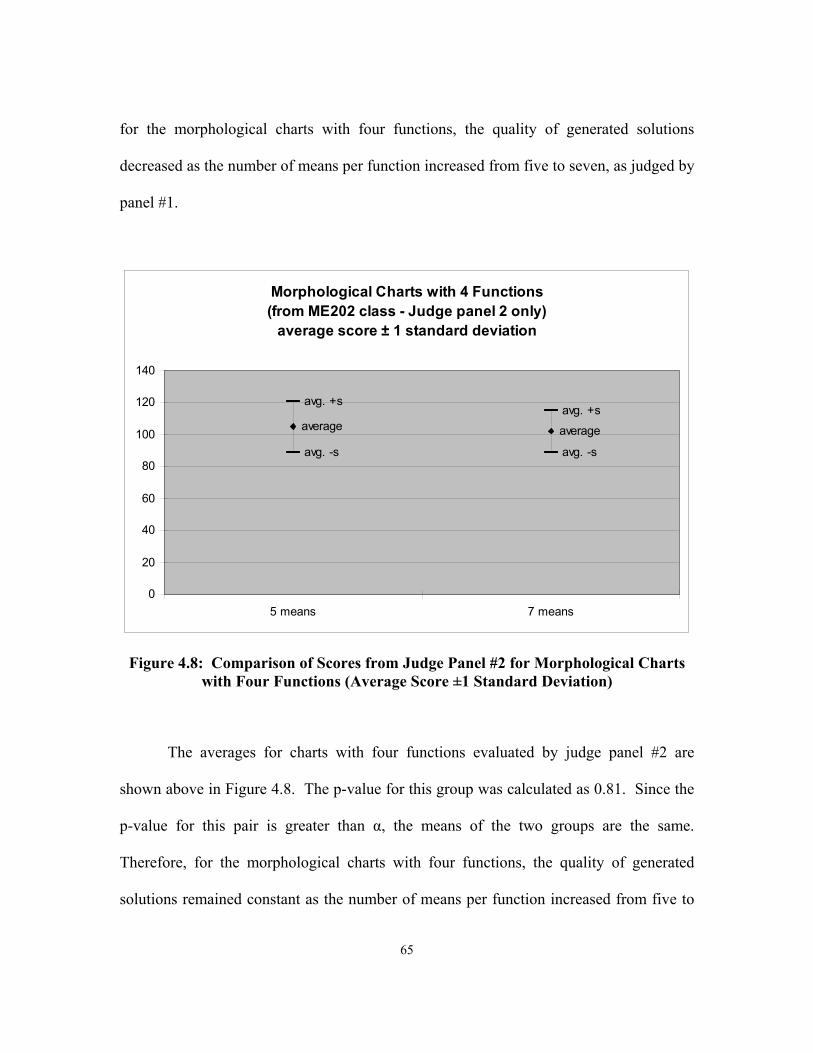
65
for the morphological charts with four functions, the quality of generated solutions
decreased as the number of means per function increased from five to seven, as judged by
panel #1.
Morphological Charts with 4 Functions(from ME202 class - Judge panel 2 only)
average score ± 1 standard deviation
avg. +savg. +s
avg. -s avg. -s
average average
0
20
40
60
80
100
120
140
5 means 7 means
Figure 4.8: Comparison of Scores from Judge Panel #2 for Morphological Charts with Four Functions (Average Score ±1 Standard Deviation)
The averages for charts with four functions evaluated by judge panel #2 are
shown above in Figure 4.8. The p-value for this group was calculated as 0.81. Since the
p-value for this pair is greater than α, the means of the two groups are the same.
Therefore, for the morphological charts with four functions, the quality of generated
solutions remained constant as the number of means per function increased from five to
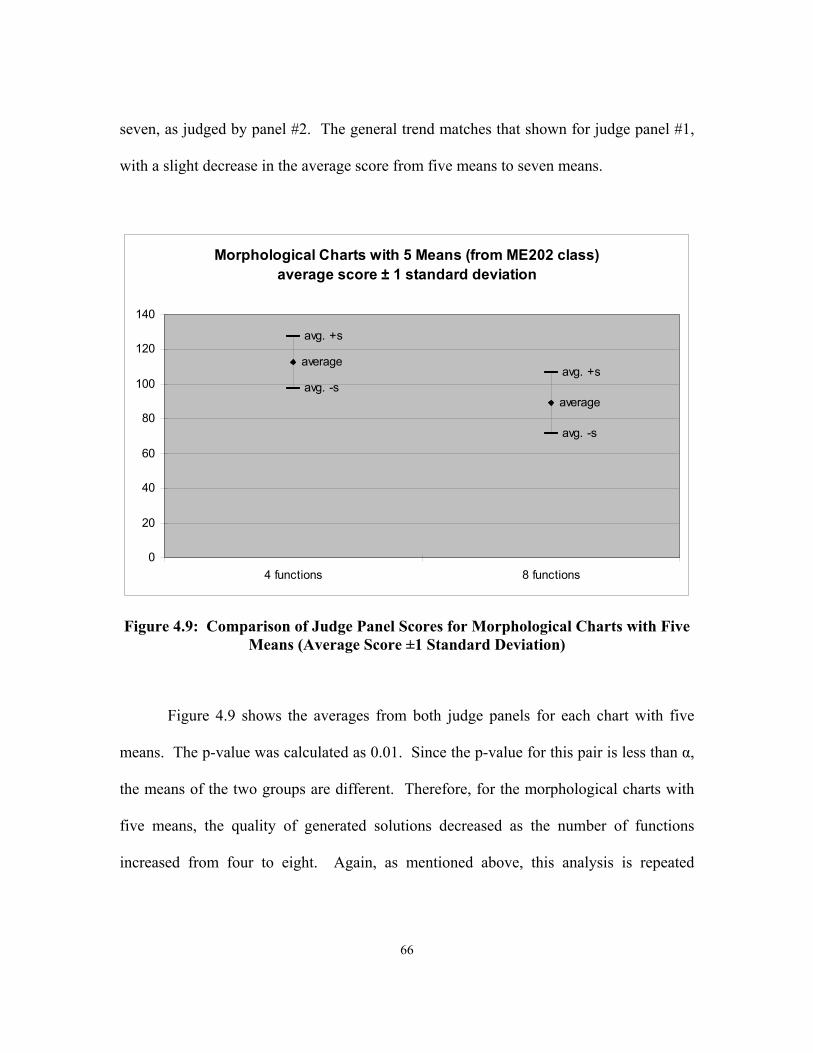
66
seven, as judged by panel #2. The general trend matches that shown for judge panel #1,
with a slight decrease in the average score from five means to seven means.
Morphological Charts with 5 Means (from ME202 class)average score ± 1 standard deviation
avg. +s
avg. +savg. -s
avg. -s
average
average
0
20
40
60
80
100
120
140
4 functions 8 functions
Figure 4.9: Comparison of Judge Panel Scores for Morphological Charts with Five Means (Average Score ±1 Standard Deviation)
Figure 4.9 shows the averages from both judge panels for each chart with five
means. The p-value was calculated as 0.01. Since the p-value for this pair is less than α,
the means of the two groups are different. Therefore, for the morphological charts with
five means, the quality of generated solutions decreased as the number of functions
increased from four to eight. Again, as mentioned above, this analysis is repeated
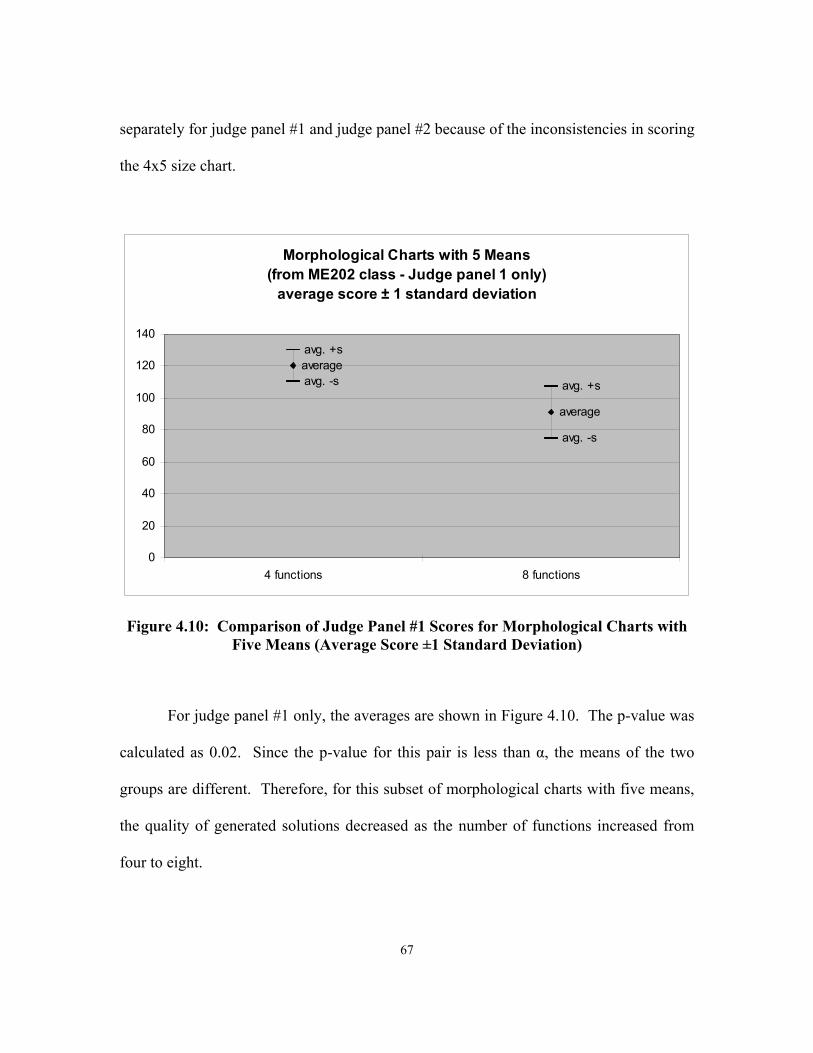
67
separately for judge panel #1 and judge panel #2 because of the inconsistencies in scoring
the 4x5 size chart.
Morphological Charts with 5 Means(from ME202 class - Judge panel 1 only)
average score ± 1 standard deviation
avg. +s
avg. +savg. -s
avg. -s
average
average
0
20
40
60
80
100
120
140
4 functions 8 functions
Figure 4.10: Comparison of Judge Panel #1 Scores for Morphological Charts with Five Means (Average Score ±1 Standard Deviation)
For judge panel #1 only, the averages are shown in Figure 4.10. The p-value was
calculated as 0.02. Since the p-value for this pair is less than α, the means of the two
groups are different. Therefore, for this subset of morphological charts with five means,
the quality of generated solutions decreased as the number of functions increased from
four to eight.
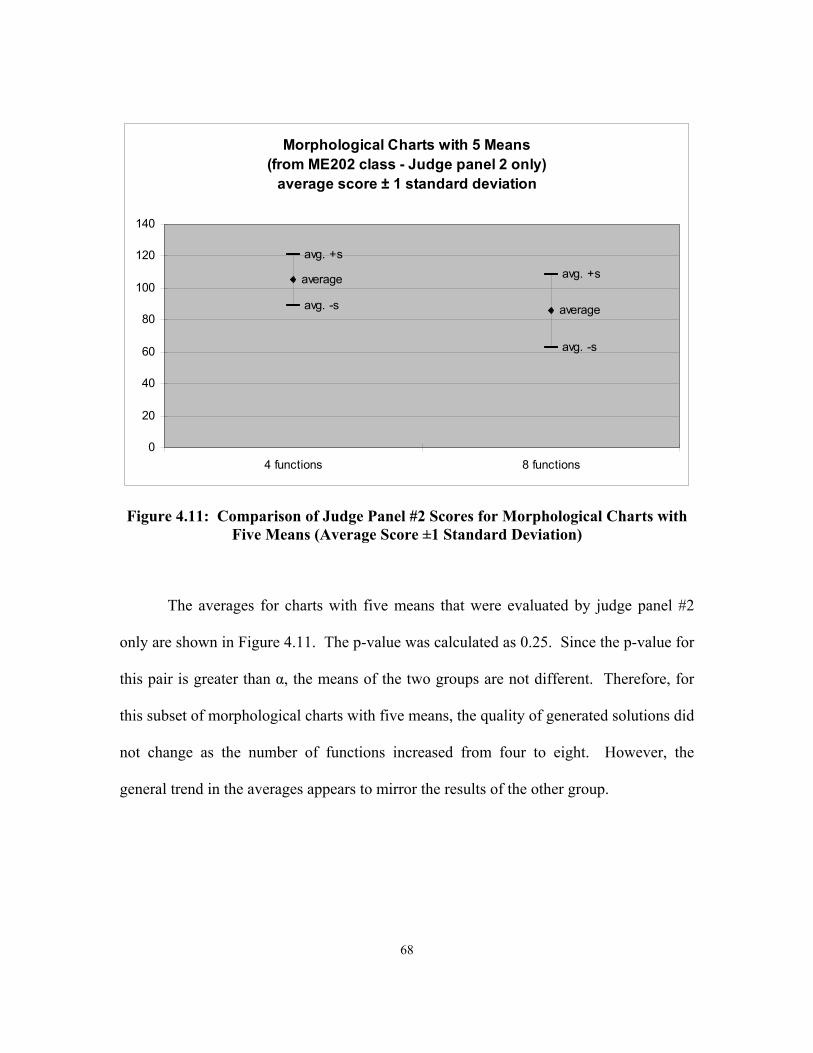
68
Morphological Charts with 5 Means(from ME202 class - Judge panel 2 only)
average score ± 1 standard deviation
avg. +savg. +s
avg. -s
avg. -s
average
average
0
20
40
60
80
100
120
140
4 functions 8 functions
Figure 4.11: Comparison of Judge Panel #2 Scores for Morphological Charts with Five Means (Average Score ±1 Standard Deviation)
The averages for charts with five means that were evaluated by judge panel #2
only are shown in Figure 4.11. The p-value was calculated as 0.25. Since the p-value for
this pair is greater than α, the means of the two groups are not different. Therefore, for
this subset of morphological charts with five means, the quality of generated solutions did
not change as the number of functions increased from four to eight. However, the
general trend in the averages appears to mirror the results of the other group.
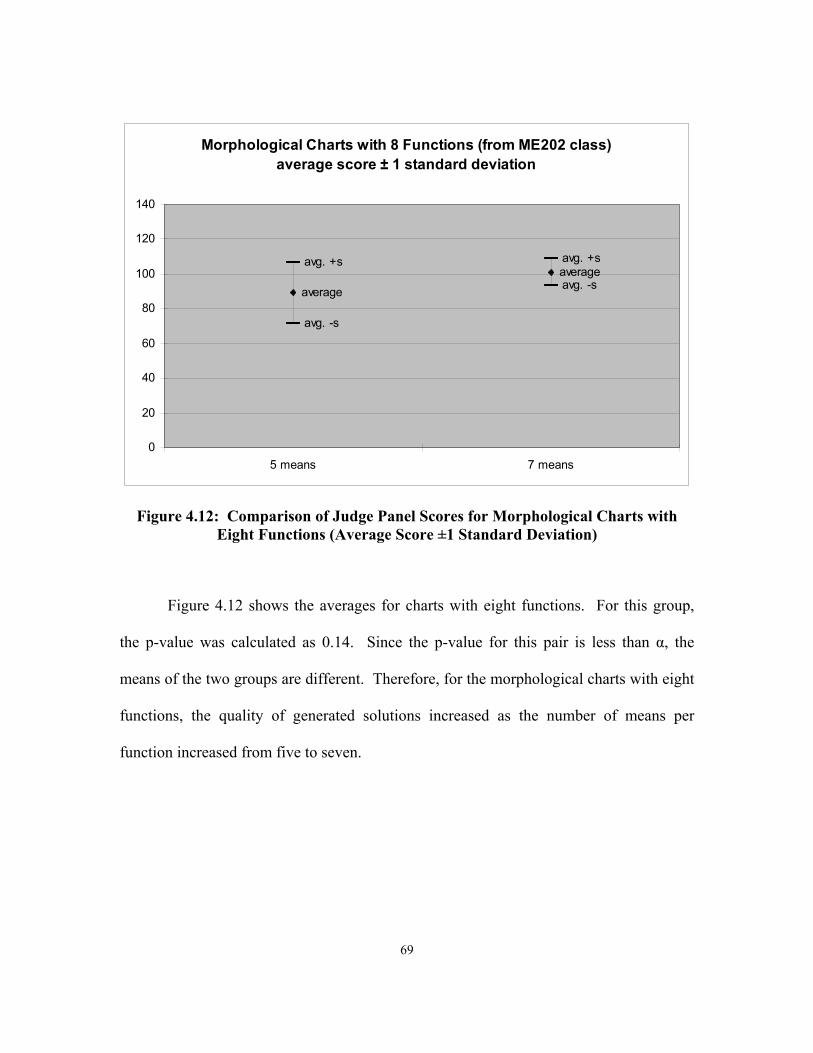
69
Morphological Charts with 8 Functions (from ME202 class)average score ± 1 standard deviation
avg. +s avg. +s
avg. -s
avg. -saverage
average
0
20
40
60
80
100
120
140
5 means 7 means
Figure 4.12: Comparison of Judge Panel Scores for Morphological Charts with Eight Functions (Average Score ±1 Standard Deviation)
Figure 4.12 shows the averages for charts with eight functions. For this group,
the p-value was calculated as 0.14. Since the p-value for this pair is less than α, the
means of the two groups are different. Therefore, for the morphological charts with eight
functions, the quality of generated solutions increased as the number of means per
function increased from five to seven.
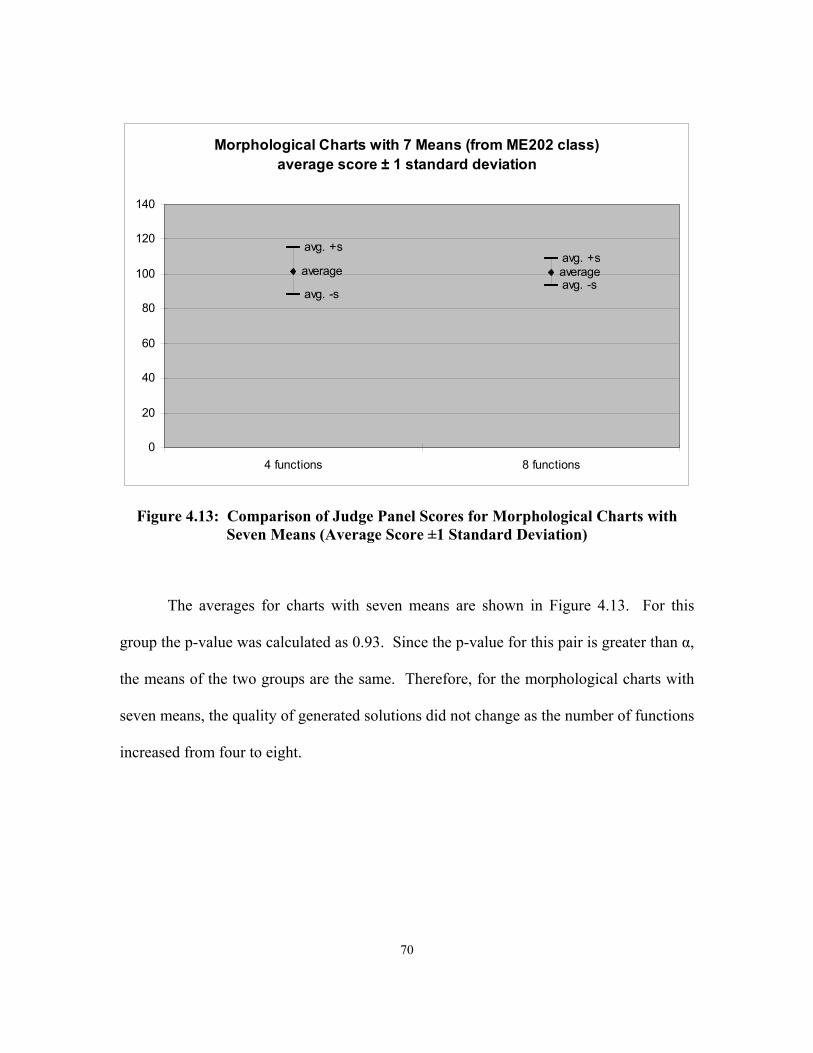
70
Morphological Charts with 7 Means (from ME202 class)average score ± 1 standard deviation
avg. +savg. +s
avg. -savg. -s
average average
0
20
40
60
80
100
120
140
4 functions 8 functions
Figure 4.13: Comparison of Judge Panel Scores for Morphological Charts with Seven Means (Average Score ±1 Standard Deviation)
The averages for charts with seven means are shown in Figure 4.13. For this
group the p-value was calculated as 0.93. Since the p-value for this pair is greater than α,
the means of the two groups are the same. Therefore, for the morphological charts with
seven means, the quality of generated solutions did not change as the number of functions
increased from four to eight.
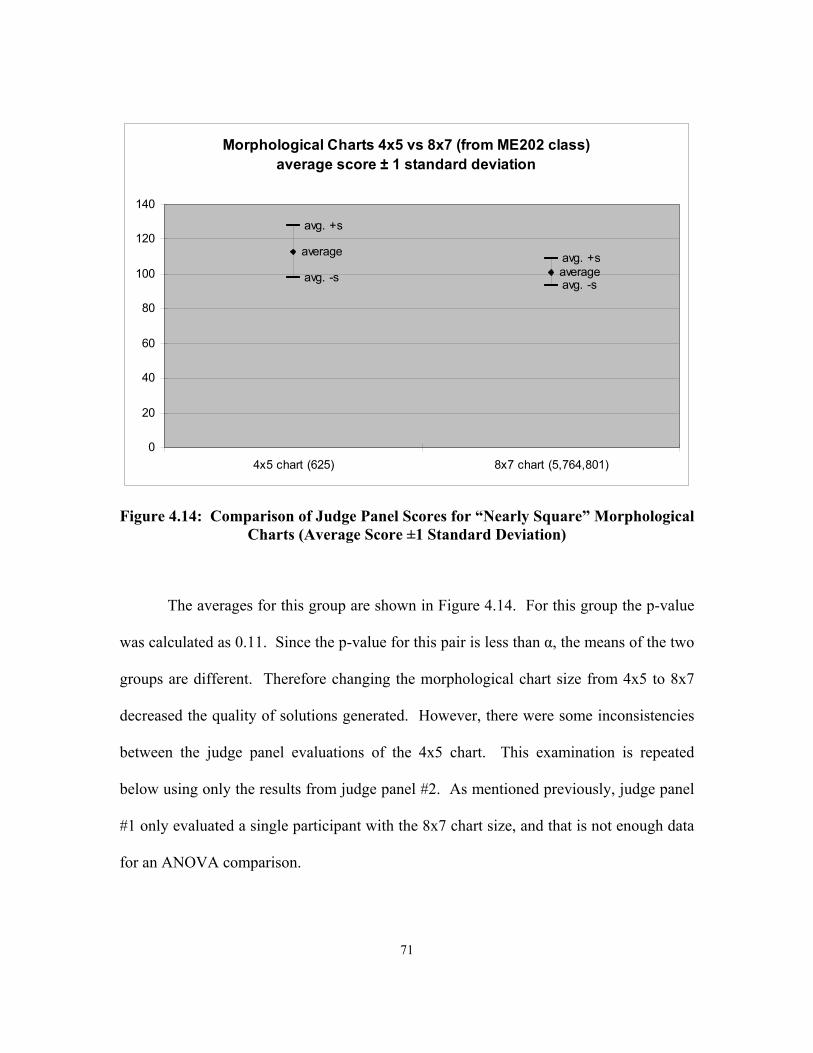
71
Morphological Charts 4x5 vs 8x7 (from ME202 class)average score ± 1 standard deviation
avg. +s
avg. +savg. -s avg. -s
average
average
0
20
40
60
80
100
120
140
4x5 chart (625) 8x7 chart (5,764,801)
Figure 4.14: Comparison of Judge Panel Scores for “Nearly Square” Morphological Charts (Average Score ±1 Standard Deviation)
The averages for this group are shown in Figure 4.14. For this group the p-value
was calculated as 0.11. Since the p-value for this pair is less than α, the means of the two
groups are different. Therefore changing the morphological chart size from 4x5 to 8x7
decreased the quality of solutions generated. However, there were some inconsistencies
between the judge panel evaluations of the 4x5 chart. This examination is repeated
below using only the results from judge panel #2. As mentioned previously, judge panel
#1 only evaluated a single participant with the 8x7 chart size, and that is not enough data
for an ANOVA comparison.

72
Morphological Charts 4x5 vs 8x7(from ME202 class - Judge panel 2 only)
average score ± 1 standard deviation
avg. +savg. +s
avg. -s avg. -s
average average
0
20
40
60
80
100
120
140
4x5 chart (625) 8x7 chart (5,764,801)
Figure 4.15: Comparison of Judge Panel #2 Scores for “Nearly Square” Morphological Charts (Average Score ±1 Standard Deviation)
Figure 4.15 shows the averages for the 4x5 and 8x7 size charts as evaluated by
judge panel #2. For this group the p-value was calculated as 0.62. Since the p-value for
this pair is greater than α, the means of the two groups are not different. Therefore
changing the morphological chart size from 4x5 to 8x7 did not change the quality of
solutions generated, as evaluated by judge panel #2.
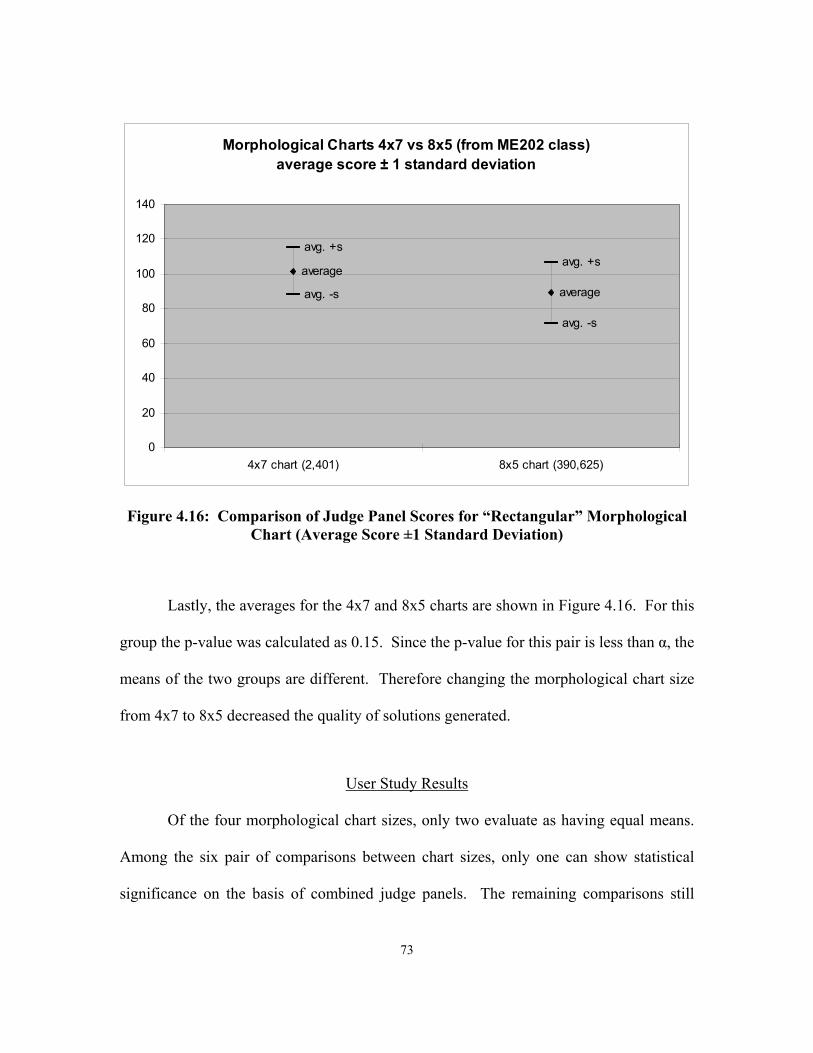
73
Morphological Charts 4x7 vs 8x5 (from ME202 class)average score ± 1 standard deviation
avg. +savg. +s
avg. -s
avg. -s
average
average
0
20
40
60
80
100
120
140
4x7 chart (2,401) 8x5 chart (390,625)
Figure 4.16: Comparison of Judge Panel Scores for “Rectangular” Morphological Chart (Average Score ±1 Standard Deviation)
Lastly, the averages for the 4x7 and 8x5 charts are shown in Figure 4.16. For this
group the p-value was calculated as 0.15. Since the p-value for this pair is less than α, the
means of the two groups are different. Therefore changing the morphological chart size
from 4x7 to 8x5 decreased the quality of solutions generated.
User Study Results
Of the four morphological chart sizes, only two evaluate as having equal means.
Among the six pair of comparisons between chart sizes, only one can show statistical
significance on the basis of combined judge panels. The remaining comparisons still
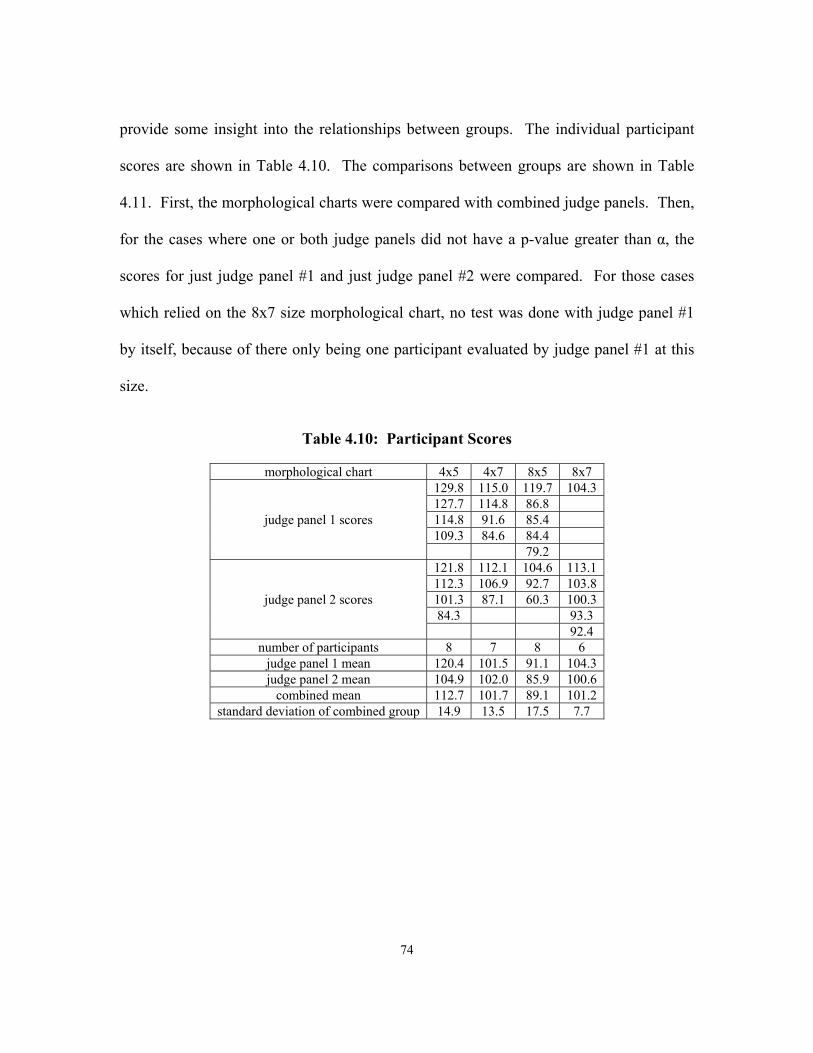
74
provide some insight into the relationships between groups. The individual participant
scores are shown in Table 4.10. The comparisons between groups are shown in Table
4.11. First, the morphological charts were compared with combined judge panels. Then,
for the cases where one or both judge panels did not have a p-value greater than α, the
scores for just judge panel #1 and just judge panel #2 were compared. For those cases
which relied on the 8x7 size morphological chart, no test was done with judge panel #1
by itself, because of there only being one participant evaluated by judge panel #1 at this
size.
Table 4.10: Participant Scores
morphological chart 4x5 4x7 8x5 8x7 129.8 115.0 119.7 104.3 127.7 114.8 86.8
judge panel 1 scores 114.8 91.6 85.4 109.3 84.6 84.4 79.2 121.8 112.1 104.6 113.1 112.3 106.9 92.7 103.8
judge panel 2 scores 101.3 87.1 60.3 100.3 84.3 93.3 92.4
number of participants 8 7 8 6 judge panel 1 mean 120.4 101.5 91.1 104.3 judge panel 2 mean 104.9 102.0 85.9 100.6
combined mean 112.7 101.7 89.1 101.2 standard deviation of combined group 14.9 13.5 17.5 7.7
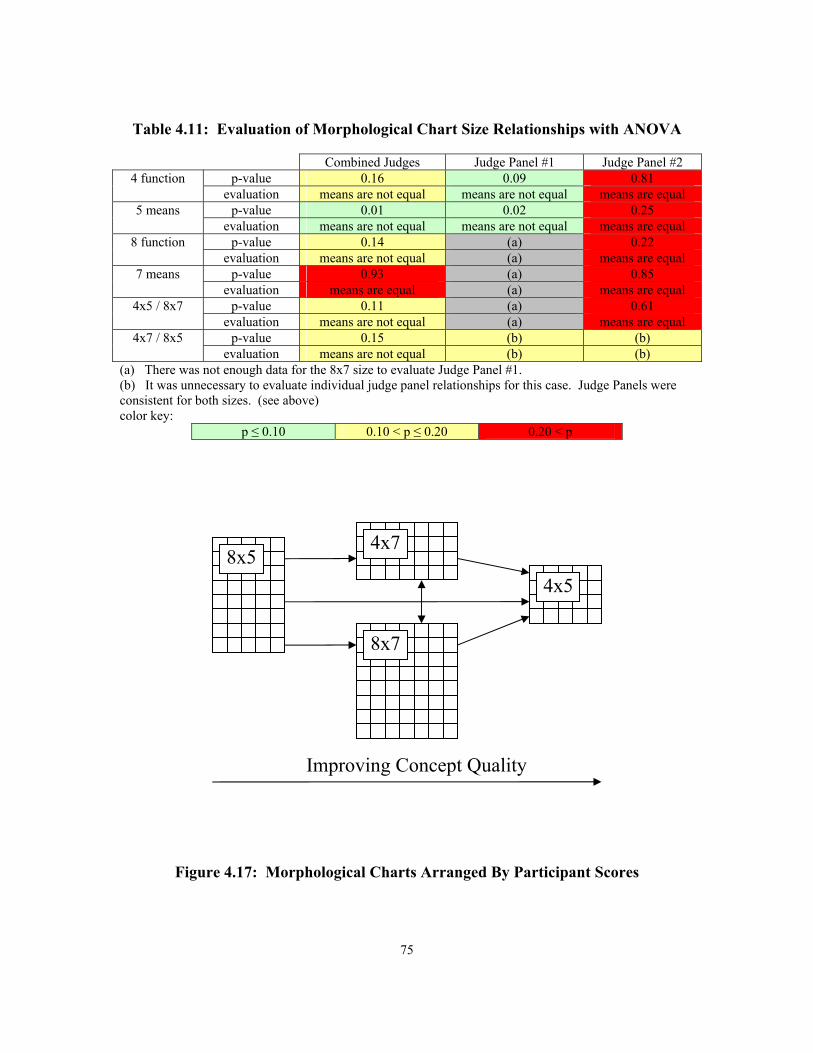
75
Table 4.11: Evaluation of Morphological Chart Size Relationships with ANOVA
Combined Judges Judge Panel #1 Judge Panel #2 4 function p-value 0.16 0.09 0.81
evaluation means are not equal means are not equal means are equal 5 means p-value 0.01 0.02 0.25
evaluation means are not equal means are not equal means are equal 8 function p-value 0.14 (a) 0.22
evaluation means are not equal (a) means are equal 7 means p-value 0.93 (a) 0.85
evaluation means are equal (a) means are equal 4x5 / 8x7 p-value 0.11 (a) 0.61
evaluation means are not equal (a) means are equal 4x7 / 8x5 p-value 0.15 (b) (b)
evaluation means are not equal (b) (b) (a) There was not enough data for the 8x7 size to evaluate Judge Panel #1. (b) It was unnecessary to evaluate individual judge panel relationships for this case. Judge Panels were consistent for both sizes. (see above) color key:
p ≤ 0.10 0.10 < p ≤ 0.20 0.20 < p
Figure 4.17: Morphological Charts Arranged By Participant Scores
Improving Concept Quality
8x5 4x7
8x7
4x5
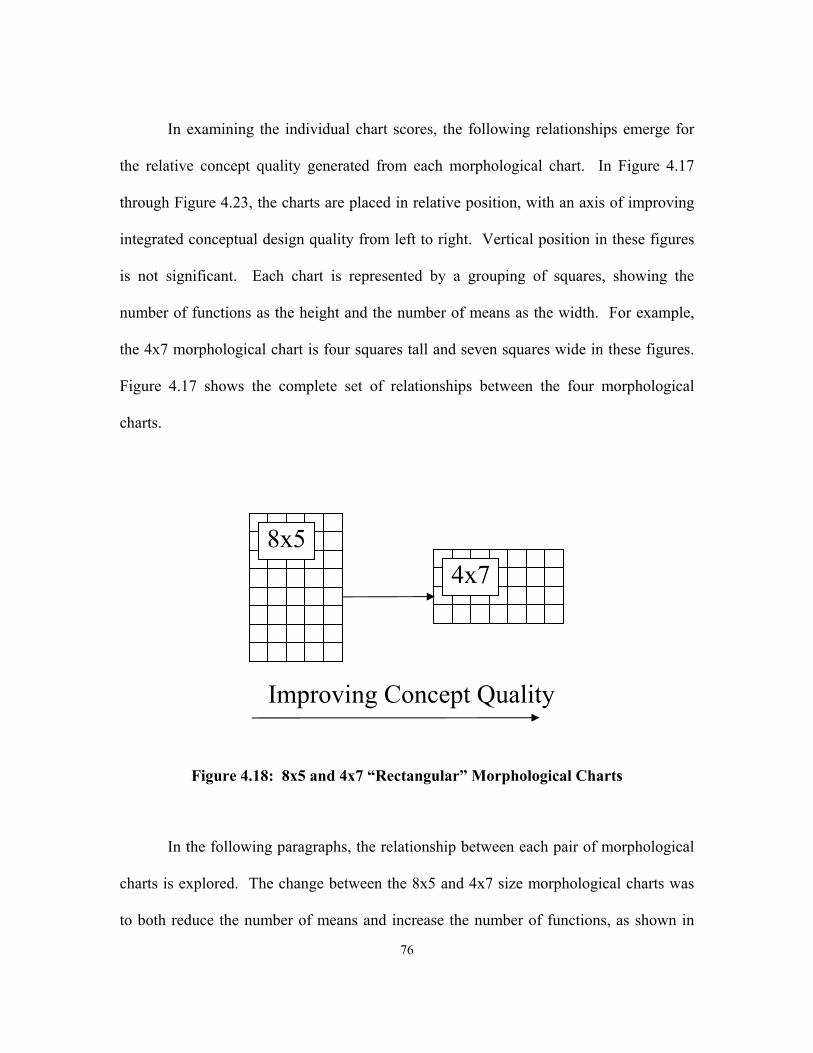
76
In examining the individual chart scores, the following relationships emerge for
the relative concept quality generated from each morphological chart. In Figure 4.17
through Figure 4.23, the charts are placed in relative position, with an axis of improving
integrated conceptual design quality from left to right. Vertical position in these figures
is not significant. Each chart is represented by a grouping of squares, showing the
number of functions as the height and the number of means as the width. For example,
the 4x7 morphological chart is four squares tall and seven squares wide in these figures.
Figure 4.17 shows the complete set of relationships between the four morphological
charts.
Figure 4.18: 8x5 and 4x7 “Rectangular” Morphological Charts
In the following paragraphs, the relationship between each pair of morphological
charts is explored. The change between the 8x5 and 4x7 size morphological charts was
to both reduce the number of means and increase the number of functions, as shown in
Improving Concept Quality
8x5 4x7
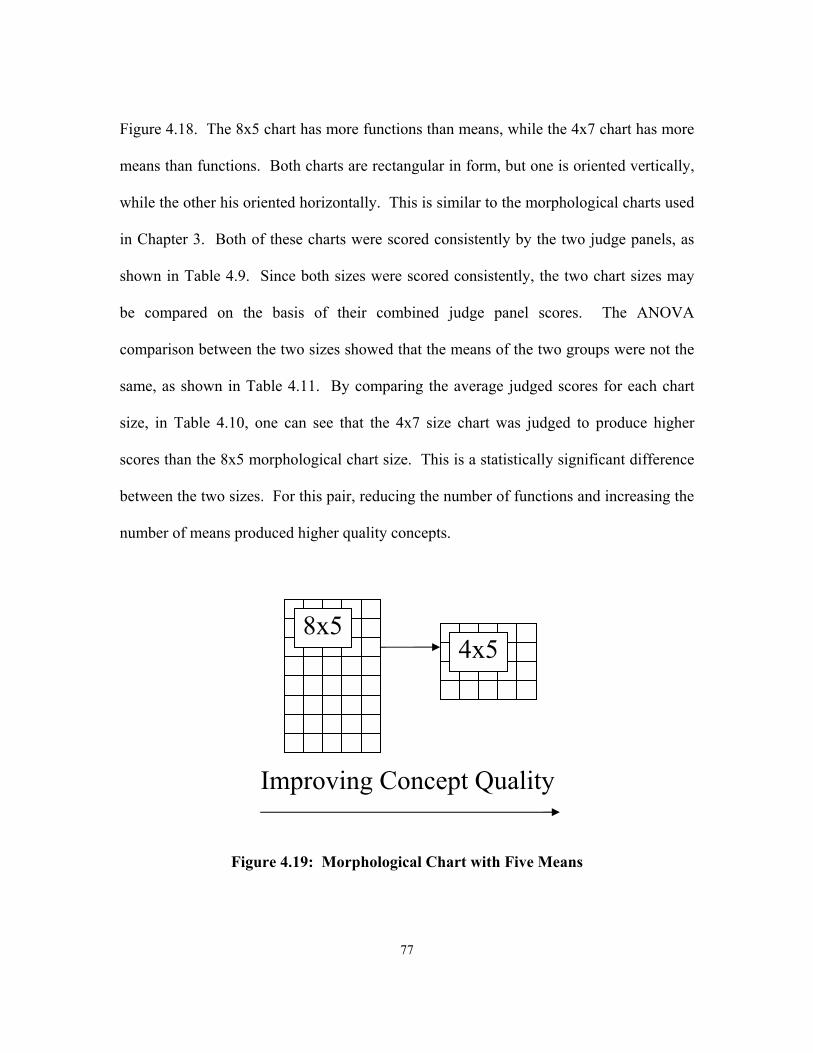
77
Figure 4.18. The 8x5 chart has more functions than means, while the 4x7 chart has more
means than functions. Both charts are rectangular in form, but one is oriented vertically,
while the other his oriented horizontally. This is similar to the morphological charts used
in Chapter 3. Both of these charts were scored consistently by the two judge panels, as
shown in Table 4.9. Since both sizes were scored consistently, the two chart sizes may
be compared on the basis of their combined judge panel scores. The ANOVA
comparison between the two sizes showed that the means of the two groups were not the
same, as shown in Table 4.11. By comparing the average judged scores for each chart
size, in Table 4.10, one can see that the 4x7 size chart was judged to produce higher
scores than the 8x5 morphological chart size. This is a statistically significant difference
between the two sizes. For this pair, reducing the number of functions and increasing the
number of means produced higher quality concepts.
Figure 4.19: Morphological Chart with Five Means
Improving Concept Quality
8x54x5
78
The change between the two morphological charts with five means was to change
the number of functions while holding the number of means constant, as shown in Figure
4.19. Only the 8x5 size morphological chart was scored consistently by the two judge
panels, as shown in Table 4.9. Therefore, a statistically significant ANOVA comparison
between the two sizes cannot be made only on the basis of the combined judge panel
scores (Daniel and Terrell, 1995). The ANOVA test for the combined groups showed
that the means were not the same, as is shown in Table 4.11. For judge panel #1, the
means were also not found to be the same, however for judge panel #2, there was no
difference found between the two chart sizes. A statistically significant comparison
cannot be made between these two sizes. Based on the average scores alone, shown in
Table 4.10, there does appear to be an improvement between the two sizes. Reducing the
number of functions at a low level of means may improve the quality of concepts
generated with morphological charts.
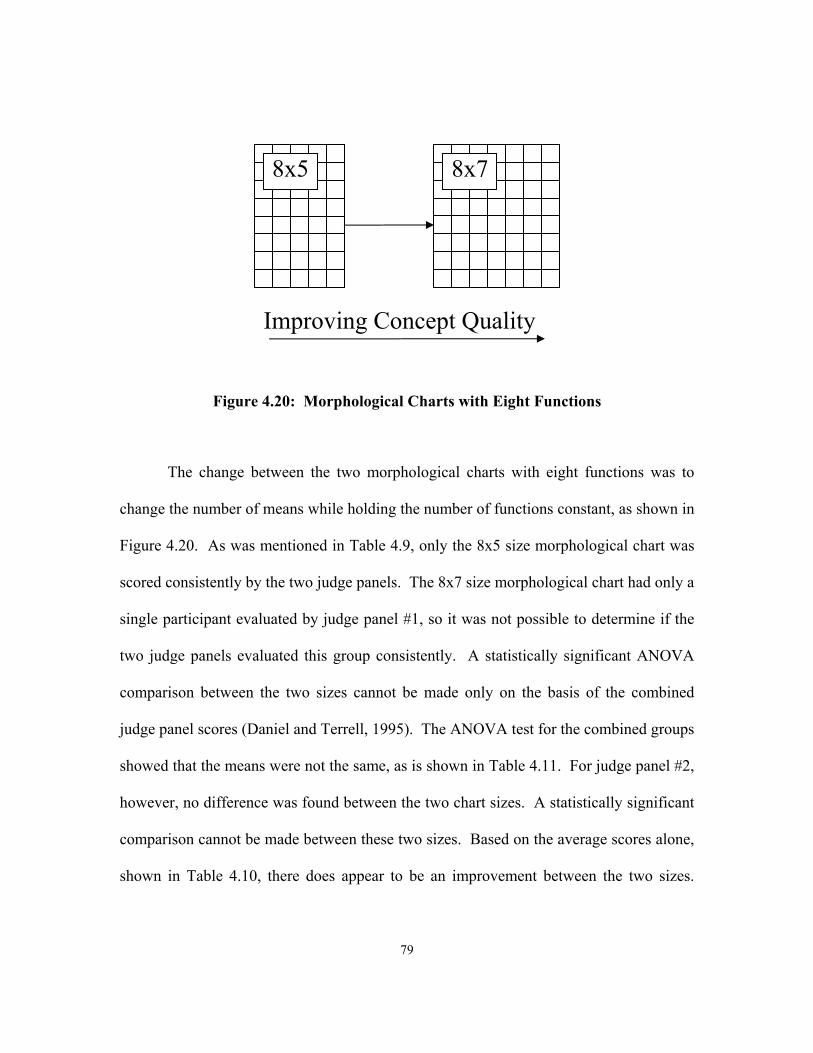
79
Figure 4.20: Morphological Charts with Eight Functions
The change between the two morphological charts with eight functions was to
change the number of means while holding the number of functions constant, as shown in
Figure 4.20. As was mentioned in Table 4.9, only the 8x5 size morphological chart was
scored consistently by the two judge panels. The 8x7 size morphological chart had only a
single participant evaluated by judge panel #1, so it was not possible to determine if the
two judge panels evaluated this group consistently. A statistically significant ANOVA
comparison between the two sizes cannot be made only on the basis of the combined
judge panel scores (Daniel and Terrell, 1995). The ANOVA test for the combined groups
showed that the means were not the same, as is shown in Table 4.11. For judge panel #2,
however, no difference was found between the two chart sizes. A statistically significant
comparison cannot be made between these two sizes. Based on the average scores alone,
shown in Table 4.10, there does appear to be an improvement between the two sizes.
Improving Concept Quality
8x5 8x7
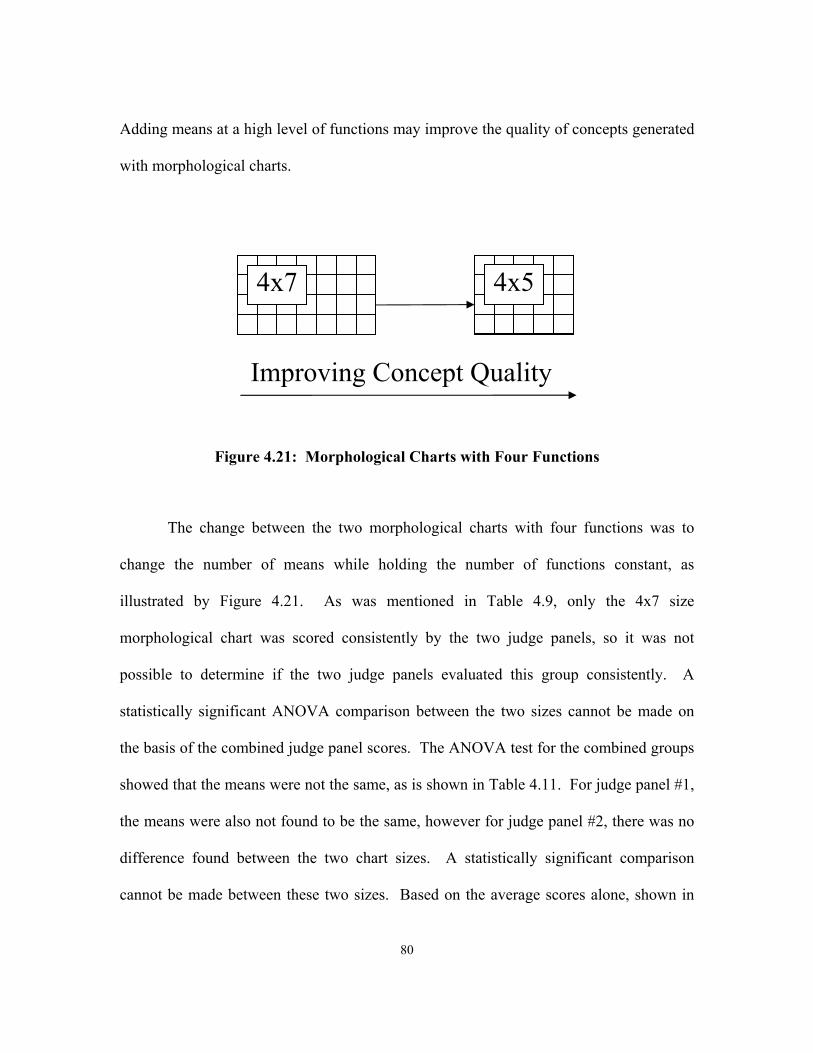
80
Adding means at a high level of functions may improve the quality of concepts generated
with morphological charts.
Figure 4.21: Morphological Charts with Four Functions
The change between the two morphological charts with four functions was to
change the number of means while holding the number of functions constant, as
illustrated by Figure 4.21. As was mentioned in Table 4.9, only the 4x7 size
morphological chart was scored consistently by the two judge panels, so it was not
possible to determine if the two judge panels evaluated this group consistently. A
statistically significant ANOVA comparison between the two sizes cannot be made on
the basis of the combined judge panel scores. The ANOVA test for the combined groups
showed that the means were not the same, as is shown in Table 4.11. For judge panel #1,
the means were also not found to be the same, however for judge panel #2, there was no
difference found between the two chart sizes. A statistically significant comparison
cannot be made between these two sizes. Based on the average scores alone, shown in
Improving Concept Quality
4x7 4x5
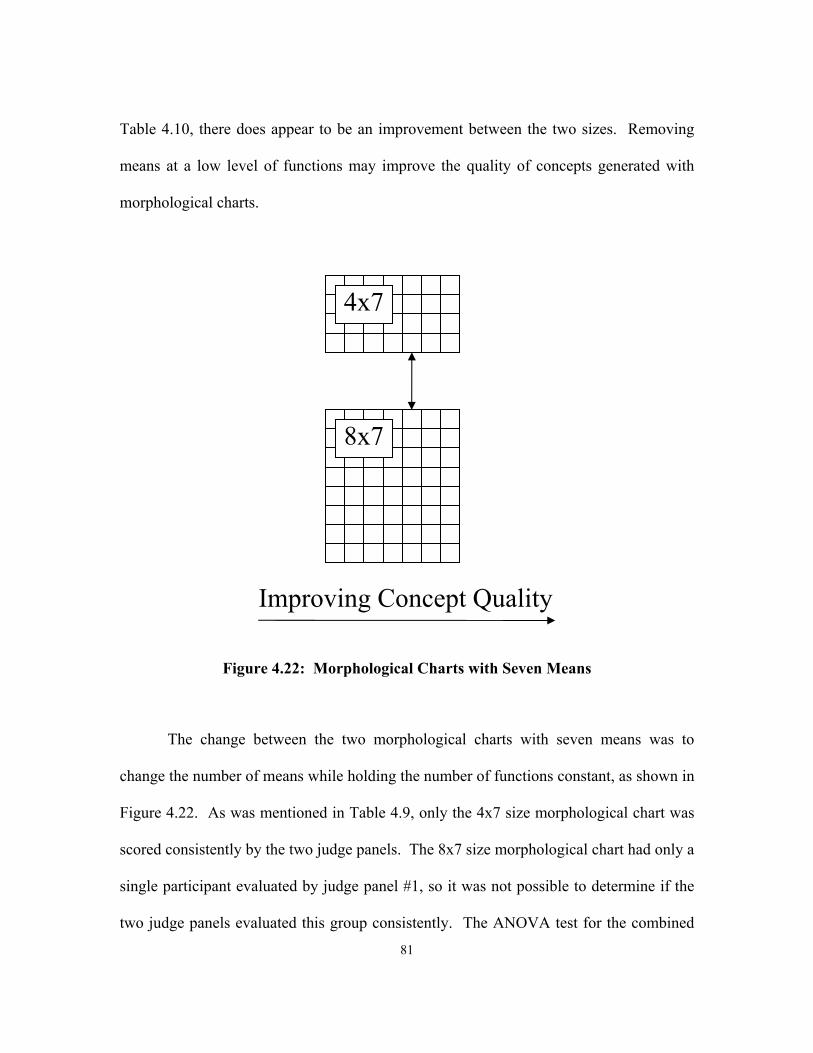
81
Table 4.10, there does appear to be an improvement between the two sizes. Removing
means at a low level of functions may improve the quality of concepts generated with
morphological charts.
Figure 4.22: Morphological Charts with Seven Means
The change between the two morphological charts with seven means was to
change the number of means while holding the number of functions constant, as shown in
Figure 4.22. As was mentioned in Table 4.9, only the 4x7 size morphological chart was
scored consistently by the two judge panels. The 8x7 size morphological chart had only a
single participant evaluated by judge panel #1, so it was not possible to determine if the
two judge panels evaluated this group consistently. The ANOVA test for the combined
Improving Concept Quality
4x7
8x7
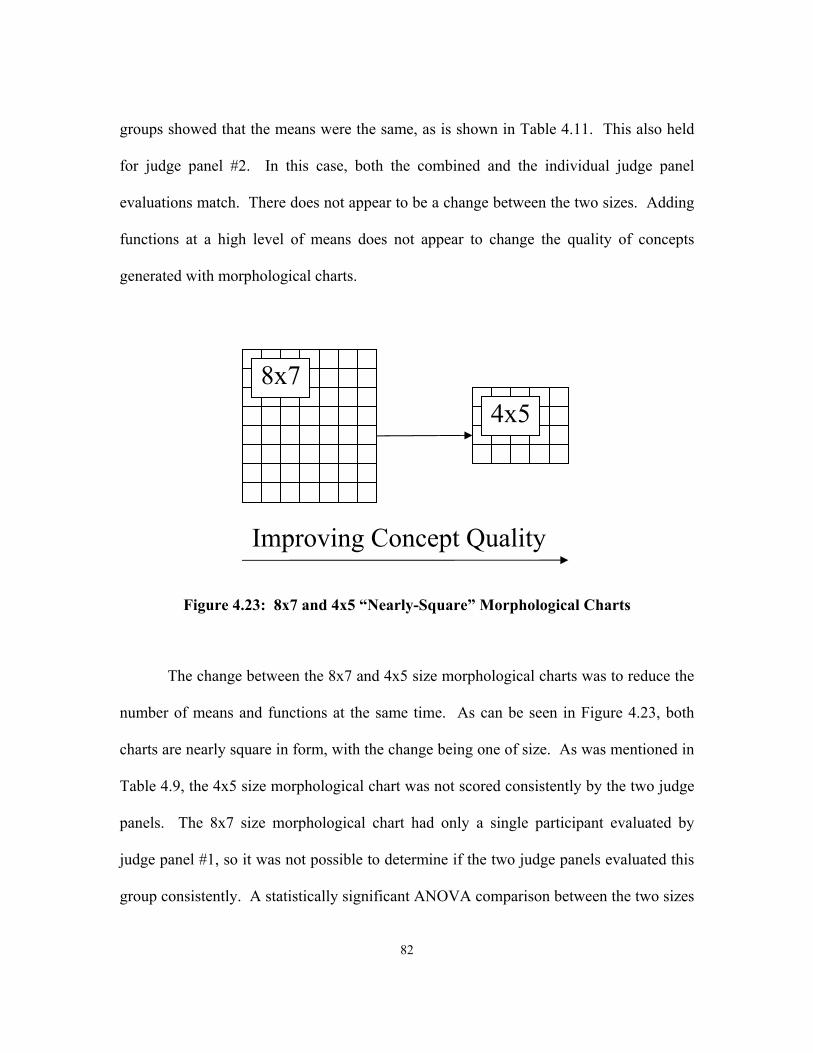
82
groups showed that the means were the same, as is shown in Table 4.11. This also held
for judge panel #2. In this case, both the combined and the individual judge panel
evaluations match. There does not appear to be a change between the two sizes. Adding
functions at a high level of means does not appear to change the quality of concepts
generated with morphological charts.
Figure 4.23: 8x7 and 4x5 “Nearly-Square” Morphological Charts
The change between the 8x7 and 4x5 size morphological charts was to reduce the
number of means and functions at the same time. As can be seen in Figure 4.23, both
charts are nearly square in form, with the change being one of size. As was mentioned in
Table 4.9, the 4x5 size morphological chart was not scored consistently by the two judge
panels. The 8x7 size morphological chart had only a single participant evaluated by
judge panel #1, so it was not possible to determine if the two judge panels evaluated this
group consistently. A statistically significant ANOVA comparison between the two sizes
Improving Concept Quality
8x7 4x5
83
cannot be made only on the basis of the combined judge panel scores (Daniel and Terrell,
1995). The ANOVA test for the combined groups showed that the means were not the
same, as is shown in Table 4.11. For judge panel #2, however, no difference was found
between the two chart sizes. A statistically significant comparison cannot be made
between these two sizes. Based on the average scores alone, shown in Table 4.10, there
does appear to be an improvement between the two sizes. Reducing the number of means
and functions together may improve the quality of concepts generated with
morphological charts.
Discussion
This second study investigated the quality of integrated conceptual design
solutions created by designers evaluating four different morphological charts. These
morphological charts were prepared for the same pet feeder design problem. The
morphological charts had either four or eight functions. The charts had either five or
seven means per function. The smallest chart contained 625 concepts, while the largest
contained over five million.
The smallest morphological chart, the 4x5, produced the highest quality integrated
conceptual design solutions. The lowest quality solutions came from the 8x5 chart. The
4x7 and 8x7 size charts produced concepts of nearly the same quality.
The jury system may have impacted the analysis of this experiment. In an attempt
to streamline the jury system, the concepts were split in between jury panels.
Unfortunately, the division of concepts resulted in insufficient overlap for the 8x7
84
morphological chart size between the two judge panels. This may have skewed the
results involving the 8x7 morphological chart.
The results of this study suggested some general directions for how to improve
the ability of a designer to generate useful concepts from a morphological chart.
Removing functions from consideration either improved the concepts generated, or at
least was a neutral effect. If the morphological chart has many more functions than
means, such as the 8x5 chart, it can be improved by adding means. However if the chart
is more square, or has more means than functions, it can be improved by removing
means. This experiment found a statistically significant relationship similar to the
previous chapter between the two “rectangular” morphological charts. Once again, a
chart with more means than functions was found to be better than a chart with more
functions that means. There is a more complex relationship at work than merely reducing
the pool of possible integrated conceptual designs, because the chart with the largest
number, the 8x7, was not the worst chart.
85
CHAPTER 5
COMPARISON OF THE EXPERIMENTAL STUDIES
The preceding two chapters describe two similar experiments that evaluated the
impact of morphological chart size and shape on the identification of promising concepts
contained in those charts. The experiments used participants from similar populations
and followed similar procedures. This chapter compares significant aspects of the two
experiments; specifically the design problem, the design participants, the morphological
charts employed, and the experimental procedure. Furthermore, in this chapter, a critique
of the two experiments is provided and joint conclusions are drawn.
Design Problem
The design problem in the first experiment was to create a burrito folder, see page
30 of Chapter 3. The second design problem was to create a pet feeder, see page 47 of
Chapter 4. Both design problems are developed with the intent that an innovative or not
“off-the-shelf” solution is sought and therefore required novel thinking by the
participants. A summary comparison of the two design problems is shown in Table 5.1.
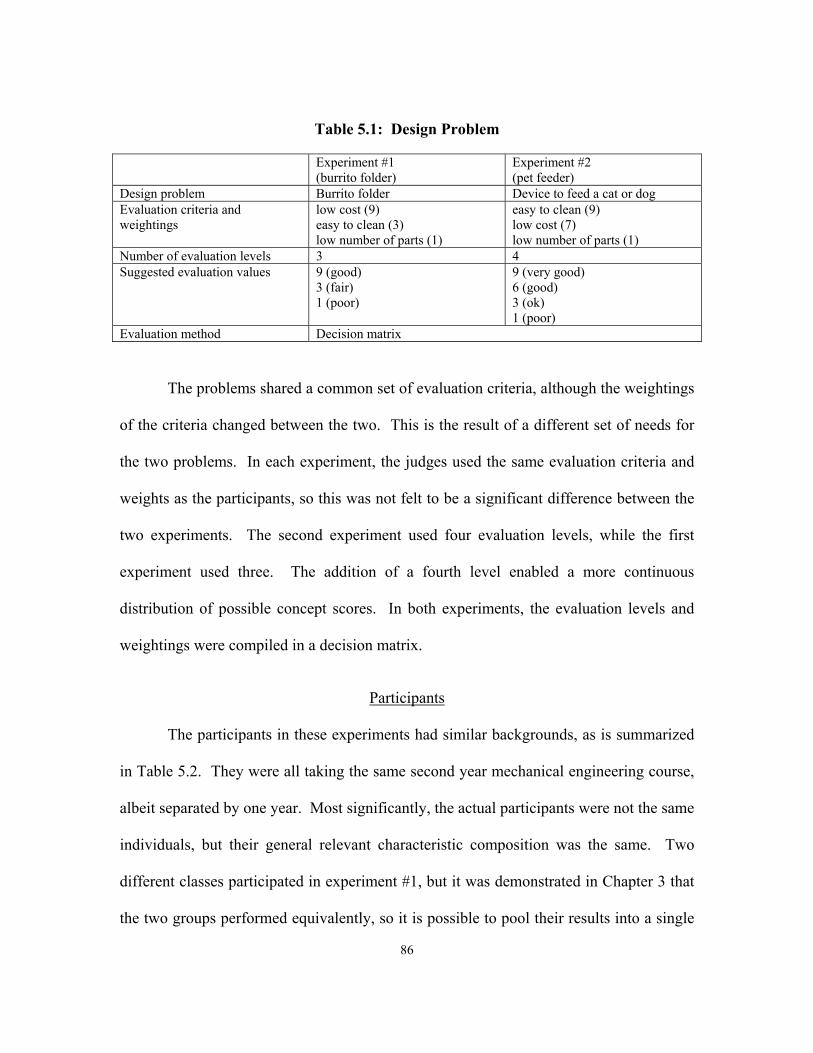
86
Table 5.1: Design Problem
Experiment #1 (burrito folder)
Experiment #2 (pet feeder)
Design problem Burrito folder Device to feed a cat or dog Evaluation criteria and weightings
low cost (9) easy to clean (3) low number of parts (1)
easy to clean (9) low cost (7) low number of parts (1)
Number of evaluation levels 3 4 Suggested evaluation values 9 (good)
3 (fair) 1 (poor)
9 (very good) 6 (good) 3 (ok) 1 (poor)
Evaluation method Decision matrix
The problems shared a common set of evaluation criteria, although the weightings
of the criteria changed between the two. This is the result of a different set of needs for
the two problems. In each experiment, the judges used the same evaluation criteria and
weights as the participants, so this was not felt to be a significant difference between the
two experiments. The second experiment used four evaluation levels, while the first
experiment used three. The addition of a fourth level enabled a more continuous
distribution of possible concept scores. In both experiments, the evaluation levels and
weightings were compiled in a decision matrix.
Participants
The participants in these experiments had similar backgrounds, as is summarized
in Table 5.2. They were all taking the same second year mechanical engineering course,
albeit separated by one year. Most significantly, the actual participants were not the same
individuals, but their general relevant characteristic composition was the same. Two
different classes participated in experiment #1, but it was demonstrated in Chapter 3 that
the two groups performed equivalently, so it is possible to pool their results into a single
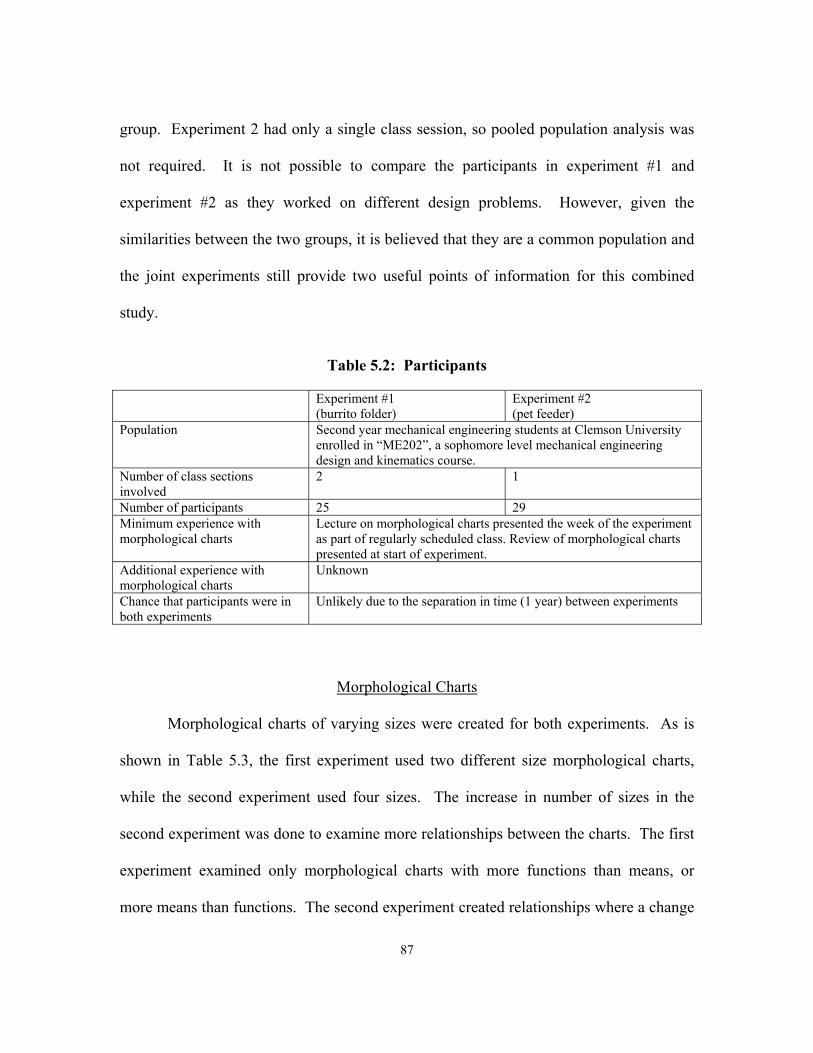
87
group. Experiment 2 had only a single class session, so pooled population analysis was
not required. It is not possible to compare the participants in experiment #1 and
experiment #2 as they worked on different design problems. However, given the
similarities between the two groups, it is believed that they are a common population and
the joint experiments still provide two useful points of information for this combined
study.
Table 5.2: Participants
Experiment #1 (burrito folder)
Experiment #2 (pet feeder)
Population Second year mechanical engineering students at Clemson University enrolled in “ME202”, a sophomore level mechanical engineering design and kinematics course.
Number of class sections involved
2 1
Number of participants 25 29 Minimum experience with morphological charts
Lecture on morphological charts presented the week of the experiment as part of regularly scheduled class. Review of morphological charts presented at start of experiment.
Additional experience with morphological charts
Unknown
Chance that participants were in both experiments
Unlikely due to the separation in time (1 year) between experiments
Morphological Charts
Morphological charts of varying sizes were created for both experiments. As is
shown in Table 5.3, the first experiment used two different size morphological charts,
while the second experiment used four sizes. The increase in number of sizes in the
second experiment was done to examine more relationships between the charts. The first
experiment examined only morphological charts with more functions than means, or
more means than functions. The second experiment created relationships where a change
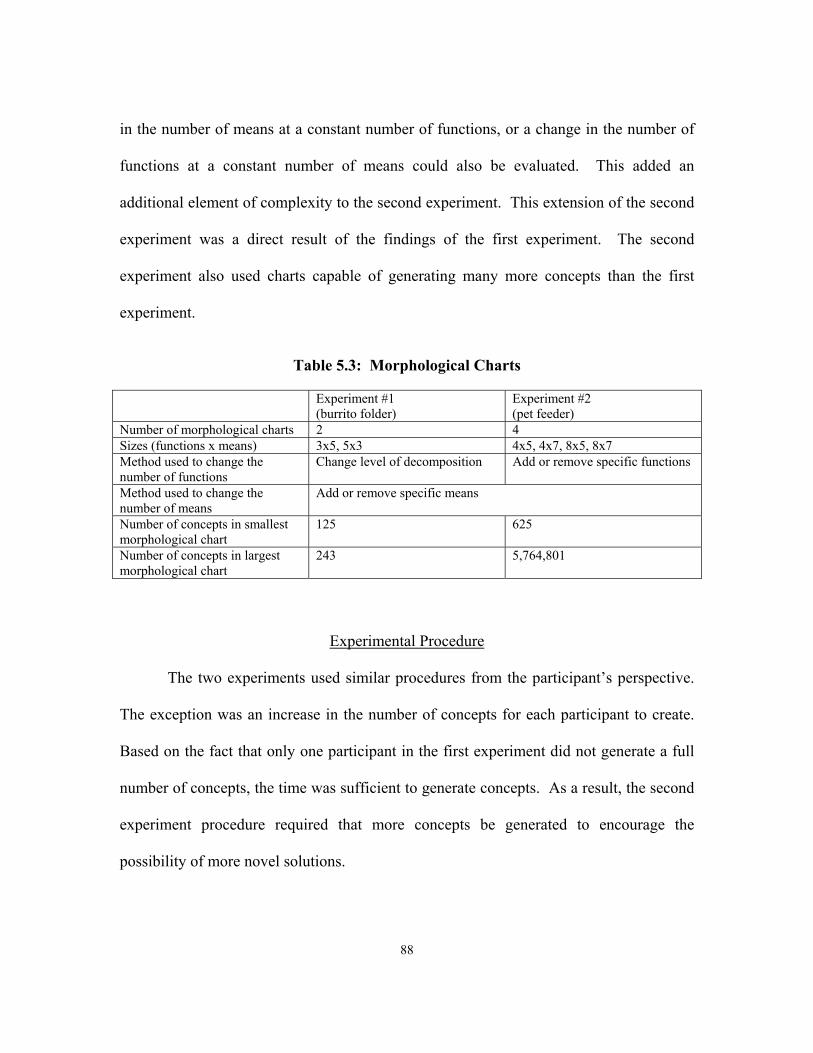
88
in the number of means at a constant number of functions, or a change in the number of
functions at a constant number of means could also be evaluated. This added an
additional element of complexity to the second experiment. This extension of the second
experiment was a direct result of the findings of the first experiment. The second
experiment also used charts capable of generating many more concepts than the first
experiment.
Table 5.3: Morphological Charts
Experiment #1 (burrito folder)
Experiment #2 (pet feeder)
Number of morphological charts 2 4 Sizes (functions x means) 3x5, 5x3 4x5, 4x7, 8x5, 8x7 Method used to change the number of functions
Change level of decomposition Add or remove specific functions
Method used to change the number of means
Add or remove specific means
Number of concepts in smallest morphological chart
125 625
Number of concepts in largest morphological chart
243 5,764,801
Experimental Procedure
The two experiments used similar procedures from the participant’s perspective.
The exception was an increase in the number of concepts for each participant to create.
Based on the fact that only one participant in the first experiment did not generate a full
number of concepts, the time was sufficient to generate concepts. As a result, the second
experiment procedure required that more concepts be generated to encourage the
possibility of more novel solutions.
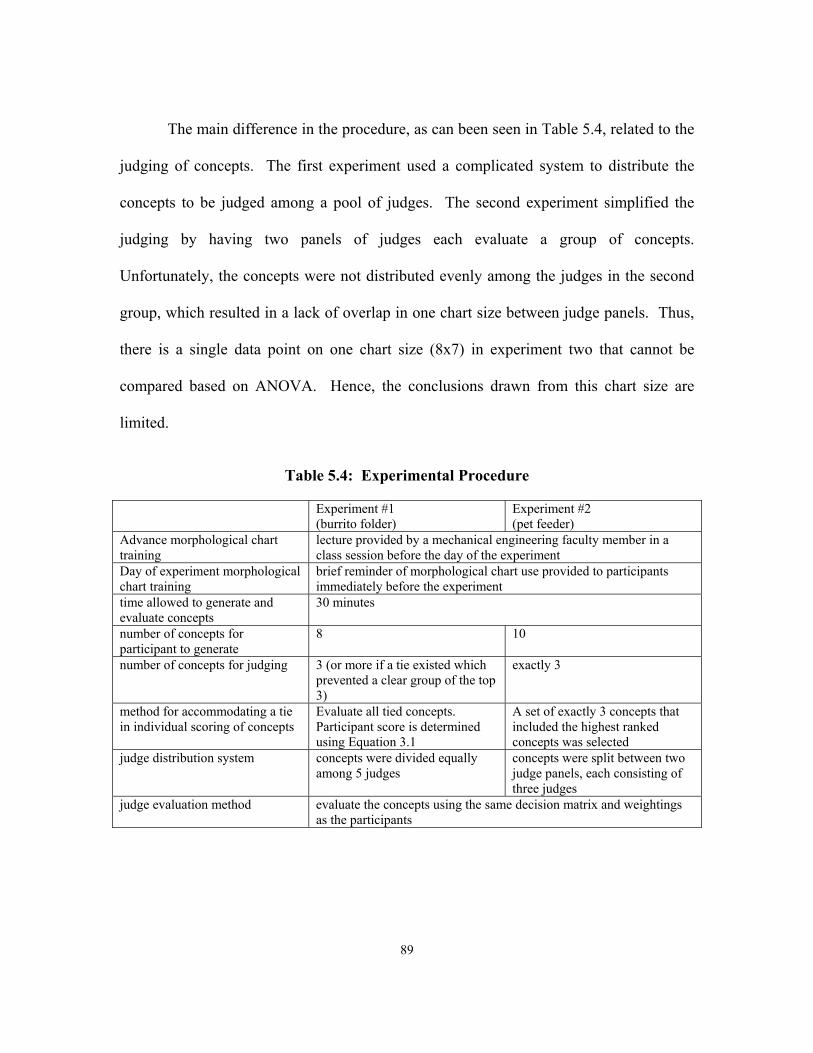
89
The main difference in the procedure, as can been seen in Table 5.4, related to the
judging of concepts. The first experiment used a complicated system to distribute the
concepts to be judged among a pool of judges. The second experiment simplified the
judging by having two panels of judges each evaluate a group of concepts.
Unfortunately, the concepts were not distributed evenly among the judges in the second
group, which resulted in a lack of overlap in one chart size between judge panels. Thus,
there is a single data point on one chart size (8x7) in experiment two that cannot be
compared based on ANOVA. Hence, the conclusions drawn from this chart size are
limited.
Table 5.4: Experimental Procedure
Experiment #1 (burrito folder)
Experiment #2 (pet feeder)
Advance morphological chart training
lecture provided by a mechanical engineering faculty member in a class session before the day of the experiment
Day of experiment morphological chart training
brief reminder of morphological chart use provided to participants immediately before the experiment
time allowed to generate and evaluate concepts
30 minutes
number of concepts for participant to generate
8 10
number of concepts for judging 3 (or more if a tie existed which prevented a clear group of the top 3)
exactly 3
method for accommodating a tie in individual scoring of concepts
Evaluate all tied concepts. Participant score is determined using Equation 3.1
A set of exactly 3 concepts that included the highest ranked concepts was selected
judge distribution system concepts were divided equally among 5 judges
concepts were split between two judge panels, each consisting of three judges
judge evaluation method evaluate the concepts using the same decision matrix and weightings as the participants
90
Discussion
Although there were some differences between the two experiments, the
similarities outweigh the differences. The second experiment builds upon the first and
they may be considered together. The most significant differences were the
morphological charts, and the change from two sizes in the first to four in the second
experiment. This was a beneficial change, because it permitted the analysis of more
relationships between the number of means and the number of functions than in the first
experiment.
The joint conclusions between the two experiments are two related general trends.
First, in both experiments, a morphological chart with fewer functions than means per
function produced higher quality integrated conceptual design solutions. This was the
only case tested in the first experiment, and the findings were repeated in the second
experiment. The second joint conclusion is that increasing the number of functions
makes choosing a good integrated conceptual design solution more difficult. In the first
experiment, reducing the number of functions improved the resulting concepts generated.
While the second experiment does not directly support this trend, it does support the
inverse that increasing the number of functions always resulted in lower quality concepts.
91
CHAPTER 6
CONCLUSIONS
The hypothesis presented in Chapter 1 was that morphological charts which
contained fewer possible integrated conceptual designs would produce higher quality
integrated concepts. Based on the experimental studies presented here, the hypothesis did
not prove true in all cases. For the study presented in Chapter 4, the morphological chart
with eight functions and seven means per function was out of place, based on this
hypothesis. It contained the most possible integrated conceptual designs, but it was not
the worst. What was confirmed was that the shape of morphological charts can have an
impact on the quality of concepts generated from them. Two relationships have been
identified that did result in higher quality morphological charts in these experiments. A
chart with more means than functions produced better concepts than a chart with more
functions than means. Also, adding functions to a morphological chart never improved
the results. This second observation has profound implications on the selection of the
number of functions to include in a morphological chart. The time and effort needed to
create a very detailed functional decomposition will not aid a designer in selecting
promising integrated conceptual design solutions from a morphological chart. It is likely
that reducing the number of functions will generally improve the success of this task, up
to a point. This work does not claim that reducing a morphological chart to a single
function will produce better integrated concepts.
92
Contributions
The experiments described in Chapter 3 and Chapter 4 presents a procedure for
generating a large number of integrated conceptual design solutions from different
morphological charts. Two similar evaluation techniques (judge panels and judge pools)
are used to evaluate the concepts. This procedure could be used for further study of
morphological charts and could be used by future work which builds off the work
presented in this thesis.
The experimental results described in Chapter 3 and Chapter 4 document the
results of undergraduate mechanical engineering students. The results show the impact
of morphological chart size and shape on the quality of concepts generated by these
students. The morphological chart that proved most challenging for the students to create
good integrated conceptual design solutions was one with many functions and few means
per functions. This suggests that students should be encouraged to limit the functional
decomposition of a problem and concentrate their efforts on means generation if they are
going to use a morphological chart in their design process.
Judging Systems
This work employed two different systems for judging the integrated concepts. In
both experiments, it was desired to break up the judging to reduce the time required for
the participation of each individual judge. The first experiment assigned the integrated
concepts to a pool of five judges. Each integrated concept was evaluated by three judges.
Each judge was assigned approximately 60% of the concepts generated from each chart.
This system was cumbersome to set up, requiring trial and error searches through
93
possible assignments until a pattern meeting the requirements listed above was found. It
did achieve a uniform distribution of integrated concepts among the judges.
For the second experiment, a simpler method for assigning integrated concepts to
judges was used. For this experiment, six judges evaluated the integrated concepts.
Once again, each concept was evaluated by three judges. In this way, each judge
evaluated half of the concepts. The collection of integrated concepts was arbitrarily
divided into two halves, and each half was evaluated by a judge panel of three judges.
The judges worked individually to evaluate the concepts. This system was simpler to set
up, not requiring as much time in advance to determine the optimum pattern for
assignments. As a result of this system, however, it was necessary to evaluate the
validity of combining evaluations from one judge panel with the other. In this analysis, it
was found that there was insufficient overlap in one morphological chart size to
determine if the judge panels were consistent. If a system similar to the first experiment
had been utilized to spread the integrated concepts evenly among judges, it would have
reduced the impact of any differences between the judge panels.
In future work, care must be taken with the assignment of evaluations to judges.
The ideal situation is to have each judge evaluate all integrated concepts. The logistical
concern is that the number of evaluations grows quite large, and each judge must make
many evaluations. If the evaluations are distributed among judges, care must be taken in
setting up the evaluations such that they will have minimal impact on the statistical
analysis of the results. The additional effort needed to set up the evaluations in the first
experiment was beneficial in eliminating the need to determine if the work of the judge
94
panels could be pooled for the statistical analysis. In essence, the additional effort in
setting up the judging system in the first experiment reduced the uncertainty of the
judging results.
Future Work
In these experiments, the attempt was made to generate morphological charts with
functions at two different levels of detail. The functions used in these experiments may
not have fully accomplished this goal. For further experiments, consideration should be
given to generating a new set of functions rigorously linked to the decomposition of the
design problem. The functions would be taken from the decomposition at two different
levels of decomposition, as illustrated with a generic case in Figure 6.1. The higher level
set of sub-functions is outlined in green, while the lower level set is outlined in blue.
Developing two sets of means for each set of functions would permit the duplication of
the more detailed relationships in the second experiment. The judging system should
follow that used in the first experiment with careful allocation of integrated concepts
among judges to reduce uncertainty.
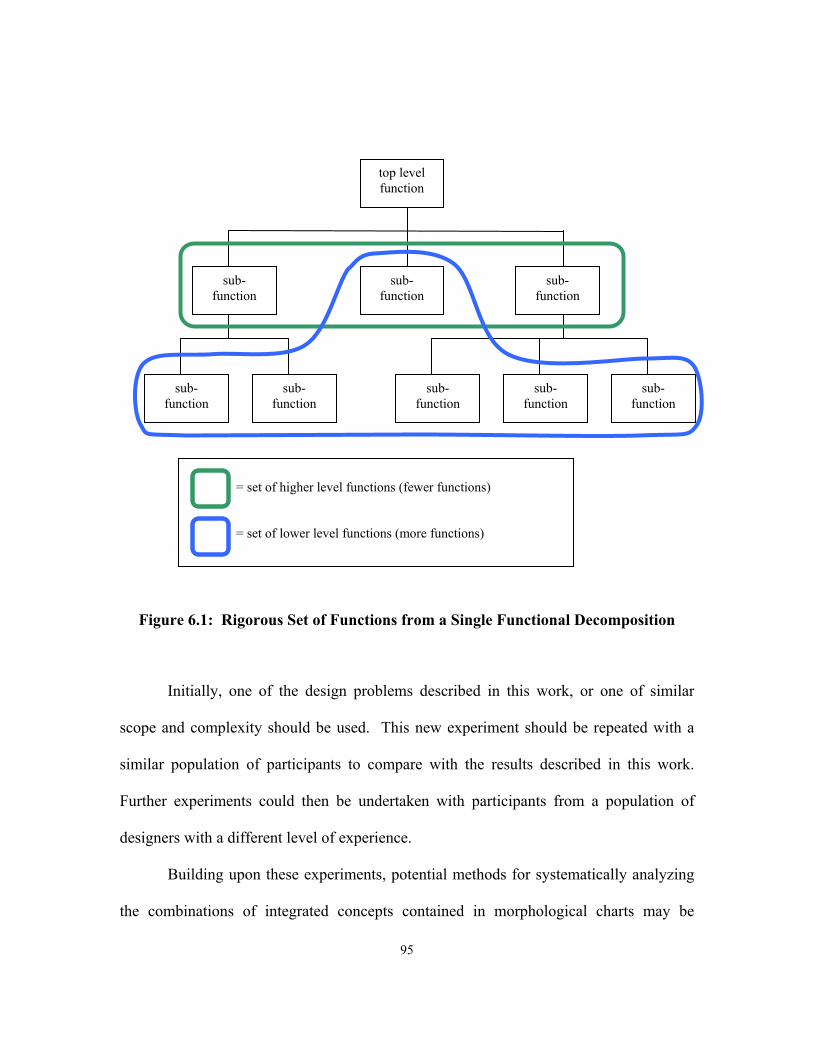
95
Figure 6.1: Rigorous Set of Functions from a Single Functional Decomposition
Initially, one of the design problems described in this work, or one of similar
scope and complexity should be used. This new experiment should be repeated with a
similar population of participants to compare with the results described in this work.
Further experiments could then be undertaken with participants from a population of
designers with a different level of experience.
Building upon these experiments, potential methods for systematically analyzing
the combinations of integrated concepts contained in morphological charts may be
top level function
sub- function
sub- function
sub- function
sub- function
sub- function
sub- function
sub- function
sub- function
= set of higher level functions (fewer functions) = set of lower level functions (more functions)
96
investigated. As discussed in previous chapters, a morphological chart can generate a
large number of combinations. There are tools that provide systematic testing methods
when it is too difficult to test every possible combination, such as the full output of a
morphological chart. One such option is provided by the Design of Experiments method.
Experiments may be run using orthogonal arrays or using a fractional factorial. These
provide a systematic way to test only a subset of all combinations and still derive
relationships for the whole set (Hicks and Turner, 1999). Depending on how these tests
are set up, they will capture some, but not all, of the interactions between test items.
The combinations in a morphological chart are the product of the number of
means for each function. In the morphological chart shown in Table 2.3, there are 36
possible combinations, with only four functions. The number of combinations can grow
quite quickly when considering a design with more functions. To test this morphological
chart using an orthogonal array and capture all interactions between any two functions
would still require 32 experiments. The functions can be considered as A, B, C, and D.
The interactions would be AB, AC, AD, BC, BD, and CD. This turns four functions into
a total of 10 variables to watch. Orthogonal arrays are not available for every possible
number of variables and levels. While Table 2.3 shows four variables with a mixture of
two- and three-level values, it is necessary to use an orthogonal array with four levels and
ten variables. This experiment requires 32 trials, which is only a reduction of four over
just running the whole list of all possible combinations (Phadke, 1989).
The savings in these methods comes from ignoring some, or all of the interactions
in the experiments. This is a powerful ability, in that it can greatly reduce the number of
97
experiments to run. The tradeoff with interactions, though, is a flaw for use with
analyzing morphological charts. The benefit of a methodical analysis of morphological
charts is that it has the potential to pick up on interactions that combine to enhance the
design solution. Tools such as Axiomatic Design (Suh, 2001) or the Function-Means
Tree (Dym and Little, 2000) are based on making decisions early about the means, but
this creates a risk of premature decisions about the means (Dym and Little, 2000). An
early decision has the potential loss of not finding a downstream interaction that
contributes positively to the design. Such an interaction may not be visible at a higher
level where the decision about a means was made.
A different approach will be necessary for a systematic analysis of morphological
charts. By filtering and combining functions, it will be possible to reduce the size of the
morphological chart. Similar functions may be combined and analyzed as a group
together. Similar means may also be grouped, because they would have a less significant
effect on the initial analysis. Means may be filtered against how they satisfy design
constraints. Means that violate constraints can be eliminated. For example, a particular
means may provide a safety concern that cannot be accounted for by other protection.
Combinations together may violate constraints as well. For example, while no one means
may be too expensive on its own, a certain combination may provide to be too expensive.
Weight is another area that “adds” together.
Aygün proposes a method using compatibility matrices to evaluate a system of
design variables (Aygün, 2000). Examine the interactions between the constraints and
the design variables. In situations where compromises are needed due to conflicts
98
between design variables, a compatibility matrix can be generated with all the possible
discrete values of the design variables to look for conflicts between possible values. This
method could be extended to a morphological chart analysis as a way to identify the
critical functions to include in the morphological chart as well as eliminating
incompatible means.
Maier and Fadel discuss the concept of affordance (Maier and Fadel, 2001),
which provides a potential tool for seeing how means can combine in a design solution.
Byproducts can be considered negative affordances. For example, an airplane requires
thrust. Frequently this is provided by a jet engine. A byproduct of a jet engine is noise.
The jet engine affords noise, which is a negative affordance. The design of the airplane
must now provide something that compensates for this noise. The cabin of the airplane
affords noise protection, which is a positive affordance. While in this case, the noise
protection properties of the cabin are probably designed to handle the noise of the engine,
there could be situations where the positive affordances are incidental to the means, but
provide a benefit to the design.
The addition of these tools may provide possible methods for filtering or reducing
morphological charts to a manageable level, while leaving the undiscovered interactions
intact within the remaining possible integrated conceptual design solutions. This has the
potential to increase the usefulness of morphological charts in design.
99
LIST OF REFERENCES
Aygün, M., 2000, "Comparative Performance Appraisal by Multiple Criteria for Design Alternatives", Architectural Science Review, 43 (1): 31-6.
Bohm, M. R., Vucovich, J. P., and Stone, R. B., 2005, “Capturing Creativity: Using a Design Repository to Drive Concept Innovation”, Design Engineering Technical Conferences, ASME: Long Beach, CA.
Bryant, C. R., Bohm, M., Stone, R. B., and McAdams, D. A., 2007, “An Interactive Morphological Matrix Computational Design Tool: A Hybrid of Two Methods”, Design Engineering Technical Conferences, ASME: Las Vegas, NV.
Daniel, W. W. and Terrell, J. C., 1995, Business Statistics, Houghton Mifflin, Co.: Boston, MA.
Dym, C. and Little, P., 2000, Engineering Design: A Project-Based Introduction, John Wiley & Sons, Inc.: New York, NY.
Fridley, J. L., Jorgensen, J. E., and Lamancusa, J. S., 1997, "Benchmarking: A Process Basis for Teaching Design", Frontiers in Engineering, IEEE, Pittsburgh, PA.
Hicks, C. and Turner, K., 1999, Fundamental Concepts in the Design of Experiments, Oxford University Press: New York, NY
Hirtz, J., Stone, R., McAdams, D., Szykman, S., and Wood, K., 2001, "A Functional Basis for Engineering Design: Reconciling and Evolving Previous Efforts", Research in Engineering Design, 13 (2): 65-82.
Hutcheson, R. S., McAdams, D. A., Stone, R. B., Tumer, I. Y., 2007, “Function-Based Systems Engineering (FUSE)”, 16th International Conference on Engineering Design: Paris, France.
Hyman, B., 2003, Fundamentals of Engineering Design, Prentice Hall: Upper Saddle River, NJ.
Kurfman, M. A., Stone, R., Vanwie, M., Wood, K., and Otto, K., 2000, "Theoretical Underpinnings of Functional Modeling: Preliminary Experimental Studies", Design Engineering Technical Conferences, ASME: Baltimore, MD.
Maier, J. R. A. and Fadel, G., 2002, "Comparing Function and Affordance as Bases for Design ", Design Engineering Technical Conferences, ASME: Montreal, Canada.
Maier, J. R. A. and Fadel, G., 2001, "Affordance: The Fundamental Concept in Engineering Design", Design Engineering Technical Conferences, ASME: Pittsburgh, PA.
100
Otto, K. and Wood, K., 2001, Product Design - Techniques in Reverse Engineering and New Product Design, Prentice Hall: Upper Saddle River, NJ.
Pahl, G. and Beitz, W., 1996, Engineering Design: A Systematic Approach, Springer-Verlag: New York, NY.
Phadke, M. S., 1989, Quality Engineering Using Robust Design, PTR Prentice Hall, Inc.: Englewood Cliffs, NJ.
Savanovic, P., and Zeiler, W., 2007, “Integral Building Design Workshops; A Concept To Structure Communication”, Design Engineering Technical Conferences, ASME: Las Vegas, NV.
Shah, J. J., 1998, “Experimental Investigation of Progressive Idea Generation Techniques in Engineering Design”, Design Engineering Technical Conferences, ASME: Atlanta, GA.
Stone, R. and Wood, K., 1999, "Development of a Functional Basis for Design", Design Engineering Technical Conferences, ASME: Las Vegas, NV.
Suh, N., 2001, Axiomatic Design: Advances and Applications, Oxford University Press: New York, NY.
Tiwari, S., Summers, J., and Fadel, G. 2007, “A Genetic Algorithm Based Procedure For Extracting Optimal Solutions From A Morphological Chart”, Design Engineering Technical Conferences, ASME: Las Vegas, NV.
Ullman, D., 2003, The Mechanical Design Process, McGraw-Hill, Inc.: New York, NY.
Ulrich, K. T. and Eppinger, S., 1995, Product Design and Development, McGraw-Hill, Inc.: New York, NY.
Weber, R. and Condoor, S. S., 1998, "Conceptual Design Using a Synergistically Compatible Morphological Matrix", Frontiers in Education Conference, IEEE: Piscataway, NJ.
Wetmore, W. and Summers, J. S., 2004, "Influence Of Group Cohesion And Information Sharing On Effectiveness Of Design Review", Design Engineering Technical Conferences, ASME: Salt Lake City, UT.