morphological and molecular characteristics of spheroid
TRANSCRIPT
Gheytanchi et al. Cancer Cell Int (2021) 21:204 https://doi.org/10.1186/s12935-021-01898-9
PRIMARY RESEARCH
Morphological and molecular characteristics of spheroid formation in HT-29 and Caco-2 colorectal cancer cell linesElmira Gheytanchi1†, Marzieh Naseri1,2†, Feridoun Karimi‑Busheri3, Fatemeh Atyabi4, Ensie Sadat Mirsharif5, Mahmood Bozorgmehr1, Roya Ghods1,2* and Zahra Madjd1,2*
Abstract
Background: Relapse and metastasis in colorectal cancer (CRC) are often attributed to cancer stem‑like cells (CSCs), as small sub‑population of tumor cells with ability of drug resistance. Accordingly, development of appropriate mod‑els to investigate CSCs biology and establishment of effective therapeutic strategies is warranted. Hence, we aimed to assess the capability of two widely used and important colorectal cancer cell lines, HT‑29 and Caco‑2, in generating spheroids and their detailed morphological and molecular characteristics.
Methods: CRC spheroids were developed using hanging drop and forced floating in serum‑free and non‑attach‑ment conditions and their morphological features were evaluated by scanning electron microscopy (SEM). Then, the potential of CSCs enrichment in spheroids was compared to their adherent counterparts by analysis of serial sphere formation capacity, real‑time PCR of key stemness genes (KLF4, OCT4, SOX2, NANOG, C-MYC) and the expression of potential CRC‑CSCs surface markers (CD166, CD44, and CD133) by flow cytometry. Finally, the expression level of some EMT‑related (Vimentin, SNAIL1, TWIST1, N-cadherin, E-cadherin, ZEB1) and multi‑drug resistant (ABCB1, ABCC1, ABCG2) genes was evaluated.
Results: Although with different morphological features, both cell lines were formed CSCs‑enriched spheroids, indicated by ability to serial sphere formation, significant up‑regulation of stemness genes, SOX2, C-MYC, NANOG and OCT4 in HT‑29 and SOX2, C-MYC and KLF4 in Caco‑2 spheroids (p-value < 0.05) and increased expression of CRC‑CSC markers compared to parental cells (p-value < 0.05). Additionally, HT‑29 spheroids exhibited a significant higher expres‑sion of both ABCB1 and ABCG2 (p-value = 0.02). The significant up‑regulation of promoting EMT genes, ZEB1, TWIST1, E-cadherin and SNAIL1 in HT‑29 spheroids (p-value = 0.03), SNAIL1 and Vimentin in Caco‑2 spheroids (p-value < 0.05) and N-cadherin down‑regulation in both spheroids were observed.
Conclusion: Enrichment of CSC‑related features in HT‑29 and Caco‑2 (for the first time without applying special scaffold/biochemical) spheroids, suggests spheroid culture as robust, reproducible, simple and cost‑effective model
© The Author(s) 2021. This article is licensed under a Creative Commons Attribution 4.0 International License, which permits use, sharing, adaptation, distribution and reproduction in any medium or format, as long as you give appropriate credit to the original author(s) and the source, provide a link to the Creative Commons licence, and indicate if changes were made. The images or other third party material in this article are included in the article’s Creative Commons licence, unless indicated otherwise in a credit line to the material. If material is not included in the article’s Creative Commons licence and your intended use is not permitted by statutory regulation or exceeds the permitted use, you will need to obtain permission directly from the copyright holder. To view a copy of this licence, visit http:// creat iveco mmons. org/ licen ses/ by/4. 0/. The Creative Commons Public Domain Dedication waiver (http:// creat iveco mmons. org/ publi cdoma in/ zero/1. 0/) applies to the data made available in this article, unless otherwise stated in a credit line to the data.
Open Access
Cancer Cell International
*Correspondence: [email protected]; [email protected]; [email protected]; [email protected]†Elmira Gheytanchi and Marzieh Naseri contributed equally to this manuscript as co‑first authors1 Oncopathology Research Center, Iran University of Medical Sciences, Tehran, IranFull list of author information is available at the end of the articleFirst Corresponding Author: Zahra Madjd. Second Corresponding Author: Roya Ghods.
Page 2 of 16Gheytanchi et al. Cancer Cell Int (2021) 21:204
BackgroundColorectal cancer (CRC) is the third most common can-cer and the cause of cancer related-death in both men and women worldwide [1]. Although the effective ther-apeutic interventions including surgery, chemo- and radiotherapy have improved the survival of patients with CRC, recurrence and metastasis are the main causes of CRC-related death [2]. There is accumulating evi-dence that most solid tumors including CRC originate from tumor initiating or cancer stem cells (CSCs) [3–5]. CSCs are referred to as a sub-population of tumor cells with stem cell-like properties including self-renewal and multi-lineage differentiation capacity which are resistant to conventional therapies [6–9]. In fact, the emerging evi-dence has shown that the deregulation of signaling path-ways involved in self-renewal of normal stem cells leads to uncontrolled development of tumor cells along with functional and proliferative tumor heterogeneity [10].
Most of the challenges in cancer treatment such as treatment failure, tumor aggressiveness, relapse, metasta-sis and poor prognosis are related to CSCs characteristic, most of which are attributed to epithelial to mesenchymal transition (EMT) potential, stemness signaling pathways regulating pluripotency, as well as the high expression of ATP-binding cassette (ABC) transporter genes in this subpopulation [11–18]. Hence, the complete regres-sion of tumors requires identifying biological features of CSCs in in vitro and in vivo CSC models that may help to explore new approaches to target this subpopulation. There are several strategies of CSCs targeting including self-renewal prevention, altering drug permeability and stimulation of their differentiation [19–21]. Moreover, signal transduction pathways and microenvironmen-tal signals in CSCs are considered the main therapeutic aspects linked to stem-cell biology that can be targeted [13, 22, 23].
Since it is difficult to fully identify the site of CSCs accumulation and monitor their distinct biological fea-tures, the discovery and development of novel techniques for the isolation and evaluation of CSCs properties can play a significant role in the clinical diagnosis and treat-ment of cancers. Different approaches have been applied to isolate, characterize, purify, and enrichment of CSCs from various cancers [7, 24]. Immunogenic characteris-tics of CSCs, particularly as related to their specific cell surface markers such as CD133, ALDH1 and CD44, are
the well-known methods which apply for CSCs isola-tion and characterization in the early diagnosis and tar-geted therapy of cancer [25], while methods such as sphere formation, clonogenic growth and drug resistance assays lead to functional isolation of CSCs [25].Thus, the development of feasible and applicable models for CSCs enrichment and assessment of its characteristics are war-ranted. Cell-based assays including in vitro cell culture, multicellular spheroids and organoid culture are valu-able tools in obtaining information regarding cellular and molecular mechanisms involved in CSCs biology, and exploring new therapeutic strategies for targeting this sub-population [24, 26].
It is well accepted that micro tumor structures formed as spheroids present the main characteristics of in vivo tumors such as cellular heterogeneity, hypoxia and pH rate, exposure to nutrients and metabolites, cell–cell cohesion and interaction, physical and chemi-cal stresses, and gene expression profiles [27]. There-fore, spheroids with their particular architecture and biology can serve as reliable cancer models in differ-ent areas of cancer research, including tumor micro-environment modeling and matrix remodeling as well as migration and invasion, drug discovery and screen-ing, immune interactions and angiogenesis, etc. [26, 28, 29]. There are different systems of spheroid formation, including suspension culture, non-adherent surface, hanging drop and microfluidic methods. Spheroids cul-ture as serum free and non-adherent condition is the most frequent and powerful technique to obtain CSC-like properties and expand CSCs. Moreover, the pres-ence of mathematically testable approaches based on destruction of spheroids structure decreases underes-timated results in clinical application and guarantees reproducibility [30, 31]. CRC cell lines have derived from different CRC subtypes and show different pho-notypic and molecular properties in in vivo and in vitro studies [32, 33]. For example, despite similar epithelioid phenotypes of HT-29 and Caco-2 cells, HT-29 cells are invasive and metastatic in vivo, but not in vitro, whereas Caco-2 cells are noninvasive [34]. Moreover, the different cell lines can generate spheroids with dif-ferences in morphological feature, as well as the capac-ity of CSCs enrichment and CSC characteristics-related gene expression profiles. To overcome these limitations it is necessary to determine the ideal, most suitable cell
to imitate the complexity of in vivo tumors including self‑renewal, drug resistance and invasion for in vitro research of CRC‑CSCs.
Keywords: Colorectal cancer (CRC), Cancer stem cells (CSCs), Sphere formation, Epithelial‑to‑mesenchymal transition (EMT), Drug resistance
Page 3 of 16Gheytanchi et al. Cancer Cell Int (2021) 21:204
line for CSC studies both through evaluation and com-parison of their-derived spheroids in terms of stem cell-like characteristics.
Considering the aforementioned, this study aims to gain insight into the biological features of two different types of colonospheres, both derived from two colorec-tal cancer cell lines including HT-29 and Caco-2 and assess whether these spheres are suitable models for CSC enrichment. Then, we evaluated the CSC-related charac-teristics of generated spheroids in terms of gene expres-sion profile and morphological features as compared to their parental cells in two-dimensional (2D) culture. Hence, we compared the expression level of genes, as related to the CSCs properties, including genes impli-cated in stemness, EMT and drug resistance in HT-29 and Caco-2 human colorectal carcinoma (CRC) cell lines grown in spheroids versus 2D cell culture conditions. We applied cost-effective, simple, and time-consuming meth-ods for spheroid formation without using special scaffold or biochemical materials.
Materials and methodsCell lines and culture conditionsHT-29 and Caco-2 human colon adenocarcinoma cell lines were obtained from the Iranian Biological Resource Center (IBRC, Tehran, Iran) and were tested for spheroid formation. Cells were cultured in Dulbecco’s modified Eagle’s medium (DMEM)/High glucose medium (Gibco, Germany) supplemented with 10% fetal bovine serum (FBS, Gibco, Germany), 100 U/ml penicillin, 100 µg/ml streptomycin antibiotics (Biowest, France), 1% non-essential amino acid (Gibco, Germany) and 2 mM l-glu-tamine (Gibco, Germany). Cultures were maintained under standard cell culture conditions in 37 °C, 5% CO2 and 95% humidified incubator and passaged in 70–90% confluence.
Preparation of poly‑HEMA coated cell culture dishesTo prepare the 1.2% poly-HEMA (Poly-2-hydroxyethyl methacrylate) solution, 1.2 g poly-HEMA (Sigma, USA) was dissolved in 100 mL 96% ethanol by rotating over-night to dissolve the polymers completely. The solution was centrifuged for 30 min at 400×g to remove unsolved particles and then filtered by 0.22 µm filters. The tissue culture dishes were coated with poly-HEMA solution (1.2 mL per each well of six well plate or 2.5 mL per T25 tissue culture flask) under the biosafety laminar flow hood at room temperature for an overnight to evaporate ethanol completely. Finally, the plates were washed with phosphate buffer saline (PBS) and stored at 37 °C incuba-tor for future use.
Spheroids cultureHT-29 and Caco-2 spheroids were generated by two types of spheroid culture systems; the hanging drop-let technique or as free-floating spheroids cultured on poly-HEMA coated dishes. For hanging droplet sphe-roids, the cells were detached with 0.05% trypsin/EDTA (Gibco, Germany) and after trypsin inactivation, the resulting single cells were washed twice with PBS and pre-warmed serum free media. Dissociated single cells re-suspended as five or ten thousand cells per 25μL of serum free medium (DMEM/F12, Gibco, Germany), which was supplemented with 20 ng/mL epidermal growth factor (EGF, PeproTech, USA), 10 ng/mL of basic fibroblast growth factor (bFGF, PeproTech, USA), 2% B27 supplement (Gibco, Germany), 1% non-essen-tial amino acid, 2 mM l-glutamine and 1% penicil-lin–streptomycin. About 60 × 25μL cellular drops were dispensed on the inverted lids of the 9 cm petri dishes and the lids carefully set on the dishes, which had been pre-filled with five mL of PBS to assure high humidity and then incubated for 96 h. In the next step, the drop-lets were washed with 2 mL of media by gentle shaking, and formed spheroids were transferred onto poly-HEMA coated dishes for an additional 6 days. For free-floating spheroids, single-cell suspensions were seeded into poly-HEMA coated dishes at different cell densi-ties (1–5 × 10⁵ cells/mL) in the serum free medium as described above and were cultivated for up to 10 days. The culture media was supplemented with additional 2% B27, bFGF and EGF every other day.
Secondary sphere formation assayTo examine the ability of colonospheres to form the next spheroid generations, spheroids were harvested and dissociated enzymatically with trypsin/EDTA and mechanically by gently pipetting. The resulting single cells, after counting, were re-plated in serum free sphe-roid medium at the same densities and culture condi-tions as mentioned above for three sequential passages (P1-P4).
Scanning electron microscopySpheroids were collected by centrifugation for 1 min at 100 g and supernatant were carefully aspirated. Then, the collected spheroids were washed with PBS and fixed with 2.5% (v/v) glutaraldehyde in PBS for 30 min at room temperature. After fixation, spheroids were washed once with PBS and dehydrated using ethanol series (50, 65, 75, 85, and 100%). The samples were sputter-coated with gold–palladium and examined in scanning electron microscope (SEM, Seron Technol-ogy, AIS-2100, Korea).
Page 4 of 16Gheytanchi et al. Cancer Cell Int (2021) 21:204
Quantitative real‑time PCR analysisThe following genes were selected and examined by real-time PCR: stemness genes; KLF4, OCT4, SOX2, NANOG and C-MYC, EMT genes; Vimentin, SNAIL1,TWIST1, N-cadherin, E-cadherin and ZEB1, ABC transporter genes; ABCB1, ABCC1 and ABCG2. Spheroids were harvested a day before structural dis-integration (day 10 for HT-29 and day 4 for Caco-2 spheroids). The total RNAs were then extracted from parental and spheroid cells using RNeasy Mini Kit (Qiagen, Germany) according to the manufacturer’s instructions. After measurement of RNA quantity and quality by Nanodrop (ThermoFisher Scientific, USA), cDNA were synthesized with 1 μg of total RNA using cDNA synthesis kit (GeneAll, Korea). Real-time poly-merase chain reaction (RT-qPCR) was performed using the SYBR Premix Ex Taq II real-time PCR kit (TaKaRa, Japan) on the Rotor-Gene Q LightCycler (Qiagene, Germany) with the following conditions: 40 two-step amplification cycles of 95 °C for 5 s and 60 °C for 30 s. The relative expression values of target genes were quantified relative to glyceraldehyde-3-phosphate dehydrogenase (GAPDH), as the internal reference gene, by using the 2−ΔCT method. Real-time PCR prim-ers are listed in Table 1.
Flow cytometryFlow cytometry was used to quantify the percentage of CSC markers expression in HT-29 and Caco-2 sphe-roid cells compared to parental cells. The parental and spheroid cells from each cell line were dissociated with trypsin/EDTA and were washed with PBS twice. The dissociated cells were counted using Trypan blue exclu-sion assay, and if cell viability was more than 95%, they were evaluated for CSC markers expression. The follow-ing antibodies were used: anti-CD44 (1:30), anti-CD133 (1:300), anti-CD166 (1:90) (all from abcam, USA). All antibodies were incubated with 3 × 10⁵ cells for 30 min at 4 °C. Goat anti-rabbit IgG-FITC (1:100) (Santa Cruz bio-technology, USA) was used as secondary antibody. The percentage of CSC marker positive cells were evaluated using an Atuune NxT flow cytometer (Thermo Fisher Scientific, USA) and data were analyzed using FlowJo VX software.
Statistical analysisData were reported as the mean ± standard deviation for each group from three or four independent experiments. The diameter of the spheroids was measured using Image J software (n = 25) (IJ 1.46r version, NIH, USA). Student’s t-test was used to compare the differences between the control (parental) and spheroid groups using GraphPad
Prism version 8.0 for Windows (GraphPad Software, La Jolla, CA, USA, www. graph pad. com). A p-value < 0.05 was accepted as a statistically significant difference between groups.
ResultsHT‑29 and Caco‑2‑derived spheroids exhibit different spheroidization time and morphological characteristicsFirst, we tested whether HT-29 and Caco-2 cell lines (Fig. 1a, d) are able to generate three-dimensional (3D) spheroids. Spheroid formation in non-adherent condi-tion on poly-HEMA coated dishes at different cell densi-ties was applied for generation of spheroids from HT-29 and Caco-2 adherent cells. Both cell lines could form spheroids, while HT-29 spheroids were unstable and the first signs of disintegration of their structure were observed 3 days after culture (data not shown). Hence, we used the hanging drop method as a well-established technique to spheroid formation from HT-29 cells. As observed from Fig. 1, both cell lines formed 3D spheroids in serum free media using the hanging drop method for HT-29 and free floating culture in non-adherent
Table1 Primers used for quantitative RT‑PCR
Genes groups Gene name Primer Sequence (5´ → 3´)
Housekeeping gene GAPDH F‑CAT GAG AAG TAT GAC AAC AGCCT R‑AGT CCT TCC ACG ATA CCA AAGT
Stemness genes C-MYC F‑ACA CAT CAG CAC AAC TAC GR‑CGC CTC TTG ACA TTC TCC
KLF4 F‑CCT CGC CTT ACA CAT GAA GAG R‑CAT CGG GAA GAC AGT GTG AAA
SOX2 F‑AAT GGG AGG GGT GCA AAA GAGG R‑GTG AGT GTG GAT GGG ATT GGTG
NANOG F‑AGC TAC AAA CAG GTG AAG ACR‑GGT GGT AGG AAG AGT AAA GG
OCT4-A F‑GTG GAG AGC AAC TCC GAT GR‑TGC AGA GCT TTG ATG TCC TG
EMT genes Vimentin F‑TCT ACG AGG AGG AGA TGC GGR‑GGT CAA GAC GTG CCA GAG AC
SNAIL1 F‑CCA GAG TTT ACC TTC CAG CAR‑GAT GAG CAT TGG CAG CGA
TWIST1 F‑TTC TCG GTC TGG AGG ATG GAR‑CCA CGC CCT GTT TCT TTG AAT
N-cadherin F‑GCC CAA GAC AAA GAG ACC CR‑CTG CTG ACT CCT TCA CTG AC
E-cadherin F‑CAG GAG TCA TCA GTG TGG TR‑GGA GGA TTA TCG TTG GTG TCAG
ZEB1 F‑CTT CTC ACA CTC TGG GTC TTA TTC R‑CGT TCT TCC GCT TCT CTC TTAC
ABC Transporte ABCG2 F‑TTC CAC GAT ATG GAT TTA CGG R‑GTT TCC TGT TGC ATT GAG TCC
ABCB1 F‑GTT CAG GTG GCT CTG GAT AAG R‑AGC GAT GAC GTC AGC ATT AC
ABCC1 F‑CGC CTT CGC TGA GTT CCT R‑TGC GGT GCT GTT GTG GTG
Page 5 of 16Gheytanchi et al. Cancer Cell Int (2021) 21:204
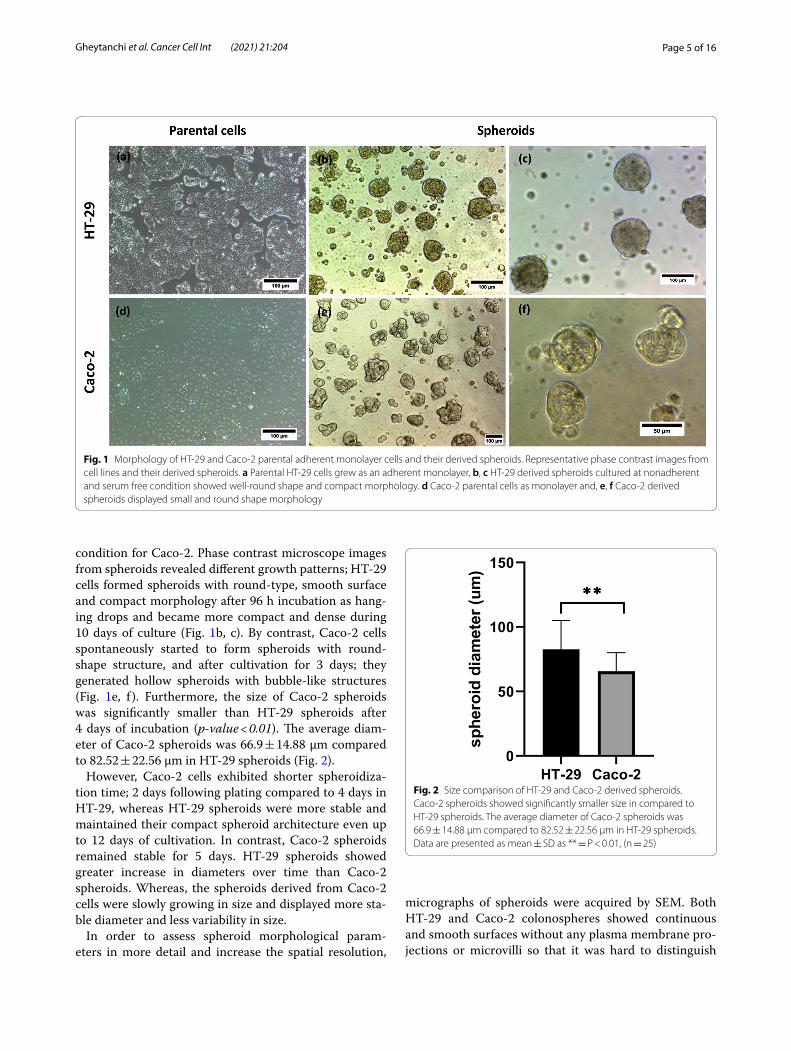
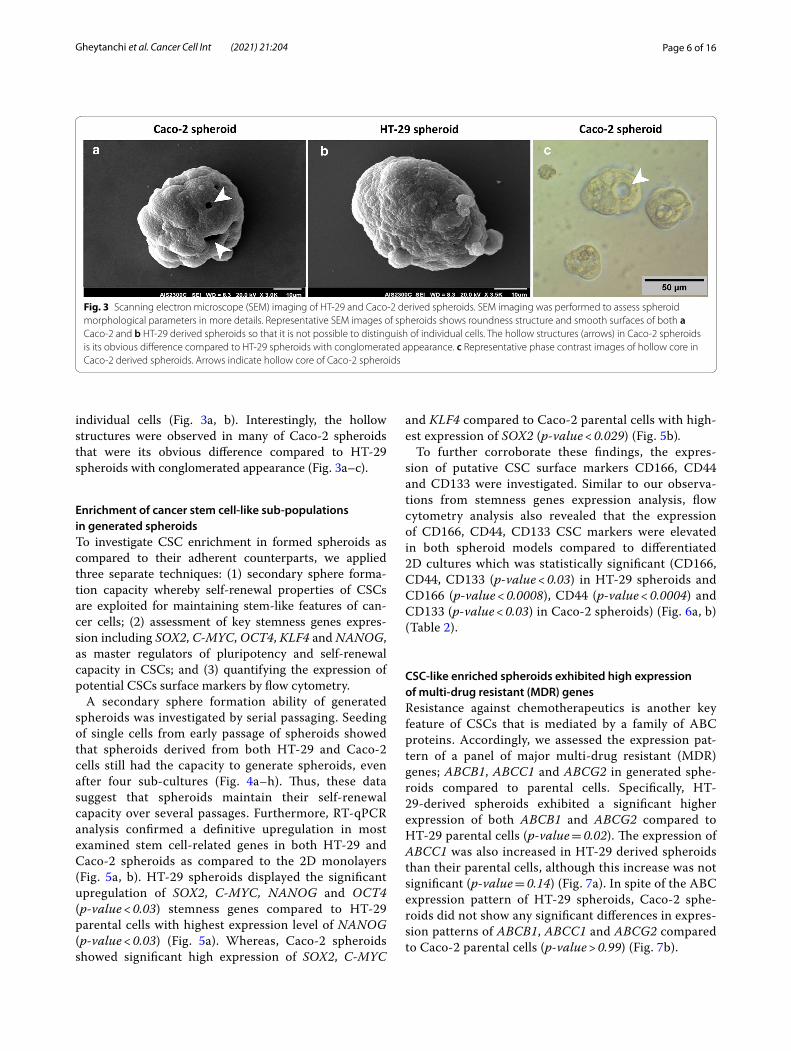
condition for Caco-2. Phase contrast microscope images from spheroids revealed different growth patterns; HT-29 cells formed spheroids with round-type, smooth surface and compact morphology after 96 h incubation as hang-ing drops and became more compact and dense during 10 days of culture (Fig. 1b, c). By contrast, Caco-2 cells spontaneously started to form spheroids with round-shape structure, and after cultivation for 3 days; they generated hollow spheroids with bubble-like structures (Fig. 1e, f ). Furthermore, the size of Caco-2 spheroids was significantly smaller than HT-29 spheroids after 4 days of incubation (p-value < 0.01). The average diam-eter of Caco-2 spheroids was 66.9 ± 14.88 µm compared to 82.52 ± 22.56 µm in HT-29 spheroids (Fig. 2).
However, Caco-2 cells exhibited shorter spheroidiza-tion time; 2 days following plating compared to 4 days in HT-29, whereas HT-29 spheroids were more stable and maintained their compact spheroid architecture even up to 12 days of cultivation. In contrast, Caco-2 spheroids remained stable for 5 days. HT-29 spheroids showed greater increase in diameters over time than Caco-2 spheroids. Whereas, the spheroids derived from Caco-2 cells were slowly growing in size and displayed more sta-ble diameter and less variability in size.
In order to assess spheroid morphological param-eters in more detail and increase the spatial resolution,
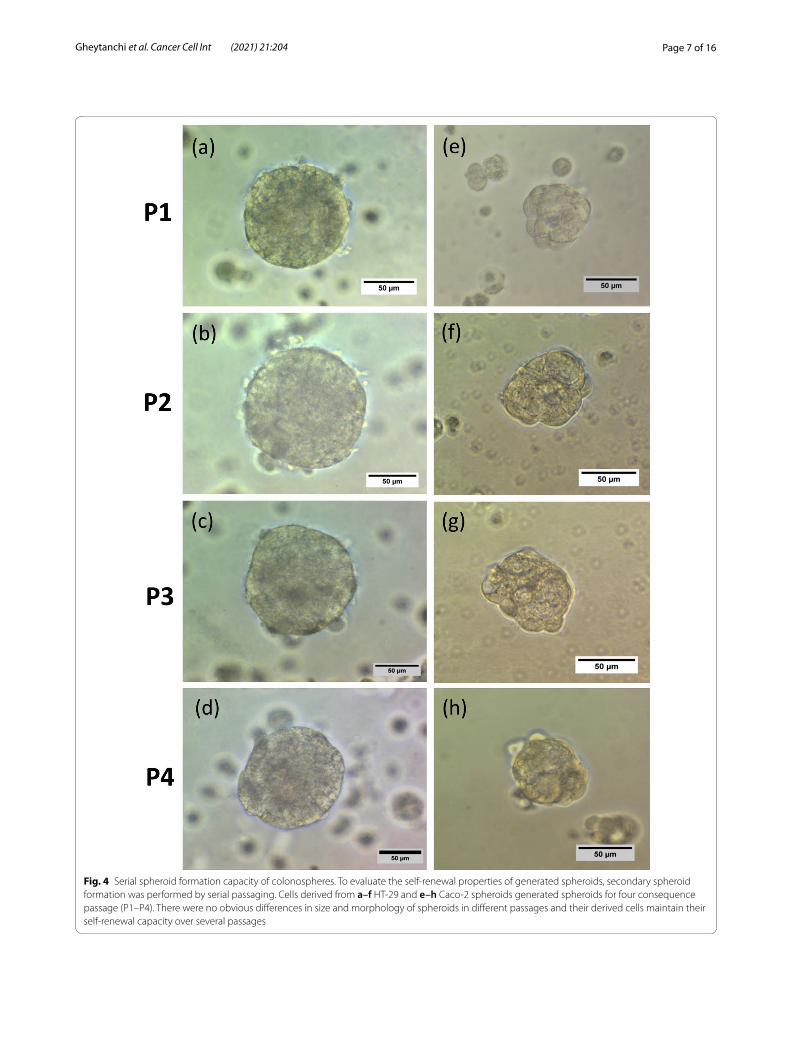
micrographs of spheroids were acquired by SEM. Both HT-29 and Caco-2 colonospheres showed continuous and smooth surfaces without any plasma membrane pro-jections or microvilli so that it was hard to distinguish
Fig. 1 Morphology of HT‑29 and Caco‑2 parental adherent monolayer cells and their derived spheroids. Representative phase contrast images from cell lines and their derived spheroids. a Parental HT‑29 cells grew as an adherent monolayer, b, c HT‑29 derived spheroids cultured at nonadherent and serum free condition showed well‑round shape and compact morphology. d Caco‑2 parental cells as monolayer and, e, f Caco‑2 derived spheroids displayed small and round shape morphology
Fig. 2 Size comparison of HT‑29 and Caco‑2 derived spheroids. Caco‑2 spheroids showed significantly smaller size in compared to HT‑29 spheroids. The average diameter of Caco‑2 spheroids was 66.9 ± 14.88 µm compared to 82.52 ± 22.56 µm in HT‑29 spheroids. Data are presented as mean ± SD as ** = P < 0.01, (n = 25)
Page 6 of 16Gheytanchi et al. Cancer Cell Int (2021) 21:204
individual cells (Fig. 3a, b). Interestingly, the hollow structures were observed in many of Caco-2 spheroids that were its obvious difference compared to HT-29 spheroids with conglomerated appearance (Fig. 3a–c).
Enrichment of cancer stem cell‑like sub‑populations in generated spheroidsTo investigate CSC enrichment in formed spheroids as compared to their adherent counterparts, we applied three separate techniques: (1) secondary sphere forma-tion capacity whereby self-renewal properties of CSCs are exploited for maintaining stem-like features of can-cer cells; (2) assessment of key stemness genes expres-sion including SOX2, C-MYC, OCT4, KLF4 and NANOG, as master regulators of pluripotency and self-renewal capacity in CSCs; and (3) quantifying the expression of potential CSCs surface markers by flow cytometry.
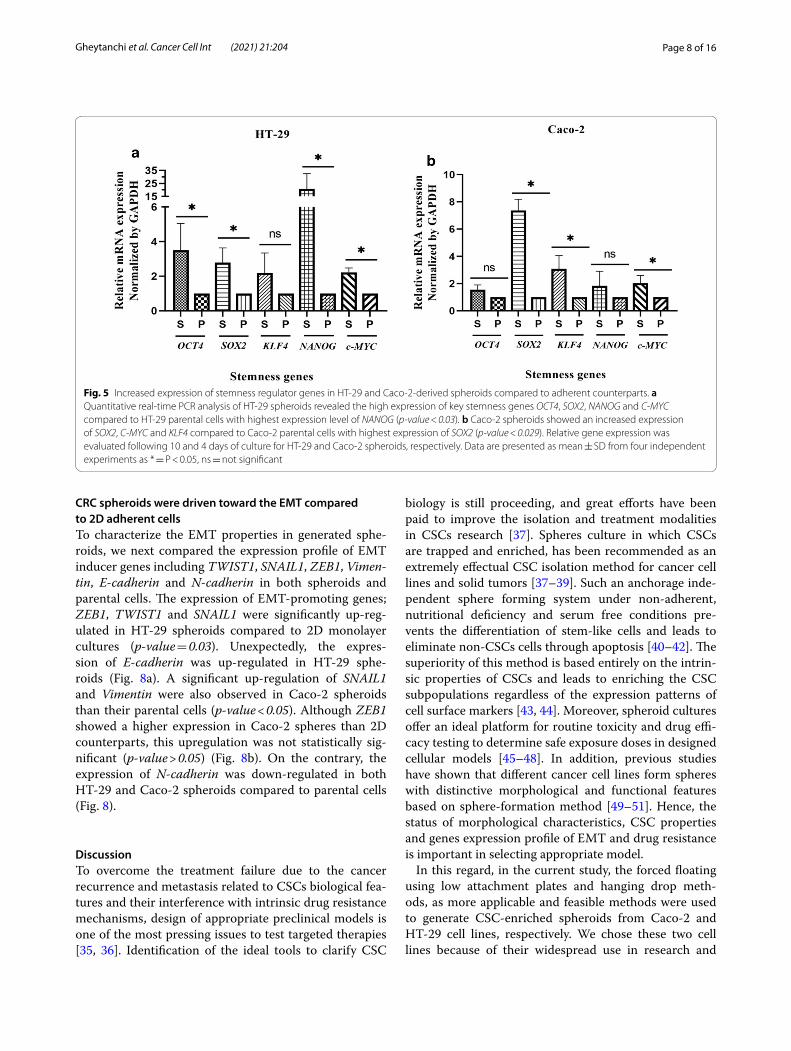
A secondary sphere formation ability of generated spheroids was investigated by serial passaging. Seeding of single cells from early passage of spheroids showed that spheroids derived from both HT-29 and Caco-2 cells still had the capacity to generate spheroids, even after four sub-cultures (Fig. 4a–h). Thus, these data suggest that spheroids maintain their self-renewal capacity over several passages. Furthermore, RT-qPCR analysis confirmed a definitive upregulation in most examined stem cell-related genes in both HT-29 and Caco-2 spheroids as compared to the 2D monolayers (Fig. 5a, b). HT-29 spheroids displayed the significant upregulation of SOX2, C-MYC, NANOG and OCT4 (p-value < 0.03) stemness genes compared to HT-29 parental cells with highest expression level of NANOG (p-value < 0.03) (Fig. 5a). Whereas, Caco-2 spheroids showed significant high expression of SOX2, C-MYC
and KLF4 compared to Caco-2 parental cells with high-est expression of SOX2 (p-value < 0.029) (Fig. 5b).
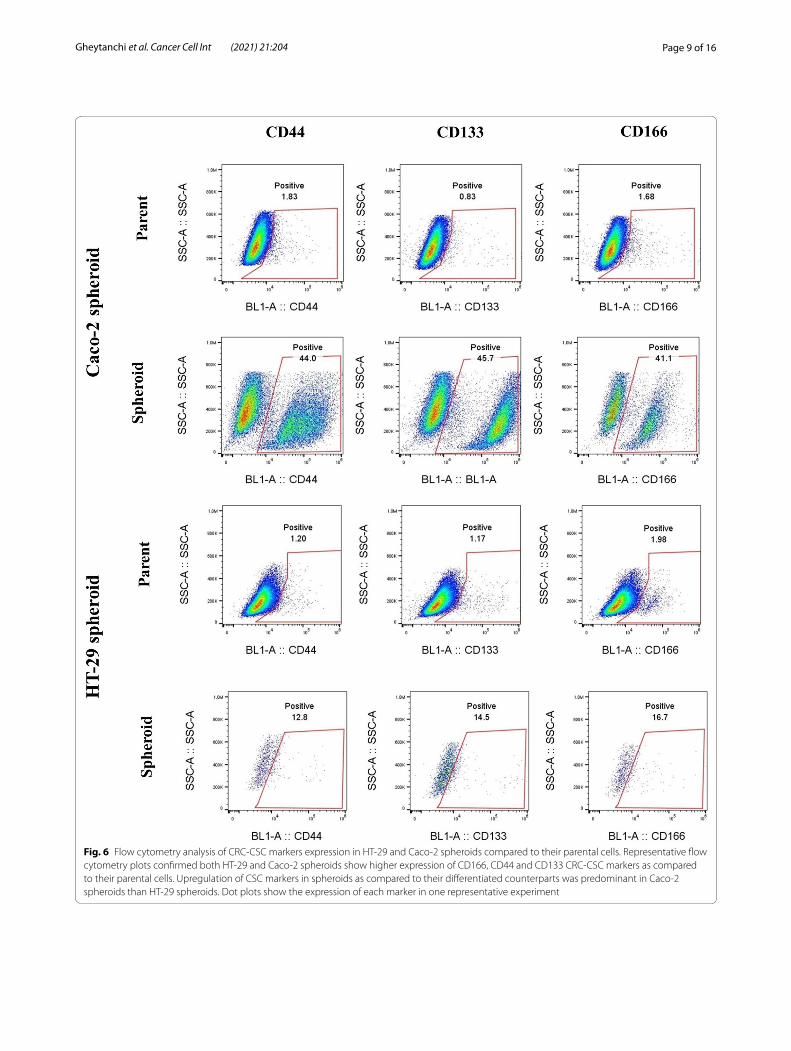
To further corroborate these findings, the expres-sion of putative CSC surface markers CD166, CD44 and CD133 were investigated. Similar to our observa-tions from stemness genes expression analysis, flow cytometry analysis also revealed that the expression of CD166, CD44, CD133 CSC markers were elevated in both spheroid models compared to differentiated 2D cultures which was statistically significant (CD166, CD44, CD133 (p-value < 0.03) in HT-29 spheroids and CD166 (p-value < 0.0008), CD44 (p-value < 0.0004) and CD133 (p-value < 0.03) in Caco-2 spheroids) (Fig. 6a, b) (Table 2).
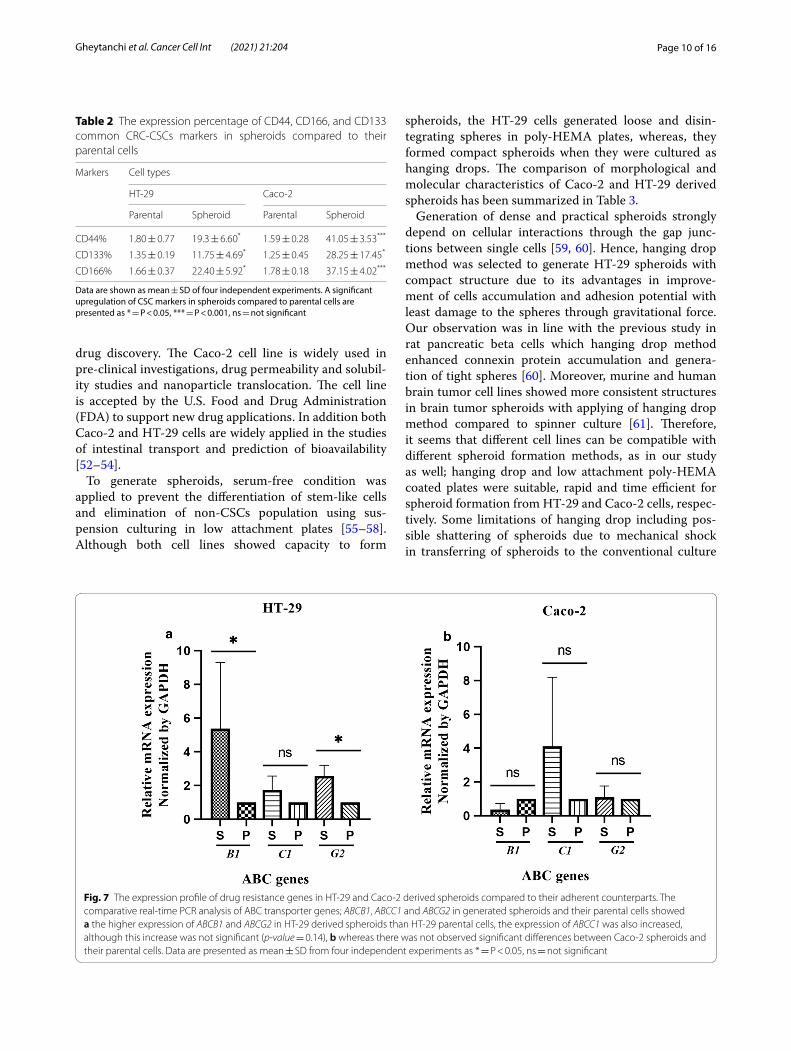
CSC‑like enriched spheroids exhibited high expression of multi‑drug resistant (MDR) genesResistance against chemotherapeutics is another key feature of CSCs that is mediated by a family of ABC proteins. Accordingly, we assessed the expression pat-tern of a panel of major multi-drug resistant (MDR) genes; ABCB1, ABCC1 and ABCG2 in generated sphe-roids compared to parental cells. Specifically, HT-29-derived spheroids exhibited a significant higher expression of both ABCB1 and ABCG2 compared to HT-29 parental cells (p-value = 0.02). The expression of ABCC1 was also increased in HT-29 derived spheroids than their parental cells, although this increase was not significant (p-value = 0.14) (Fig. 7a). In spite of the ABC expression pattern of HT-29 spheroids, Caco-2 sphe-roids did not show any significant differences in expres-sion patterns of ABCB1, ABCC1 and ABCG2 compared to Caco-2 parental cells (p-value > 0.99) (Fig. 7b).
Fig. 3 Scanning electron microscope (SEM) imaging of HT‑29 and Caco‑2 derived spheroids. SEM imaging was performed to assess spheroid morphological parameters in more details. Representative SEM images of spheroids shows roundness structure and smooth surfaces of both a Caco‑2 and b HT‑29 derived spheroids so that it is not possible to distinguish of individual cells. The hollow structures (arrows) in Caco‑2 spheroids is its obvious difference compared to HT‑29 spheroids with conglomerated appearance. c Representative phase contrast images of hollow core in Caco‑2 derived spheroids. Arrows indicate hollow core of Caco‑2 spheroids
Page 7 of 16Gheytanchi et al. Cancer Cell Int (2021) 21:204
Fig. 4 Serial spheroid formation capacity of colonospheres. To evaluate the self‑renewal properties of generated spheroids, secondary spheroid formation was performed by serial passaging. Cells derived from a–f HT‑29 and e–h Caco‑2 spheroids generated spheroids for four consequence passage (P1–P4). There were no obvious differences in size and morphology of spheroids in different passages and their derived cells maintain their self‑renewal capacity over several passages
Page 8 of 16Gheytanchi et al. Cancer Cell Int (2021) 21:204
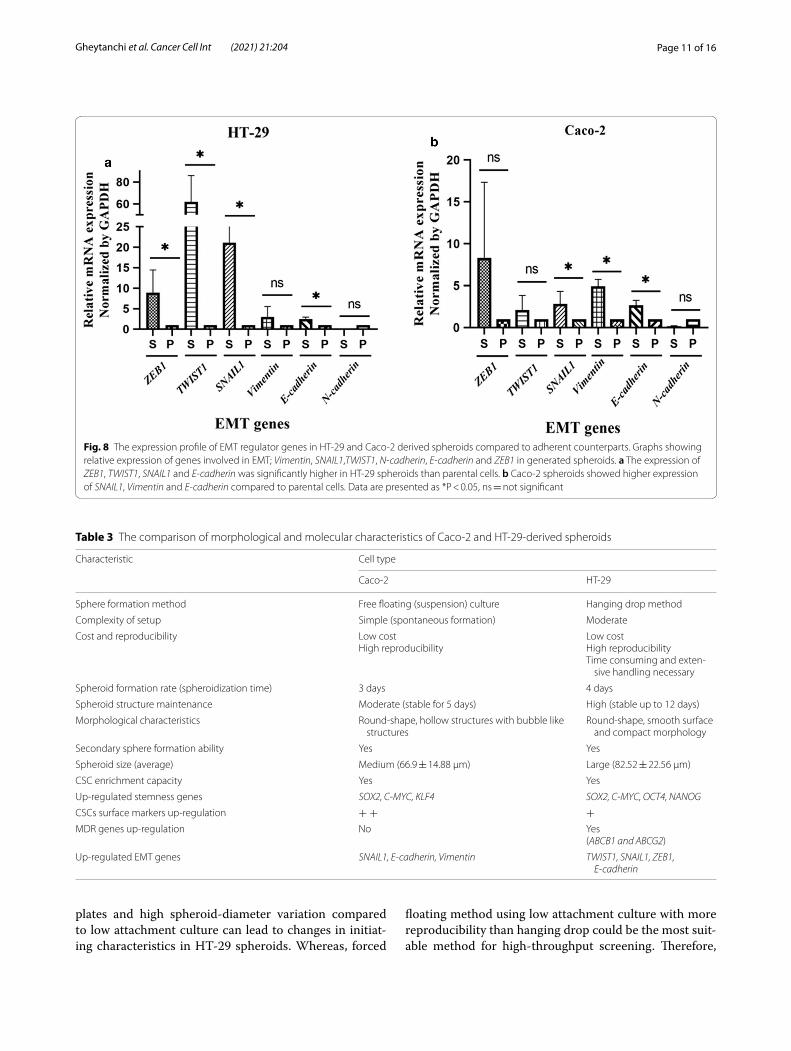
CRC spheroids were driven toward the EMT compared to 2D adherent cellsTo characterize the EMT properties in generated sphe-roids, we next compared the expression profile of EMT inducer genes including TWIST1, SNAIL1, ZEB1, Vimen-tin, E-cadherin and N-cadherin in both spheroids and parental cells. The expression of EMT-promoting genes; ZEB1, TWIST1 and SNAIL1 were significantly up-reg-ulated in HT-29 spheroids compared to 2D monolayer cultures (p-value = 0.03). Unexpectedly, the expres-sion of E-cadherin was up-regulated in HT-29 sphe-roids (Fig. 8a). A significant up-regulation of SNAIL1 and Vimentin were also observed in Caco-2 spheroids than their parental cells (p-value < 0.05). Although ZEB1 showed a higher expression in Caco-2 spheres than 2D counterparts, this upregulation was not statistically sig-nificant (p-value > 0.05) (Fig. 8b). On the contrary, the expression of N-cadherin was down-regulated in both HT-29 and Caco-2 spheroids compared to parental cells (Fig. 8).
DiscussionTo overcome the treatment failure due to the cancer recurrence and metastasis related to CSCs biological fea-tures and their interference with intrinsic drug resistance mechanisms, design of appropriate preclinical models is one of the most pressing issues to test targeted therapies [35, 36]. Identification of the ideal tools to clarify CSC
biology is still proceeding, and great efforts have been paid to improve the isolation and treatment modalities in CSCs research [37]. Spheres culture in which CSCs are trapped and enriched, has been recommended as an extremely effectual CSC isolation method for cancer cell lines and solid tumors [37–39]. Such an anchorage inde-pendent sphere forming system under non-adherent, nutritional deficiency and serum free conditions pre-vents the differentiation of stem-like cells and leads to eliminate non-CSCs cells through apoptosis [40–42]. The superiority of this method is based entirely on the intrin-sic properties of CSCs and leads to enriching the CSC subpopulations regardless of the expression patterns of cell surface markers [43, 44]. Moreover, spheroid cultures offer an ideal platform for routine toxicity and drug effi-cacy testing to determine safe exposure doses in designed cellular models [45–48]. In addition, previous studies have shown that different cancer cell lines form spheres with distinctive morphological and functional features based on sphere-formation method [49–51]. Hence, the status of morphological characteristics, CSC properties and genes expression profile of EMT and drug resistance is important in selecting appropriate model.
In this regard, in the current study, the forced floating using low attachment plates and hanging drop meth-ods, as more applicable and feasible methods were used to generate CSC-enriched spheroids from Caco-2 and HT-29 cell lines, respectively. We chose these two cell lines because of their widespread use in research and
Fig. 5 Increased expression of stemness regulator genes in HT‑29 and Caco‑2‑derived spheroids compared to adherent counterparts. a Quantitative real‑time PCR analysis of HT‑29 spheroids revealed the high expression of key stemness genes OCT4, SOX2, NANOG and C-MYC compared to HT‑29 parental cells with highest expression level of NANOG (p-value < 0.03). b Caco‑2 spheroids showed an increased expression of SOX2, C-MYC and KLF4 compared to Caco‑2 parental cells with highest expression of SOX2 (p-value < 0.029). Relative gene expression was evaluated following 10 and 4 days of culture for HT‑29 and Caco‑2 spheroids, respectively. Data are presented as mean ± SD from four independent experiments as * = P < 0.05, ns = not significant
Page 9 of 16Gheytanchi et al. Cancer Cell Int (2021) 21:204
Fig. 6 Flow cytometry analysis of CRC‑CSC markers expression in HT‑29 and Caco‑2 spheroids compared to their parental cells. Representative flow cytometry plots confirmed both HT‑29 and Caco‑2 spheroids show higher expression of CD166, CD44 and CD133 CRC‑CSC markers as compared to their parental cells. Upregulation of CSC markers in spheroids as compared to their differentiated counterparts was predominant in Caco‑2 spheroids than HT‑29 spheroids. Dot plots show the expression of each marker in one representative experiment
Page 10 of 16Gheytanchi et al. Cancer Cell Int (2021) 21:204
drug discovery. The Caco-2 cell line is widely used in pre-clinical investigations, drug permeability and solubil-ity studies and nanoparticle translocation. The cell line is accepted by the U.S. Food and Drug Administration (FDA) to support new drug applications. In addition both Caco-2 and HT-29 cells are widely applied in the studies of intestinal transport and prediction of bioavailability [52–54].
To generate spheroids, serum-free condition was applied to prevent the differentiation of stem-like cells and elimination of non-CSCs population using sus-pension culturing in low attachment plates [55–58]. Although both cell lines showed capacity to form
spheroids, the HT-29 cells generated loose and disin-tegrating spheres in poly-HEMA plates, whereas, they formed compact spheroids when they were cultured as hanging drops. The comparison of morphological and molecular characteristics of Caco-2 and HT-29 derived spheroids has been summarized in Table 3.
Generation of dense and practical spheroids strongly depend on cellular interactions through the gap junc-tions between single cells [59, 60]. Hence, hanging drop method was selected to generate HT-29 spheroids with compact structure due to its advantages in improve-ment of cells accumulation and adhesion potential with least damage to the spheres through gravitational force. Our observation was in line with the previous study in rat pancreatic beta cells which hanging drop method enhanced connexin protein accumulation and genera-tion of tight spheres [60]. Moreover, murine and human brain tumor cell lines showed more consistent structures in brain tumor spheroids with applying of hanging drop method compared to spinner culture [61]. Therefore, it seems that different cell lines can be compatible with different spheroid formation methods, as in our study as well; hanging drop and low attachment poly-HEMA coated plates were suitable, rapid and time efficient for spheroid formation from HT-29 and Caco-2 cells, respec-tively. Some limitations of hanging drop including pos-sible shattering of spheroids due to mechanical shock in transferring of spheroids to the conventional culture
Table 2 The expression percentage of CD44, CD166, and CD133 common CRC‑CSCs markers in spheroids compared to their parental cells
Data are shown as mean ± SD of four independent experiments. A significant upregulation of CSC markers in spheroids compared to parental cells are presented as * = P < 0.05, *** = P < 0.001, ns = not significant
Markers Cell types
HT‑29 Caco‑2
Parental Spheroid Parental Spheroid
CD44% 1.80 ± 0.77 19.3 ± 6.60* 1.59 ± 0.28 41.05 ± 3.53***
CD133% 1.35 ± 0.19 11.75 ± 4.69* 1.25 ± 0.45 28.25 ± 17.45*
CD166% 1.66 ± 0.37 22.40 ± 5.92* 1.78 ± 0.18 37.15 ± 4.02***
Fig. 7 The expression profile of drug resistance genes in HT‑29 and Caco‑2 derived spheroids compared to their adherent counterparts. The comparative real‑time PCR analysis of ABC transporter genes; ABCB1, ABCC1 and ABCG2 in generated spheroids and their parental cells showed a the higher expression of ABCB1 and ABCG2 in HT‑29 derived spheroids than HT‑29 parental cells, the expression of ABCC1 was also increased, although this increase was not significant (p‑value = 0.14), b whereas there was not observed significant differences between Caco‑2 spheroids and their parental cells. Data are presented as mean ± SD from four independent experiments as * = P < 0.05, ns = not significant
Page 11 of 16Gheytanchi et al. Cancer Cell Int (2021) 21:204
plates and high spheroid-diameter variation compared to low attachment culture can lead to changes in initiat-ing characteristics in HT-29 spheroids. Whereas, forced
floating method using low attachment culture with more reproducibility than hanging drop could be the most suit-able method for high-throughput screening. Therefore,
Fig. 8 The expression profile of EMT regulator genes in HT‑29 and Caco‑2 derived spheroids compared to adherent counterparts. Graphs showing relative expression of genes involved in EMT; Vimentin, SNAIL1,TWIST1, N-cadherin, E-cadherin and ZEB1 in generated spheroids. a The expression of ZEB1, TWIST1, SNAIL1 and E-cadherin was significantly higher in HT‑29 spheroids than parental cells. b Caco‑2 spheroids showed higher expression of SNAIL1, Vimentin and E-cadherin compared to parental cells. Data are presented as *P < 0.05, ns = not significant
Table 3 The comparison of morphological and molecular characteristics of Caco‑2 and HT‑29‑derived spheroids
Characteristic Cell type
Caco‑2 HT‑29
Sphere formation method Free floating (suspension) culture Hanging drop method
Complexity of setup Simple (spontaneous formation) Moderate
Cost and reproducibility Low costHigh reproducibility
Low costHigh reproducibilityTime consuming and exten‑
sive handling necessary
Spheroid formation rate (spheroidization time) 3 days 4 days
Spheroid structure maintenance Moderate (stable for 5 days) High (stable up to 12 days)
Morphological characteristics Round‑shape, hollow structures with bubble like structures
Round‑shape, smooth surface and compact morphology
Secondary sphere formation ability Yes Yes
Spheroid size (average) Medium (66.9 ± 14.88 µm) Large (82.52 ± 22.56 µm)
CSC enrichment capacity Yes Yes
Up‑regulated stemness genes SOX2, C-MYC, KLF4 SOX2, C-MYC, OCT4, NANOG
CSCs surface markers up‑regulation + + +
MDR genes up‑regulation No Yes(ABCB1 and ABCG2)
Up‑regulated EMT genes SNAIL1, E-cadherin, Vimentin TWIST1, SNAIL1, ZEB1, E-cadherin
Page 12 of 16Gheytanchi et al. Cancer Cell Int (2021) 21:204
appropriate cells and spheroid formation methods must be accurately chosen based on aim of study and tumor type.
Although both spheroids derived from HT-29 and Caco-2 cells exhibited similar roundness and smooth surfaces, the light and electron microscopic examination revealed some differences. The Caco-2 spheroids pre-sented hollow core structure as a distinct morphologi-cal feature which has been reported before by others [62, 63]. Samy et al. [64], also found that after 5 days culturing in Matrigel, the Caco-2 cells self-organized into intestinal epithelial-like cells as spheroids with a confluent mon-olayer surrounding a hollow lumen. This hollow structure in Caco-2 cells is account to the functional polarization through E-cadherin-dependent cell–cell adhesion [63, 65]. Since the hollow core is the common feature of the Caco-2 spheres formed by different methods [62, 63], it can infer that this feature is cell line dependent and may not be related to the sphere formation methods.
The Caco-2 spheroids features including the expres-sion of drug transporters similar to human intestinal and also their ability to recreate the spatial organization similar to intestinal epithelial cells have been made them as an improved platform in drug screening [64, 66, 67]. However, Caco-2 spheroids with round shape and hollow lumenized morphology have widely employed as a repro-ducible in vitro model for studying intestinal features and functions as well as intestinal drug metabolism and uptake [64, 68], they are not compatible with anti-cancer drug researches which are based on evaluation of the spheroid size reduction and drug penetration into inner layers. The roundness and smooth surface of spheroids which hide individual cells, is ascribed to high extracel-lular microenvironment (ECM) secretion and strong cell–cell adhesion, and could help analysis of drugs efficacy more accurately [49, 69]. Accordingly, HT-29 spheroids with compact round shape may be more suit-able platforms for anti-cancer drug testing in CRC than Caco-2 spheres. In general, in order to create more prac-tical and functional CRC spheroid models, it is essential to characterize the gene expression alterations, invasion, and drug transporters in spheroids to standardize them based on research requirements [61, 64, 70–72]. Hence, CRC spheroid models were further assessed to determine their potential in enrichment of CSCs-related character-istics, including the cell surface marker patterns, serial sphere formation capability, and gene expression profiles of multipotency, EMT and drug resistance transporters compared to the parental cells. Our findings showed that the expression levels of stemness genes could be affected by CRC spheroid culture, and both spheroids displayed similar high expression levels of pluripotent stem cell genes (KLF4, OCT4 and C-MYC) when compared to
their parental counterparts, while drastic higher expres-sion level of SOX-2 and NANOG was found in Caco-2 and HT-29 spheres, respectively. It has been also docu-mented that the overexpression of NANOG as an onco-gene along with OCT4 is a prominent characteristic of CSCs and is associated with EMT transition of CSCs and drives tumor progression and poor prognosis in patients with breast and colorectal cancer [73–78]. Furthermore, many studies have proved that SOX-2 overexpression is correlated with self-renewal capacity, a poorly differ-entiated-aggressive phenotype and clinicopathological characteristics of CRC patients [79–81]. Therefore, high expression levels of stemness genes, specially, SOX2 and NANOG that were observed in our CRC spheroids could be served as an indicator of self-renewal potential.
We extended our study by assessing the expression of CSC surface markers in CRC spheroids compared to the parental cells. Our findings independently corroborated the expression profiles of stem cell-related genes which evidenced by enriching the CD166, CD44, CD133 posi-tive populations of CSCs in CRC spheroids. This was in line with other reports in various cancers, where non-adherent spheroid cultures possessed more character-istics of CSCs [44, 82–85]. CD44 as a transmembrane adhesion receptor for hyaluronic acid, binds to the ECM and plays an important role in matrix adhesion in response to a cellular microenvironment and is impli-cated in enhancing cellular aggregation [86, 87]. CD166 and CD133 are also cell adhesion molecules which along with CD44 increase the clonal formation capacity in CRC and are related to CSC properties [85, 88]. The cell adhe-sion proteins are participate in directing cell polarity and asymmetric stem cell division in development [89]. Although, there are limited studies on Caco-2 spheroids, we conclude that the higher expression of CD44, CD133 and CD166 as robust CSC markers in cells derived from Caco-2 spheroid might be related to specific cellular junctions in these spheroids, which provide signals via molecular crosstalk between these cells for maintenance of CSC phenotype in Caco-2 spheroids. In addition, due to the absence of CSCs in necrotic core of spheroids [90], we assume that many of cells in HT-29 spheroids that were negative for expression of CSC markers may belong to this layer, whereas, in case of Caco-2 spheroids, there were hollow core instead of necrotic layer. Hence, this feature might account for predominant expression of CD44, CD166 and CD133 CSC markers observed in Caco-2 spheroid-derived cells as compared to cells derived from HT-29 spheroid.
Moreover, serial sphere formation which has been applied as an appropriate platform for long-term expan-sion of cells with self-renewal capacity and imitates the tumor heterogeneity [24], was maintained in CRC
Page 13 of 16Gheytanchi et al. Cancer Cell Int (2021) 21:204
spheroids cells during the long-term cultures. Thus, these results further advocated the efficiency of the serum free and non-adherent condition in enrichment of CSCs. The complexity of cross-talks between stem cell–related genes and EMT are still unclear and need to be more clarified. To determine the association of the EMT genes expression level with the enriched CSC nature in sphe-roids, we compared the expression of TWIST1, SNAIL1, ZEB1, Vimentin, E-cadherin and N-cadherin in sphe-roids than parental cells. Our results showed that in spite of up-regulation of TWIST1, SNAIL1, ZEB1 and Vimentin, unexpectedly E-cadherin was up-regulated and N-cadherin was down-regulated in spheroids which are in contrast to the results of EMT process from other similar studies [91–94]. Several reports suggested the strong correlation of E-cadherin down-regulation and N-cadherin up-regulation as the main hallmark of EMT [76, 91–95]. It can be postulated that the expression level of EMT genes, might be varied widely due to the absence of definite correlation between the gene transcripts levels and their corresponding proteins and do not necessarily reflect their protein levels in CSCs [96–100]. In addition, Jolly, Jia et al. displayed that the partial EMT is associated with stemness [101]. Hence, deciphering the coupling of EMT and stemness needs to be further investigated.
The increased expression of ATP-binding cassette (ABC) transporter genes such as ABCB1, ABCC1, and ABCG2, as other CSC-related characteristic is involved in regulation of self-renewal and multidrug resistance in ovarian and colon cancer cell lines [102–107]. In agree-ment with Collura et al. [108], our results also demon-strated significant increase in the expression of ABC B1 and G2 genes in HT-29 spheres compared to monolay-ers and Caco-2 spheres which further verified the CSCs enrichment.
Although the results of our study present robust and reproducible spheroid models for CSC research, these findings should be considered in the light of some limita-tions, including evaluation of the spheroids of only two CRC cell lines and also performing additional functional analysis on metastatic capacity, ECM remodeling, chem-oresistancy and dormancy. This information would pro-vide new insight into the efficiency of the CRC spheroid model in CSC research.
ConclusionsIn summary, we present here the first study demon-strating CSC-enrichment in Caco-2 cells without using special scaffold or biochemical materials. Despite the hollow core structure and no increased expression of ABC transporter genes in Caco-2 spheroids, our findings indicated that spheroids culture from both HT-29 and Caco-2 cell lines is capable to enhance the expression of
genes involved in CSCs regulation. It enables us to recre-ate the complexity of in vivo tumors including presence of CSCs subpopulation, resistance to chemotherapeutics and invasion potential and should be considered as more realistic CRC in vitro models for further investigation in CSC research.
Abbreviations2D: Two‑dimensional; 3D: Three‑dimensional; ABC: ATP‑binding cassette; ABCB1: ATP Binding Cassette Subfamily B Member 1; ABCC1: ATP Binding Cassette Subfamily C Member 1; ABCG2: ATP Binding Cassette Subfamily G Member 2; ALDH1: Aldehyde dehydrogenase 1; bFGF: Basic Fibroblast Growth Factor; C‑MYC: C‑MYC proto‑oncogene; CRC : Colorectal Cancer; CSCs: Cancer Stem Cells; DMEM: Dulbecco’s modified Eagle’s medium; E‑cadherin: Epithelial Cadherin; EGF: Epidermal Growth Factor; EMT: Epithelial‑to‑Mesenchymal Transition; FBS: Fetal bovine serum; FDA: Food and Drug Administration; GAPDH: Glyceraldehyde‑3‑phosphate dehydrogenase; KLF4: Kruppel‑Like Factor 4; MDR: Major Multi‑drug Resistant; NANOG: Nanog homeobox; N‑cadherin: Neural Cadherin; OCT4: Octamer‑binding transcription factor 4; PBS: Phosphate buffer saline; poly‑HEMA: Poly‑2‑hydroxyethyl methacrylate; RT‑qPCR: Real‑Time Polymerase Chain Reaction; SEM: Scanning Electron Microscopy; SNAIL1: Snail family zinc finger 1; SOX2: SRY‑Box Transcription Fac‑tor 2; TWIST1: Twist family bHLH transcription factor 1; ZEB1: Zinc finger E‑box homeodomain 1.
AcknowledgementsThis study was conducted as part of a PhD thesis and was supported by a grant from the Oncopathology Research Center (OPRC), Iran University of Medical Sciences (IUMS) (Grant Number #29059).
Authors’ contributionsZM and RG designed and supervised the project, and approved all parts of the manuscript. FA designed and supervised the project. EG and MN planned and performed the experiments, analyzed and interpreted the data, and wrote the manuscript. FKB critically revised and edited the manuscript in native English. ESM performed the flow cytometry. MB analyzed the flow cytometry data. All authors read and approved the final manuscript.
FundingThe funding source is a college institute (IUMS) and has sponsored the project financially and approved (Grant Number #29059).
Availability of data and materialsThe analyzed data during the current study are available from the correspond‑ing author on reasonable request.
Declarations
Ethics approval and consent to participateAll procedures performed in this study were in line with the ethical standards of the institution at which this study was conducted.
Consent for publicationAll listed authors discussed results and commented on the submitted manuscript.
Competing interestsThe authors declare no conflict of interests.
Author details1 Oncopathology Research Center, Iran University of Medical Sciences, Tehran, Iran. 2 Department of Molecular Medicine, Faculty of Advanced Technologies in Medicine, Iran University of Medical Sciences, Tehran, Iran. 3 Department of Oncology, University of Alberta, Edmonton, Alberta, Canada. 4 Nanotech‑nology Research Centre, Department of Pharmaceutics, Faculty of Pharmacy, Tehran University of Medical Sciences, Tehran, Iran. 5 Immunoregulation Research Center, Shahed University, Tehran, Iran.
Page 14 of 16Gheytanchi et al. Cancer Cell Int (2021) 21:204
Received: 31 December 2020 Accepted: 24 March 2021
References 1. Siegel RL, Miller KD, Jemal A. Cancer statistics, 2020. CA Cancer J Clin.
2020;70(1):7–30. 2. Neo JH, et al. Changes in the renin angiotensin system during the
development of colorectal cancer liver metastases. BMC Cancer. 2010;10(1):134.
3. Dhawan P, et al. Cancer stem cells and colorectal cancer: an overview. Curr Top Med Chem. 2011;11(13):1592–8.
4. Potten CS, Loeffler M. Stem cells: attributes, cycles, spirals, pitfalls and uncertainties. Lessons for and from the crypt. Development. 1990;110(4):1001–20.
5. Munro MJ, et al. Cancer stem cells in colorectal cancer: a review. J Clin Pathol. 2018;71(2):110–6.
6. Tai M‑H, et al. Oct4 expression in adult human stem cells: evidence in support of the stem cell theory of carcinogenesis. Carcinogenesis. 2005;26(2):495–502.
7. Franco SS, et al. In vitro models of cancer stem cells and clinical applica‑tions. BMC Cancer. 2016;16(2):738.
8. Cho RW, Clarke MF. Recent advances in cancer stem cells. Curr Opin Genet Dev. 2008;18(1):48–53.
9. Hanahan D, Weinberg RA. Hallmarks of cancer: the next generation. Cell. 2011;144(5):646–74.
10. Clarke MF, Becker MW. Stem cells: the real culprits in cancer? Sci Am. 2006;295(1):52–9.
11. Alison MR, et al. Cancer stem cells: in the line of fire. Cancer Treat Rev. 2012;38(6):589–98.
12. Sell S. Cancer stem cells and differentiation therapy. Tumor Biol. 2006;27(2):59–70.
13. Dana H, Mahmoodi G, Marmari V. An overview of cancer stem cell. J Stem Cell Res Ther. 2017;1(4):169–74.
14. Yoo YD, et al. Molecular characteristics of cancer stem‑like cells derived from human breast cancer cells. Anticancer Res. 2013;33(3):763–77.
15. Lin EH, et al. Elevated circulating endothelial progenitor marker CD133 messenger RNA levels predict colon cancer recurrence. Cancer Interdis‑cipl Int J Am Cancer Soc. 2007;110(3):534–42.
16. Liu G, et al. Analysis of gene expression and chemoresistance of CD133+ cancer stem cells in glioblastoma. Mol Cancer. 2006;5(1):67.
17. Hermann PC, et al. Distinct populations of cancer stem cells determine tumor growth and metastatic activity in human pancreatic cancer. Cell Stem Cell. 2007;1(3):313–23.
18. Mimeault M, Batra SK. New advances on critical implications of tumor‑and metastasis‑initiating cells in cancer progression, treatment resist‑ance and disease recurrence. Histol Histopathol. 2010;25(8):1057.
19. Zhou B‑BS, et al. Tumour‑initiating cells: challenges and opportunities for anticancer drug discovery. Nat Rev Drug Discov. 2009;8(10):806–23.
20. Kawasaki BT, et al. Targeting cancer stem cells with phytochemicals. Mol Intervent. 2008;8(4):174.
21. Fong D, Chan MM. Targeting cancer stem cells with phytochemicals: inhibition of the rat C6 glioma side population by curcumin. In: Stem cells and cancer stem cells, vol. 1. Springer; 2012. p. 61–8.
22. Borovski T, et al. Cancer stem cell niche: the place to be. Can Res. 2011;71(3):634–9.
23. de Sousa EMF, et al. Targeting Wnt signaling in colon cancer stem cells. Clin Cancer Res. 2011;17(4):647–53.
24. Fang Y, Eglen RM. Three‑dimensional cell cultures in drug discovery and development. Slas Discov Adv Life Sci R&D. 2017;22(5):456–72.
25. Yoon SK. The biology of cancer stem cells and its clinical implication in hepatocellular carcinoma. Gut Liver. 2012;6(1):29.
26. Antoni D, et al. Three‑dimensional cell culture: a breakthrough in vivo. Int J Mol Sci. 2015;16(3):5517–27.
27. Lin RZ, Chang HY. Recent advances in three‑dimensional multicellular spheroid culture for biomedical research. Biotechnol J Healthcare Nutr Technol. 2008;3(9–10):1172–84.
28. Kimlin LC, Casagrande G, Virador VM. In vitro three‑dimensional (3D) models in cancer research: an update. Mol Carcinog. 2013;52(3):167–82.
29. Amaral RL, et al. Comparative analysis of 3D bladder tumor spheroids obtained by forced floating and hanging drop methods for drug screening. Front Physiol. 2017;8:605.
30. Bielecka ZF, et al. Three‑dimensional cell culture model utilization in cancer stem cell research. Biol Rev. 2017;92(3):1505–20.
31. Ishiguro T, et al. Tumor‑derived spheroids: relevance to cancer stem cells and clinical applications. Cancer Sci. 2017;108(3):283–9.
32. Ronen J, Hayat S, Akalin A. Evaluation of colorectal cancer subtypes and cell lines using deep learning. Life Sci Alliance. 2019;2(6):e201900517.
33. Berg KC, et al. Multi‑omics of 34 colorectal cancer cell lines‑a resource for biomedical studies. Mol Cancer. 2017;16(1):1–16.
34. De Both N, et al. A comparative evaluation of various invasion assays testing colon carcinoma cell lines. Br J Cancer. 1999;81(6):934–41.
35. Woodward WA, et al. On mammary stem cells. J Cell Sci. 2005;118(16):3585–94.
36. Rosen JM, Jordan CTJS. The increasing complexity of the cancer stem cell paradigm. Science. 2009;324(5935):1670–3.
37. Zhang J, et al. Enrichment and characterization of cancer stem‑like cells in ultra‑low concentration of serum and non‑adhesive culture system. Am J Transl Res. 2018;10(5):1552.
38. Hueng D‑Y, et al. Isolation and characterization of tumor stem‑like cells from human meningiomas. J Neuro‑Oncol. 2011;104(1):45–53.
39. Zhong Y, et al. Spheres derived from the human SK‑RC‑42 renal cell carcinoma cell line are enriched in cancer stem cells. Cancer Lett. 2010;299(2):150–60.
40. Pastrana E, Silva‑Vargas V, Doetsch F. Eyes wide open: a critical review of sphere‑formation as an assay for stem cells. Cell Stem Cell. 2011;8(5):486–98.
41. Ottaviano L, et al. Wide open: a critical review of sphere‑formation as an assay for stem cells. Cell stem cell 8: 486‑498. Cancer Stem Cells Hum Osteosarcoma. 2016;32:1408–19.
42. Ma X‑L, et al. Sphere‑forming culture enriches liver cancer stem cells and reveals Stearoyl‑CoA desaturase 1 as a potential therapeutic target. BMC Cancer. 2019;19(1):760.
43. Liu Z, et al. Hepatitis B virus PreS1 facilitates hepatocellular carcinoma development by promoting appearance and self‑renewal of liver cancer stem cells. Cancer Lett. 2017;400:149–60.
44. Chen Y, et al. CD133+ EpCAM+ phenotype possesses more character‑istics of tumor initiating cells in hepatocellular carcinoma Huh7 Cells. Int J Biol Sci. 2012;8(7):992.
45. Godoy P, et al. Recent advances in 2D and 3D in vitro systems using primary hepatocytes, alternative hepatocyte sources and non‑paren‑chymal liver cells and their use in investigating mechanisms of hepato‑toxicity, cell signaling and ADME. Arch Toxicol. 2013;87(8):1315–530.
46. Berry DP, et al. Human wound contraction: collagen organization, fibro‑blasts, and myofibroblasts. Plastic Reconstruct Surg. 1998;102(1):124–31 (discussion 132).
47. Grinnell F. Fibroblast biology in three‑dimensional collagen matrices. Trends Cell Biol. 2003;13(5):264–9.
48. Boudreau N, Werb Z, Bissell MJ. Suppression of apoptosis by basement membrane requires three‑dimensional tissue organization and with‑drawal from the cell cycle. Proc Natl Acad Sci. 1996;93(8):3509–13.
49. Kenny PA, et al. The morphologies of breast cancer cell lines in three‑dimensional assays correlate with their profiles of gene expression. Mol Oncol. 2007;1(1):84–96.
50. Bissell M, Kenny P, Radisky DC. Microenvironmental regulators of tissue structure and function also regulate tumor induction and progression: the role of extracellular matrix and its degrading enzymes. In: Cold Spring Harbor symposia on quantitative biology. Cold Spring Harbor Laboratory Press; 2005.
51. Kenny P. Three‑dimensional extracellular matrix culture models of EGFR signalling and drug response. Biochem Soc Trans. 2007;35:665–8.
52. Larregieu CA, Benet LZ. Drug discovery and regulatory considerations for improving in silico and in vitro predictions that use Caco‑2 as a surrogate for human intestinal permeability measurements. AAPS J. 2013;15(2):483–97.
53. Jochems PG, et al. Evaluating human intestinal cell lines for studying dietary protein absorption. Nutrients. 2018;10(3):322.
54. Awortwe C, Fasinu P, Rosenkranz B. Application of Caco‑2 cell line in herb‑drug interaction studies: current approaches and challenges. J Pharma Pharma Sci. 2014;17(1):1.
Page 15 of 16Gheytanchi et al. Cancer Cell Int (2021) 21:204
55. Lee J, et al. Tumor stem cells derived from glioblastomas cultured in bFGF and EGF more closely mirror the phenotype and genotype of primary tumors than do serum‑cultured cell lines. Cancer Cell. 2006;9(5):391–403.
56. Dontu G, et al. In vitro propagation and transcriptional profil‑ing of human mammary stem/progenitor cells. Genes Dev. 2003;17(10):1253–70.
57. Dotse E, Bian Y. Isolation of colorectal cancer stem‑like cells. Cyto‑technology. 2016;68(4):609–19.
58. Ibiyeye KM, Zuki ABZ. Cockle shell‑derived aragonite CaCO3 nanoparticles for co‑delivery of doxorubicin and thymoquinone eliminates cancer stem cells. Int J Mol Sci. 2020;21(5):1900.
59. Bavamian S, et al. Islet‑cell‑to‑cell communication as basis for normal insulin secretion. Diabetes Obesity Metab. 2007;9:118–32.
60. Kim H, et al. Optimal formation of genetically modified and func‑tional pancreatic islet spheroids by using hanging‑drop strategy. In: Transplantation Proceedings. Elsevier; 2013.
61. Del Duca D, Werbowetski T, Del Maestro RF. Spheroid preparation from hanging drops: characterization of a model of brain tumor inva‑sion. J Neuro‑Oncol. 2004;67(3):295–303.
62. Kataoka K, Rikitake Y, Ayabe Y. Expression pattern of Dkk‑3, a secreted Wnt pathway inhibitor, in mouse intestinal tissue and three‑dimensional cultured Caco‑2 spheroids. J Stem Cells Regener Med. 2015;11(2):48.
63. Elamin E, et al. Effects of ethanol and acetaldehyde on tight junction integrity: in vitro study in a three dimensional intestinal epithelial cell culture model. PLoS ONE. 2012;7(4):e35008.
64. Samy KE, et al. Human intestinal spheroids cultured using Sacrificial Micromolding as a model system for studying drug transport. Sci Rep. 2019;9(1):1–12.
65. Schreider C, et al. Integrin‑mediated functional polarization of Caco‑2 cells through E‑cadherin—actin complexes. J Cell Sci. 2002;115(3):543–52.
66. Maubon N, et al. Analysis of drug transporter expression in human intestinal Caco‑2 cells by real‑time PCR. Fundam Clin Pharmacol. 2007;21(6):659–63.
67. Englund G, et al. Regional levels of drug transporters along the human intestinal tract: co‑expression of ABC and SLC trans‑porters and comparison with Caco‑2 cells. Eur J Pharma Sci. 2006;29(3–4):269–77.
68. Cerchiari A, et al. Formation of spatially and geometrically controlled three‑dimensional tissues in soft gels by sacrificial micromolding. Tissue Eng Part C Methods. 2015;21(6):541–7.
69. Lin R‑Z, et al. Dynamic analysis of hepatoma spheroid for‑mation: roles of E‑cadherin and β1‑integrin. Cell Tissue Res. 2006;324(3):411–22.
70. Sei Y, et al. Engineering living systems on chips: from cells to human on chips. Microfluidics Nanofluidics. 2014;16(5):907–20.
71. Kim HJ, Ingber DE. Gut‑on‑a‑Chip microenvironment induces human intestinal cells to undergo villus differentiation. Integr Biol. 2013;5(9):1130–40.
72. Short SP, Costacurta PW, Williams CS. Using 3D organoid cultures to model intestinal physiology and colorectal cancer. Curr Colorectal Cancer Rep. 2017;13(3):183–91.
73. Wang D, et al. Oct‑4 and Nanog promote the epithelial‑mesenchymal transition of breast cancer stem cells and are associated with poor prognosis in breast cancer patients. Oncotarget. 2014;5(21):10803.
74. Meng H‑M, et al. Over‑expression of Nanog predicts tumor pro‑gression and poor prognosis in colorectal cancer. Cancer Biol Ther. 2010;9(4):295–302.
75. Wen J, et al. Oct4 and Nanog expression is associated with early stages of pancreatic carcinogenesis. Pancreas. 2010;39(5):622–6.
76. Chiou S‑H, et al. Coexpression of Oct4 and Nanog enhances malig‑nancy in lung adenocarcinoma by inducing cancer stem cell–like properties and epithelial–mesenchymal transdifferentiation. Cancer Res. 2010;70(24):10433–44.
77. Gong S, et al. Regulation of NANOG in cancer cells. Mol Carcinogenesis. 2015;54(9):679–87.
78. Ibrahim EE, et al. Embryonic NANOG activity defines colorectal cancer stem cells and modulates through AP1‑and TCF‑dependent mecha‑nisms. Stem Cells. 2012;30(10):2076–87.
79. Talebi A, Kianersi K, Beiraghdar M. Comparison of gene expression of SOX2 and OCT4 in normal tissue, polyps, and colon adenocarcinoma using immunohistochemical staining. Adv Biomed Res. 2015;4:234.
80. Ben‑Porath I, et al. An embryonic stem cell–like gene expression signature in poorly differentiated aggressive human tumors. Nat Genet. 2008;40(5):499.
81. Chen Y, et al. The molecular mechanism governing the oncogenic potential of SOX2 in breast cancer. J Biol Chem. 2008;283(26):17969–78.
82. Ma S, et al. Identification and characterization of tumorigenic liver cancer stem/progenitor cells. Gastroenterology. 2007;132(7):2542–56.
83. Singh SK, et al. Identification of a cancer stem cell in human brain tumors. Cancer Res. 2003;63(18):5821–8.
84. Eramo A, et al. Identification and expansion of the tumorigenic lung cancer stem cell population. Cell Death Diff. 2008;15(3):504–14.
85. Du L, et al. CD44 is of functional importance for colorectal cancer stem cells. Clin Cancer Res. 2008;14(21):6751–60.
86. Wang L, et al. The role of CD44 and cancer stem cells. In: cancer stem cells. Springer; 2018. p. 31–42.
87. Thapa R, Wilson GD. The importance of CD44 as a stem cell biomarker and therapeutic target in cancer. Stem Cells Int. 2016. https:// doi. org/ 10. 1155/ 2016/ 20872 04.
88. Zhou Y, et al. Cancer stem cells in progression of colorectal cancer. Oncotarget. 2018;9(70):33403.
89. Picco V, Hudson C, Yasuo H. Ephrin‑Eph signalling drives the asymmet‑ric division of notochord/neural precursors in Ciona embryos. Develop‑ment. 2007;134(8):1491–7.
90. Pinto B, et al. Three‑dimensional spheroids as in vitro preclinical models for cancer research. Pharmaceutics. 2020;12(12):1186.
91. Myong N‑H. Loss of E‑cadherin and acquisition of vimentin in epithelial‑mesenchymal transition are noble indicators of uterine cervix cancer progression. Korean J Pathol. 2012;46(4):341.
92. Calvet CY, André FM, Mir LM. The culture of cancer cell lines as tumor‑spheres does not systematically result in cancer stem cell enrichment. PLoS ONE. 2014;9(2):e89644.
93. Zhou J, et al. Expression of E‑cadherin and vimentin in oral squamous cell carcinoma. Int J Clin Exp Pathol. 2015;8(3):3150.
94. Vigenswari R. Expression of E‑cadherin and vimentin in oral squamous cell carcinoma and its correlation with grading and nodal metastasis. Coimbatore: Coimbatore Medical College; 2019.
95. Fontana F, et al. Epithelial‑to‑mesenchymal transition markers and CD44 isoforms are differently expressed in 2D and 3D cell cultures of prostate cancer cells. Cells. 2019;8(2):143.
96. Carlson MW, Iyer VR, Marcotte EM. Quantitative gene expression assessment identifies appropriate cell line models for individual cervical cancer pathways. BMC Genomics. 2007;8(1):117.
97. Gry M, et al. Correlations between RNA and protein expression profiles in 23 human cell lines. BMC Genomics. 2009;10(1):1–14.
98. Asplund A, et al. Expression profiling of microdissected cell populations selected from basal cells in normal epidermis and basal cell carcinoma. Br J Dermatol. 2008;158(3):527–38.
99. Dhanasekaran SM, et al. Delineation of prognostic biomarkers in pros‑tate cancer. Nature. 2001;412(6849):822–6.
100. Mousses S, et al. Clinical validation of candidate genes associated with prostate cancer progression in the CWR22 model system using tissue microarrays. Can Res. 2002;62(5):1256–60.
101. Jolly MK, et al. Coupling the modules of EMT and stemness: a tunable ‘stemness window’model. Oncotarget. 2015;6(28):25161.
102. Raaijmakers M. ATP‑binding‑cassette transporters in hematopoietic stem cells and their utility as therapeutical targets in acute and chronic myeloid leukemia. Leukemia. 2007;21(10):2094–102.
103. Dean M, Hamon Y, Chimini G. The human ATP‑binding cassette (ABC) transporter superfamily. J Lipid Res. 2001;42(7):1007–17.
104. Wilkens S. Structure and mechanism of ABC transporters. F1000prime Rep. 2015;7:14.
105. Januchowski R, et al. Microarray‑based detection and expression analysis of ABC and SLC transporters in drug‑resistant ovarian cancer cell lines. Biomed Pharmacother. 2013;67(3):240–5.
106. Januchowski R, et al. Microarray‑based detection and expression analy‑sis of new genes associated with drug resistance in ovarian cancer cell lines. Oncotarget. 2017;8(30):49944.

Page 16 of 16Gheytanchi et al. Cancer Cell Int (2021) 21:204
• fast, convenient online submission
•
thorough peer review by experienced researchers in your field
• rapid publication on acceptance
• support for research data, including large and complex data types
•
gold Open Access which fosters wider collaboration and increased citations
maximum visibility for your research: over 100M website views per year •
At BMC, research is always in progress.
Learn more biomedcentral.com/submissions
Ready to submit your researchReady to submit your research ? Choose BMC and benefit from: ? Choose BMC and benefit from:
107. García‑González X, et al. Variants in CDA and ABCB1 are predictors of capecitabine‑related adverse reactions in colorectal cancer. Oncotarget. 2015;6(8):6422.
108. Collura A, et al. Extensive characterization of sphere models established from colorectal cancer cell lines. Cell Mol Life Sci. 2013;70(4):729–42.
Publisher’s NoteSpringer Nature remains neutral with regard to jurisdictional claims in pub‑lished maps and institutional affiliations.