morphological and hematological responses to hypoxia during
TRANSCRIPT

MORPHOLOGICAL AND HEMATOLOGICAL RESPONSES TO HYPOXIA DURING
DEVELOPMENT IN THE JAPANESE QUAIL, Coturnix coturnix
Nourhan Elmonoufy.
Thesis Prepared for the Degree of
MASTER OF SCIENCE
UNIVERSITY OF NORTH TEXAS
May 2003
APPROVED: Warren Burggren, Major Professor and Dean of
College of Arts and Science Thomas Beitinger, Committee Member Lloyd Fitzpatrick, Committee Member Earl Zimmerman, Chair of the Department of
Biological Sciences C. Neal Tate, Dean of the Robert B. Toulouse
School of Graduate Studies

Elmonoufy, Nourhan. Morphological and Hematological Responses to Hypoxia During
Development in the Japanese quail, Coturnix coturnix. Master of Science (Biology).
May 2003., 60 pp., 4 tables, 6 figures, references, 89 titles.
Hypoxic responses in quail development differ depending upon stage, duration and level
of oxygen partial pressure of embryo. Incubation was switched to/from 110mmHg partial
pressure (hypoxia), to/from 150mmHg (normoxia) during different stages in
development, and control was incubated in normoxia throughout. Hatchability and
embryo survival resulted in no hatchlings in continuous hypoxia. Responses to various
hypoxic exposures throughout development resulted in recovery/repair of hypoxic
damage by hatch. Heart and body mass, beak and toe length, hemoglobin, and hematocrit
were measured to determine embryo responses to hypoxia during development at days
10, 15, and hatch. Hypoxia seemed to have the most deleterious effects on eggs in
continuous hypoxia. Collectively, data indicate critical developmental windows for
hypoxia susceptibility, especially during mid-embryonic development.

Copyright 2003
by
Nourhan Elmonoufy
ii

ACKNOWLEDGMENTS
In the name of Allah, Most Gracious, Most Merciful
I wish to express my gratitude to the many people who have helped me complete this
thesis. I want to thank Dr.Warren Burggren for not only being a mentor but for giving me
the space, literally and figuratively to try my hand at physiology. With his guidance and
knowledge and his undying patience with me, I was able to “keep the momentum”. To
my committee members, Dr.Tom Beitinger and Dr.Lloyd Fitzpatrick, thank you for your
positive feedback and help. I am especially grateful for the financial support provided by
NSF. I would also like to acknowledge and thank Dr.Ed Dzialowski, Tasha, Juli, and
Jeremy for their professional expertise and never ending help, and whose friendships
have provided the mental and emotional support throughout my graduate career. Last, but
definitely not least, I want to thank my friends and family. I especially want to thank my
family; my mom, Nefisa, for the strength she always seems to pass on to me, my father,
Amr, for generously passing his wisdom and making the sacrifices he has chosen to
make, my brothers, Ahmed and Mohamed whose sense of humor reminded me to laugh,
and lastly, my sister, Noran, who always listened and told me what she really thought.
iii

TABLE OF CONTENTS
Page
ACKNOWLEDGEMENTS............................................................................................... iii
LIST OF TABLES............................................................................................................. vi
LIST OF FIGURES .......................................................................................................... vii
Chapter
1. INTRODUCTION ...............................................................................................1
2. MATERIALS AND METHODS.........................................................................8
Animals and Incubation
Experimental Protocol
Anatomical Measurements
Hematological Measurements
Statistical Analysis
3. RESULTS ..........................................................................................................12
Normal Development
Survival
Body Mass
Toe and Beak Length
Heart Mass
Heart to Body Mass Ratio
Hematology
Effects of Hypoxic Incubation
Body Mass
Toe and Beak Length
Heart Mass
Heart to Body Mass Ratio
Hematology: Hemoglobin and Hematocrit
iv

4. DISCUSSION …………………………………………………………...... 22 Hypoxic Incubation and Survival, Hatchability and Mortality Embryonic Growth and Development Responses to Hypoxia Hypoxic Incubation and Hematology
5. RECOMMENDATIONS FOR FUTURE EXPERIMENTS …………....... 32
REFERENCE LIST ………………………………………………………. 35
v
LIST OF TABLES
Table Page 1. Mean body mass (g) and calculated mean water content during development, for control and each treatment group at days 10, 15, and hatch .…………………………………………………………………… 48 2. Mean toe and beak length (mm) during development, for control and each treatment group at days 10, 15, and hatch ..……………………………. 49 3. Mean heart mass (mg) and calculated mean water content during development, for control and each treatment group at days 10, 15, and hatch ………………………………………………………………….… 50 4. Mean hematocrit (%) and hemoglobin (g%) during development for control and each treatment group at days 10, 15, and hatch ..…………….… 51
vi

LIST OF FIGURES
Figures Page
1. Experimental protocol illustrating the various hypoxic treatments (acute and chronic)
on development of quail.............................................................................................. 52
2. Survivorship of control and treatment groups measured at days 10, 15, and hatch ...54
3. Mean body mass during development .........................................................................56
4. Morphology during development: mean beak and third toe........................................58
5. Mean heart mass during development .........................................................................60
6. Mean heart to body mass ratio during development....................................................62
vii

CHAPTER 1
INTRODUCTION
Although chicken eggs are commonly used in avian hypoxic studies
(Van Liere and Stickney, 1963; Olander et al., 1967; Meuer and Baumann,
1987; Hochachka, 1997), this study examines the influence of hypoxic
incubation on development of Japanese quail eggs (Coturnix coturnix). To date
there have been no studies of hypoxic effects on quail eggs or embryos. Quail
are precocious, hardy birds that have adapted to many different environments
(Microlivestock, 1991), but prefer temperate climates. Quail are not native to
the Americas and were introduced to the United States in 1870 (Woodard et al.,
1973). Domesticated quail were first used in laboratory, in the U.S. post World
War II importation, from Mount Fujiyama Japan (Woodard et al. 1973;
Microlivestock, 1991). Female quail incubate eggs and raise quail chicks,
while males leave and court other females when their partners begin nesting.
Nests are on the ground and well hidden in grass, dead brush, and under
bushes. Under favorable environments quail have the ability to produce 3 to 4
clutches per year, and produce for extended periods during their 1-2 year life
span; averaging 25 eggs per year. Quail exhibit north-south migratory behavior
(Woodard et al., 1973; Johnsgard, 1988). Their migration covers 400-1000 km,
which is notable for a bird not known for its flying capability (Hoffman, 1988).
1

Quail are similar to chickens and turkeys in their sexual development
and egg production, while differing from these species in their distinct egg
color patterns and pigmentation. The average quail egg is approximately 8% of
the female quail body weight, while chicken and turkey eggs are 3% and 1% of
their body weights, respectively. In contrast to first laid chicken and turkey
eggs, first quail eggs are smaller than succeeding eggs. Quail lay 7-14 eggs per
clutch (Hoffman, 1988). An egg averages 29.8 by 21.5 mm in size and weighs
7.6 g (Johnsgard, 1988). Incubation time is 15-18 days.
From the early assumption that bird embryos developed independent of the
surrounding air (Erman, 1818), research in developmental biology of gas exchange has
progressed steadily. Avian models have been particularly useful (Hoyt, 1987; Klika,
1997; Menna and Mortola, 2001; Jurgens and Gros, 2002; Maina, 2002). Hatchability
of bird eggs depends primarily on temperature, ambient gas partial pressures of
oxygen, carbon dioxide and water vapor (Lundy, 1969; Pettit and Whittow, 1982;
Visschedijk, 1985). In most experimental studies, hatchability is the ultimate gauge
for the successful gaseous exchange of the avian embryo (Visschedijk, 1980; Pettit and
Whittow, 1982; Visschedijk, 1985). Not surprisingly, hatchability of eggs normally
laid at or near sea level progressively decreases when eggs are incubated at higher
altitudes (Smith et al., 1969; Carey et al., 1982; Christensen and Bagley, 1984; Menna,
2002). Oxygen is required by avian embryos for maintenance of existing tissues and
for synthesis of new cells from raw materials contained within the egg (Olander et al.,
1967; Carey et al., 1982; Richards et al., 1991; Meuer et al., 1992; Altimiras and Phu,
2

2000; Wieser, 2002). Thus, the restriction of oxygen below critical levels, which
could occur at high altitude or in fossorial species, could potentially retard growth and
reduce survival.
Almost all studies on the effect of oxygen on avian development have exposed
embryos to chronic hypoxia throughout the entire incubation. However, it is still
unknown at what developmental stage, if any, that egg survival is particularly
vulnerable to low oxygen levels and why exposure at these stages leads to a decrease
in hatching success. The purpose of this study is to use hypoxic exposure at different
stages during incubation to potentially provide insights on when hypoxia affects key
morphological features of avian development. Although there are many potential
physiological changes contingent upon incubation in hypoxic conditions, my thesis
will focus on developmental trajectories and systems involved in the delivery of
oxygen in the developing embryo.
Debilitating effects of hypoxia on avian embryos are reported to lead to
characteristic anatomical and physiological alterations (Olander et. al., 1967; Altimiras
and Phu, 2000; Mulder et al., 2000; Hopkins and Powell, 2001; Miller et al., 2002), as
well as pathophysiological conditions. Hypoxia during incubation retards embryonic
growth, prolongs incubation, and reduces hatching success (Carey et al., 1982;
Altimiras and Phu, 2000). Hypoxia also alters the timing of the switch from
embryonic to adult hemoglobin (Baumann et. al., 1983). As a result, these alterations
lead to changes in concentration of red blood cell adenosine 5'-triphosphate (ATP), and
3

the hypoxic embryo acquires an increased oxygen affinity that partially compensates
for the effects of the reduced PO2 (Baumann et. al., 1983; Weber et al., 1993; Jessen et
al., 1991; Kavdia et al., 2002). Under normal incubation the switch from embryonic to
adult hemoglobin occurs during embryonic development. Baumann (1983) found no
significant changes on hemoglobin parameters except hemoglobin type, from blood
samples of chicken taken daily from day 4 though day 9. Therefore, it is apparent from
Baumann's (1983) blood sample results that hypoxic incubation altered only one aspect
of the pattern of erythropoiesis in chicken embryos, namely the type of hemoglobin,
but not hemoglobin concentration or hematocrit counts (Baumann, 1983; Jessen et al.,
1991; Weber et al., 1993; Kavida et al., 2002). These results were influenced by both
the time course of the transition from embryo to adult hemoglobin as well as the
oxygen transport properties of embryonic blood.
Given hypoxia reduces embryo growth retardation (Carey et al., 1982; Altimiras
and Phu, 2000), questions arise as to whether these changes are an adaptation to
hypoxia or a negative effect of retarded development. However, it is of importance to
note that Baumann (1983) reported no significant difference between normoxic and
hypoxic embryos in hematological parameters, suggesting that different values
obtained at the same age are only due to retarded growth rather that a specific effect of
hypoxia (Baumann, 1983).
Avian embryos developing in chronic hypoxic environments exhibit cardiac
decompensation, i.e. the heart has a minimal, limited ability to compensate for low
4

oxygen levels by pumping more blood. Bird embryos also show congestive failure,
dilation and hypertrophy of the heart. Hypertrophy of the heart, which involves all
chambers of the heart, is commonly characterized by a doubling of normal heart size
(Olander et al., 1967; Hernandez, 1987; Julian, 1993). Avian embryonic hearts that
exhibit hypertrophy at high altitudes have a repressed heart growth rate over the first
two weeks of incubation (Konarzewski et al., 2000). Surprisingly, embryonic body
growth rates are greater at high altitude in the third week, indicating the onset of
systemic response to hypoxia (Smith, 1969), as well as vascular growth, which is
stimulated by hypoxia (Hoper and Jahn, 1995; Yue and Tomanek, 1999, 2001). In
addition to these hypoxic responses, there are also morphological cardio pathologies,
such as pericardial edema (Olander et al., 1967; Hernandez, 1987; Witzel et al., 1990;
Julian, 1993; McGovern et al., 2001). During hypoxic incubation in some birds, the
lungs are over-distended and congested; while edematous in others (Burton et al.,
1969; Hernandez, 1987; Witzel et al., 1990).
Whether or not an animal's developmental trajectory is altered by environmental
perturbation depends on whether that perturbation occurs during a “critical
developmental window”. For major organ systems, a discrete period of susceptibility
to experiencing unalterable developmental changes occurs (Burggren, 1998). Finally,
whether the embryo has the ability to recover from hypoxic damage after the various
hypoxic treatments and throughout development depends on several factors which
include, but may not be limited to: the stage in development when the embryo is
5

exposed to hypoxia, duration of exposure to hypoxia, and the amount of time in which
the embryo has to recover and/ or repair damage.
The alternate hypotheses tested were:
�� Survival of the quail embryo is influenced by hypoxic exposure during
incubation.
�� Regardless of the timing and duration of hypoxic treatment, embryos will
recover/repair any hypoxic damage and will follow a normal (control) developmental
trajectory.
�� Organogenesis and hematopoesis will vary depending on the stage in which the
developing embryo was subjected to hypoxic exposure, and the length of that hypoxic
exposure.
�� Quail eggs will follow a similar developmental pattern to that found in previous
studies on chicken eggs.
�� Eggs exposed to continuous/chronic hypoxia will vary significantly
developmentally from control eggs, in overall body size/mass, organ mass, beak length
and toe length.
�� There will be a difference in hematocrit and hemoglobin of treatment groups
from control.
6

This study examines whether incubation in hypoxic conditions alters embryonic
anatomy (body and heart mass, toe and beak length, and hematological parameters)
throughout the development of quail embryos.
7

CHAPTER 2
MATERIAL AND METHODS
ANIMALS AND INCUBATION
Quail eggs (Coturnix coturnix) were obtained from Texas A&M University and
Bear Bayou Quail Farm, Gainesville, Texas, as available. Eggs were incubated in
compartments in 1.7-liter closed containers in Lyon incubators at 37°C and then
incubated. Containers containing the eggs were automatically rotated 90° every four
hours. Each container was ventilated with the appropriate gas mixture. O2 and N2
were mixed with a Cameron gas mixer (model GF-3) to produce a gas mixture of
either 151 mmHg (21% O2) or 110 mmHg (15% O2), and humidified between 75 and
95% relative humidity. The level of hypoxia and relative humidity was selected based
on previous protocols for hypoxic incubation of bird eggs (Baumann, 1983;
Ingermann, 1983; Altimiras and Phu, 2000; Dzialowski et al., 2002; Miller et al.,
2002). In this study, the control group provides data for normal development during
normoxic incubation. The various hypoxic treatments (acute and chronic) represent
the effects of hypoxic exposure on specific stages in development of the quail (Fig.1).
The target sample size was 20 eggs per group.
EXPERIMENTAL PROTOCOL
Eggs were divided into five different groups and exposed to normoxia or
different patterns of hypoxic exposure. The five groups were: control (PO2 of 151
mmHg throughout incubation), early hypoxia (PO2 of 110 mmHg from day 1 to 5 with
8

normoxia for the remainder of incubation), middle hypoxia (110 mmHg exposure from
day 5 to 10 with normoxia for the remainder of incubation), late hypoxia (110 mmHg
exposure from day 10 to 15 with normoxia for the remainder of incubation), and
continuous hypoxia (110 mmHg O2 throughout incubation).
Anatomical and hematological variables described below were measured at days 10,
15, and at hatch for control and individuals of all treatment groups. Sample groups
were defined as those taken from the initial population at days 10, 15, and hatch.
ANATOMICAL MEASUREMENTS
On days 10, 15, and at hatch, eggs were taken out of the control and each of the
experimental groups for evaluation. Day 10 and 15 embryos were removed from the
egg and freed of yolk and extraembryonic membranes. It should be noted that the use
of embryo mass as a measure of growth neglects the contribution of the
extraembryonic membranes to the total mass of the embryo. Growth and metabolic
rate of the membrane have been reported to be an important aspect of the total mass, in
early chicken incubation (Needham, 1932; Haas and Spratt, 1976). However, the
importance of extraembryonic membranes declines rapidly as embryo size increases
(Vleck and Hoyt, 1980). For the purpose of this study, extraembryonic membranes
were removed from all embryonic stages because there was no compelling argument
for including the membrane in wet body mass measurements, and which would be
negligible in dry mass.
9

Wet mass of day 10 and 15 embryos, and hatchlings were determined to the
nearest milligram with a top-pan balance Denver Instrument Company. The heart was
then removed from the embryo, blotted dry, and then weighed. After drying for
approximately 4 days at 60 ºC, dry masses of body and heart were also taken and water
content as a percentage of body or heart mass was calculated by the following formula:
[(Wet mass - dry mass)/wet mass] X 100.
Both wet mass and dry mass was measured to determine whether there was
significant edema. Toe and beak lengths are used as indices of development in the
chick embryo in late incubation (Hamburger and Hamilton, 1951; Stock et al., 1983)
and served as a comparative gauge throughout development, and for interpreting
results. Calipers were used to measure length (to the nearest millimeter) of beak, from
the tip to the anterior end of the left nostril, and the length of the third toe, from the
phalangeal-tarso-metatarsal joint to the tip of the claw. Further anatomical
observations made were: presence/absence of feathers, abnormal presence of
fluids/edema, toe and beak deformities, wing malformations and deformities, and any
gross developmental abnormalities.
HEMATOLOGICAL MEASUREMENTS
To sample blood at day 10 and 15 embryos, eggs from each group were opened
at the pointed end and approximately 1-2 milliliters of blood was drawn directly from
the omphalomesentric artery of each embryo into a heparinized syringe. To sample
blood from hatchlings, each animal was anesthetized by placing a cotton ball saturated
10

with halothane (Halocarbon Laboratories) into a sealed plastic container with the
hatchling. After anesthetization, blood from hatchlings was taken out by direct
cardiopuncture within 3-5 minutes of anesthetization. Blood was drawn by
intracardiac puncture; about 50-100 microliters of blood was needed for analysis in the
Radiometer OSM2 Hemoximeter to obtain hemoglobin (Hb) concentration.
Hematocrit values (Hct) were measured by centrifugation of blood in capillary tubes to
obtain packed red blood cell count. Two measurements were made for both
hemoglobin and hematocrit, and an average was taken for each, per embryo/hatchling.
STATISTICAL ANALYSIS
Data were assessed using SAS. Heart and body masses of quail, as well as
hemoglobin and hematocrit were described with appropriate descriptive statistics,
following assessment for normality of distributions (Shapiro-Wilk normality tests) and
equality of variances (Hartley’s F-max test). Within and between groups were tested
for statistical significance with an ANOVA and significance between groups was
determined with a Student-Newman-Keuls multiple range tests post-hoc. All
statistical decisions were made with a 0.05 level of significance, and all values are
presented as mean ± standard error.
11

CHAPTER 3
RESULTS
Despite some degree of popularity in developmental studies, there is a dearth of
morphological and hematological information available for quail embryos, making the
control (normoxic) population worthy of initial consideration in this study. In a
subsequent section I compare the hypoxic populations to controls. The four treatment
groups and the control (Fig.1) were compared at days 10, 15 and hatch. Samples sizes
for each group were different depending on group and day (days 10, 15, or hatch).
NORMAL DEVELOPMENT
SURVIVAL
Cumulative survivorship was calculated based on the total number of eggs
initially incubated for each treatment group, and was calculated by determining the
percentage survival in each group at the time of sampling from the initial sample of
incubating eggs. Survival of controls ranged from 75 to 82% (Fig. 2). At day 10, there
was a 75% survival rate among the control quail embryos. At day 15, survivorship was
82% of the initial sample of incubating eggs taken out, and remained at 82% by hatch
(Fig.2). Upon evaluation, feathers were not visually apparent until day 15 of embryo
development. Similarly, eyes were covered by eyelid membrane and were not visually
apparent until day 15.
12

BODY MASS
Growth as measured by increase in body mass (both wet and dry), heart mass
(both wet and dry), and toe and beak length is compared among treatment groups and
control at days 10, 15, and hatchling in figures 3, 4, 5, 6 and in tables 1, 2, 3, and 4.
At day 10, wet body mass of embryos averaged 2.0 ± 0.13 grams, and 0.2 ± 0.03 grams
for dry body mass (Table 1). At day 15, there was a significant increase in wet body
mass (F=25.59, p<0.0001), and a significant increase in dry body mass (F=86.85,
p<0.0001) (Fig.6). By hatch, there was a significant increase in wet body mass from day
10 (p<0.0001), and significant increase in dry body mass from day 10 (p<0.0001) (Table
1).
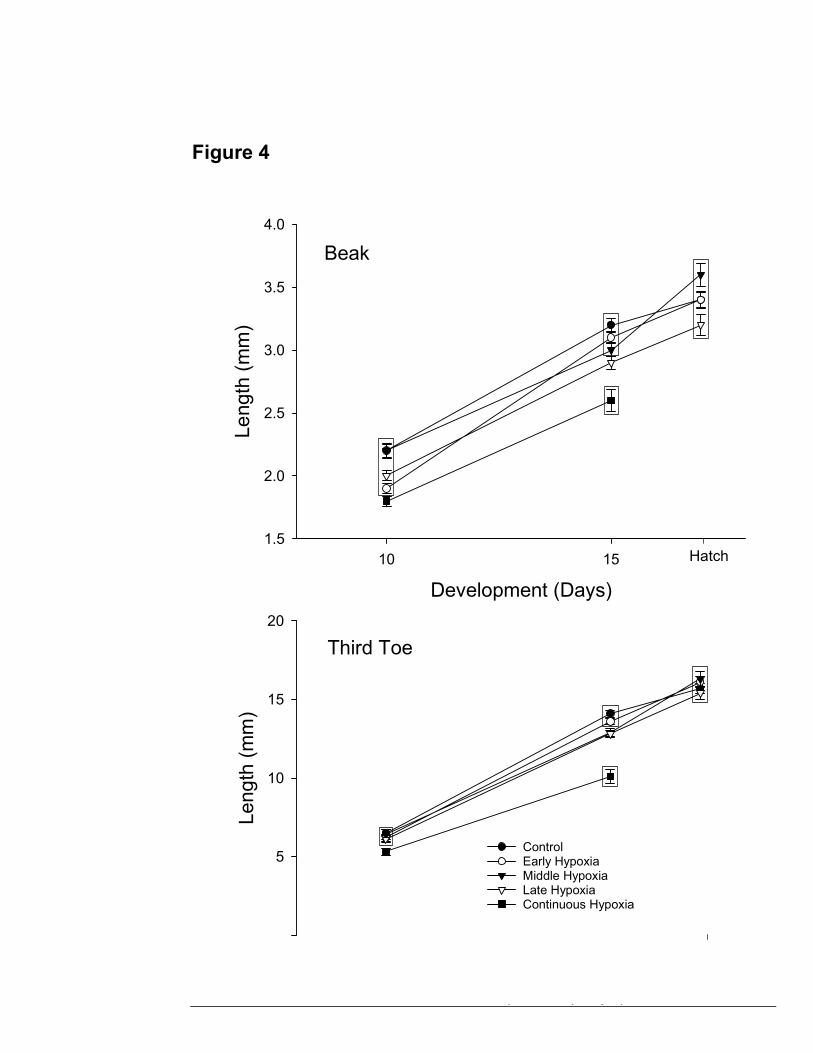
TOE AND BEAK LENGTH
At day 10, toe lengths averaged 6.5 ± 0.24 mm, and beak length averaged 2.2 ±
0.05 mm (Table 2). At day 15, toe length increased significantly to 14.1 mm (F=20.68,
p<0.0001), and beak increased to 3.2 mm (F=18.19, p<0.0001), (Fig.4). By hatch, toe
length increased significantly to 15.7 mm (p=0.0027). There was an insignificant
increase in beak length (to 3.4 mm) (p>0.61).
HEART MASS
At day 10, the average wet heart mass was 33 ± 5.4 mg, while dry heart mass was
3.6 ± 0.5 mg (Table 3). At day 15, wet heart mass dropped to 30 mg, while dry heart
mass increased to 5 mg (Fig.5). By hatch, there was an insignificant increase in wet heart
13

mass to 38 mg. Dry heart mass increased insignificantly from day 10 to day 15, and by
hatch dry heart mass had increased insignificantly from mass at day 10 (p=0.20).
HEART TO BODY MASS RATIO
Dry heart to body mass ratio dropped from 0.0147 at day 10 to 0.0055 at day 15,
and went up to 0.0063 at hatch (Fig.6).
HEMATOLOGY
Hematocrit ranged from 23.4% to 26% across all measured stages (Table 4).
Hemoglobin ranged from 6.6g% to 9.5g%. Similarly, hemoglobin showed no significant
change throughout development: 6.6g% (day 10), 9.3g% (day 15), 9.5g% (hatch) (Table
4).
EFFECTS OF HYPOXIC INCUBATION
Compared to the initial sample size of each group (day-0), survival at day 10 was
79% for early hypoxia, 61% for middle hypoxia, 74% for late hypoxia and 56% for
continuous hypoxia. At day 15, survival was 73% for early hypoxia, 57% for middle
hypoxia, 48% for late hypoxia and 13% for continuous hypoxia. By the time of hatching,
survival was 90% for early hypoxia, 33% for middle hypoxia and 86% for late hypoxia.
No embryos survived continuous hypoxia (Fig.2).
Surprisingly, hatchability appeared to be most successful at early hypoxia (Fig.2).
Cumulative hypoxic exposure appeared to play a critical role in survival and hatchability
14

of the embryos exposed to continuous hypoxia, because none of these embryos survived
past day 15 (Fig.2).
Developmental features of embryos in the early hypoxic treatment group
appeared normal. Similar to embryos in the control group, feathers were not visually
apparent until day 15 of embryo development and eyes were covered by eyelid
membrane and were not visually apparent until day 15.
Middle hypoxic embryos exhibited normal developmental features at days 10, 15,
and hatch. Feathers were visually apparent at day 15, and eyes appeared to be open at
day 15. However, albumin in the egg at day 15 was visually thicker in than albumin in
control, or early hypoxic eggs. Developmentally, late hypoxic embryos resembled those
of control, early hypoxic, and middle hypoxic treatment groups, both at day 10 and day
15. Feathers were visually apparent at day 15, and eyes appeared to be open at day 15 as
well.
The continuous hypoxic treatment group displayed many abnormal physiological
and anatomical characteristics of embryos throughout development. At both day 10 and
15, the overall appearance of the embryo was edematous, with noticeable yellow/red
fluids accompanying the clear fluid. In addition to the edematic embryos in this treatment
group, there was a prominent edema of the head. Evaluation of the egg upon removal of
the embryo from the yolk revealed water sacs surrounding the embryo, and trapped
beneath the skin of the embryos, a condition referred to as ascites; excess amounts of a
combination of lymph and blood plasma fluids leaking from the liver and accumulating
in the body cavity. In addition to the morphological differences mentioned, there were
15

also notable beak and eye deformations in the continuous hypoxic group. Deformities
included lack of lower or upper beak or eye, or incomplete formation of either or both.
Eyes appeared to be open by day 10 in some cases, but appeared closed at day 15 in other
cases. The full length of the wing was attached to the embryonic body in some embryos,
and there were no apparent feathers present upon evaluation until day 15. The third toe
was attached to other toes in some cases.
BODY MASS
Wet body mass of the early hypoxic embryo group ranged from 1.7 ± 0.14 up to
8.0 ± 0.2 grams over the measured period of development, while dry body mass ranged
from 0.15 ± 0.03 up to 1.4 ± 0.05 grams (Table 1). Wet body mass significantly increased
at day 15 (p<0.0001), and was significantly different from control (p=0.003) (Table 1 and
Fig.3). Similarly, dry body mass was significantly different than control at day 15
(p=0.002). At day 15, early hypoxic dry body mass was significantly different than that
of continuous hypoxia (p<0.0001). By hatch, dry body mass had significantly increased
to 8.0 grams (p<0.0001) from day 15. At hatch, dry body mass of the early hypoxic
treatment group was also significantly different than the middle hypoxic treatment group
(p<0.0001) (Table 1 and Fig.3). Wet body mass at day 10 for middle hypoxic embryos
was 1.9 ± 0.2 grams, increasing significantly to 5.5 ± 0.15 grams by day 15 (p<0.0001),
and further increasing significantly to 8.1 ± 0.48 grams by hatch (p=0.006) (Table 1).
Wet body mass was significantly lower than control values at day 15 (p=0.0003). Dry
body mass increased significantly, from 0.2 ± 0.04 grams (day 10), to 0.9 ± 0.03 grams
16

(day 15) (p<0.0001), and also increased significantly from day 15 to hatch (1.93 ±
0.31grams) (p=0.006). Similarly, at day 15 dry body mass was significantly lower than
the control value (p<0.0001), and wet body mass was significantly different from control
(p=0.0003). Dry body mass at hatch was also significantly lower from control (p<0.0001)
(Table 1).
Late hypoxic wet body mass increased significantly from 1.6 ± 0.14 grams (day
10), to 5.4 ± 0.14 grams (day 15) (p<0.0001), to 8.7 ± 0.4 grams by hatching (p<0.0001).
Dry body mass also increased significantly from 0.15 ± 0.03 grams (day 10), to 0.9 ±
0.03 grams (day 15) (p<0.0001), to 1.6 ± 0.05 grams by hatch (p<0.0001) (Table 1 and
Fig.3). However, at day 15, both wet and dry body masses were significantly lower from
control values (p<0.0001) (Fig.3).
Continuous hypoxic wet body mass increased significantly from 1.5 ± 0.13 grams
(day 10) to 3.4 ± 0.27 grams (day 15) (p<0.0001), while dry body mass also increased
significantly from 0.13 ± 0.03 grams (day 10) up to 0.60 ± 0.06 grams (day 15)
(p<0.0001). Both wet and dry body masses were significantly lower from control values
at day 15 (p<0.0001) (Table 1). There were no values for hatchlings since survival rate
was 0%.
TOE AND BEAK LENGTH
Early hypoxic toe length increased significantly from 6.2 ± 0.21mm (day10) to
16.1 ± 0.34 mm (hatch) in length (p<0.0001), while beak length increased from 1.9 ±
0.04 mm (day 10) to 3.4 ± 0.07 mm (hatch) (p<0.0001) (Table 2). Toe length did not
17

differ significantly from control at any stage in development. Similarly, beak length in
the early hypoxic group did not differ significantly from control at any stage in
development (Fig.4).
Middle hypoxic toe length increased significantly from 6.4 ± 0.31mm (day 10) up
to 16.3 ± 0.5 mm (hatch) (p<0.0001) (Table 2). Toe length also increased significantly
from day 15 to hatch (p<0.0001). Beak length increased significantly from 2.2 ± 0.06 mm
(day 10) up to 3.0 ± 0.05 mm (day 15) (p<0.0001), and also increased significantly from
day 15 to 3.6 ± 0.09 mm at hatch (p<0.0001).
Late hypoxic toe length increased significantly from 6.1 ± 0.22 mm (day 10) to
12.9 ± 0.22mm (day 15) (p<0.0001), and increased significantly from day 15 to 15.4 ±
0.4 mm by hatch (p<0.0001). Beak length also increased from 2.0 ± 0.04 mm (day 10) to
2.9 ± 0.05 mm (day 15) (p<0.0001), but increased insignificantly from day 15 to 3.2 ±
0.08 mm by hatch (Table 2). Both toe length (p=0.031) and beak length (p=0.032)
differed significantly at day 15 from control values (Fig.4).
Toe length in embryos exposed to continuous hypoxia increased significantly
from 5.3 ± 0.2 mm at day 10 to 10.1 ± 0.42 mm at day 15 (p<0.0001) (Table 2). Toe
length was significantly lower from control values at day 10 (p=0.0097), and day 15
(p<0.0001) (Fig.4). Beak length increased from 1.8 ± 0.04 mm at day 10 to 2.6 ± 0.09
mm at day 15 (p<0.0001). Beak length was also significantly lower from control values at
day 10 (p<0.0001), and day 15 (p<0.0001) (Fig.4). Thus, the continuous hypoxia
treatment group was directly affected by hypoxic incubation throughout development.
18

HEART MASS
Wet heart mass in early hypoxia ranged from 31 ± 6 mg (day 10) to 50 ± 11 mg at
hatch (Table 3 and Fig.5). There was no significant increase from day 10 to day 15, or
from day 15 to hatch. There were no significant differences in wet or dry heart mass
from control values (p>0.05).
Middle hypoxic wet heart mass increased insignificantly from 28 ± 7.3 mg, at day
10 to 33 ± 5.7 mg, at day 15, and increased significantly from day 15 to 60 ± 17 mg, at
hatch (p<0.0001) (Table 3 and Fig.5). Dry heart mass increased insignificantly from 3.6
± 0.7 mg at day 10 to 5.3 ± 0.5 mg day 15, and increased significantly from day 15 to
11.4 ± 0.4mg at hatch (p<0.0001) (Table 3).
Late hypoxic wet heart mass increased insignificantly from 36.7 ± 6 mg (day 10),
to 32 ± 5 mg (day 15), and also increased insignificantly from day 15 to 69 ± 15mg by
hatch (Table 3). Dry heart mass increased insignificantly from 3.4 ± 0.6 mg (day 10), to
5.2 ± 0.5 mg (day 15), and increased significantly from day 15 to 10.3 ± 1mg by hatch
(p=0.0002). Neither wet nor dry heart masses differed significantly from control values at
day 10 or day 15(Fig.5).
Continuous hypoxic wet heart mass increased insignificantly from 26.4 ± 6.2 mg
at day 10 to 42 ± 8.7 mg at day 15. Dry heart mass increased insignificantly from 3.2 ±
0.6 mg at day 10 to 4.9 ± 0.8 mg at day 15. There were no significantly different values
from control at day 10 and 15 for the wet heart masses, or the dry heart masses at day 10
and 15 (Table 3 and Fig.5).
19

HEART TO BODY MASS RATIO
At day 10, wet heart to body mass ratio of the early hypoxic treatment group was
significantly different from control (p=0.0008), wet heart to body mass ratio of the late
hypoxic group was significantly different from control (p<0.0001), and the wet heart to
body mass ratio of the continuous hypoxic group was significantly different from control
(p=0.035), while wet heart to body mass ratio of the middle hypoxic treatment group was
not significantly different from control. Dry heart to body mass ratio of the early hypoxic
group (p=0.499), and the late hypoxic group (p=0.743), did not differ significantly from
control, while that of the middle hypoxic group, and the continuous hypoxic group
(p=0.003) were significantly smaller than that of control.
At day 15, wet heart to body mass ratio of the early hypoxic treatment group
(p<0.0001), and that of the continuous hypoxic group (p<0.0001) were significantly
larger that of control. Dry heart to body mass ratio of the early hypoxic group
(p=0.0001), and the continuous hypoxic group (p=0.026) were significantly larger than
that of the control.
At hatch, none of the wet heart to body mass ratios of any of the treatment groups
was significantly different than that of the control. However, the dry heart to body mass
ratio of the late hypoxic group was significantly different from that of the control
(p=0.002).
20

HEMATOLOGY
Hematocrit in early hypoxic embryos ranged from 21.4% to 27.8%, while
hemoglobin ranged from 6.7g% to 8.8g% (Table 4). However, there were no significant
differences in hematocrit and hemoglobin values from control values at any point in
development (p>0.05). Middle hypoxic hematocrit ranged from 21.4% to 26.6% over
development (Table 4). Hemoglobin ranged from 6.6g% to 9.1g%. There were no
significant differences from control values at any point in development (p>0.05).
Hematocrit in late hypoxic embryos ranged from 22.2% at day 10, to 29.9% at hatch
(Table 4). Hemoglobin ranged from 6.5g% at day 10, to 8.1g% at day 15, and to 9.1g%
by hatch. Neither hematocrit nor hemoglobin differed significantly from control values at
any point in development (p>0.05) (Table 4). Hematocrit in embryos exposed to
continuous hypoxia ranged from 22.2% at day 10 to 26.5% at day 15. Hemoglobin
ranged from 6.6g% at day 10 to 7.4g% at day 15. There were no significant values in
either measurement at both days (p>0.05) (Table 4).
21

CHAPTER 4
DISCUSSION
Birds are of particular interest in studies on the pathophysiological responses to
hypoxia due to their sensitivity to hypoxia and high metabolic rate. Interestingly, there is
great contrast between wild birds and the domestic chicken in the reduction of
metabolism, hatchability, growth rate, and hatching mass upon exposure to moderate
hypoxia (Carey et al., 1982). Consequently, the data derived from this study are not
representative of all birds, especially wild ones.
During development the avian embryo goes through rapid growth rates supported
by high basal metabolic rates (Vleck, 1980; Metcalfe et al., 1981; Hoyt, 1987; Nakane
and Tsudzuki, 1999). This increased oxygen demand requires progressive increase in
cardiac output, affected by an increased heart rate and stroke volume (Peacock, et al.,
1989). When exposed to hypoxia, avian embryos develop an increase in pulmonary
arterial pressure, then cardiac hypertrophy and finally liver congestion, edema and
ultimately ascites.
HYPOXIC INCUBATION AND SURVIVAL, HATCHABILITY AND MORTALITY
The patterns of mortality in both normoxic and hypoxic incubation in chicken
embryos appear to be reflected in this study on quail embryos, especially for the
continuous hypoxic treatment group. Not only did the continuous hypoxic treatment
group exhibit the highest mortality, but this group also exhibited further harmful hypoxic
effects throughout development including: retardation of embryonic growth, edema, and
22

deformities in beak and eye formation. These the harmful hypoxic effects culminated in
no success in hatchability and survival. It is important to note that high altitudes and
hypoxic environments are major factors in hatchability, and decreased hatchability has
been recognized in chicken and turkey eggs at elevations above 1200 meters since 1895
(Smith, 1969, Christensen and Bagley, 1984, and Visschedijk, 1985).
Although the dramatic decrease in survival of the continuous hypoxic group was
expected, hypoxic incubation appeared exposure-dependent, because the survivorship of
the other hypoxic treatment groups lay between the control and the continuous hypoxic
group. The differences in survival between early, middle, and late hypoxia could be
indicative of critical windows of development in quail embryos. Successful hatchability
of each treatment group, except for the continuous hypoxic group is indicative of the
quail embryo’s capacity to overcome limited oxygen availability due to hypoxic
incubation. So, although quail embryos were exposed to hypoxia for approximately 5
days at various stages in development their ability to recover/repair suggests that embryos
may take different developmental trajectories, leading to different embryo phenotypes,
but by hatch they have the same hatchling phenotype.
EMBRYONIC GROWTH AND DEVELOPMENT
Metabolic studies of quail hatchlings show that oxygen consumption is
allometrically related to total body mass (Lilja, 1997; Bishop, 1999). It can be inferred
from this that the oxygen consumption was directly proportional to the combined masses
23

of the organs, i.e. to their growth pattern (Lilja, 1997). In chickens and turkeys, growth is
divided into three phases: “early”, up to 1-2 grams; “intermediate”, 2-10 grams; “late”,
greater than 10 grams (Smith et al., 1969 and Hurwitz et al., 1991). Not only is there
variation in embryo growth during development at particular growth phases in normoxic
incubation (Altimiras and Phu, 2000), but variation in embryo growth also exists on a
greater scale at different elevations (sea level 3100 and 3800 m) (Smith et al., 1969;
Beattie and Smith, 1975; Altimiras and Phu, 2000). Although no significant differences
exist in body mass or heart mass between the treatment groups and the control at day 10,
or at day 15 in heart mass, these reported findings may provide additional information to
assist in understanding the variation/and or significance in embryo body mass at day 15,
and beak and toe lengths at days 10 and 15.
Smith (1969) reported that the repression by hypoxia of embryonic growth in
quail is pronounced only earlier than 10 days and later than 17 days of incubation.
Embryonic growth at the intermediate growth phase, in which the embryo increases in
size from 2-10 grams, is essentially unaffected. This could account for the significant
differences in beak and toe length in the continuous hypoxic treatment group at day 10.
The significance of the toe and beak lengths, as mentioned previously, are not only used
as indices of development in embryo in late incubation (Hamburger and Hamilton, 1951
and Stock et al., 1983) but serve as a comparative gauge throughout development, and for
interpreting results. This would indicate that the continuous hypoxic treatment group was
developmentally repressed due to hypoxic exposure from day 0- day 10.
24

However, the intermediate growth phase (which corresponds to the mid-
incubation period) is characterized by an unusually high mortality at high altitudes (or
low oxygen partial pressure) (Smith, 1969; Bjonnes et al., 1987; Richards et al., 1991-92;
Altimiras and Phu, 2000; Mulder et al., 2000; Miller et al., 2002). In this study, high
mortality at mid-incubation is shown at day 10 for the continuous hypoxic treatment
group as well as the middle hypoxic treatment group (Fig.2). From this study it is unclear
whether the mortality of the middle hypoxic treatment group was high due to hypoxic
exposure earlier than day 10, or due to normal causes associated with the mid-incubation
developmental phase. Nonetheless, the factors leading to this mortality did not appear to
affect the hatchling phenotype for the middle hypoxic treatment group. In addition, the
middle hypoxic treatment group did not exhibit any significant differences from the
control in body mass, heart mass, or beak and toe length at day 10.
Although growth and differentiation, both of which are independent variables, are
recognizable indicators of embryonic development, differentiation is not always
estimated by embryonic mass criteria. After day 10 of incubation, the lengths of beak
and third toe are the most consistent indicators of developmental stage (Smith et al.,
1969). Although this (Smith et al., 1969) differs from what was reported by Stock et al.
(1983), both reports were taken into consideration for the purpose of this study. In
agreement with Smith et al., beak and toe lengths served as indicators of developmental
delay, as shown in continuous hypoxic and late hypoxic treatment groups at day 15
(Fig.4). It appears that differentiation is repressed more than growth during development.
Findings from this study are consistent with Smith et al. (1969).
25

Quail embryo growth follows similar patterns to that of chicken embryos during
normoxic and hypoxic incubation. At day 15, both wet and dry body mass for all the
treatment groups were significantly different than wet and dry body mass of control.
These results are consistent with the findings of Stock and Metcalfe (1984 and 1987), in
which growth was reported not only to be limited by the availability of oxygen during
hypoxic incubation, but also during normal incubation in air. Since normoxic and
hypoxic incubation were interchanged depending on treatment group, it cannot be
inferred that growth was limited solely due to hypoxic incubation.
RESPONSES TO HYPOXIA
When confronted with hypoxia, the embryo has two alternatives for conserving
oxygen that is not available to the adult chicken: it can temporarily stop growing
(Metcalfe et al., 1981), or it can channel energy away from growth and into mere
maintenance to cope with the stress of hypoxia (Barnas and Rautenberg, 1990). The first
would imply a critical window, in which the embryo is developmentally hindered, by
targeting an essential phase in development that cannot overcome the paucity of oxygen
crucial for embryogenesis and organogenesis. This appears to be the detrimental
developmental trajectory taken by the embryos of the continuous hypoxic treatment,
which is exhibited in the high mortality level of this group.
Channeling energy away from growth implies that the embryo overcomes hypoxic
incubation, and follows a normal developmental trajectory once normoxic incubation is
26

resumed. Although no data was collected on ATP levels in this study, it is possible that
quail embryos that follow an abnormal developmental trajectory succumb to the
reduction of ATP, ultimately leading to physiological retardation of growth. This
reduction may lead to less energy that is apportioned for development, and the embryo
tries to survive by acclimating to hypoxia.
Since this alternate pathway is the only means (besides stopping growth
altogether) in the face of limited availability of oxygen, quail embryos could possibly be
acclimating metabolically to their hypoxic environment, by responding at the cellular
level to hypoxia. Therefore, low oxygen levels, which have replaced plentiful oxygen
supplies present during normal incubation, lead to the sparing usage of the limited
oxygen available for the developing embryo. The developing embryo has less ATP to
expend on development, and possibly saves energy for the energetically costly stage of
pipping (Wieser, 2002). However, since no data were collected from this study to
support this, it is unknown whether this pathway occurs in quail embryo or not.
It is also possible that the earlier in development that embryos are exposed to
hypoxic incubation, the longer time they have to repair any damage that may have been
caused by hypoxia, which would be consistent with what was reported by Miller et al.
(2002). At later developmental stages, exposure to hypoxia may not have too much of an
effect because the embryo has already gone through its vital developmental process, and
it is able to fend off the detrimental effects of hypoxia - i.e. the embryo is past its major
critical windows. Embryos possibly consume such minimal amounts of energy in these
27

early stages that they could survive hypoxia. By acclimating to hypoxic incubation, less
energy is expended in these oxygen and energy costly stages, and embryos may exhibit
smaller body masses and shorter beak and third toe lengths as a result.
In conclusion, despite following different developmental trajectories during
incubation, which lead to different embryological phenotypes, by hatch embryos of the
different hypoxic treatment groups have hatchling phenotypes.
HYPOXIC INCUBATION AND HEMATOLOGY
Despite a protocol that included intervals of hypoxic incubation (approximately 5
days in length) and continuous hypoxic incubation, I was surprised to find no significant
changes in hematology induced in quail embryos. Hypoxic exposure is known to lead to
erythrocytic polycythemia in vertebrates, which is thought to be an adaptation to hypoxia
(Burton et al., 1969). However, the lack of significance in hematological measurements
in my study could be offset by production of hemoglobin with a greater affinity for
oxygen, consistent with Hall (1934) and Velarde et al. (1991). There are at least two
distinct forms of hemoglobin in the blood of the chick embryos around day 6 (Baumann,
1983). It is likely that hemoglobin having the greater affinity for oxygen is produced
earlier in development and is replaced gradually by hemoglobin having lesser affinity
(Baumann, 1983; 1984; Kavdia et al., 2002), however from my study it cannot be
inferred because elaborate hematological studies were not conducted. Additionally, it is
possible that hypoxic incubation in this study did not occur during a critical window
28

lethal for hematopoeisis, or exposure was not long enough and/ or oxygen levels were not
low enough to cause permanent changes in hematology.
The failure to increase the red cell count during hypoxia could indicate that red
cell production is at a maximum rate under normal incubation conditions, as has been
suggested for chicken embryos (Baumann, 1984; Kavida et al., 2002). If this is the case,
then properties of each type of hemoglobin is suited to the specific oxygen needs of the
embryo at the time of its production and depending on the hypoxic exposure and duration
of exposure. Again, from this study it cannot be inferred that this occurs in developing
quail embryos.
Although most of the findings in this study deal with the physical retardation in
growth (body mass, heart mass, third toe length, and beak length), the lack of distinct
change in Hb concentration and Hct could be indicative of the general retardation of the
hypoxic embryo. During early development the chick embryo is unable to counter
hypoxia by an increased production of red blood cells and or the expansion of total
blood volume (Baumann and Meuer, 1992), indicating that the expansion of blood
volume and changes in hemoglobin (embryonic to adult) occurs at maximum speed
during normal development. This could be occurring in the quail embryos as well,
however, it is unknown. The adaptation to hypoxia by display of increased
erythropoetic polycythemic concentration is thought to increase the blood viscosity,
which would thus increase blood flow resistance (Burton, 1969; Shams and Scheid,
1989; Hoper and Jahn, 1995). These adaptations would surely force additional work
29

requirements on the heart of the hypoxic animal, and could possibly lead to a
pathological increase in cardiac output and stroke volume.
The sigmoid growth curve of the embryo is paralleled by both total oxygen
consumption (Vleck et al., 1980 and Hopkins and Powell, 2001) and eggshell gas
diffusing capacity (Temple and Metcalfe, 1970 and Tazawa et al., 1988). All three
curves flatten perceptibly at the time when the oxygen content of the allantoic venous
blood is declining (Metcalfe et al., 1981). The mechanisms by which variations in blood
oxygen partial pressure influence embryonic growth are entirely speculative. However, it
is believed that embryonic growth in the chick is regulated by the oxygen partial pressure
in embryonic blood (Metcalfe et al., 1981, and Kavida et al., 2002). In this study there
were no significant differences in hemoglobin and hematocrit between the treatment
groups and the control, at days 10, 15, or hatch, but that is not to say that there is not an
underlying mechanism by which there are variations in blood content. In hypoxic studies
by Bjonnes et al. (1987) blood lactate measurements taken from chickens indicate
significant changes. Although I did not find hypoxic stimulation of red blood cell
production, this may have occurred with lower hypoxic incubation or longer hypoxic
incubation treatments.
In summary, significant differences occurred in the anatomical measurements of
quail exposed to hypoxia at different times during incubation as well as non-measurable
differences in the embryos. These differences occurred depending on the stage in which
they were exposed to hypoxia during embryological development in each of the treatment
30

groups. However, hatchlings appeared phenotypically similar by hatch, thus following
developmental trajectories leading to a common phenotype. The debilitating effect
hypoxic exposure has on quail embryo was examined anatomically. In this study the
critical window was the point in development in which hypoxic exposure to the
developing quail embryo was the main contributor to the “developmental change”, or
where significant differences in physiological/hematological parameters existed after
acute hypoxic incubation. Regardless of the experimental/hypoxic treatment and the stage
in development when the embryo was exposed to hypoxia, all hypoxic treatment groups,
except the continuous hypoxic group ended up phenotypically the same.
31

CHAPTER 5
FUTURE EXPERIMENTS
Although hemoglobin and hematocrit were measured at the same stages in which
embryos were weighed and measured, a more extensive and detailed hematological study
with daily measurements would be more reflective of the effects of hypoxia on blood.
Further future experiments include metabolic studies particularly lactate levels that would
be indicative of whether or not anaerobic metabolism replaces aerobic metabolism when
oxygen levels decrease.
A more detailed analysis of organs within the embryo body could explain whether
hypoxia causes any cellular and or molecular damage (apoptosis). The traditional view
of cell level responses to oxygen limitation is encompassed in the concept of the Pasteur
Effect (Hochachka, 1997; Wieser, 2002). This hypoxic cell level response could be
studied further in quail to determine whether or not hypoxia ultimately has a cellular and
molecular effect.
Quail growth rates would be interesting to study because what determines the
overall growth rate of the chicken embryo is based on the long-established concept of the
limiting factor to growth i.e. the speed of the complex process of growth is determined by
the speed of its slowest component (Robertson, 1923; Byerly, 1932). Furthermore,
changes in oxygen availability influence embryo growth, and normally limits the speed of
the slowest component and thereby the chicken embryo's growth (Byerly, 1932). Quail
growth rate studies could determine whether the concept of limiting factor to growth
32

follows the same pattern as that for chickens. Additionally, supportive evidence for the
hypothesis that oxygen availability limits the growth rate can be drawn from the growth
curve of the chicken embryo, which further supports that early growth restriction induced
by hypoxia is reversed by the restoration of normoxia in incubation (Metcalfe et al., 1981
and Miller et al., 2002). So, similarly, quail growth rates would be beneficial to
determine growth restriction induced by hypoxia. Organ growth rates would also provide
further insight on growth restriction induced by hypoxia.
The use of the following equation for the calculation of growth rates, and further
analysis may be the basis for the aforementioned future direction in quail
experimentation. Embryo growth is typically exponential, fitting the equation: W=aekt,
where (W) is embryo weight in grams, at time (t), days of incubation, (a) is the
integration constant, and (k) is the growth rate constant (Smith et al., 1969 and Hurwitz et
al., 1991).
Sustaining high metabolic rates requires oxygen, particularly during development.
Bird embryos have a genetic potential for growth than potential to provide oxygen to
sustain that growth (Witzel et al., 1990). The demand for oxygen may exceed
cardiopulmonary capacity to supply sufficient oxygen, which ultimately leads to an
oxygen deficit. Thus the heart responds by increasing its output of blood for oxygenation.
Prolonged exposure to hypoxia causes the blood vascular system to adapt its structure to
allow greater amounts of blood to flow to the tissues at any given pressure gradient, thus
yielding embryos with red colored skin at any given time in development. Due to these
33

physiological characteristics of birds, it would be worthwhile to study the cardiovascular
system as well as the vasculature of embryos in each of the hypoxic treatment groups.
Furthermore, analyzing the possible increase in the rate of growth of blood vessels in the
chorioallantoic membrane of the embryo could further help explain the developmental
aspects of the vascular system. This increase in growth of exchange vessels would help
increase oxygen delivery to the tissue cells by 1) increasing capillary surface area and 2)
decreasing diffusion distance (Adair, 1987, Hoper and Jahn, 1995, and Mulder et al.,
2000). This could be compensation for life in a hypoxic environment.
Prolonged exposure to high altitudes or hypoxia increases capillary density in
skeletal muscle, but decreases the rate of growth of individual muscle fibers (Adair,
1987). However, studies done by Ingermann (1983) suggest that late in development,
erythrocytes of control chicken embryos respond to oxygen limitation “in a manner that
facilitates” chorioallantoic oxygen uptake. Examining muscle from hypoxic incubated
embryos by basic histochemical staining as well as molecular studies could reveal at what
level muscle is responding to hypoxic exposure if at all and how hypoxia is responded to
at the cellular level. Not only are there many essential questions that still remain
unanswered, but there is also a multitude of experiments that can be performed to
facilitate answering them. In addition, there is a hypoxic exposure effect that must be
taken into consideration. So, not only can further experiments be carried out on the same
hypoxic levels, but on different hypoxic levels, as well as for longer treatment periods.
34

REFERENCE LIST
Adair, T.H., Guyton, A.C., Montani, J.P., Lindsay, H. L., Stanek, K.A. (1987). Whole
body structural vascular adaptation to prolonged hypoxia in chick embryos.
American Physiological Society. H1228-H1234.
Altimiras, J., and Phu, L. (2000). Lack of physiological plasticity in the early chicken
embryo exposed to acute hypoxia. Journal of Experimental Zoology. 286: 450-6.
Barnas, GM., and Rautenberg, W. (1990). Shivering and cardiorespiratory
responses during normocapnic hypoxia in the pigeon. Journal of Applied
Physiology. 68: 84-7.
Barott, H.G. (1937). Effect of temperature, humidity and other factors on hatch of hen's
eggs and on energy metabolism of chick embryos. Technical Bulletin of the
United States Department of Agriculture. 553: 1-45.
Bartels, H., Gourlet, V., Perramon, A, Pierre, M., Stupfel, M. (1985) Biological
parameters in Japanese quail genetically selected for resistance or sensitivity to an
acute hypoxic survival. Aviation Space and Environmental Medicine. 56: 976-84.
Baumann, F.H. and R.Baumann. (1977). A comparative Study of the Respiratory Properties of
Bird Blood. Respiration Physiology. 31:333-343.
Baumann, R and H.Meuer. (1992). Blood Oxygen Transport in the Early Avian Embryo.
35

Physiological reviews. 72: 941-965.
Baumann, R. (1984). Regulation of oxygen affinity of embryonic blood during hypoxic
incubation. Respiration and metabolism of embryonic vertebrates (ed.).
Baumann, R., Padeken, S., Haller, E.A. and Brilmayer, T.H. (1983). Effects of hypoxia on
oxygen affinity, hemoglobin pattern, and blood volume of early chicken embryos.
American Journal of Physiology. 244:R733-R741.
Beattie, J. and A.Smith. (1975). Metabolic adaptation of the chick embryo to chronic hypoxia.
American Journal of Physiology. 288: 1346-1350.
Bishop, C.M. (1999). The maximum oxygen consumption and aerobic scope of birds and
mammals: getting to the heart of the matter. Proceedings of the Royal Society of London
for Biological Sciences. 266: 2275-81.
Bjφnnes, P.O., Aulie, A., H*iby, M. (1987). Effects of Hypoxia on the Metabolism of Embryos
and Chicks of Domestic Fowl. The Journal of Experimental Zoology Supplement. 1:209-
212.
Burggren, Warren. Studying Physiological Development: Past, Present, and Future. (1998).
Biology Bulletin. 33: 71-84.
Burton, R.R., Smith, A.H., Carlisle, J.C., Sluka, S.J. (1969). Role of Hematocrit, heart mass, and
high altitude exposure in acute hypoxia tolerance. Journal of Applied Physiology. 27: 49-
52.
36

Byerly, T.C. Growth of the chick embryo in relation to its food supply. (1932). Journal of
Experimental Biology. 9:15-44.
Carey, C., Thompson, E.L., Vleck, C.M., James, F.C. (1982). Avian Reproduction Over an
Altitudinal Gradient: Incubation Period, Hatchling Mass, and Embryonic Oxygen
Consumption. The AUK. 99: 710-718.
Christensen, V.L., and Bagley, R.A. (1984). Vital gas exchange and hatchability of turkey eggs
at high altitude. Poultry Science. 63: 1350-6.
Dragon, S., Carey, C., Martin, K., Baumann, R. (1999). Effect of high altitude and in vivo
adenosine/�-adrenergic receptor blockade on ATP and 2,3BPG concentrations in red
blood cells of avian embryos. The Journal of Experimental Biology. 202: 2787-
2795.
Dieterlen-Lievre, F. (1997). Avian Models in Developmental Biology. Poultry Science. 76: 78-
82.
Dzialowski, E., von Plettenberg, D., Elmonoufy, N.A., Burggren, W. (2002). Chronic hypoxia
alters the physiological and morphological trajectories of developing chicken embryos.
Comparative Biochemistry and Physiology-Part A: Molecular & Integrative Physiology.
131: 713-724.
Erman. (1818). (Letter to Oken). Isis order Encyclopädische Zeitung von Oken. 1:122-124.
37

Foresti, R., Goatly. H, Green, CJ., Motterlini, R. (2001). Role of heme Oxygenase-1 in hypoxia-
reoxygenation: requirement of substrate heme to promote cardioprotection. American
Journal of Physiology and Heart Circulation Physiology. 281:H1976-84.
Hall, F.G. (1934). Hemoglobin Function in the Developing Chick.
Hamburger, V., and H.L.Hamilton. (1951). A series of normal stages in development of the
chick embryo. Journal of Morphology. 88: 49-92.
Haas, H.J., and Spratt, N.T., Jr. (1976). Contributions to an analysis of the avian vitelline
membrane's potential to promote outgrowth of the yolk sac-serosal membrane. Anatomy
Records. 184: 227-31
Hernandez, A. (1987). Hypoxic ascites in broilers: A Review of several studies done in
Columbia. Avian Diseases. 31:658-661.
Hochachka, P.W. (1997). Oxygen- A Key Regulatory Metabolite in Metabolic Defense Against
Hypoxia. American Zoology. 37:595-603.
Hochachka, P.W., Buck, L.T., Doll, C.J., Land, S.C. (1996). Unifying theory of hypoxia
tolerance: Molecular/Metabolic defense and rescue mechanisms for surviving oxygen
lack. Proceedings of the National Academy of Science. 93: 9493-9498.
Hochachka, P.W., Gunga, H.C., Kirsch, K. (1998). Our ancestral physiological phenotype: An
adaptation for hypoxia tolerance and for endurance performance? Proceedings of the
National Academy of Science. 95: 1915-1920.
38

Hochachka, P.W., Land, S.C., Buck, and L.T. (1997b). Oxygen sensing and Signal Transduction
in Metabolic defense Against Hypoxia: Lessons from Vertebrate facultative Anaerobes.
Comparative Biochemistry and Physiology. 118A: 23-29.
Hoffmann, E. 1988. Coturnix Quail. Yi Hisien Publishing Co., Taipei.
Hoper, J., and Jahn, H. (1995). Influence of environmental oxygen concentration on growth and
vascular density of the area vasculosa in chick embryos. International Journal of
Microcirculatory Clinical Experiments. 15: 186-92.
Hopkins, S.R., and Powell, F.L. (2001). Common themes of adaptation to hypoxia. Insights from
comparative physiology. Advanced Experimental Medical Biology. 502:153-67.
Hoyt, D.F. (1987). A new model of avian embryonic metabolism. Journal of Experimental
Zoology Supplement. 1:127-38.
Hurwitz, S., Talpaz, H., Bartov, I., Plavnik, I. (1991). Characterization of growth and
development of male British United Turkeys. Poultry Science. 70: 2419-24.
Ingermann, R.L., Stock, M.K., Metcalfe, J., and Shih, T. (1983). Effect of ambient oxygen on
organic phosphate concentrations in erythrocytes of the chick embryo. Respiration
Physiology. 51: 141-152.
Jessen, T.H., Weber, R.E., Fermi, G., Tame, J., Braunitzer, G. (1991). Adaptation of bird
hemoglobins to high altitudes: Demonstration of molecular mechanism by protein
engineering. Proceedings of the National Academy of Science. 88: 6519-22.
39

Johnsgard, P.A. 1988. The Quails, Partridges, and Francolins of the World. Oxford University
Press, Oxford.
Julian, R.I. (1993). Ascites in Poultry. Avian Pathology. 22:419-454.
Jurgens, K.D., and Gros, G. (2002). [Phylogeny of gas exchange systems]. Anasthesiologie
Intensivmed Notfallmed Schmerzther. 37: 185-98.
Kavdia, M., Pittman, R.N., and Popel, A.S. (2002). Theoretical analysis of effects of blood
substitute affinity and cooperativity on organ transport. Journal of Applied Physiology.
93: 2122-8.
Klika, E., Scheuermann, D.W., Groodt-Lasseel, M.H., Bazantova, I., and Switka, A. (1997).
Lymphatics in the lung of a precocial bird before and after hatching. Lymphology. 30:
173-85.
Konarzewski, M, Gavin, A, McDevitt, R., Wallis, I.R. (2000). Metabolic and organ mass
responses to selection for high growth rates in the domestic chicken (Gallus domesticus).
Physiological Biochemistry and Zoology. 73: 237-48.
Lilja, C. (1997). Oxygen consumption and vital organ masses in young growing quail (Coturnix
coturnix japonica). Acta Physiology of Scandinavia. 160: 113-114.
Lundy, H. (1969). A Review of the effects of temperature, humidity, turning and gaseous
40

environment in the incubation on the hatchability of the hen's eggs. In F.C.Carter and B.M.
Freeman (eds.). The Fertility and the Hatchability of the hen's egg. Pp.143-176. Oliver
and Boyd, Edinburgh.
Maines, M.D. (1997). The heme oxygenase system: a regulator of second messenger gases.
Annual Review of Pharmacology and Toxicology. 137: 517-554.
Maina, J.N. (2002). Fundamental structural aspects and features in the bioengineering of the gas
exchangers: comparative perspectives. Advanced Anatomical Embryology and Cell
Biology. 163:III-XII, 1-108.
Maxwell, M., Tullet, S.G., Burton, F.G. (1987). Haematology and morphological changes in
young broiler chicks with experimentally induced hypoxia. Research in Veterinary
Science. 43:331-338.
McCutcheon, I.E., Metcalfe J., Metzenberg A.B., Ettinger T. (1982). Organ growth in hyperoxic
and hypoxic chick embryos. Respiration Physiology. 50: 153-163.
McGovern, R.H., Feddes, J.J.R., Zuidhof, M.J., Hanson, J.A., Robinson, F.E. (2001). Growth
performance, heart characteristics and the incidence of ascites in broilers in response to
carbon dioxide and oxygen concentrations. Canadian Biosystems Engineering. 43:4.1-
4.6.
Menna, T.M., and Mortola, J.P. (2002). Metabolic control of pulmonary ventilation in the
developing chick embryo. Respiration Physiology. 130: 43-55.
41

Metcalfe, J., McCutcheon, I.E., Francisco, D.L., Metzenberg, A.B., Welch, J.E. (1981). Oxygen
availability and growth of the chick embryo. Respiration Physiology. 46:81-88.
Meuer, H. and R.Baumann. (1987). Oxygen Supply of Early Chick Embryo in Normoxia and
Hypoxia. The Journal of Experimental Zoology Supplement. 1:203-207.
Meuer, H., Hartmann, V., and Jopp, S. (1992). Tissue PO2 and growth rate in early chick
embryos. Respiratory Physiology. 90: 227-37.
Microlivestock: Little Known Small Animals with a Promising Future. (1991). Office of
International Affairs. Chapter 11 Quail, pp 147-156.
Miller, S.L, Green, L.R., Peebles, D.M., Hanson, M.A., and Blanco, C.E. (2002). Effects of
chronic hypoxia and protein malnutrition on growth in the developing chick. American
Journal of Gynecology. 186: 261-7.
Moore, C.R., and D.Price. (1948). Journal of Experimental Zoology. 108:171.
Mulder, A.L., Golde, J.M., Goor, A.A., Giussani, D.A., and Blanco, C.E. (2000). Developmental
changes in plasma catecholamine concentrations during normoxia and acute hypoxia in
the chick embryo. Journal of Physiology. 527 Pt 3:593-9.
Nakane, Y., M.Tsudzuki. (1999). Development of the skeleton in Japanese quail embryos.
Developmental Growth Differentiation. 41: 523-534.
42

Needham, J. (1932). On the true metabolic rate of the chick embryo and the respiration of its
membranes. Proceedings of the Royal Society London B. 110: 46-74.
Olander, H.J., Burton, R.R., Adler, H.E. (1967). The Pathophysiology of full hypoxia in
chickens. Poultry Science 609-620.
Padgett, C. S. and W.D. Ivey. (1960). The normal embryology of the Coturnix quail. Anatomical
Record. 137:1.
Peacock, A.J., Pickett, C, Morris, K., and Reeves, J.T. (1989). The relationship between rapid
growth and pulmonary hemodynamics in the fast-growing broiler chicken. American
Review of Respiratory Diseases. 139: 1524-30.
Pettit, T.N., and Whittow, G.C. (1982). The initiation of pulmonary respiration in a bird embryo:
blood and air cell gas tensions. Respiration Physiology. 48: 199-208.
Piacentini, L. and J.S. Karliner. (1999). Altered gene expression during hypoxia and
reoxygenation of the heart. Pharmacology and Therapeutics. 83: 21-37.
Richards, M.P., Stock, M.K., and Metcalfe, J. (1991). Effects of brief hypoxia and hyperoxia on
tissue trace element levels in the developing chick embryo. Magnetic Trace Elements. 10:
305-20.
Robertson, T.B. (1923). The Chemical Basis of Growth and Senescence. Philadelphia,
Lippincott.
Romanoff, A.L. (1960). The Avian Embryo. New York: Macmillan.
43

Shams, H., and Scheid, P. (1989). Efficiency of parabronchial gas exchange in deep hypoxia:
measurements in the resting duck. Respiratory Physiology. 77: 135-46.
Smith, A.H., Burton, R.R., Besch, E.L. (1969 May-June). Development of the Chick embryo at
high altitude. Federation Proceedings. 28: 1092-1098.
Stock, M., Asson-Batres, M.A., and Metcalf, J. (1985). Stimulatory and Persistent Effect of
Acute Hyperoxia on Respiratory Gas Exchange of the Chick Embryo. Respiration
Physiology. 62: 217-230.
Stock, M.K. and J.Metcalfe. (1987). Modulation of Growth and Metabolism of the Chick
Embryo by a Brief (72-hr) Change in Oxygen Availability. The Journal of Experimental
Biology Supplement. 1:351-356.
Stock, M.K. and J.Metcalfe. (1984). Stimulation of growth of the chick embryo by acute
hyperoxia. Respiration Physiology. 58: 351-358.
Stock, M.K., Francisco, D.L., Metcalfe, J. (1983). Organ growth in chick embryos incubated in
40% or 70% oxygen. Respiration Physiology. 52: 1-11.
Tazawa, H., Nakazawa, S., Okuda, A., Whittow, G.C. (1988). Short-term effects of altered shell
conductance on oxygen uptake and hematological variables of late chicken embryos.
Respiration Physiology. 74: 199-209.
Temple, G.F. and J.Metcalfe. (1970). The effects of increased incubator oxygen tension on
capillary development in the chick chorioallantois. Respiration Physiology. 9:216-233.
44

Thurman, R.G., Nakagawa, Y., Matsumura, T., Lemasters, J.J., Misra, U.K., Kauffman, F.C.
(1993). Regulation of oxygen uptake in oxygen-rich periportal and oxygen-poor
pericentral regions of the liver lobule by oxygen tension. In: Hochachka, P.W., Lutz,
P.L., Sick, T., Rosenthal, M., van den Thillart, G. (eds). Surviving Hypoxia -
Mechanisms of Control and Adaptation. Boca Raton, FL: CRC Press. 329-340.
Van Liere, E.J. and J.C.Stickney. (1963). Hypoxia. The University of Chicago Press.
Velarde, F.L., Espinoza, D., Monge, C., de Muizon, C. (1991). A genetic response to high
altitude hypoxia : high hemoglobin-oxygen affinity in chicken (Gallus gallus) from the
Peruvian Andes. C R Academic Science III. 313: 401-6.
Visschedijk, A.H.J. (1980). Effects of Barometric and Abnormal Gas Mixtures on Gaseous
Exchange by the Avian Embryo. American Zoologist. 20:469-476.
Visschedijk, A.H.J. (1985). Gas exchange and hatchability of chicken eggs incubated at
simulated high altitude. Journal of Applied Physiology. 58: 416-8.
Vleck, C.M., Vleck, D., Hoyt, D.F. (1980). Patterns of Metabolism and Growth in Avian
Embryos. American Zoologist. 20: 405-416.
45

Weber, R.E., Hiebl, I., and Braunitzer, G. (1988). High altitude and hemoglobin function in the
vultures Gyps rueppellii and Aegypius monachus. Biological Chemistry Hoppe Seyler.
369:233-40.
Weber, R.E., Jessen, T.H., Malte, H., and Tame, J. (1993). Mutant hemoglobins (alpha 119-Ala
and beta 55-Ser): functions related to high-altitude respiration in geese. Journal of
Applied Physiology. 75: 2646-55.
Wieser, W. (2002). Comparative and medical physiology: a theme with three variations. Journal
of Comparative Physiology. 172: 651-7.
Witzel, D, Huff, W.E., Kubena,L.F., Harvey, R.B., Elissalde , M.H.. (1990). Ascites in growing
broilers: A research model. Poultry Science. 69:741-745.
Yue, X., and Tomanek, R.J. (1999). Stimulation of coronary vasculogenesis/angiogenesis by
hypoxia in cultured embryonic hearts. Developmental Dynamics. 216:28-36.
Yue, X., and Tomanek, R.J. (2001). Effects of VEGF (165) and VGF (121) on vasculogenesis
and angiogenesis in cultured embryonic quail hearts. American Journal of Physiology
and Heart Circulation Physiology. 280: H2240-7.
46
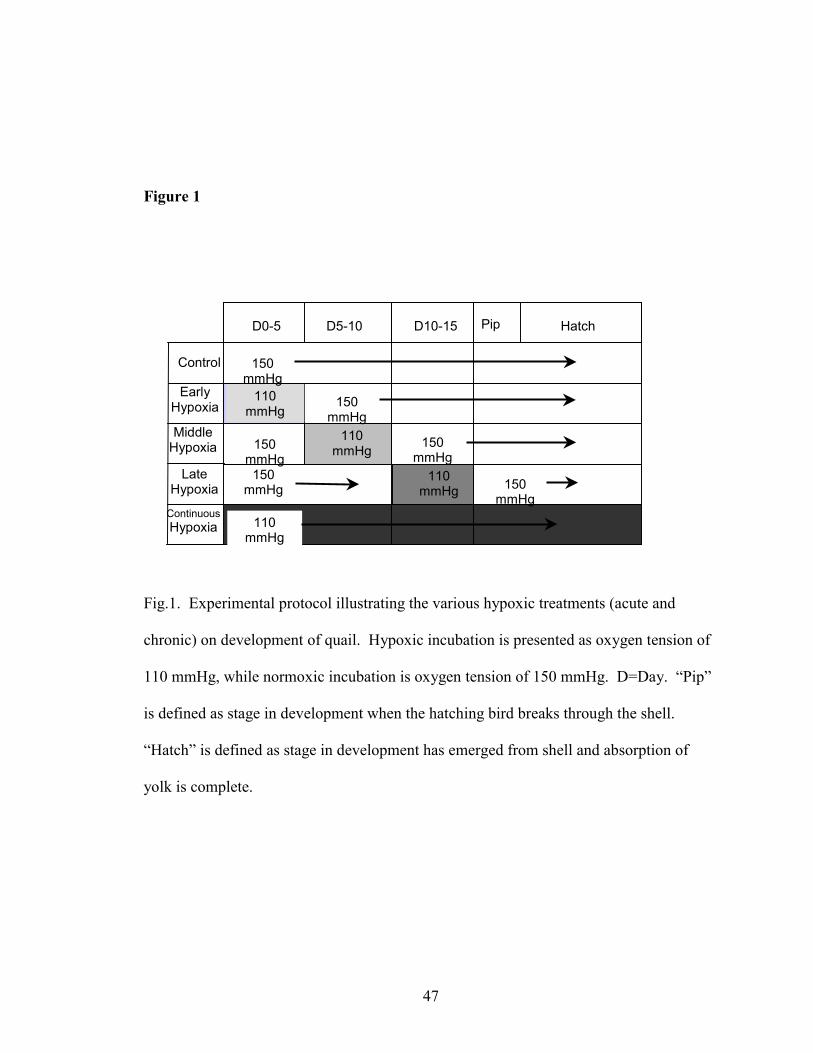
Figure 1
PipD0-5 D5-10 D10-15 Hatch
Control
Late Hypoxia
Middle Hypoxia
Early Hypoxia
Continuous Hypoxia
110 mmHg
150 mmHg
150 mmHg
110 mmHg 150
mmHg 150
mmHg 150
mmHg 110
mmHg 150 mmHg
110 mmHg
Fig.1. Experimental protocol illustrating the various hypoxic treatments (acute and
chronic) on development of quail. Hypoxic incubation is presented as oxygen tension of
110 mmHg, while normoxic incubation is oxygen tension of 150 mmHg. D=Day. “Pip”
is defined as stage in development when the hatching bird breaks through the shell.
“Hatch” is defined as stage in development has emerged from shell and absorption of
yolk is complete.
47

Figure 2
Hatch
Control Hypoxia Early Hypoxia Middle Hypoxia Late Hypoxia Continuous Hypoxia
100
80
60
Survivorship at Each Measured Stage (%)
40
20
0 15105 0
Development
Fig.2. Survivorship of control and treatment groups measured at days 10, 15, and hatch.
48

Figure 3
Mean body mass during development. A) Mean wet body mass
(mg) measured on days 10, 15, and hatch for early, middle, late and
continuous hypoxia. (B) Mean dry body mass (mg) measured on
days 10, 15, and hatch for early, middle, late and continuous
hypoxia. Boxed points are not significantly different.
49

Development (Days)
0
2
4
6
8
10
Mas
s (g
)
0.0
0.5
1.0
1.5
2.0
2.5
Wet Body Mass
Dry Body Mass
Mas
s (g
)
B
Development (Days)
5 10 15 Hatch0
Hatch151050
ControlEarly Hypoxia Middle Hypoxia Late Hypoxia Continuous Hypoxia
Figure 3
A
50

Figure 4
Morphology during development. A) Mean beak length (mm) at
days 10, 15, and hatch for early, middle, late and continuous
hypoxia. (B) Mean third toe length (mm) at days 10, 15, and hatch
for early, middle, late and continuous hypoxia. Boxed points are
not significantly different.
51
57
10 150
Development (Days)
Hatch
Beak
Development (Days)10 15
Leng
th (m
m)
1.5
2.0
2.5
3.0
3.5
4.0
5
10
15
20
Third Toe
Leng
th (m
m)
Hatch
Figure 4
ControlEarly HypoxiaMiddle HypoxiaLate HypoxiaContinuous Hypoxia

53
Figure 5
Mean heart mass during development. A) Mean wet heart mass
(mg) measured on days 10, day 15, and hatch for early, middle, late
and continuous hypoxia. (B) Mean dry heart mass (mg) measured
on days 10, 15, and hatch for early, middle, late and continuous
hypoxia. Boxed points are not significantly different.

59Development (Days)
0Hatch1510
Wet Heart MassW
eigh
t (m
g)
0
10
20
30
40
50
60
70
Dry Heart Mass
Wei
ght (
mg)
2
4
6
8
10
12
14
10 15 Hatch
A
B Development (Days)
Figure 5
ControlEarly HypoxiaMiddle HypoxiaLate HypoxiaContinuous Hypoxia

55
Figure 6
Mean heart to body mass ratio during development. A) Mean wet
heart to body mass ratios measured on days 10, day 15, and hatch
for early, middle, late and continuous hypoxia. (B) Mean dry heart
to body mass ratios measured on days 10, 15, and hatch for early,
middle, late and continuous hypoxia. Boxed points are not
significantly different.

W et Masses
Development (Days)10 15 Hatch
Wet
Hea
rt M
ass
/ Wet
Bod
y M
ass
0.004
0.006
0.008
0.010
0.012
0.014
0.016
Dry Masses
Development (Days)10 15 Hatch
Dry
Hea
rt M
ass
/ Dry
Bod
y M
ass
0.004
0.006
0.008
0.010
0.012
0.014
0.016
0.018
0.020
Figure 6
56

Table 1. Mean body mass (g) and calculated mean water content during development, for control and each treatment group at days 10, 15,
and hatch. Asterisks and bold values indicate significant values from control (ANOVA followed by SNK multiple range tests).
Day 10
Day 15
Hatch
n
Wet
Dry
Water
Content(%)
n
Wet
Dry
Water
Content(%)
n
Wet
Dry
Water
Content (%)
Control
33
2.0 � 0.13
0.2 � 0.03
91
37
6.5 � 0.1
1.3 � 0.04
81
18
8.8 � 0.2
1.6 � 0.04
82
Early
Hypoxia
27
1.7 � 0.14
0.15 � 0.03
91
38
*5.7 � 0.13
*1.1 � 0.03
81
18
8.0 � 0.2
*1.4 � 0.05
82
Middle
Hypoxia
19
1.9 � 0.2
0.2 � 0.04
90
28
*5.5 � 0.15
*0.9 � 0.03
82
7
8.1 � 0.48
1.93� 0.31
86
Late
Hypoxia
28
1.6 � 0.14
0.15 � 0.03
91
33
*5.4 � 0.14
*0.9 � 0.03
83
12
8.7 � 0.4
1.6 � 0.05
82
Continuous
Hypoxia
47
1.5 � 0.13
0.13 � 0.03
91
10
*3.4 � 0.27
*0.6 � 0.06
81
0
N/A
N/A
N/A
57
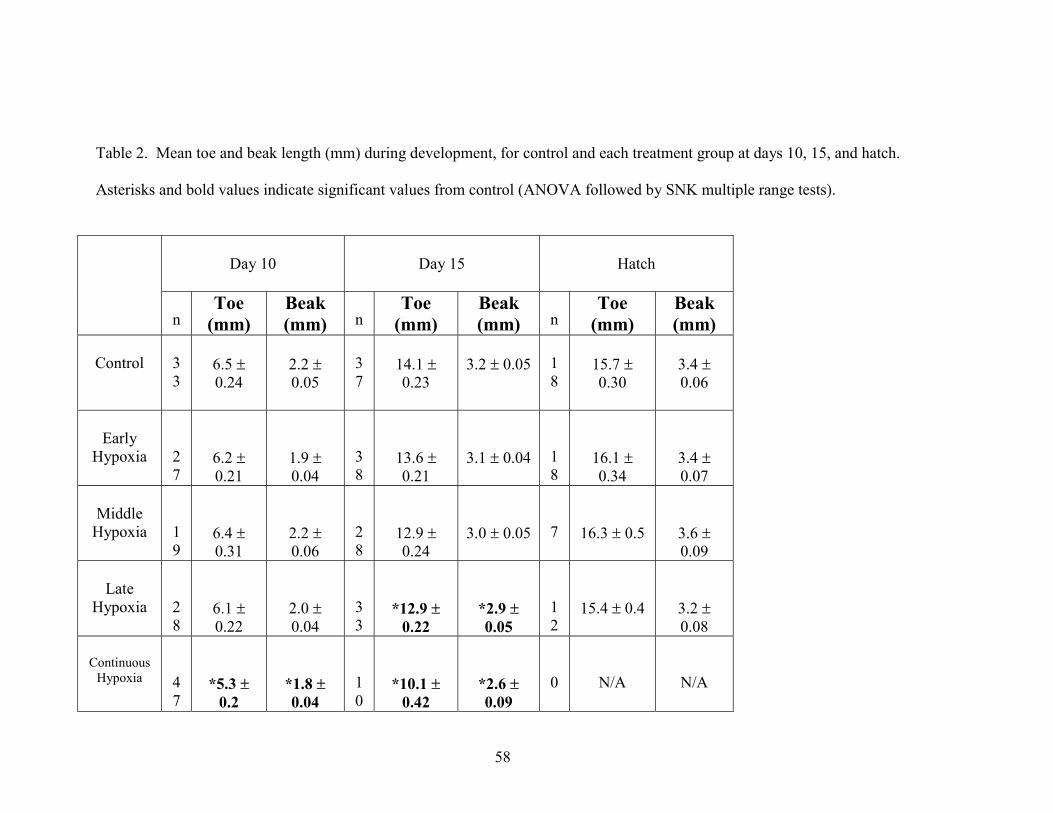
Table 2. Mean toe and beak length (mm) during development, for control and each treatment group at days 10, 15, and hatch.
Asterisks and bold values indicate significant values from control (ANOVA followed by SNK multiple range tests).
Day 10
Day 15
Hatch
n
Toe (mm)
Beak (mm)
n
Toe (mm)
Beak (mm)
n
Toe (mm)
Beak (mm)
Control
33
6.5 � 0.24
2.2 � 0.05
37
14.1 � 0.23
3.2 � 0.05
18
15.7 � 0.30
3.4 � 0.06
Early
Hypoxia
27
6.2 � 0.21
1.9 � 0.04
38
13.6 � 0.21
3.1 � 0.04
18
16.1 � 0.34
3.4 � 0.07
Middle
Hypoxia
19
6.4 � 0.31
2.2 � 0.06
28
12.9 � 0.24
3.0 � 0.05
7
16.3 � 0.5
3.6 � 0.09
Late
Hypoxia
28
6.1 � 0.22
2.0 � 0.04
33
*12.9 � 0.22
*2.9 � 0.05
12
15.4 � 0.4
3.2 � 0.08
Continuous
Hypoxia
47
*5.3 � 0.2
*1.8 � 0.04
10
*10.1 � 0.42
*2.6 � 0.09
0
N/A
N/A
58

Table 3. Mean heart mass (mg) and calculated mean water content during development, for control and each treatment group
at days 10, 15, and hatch. No significant differences were measured.
Day 10
Day 15
Hatch
n
Wet
Dry
Water
Content(%)
n
Wet
Dry
Water
Content (%)
n
Wet
Dry
Water
Content (%)
Control
33
33 � 5.4
3.6 � 0.5
89
37
30 � 6.6
5.0 �0.7
83
18
96 �17
7.5 �0.9
80
Early
Hypoxia
27
31 �6
3.4 �0.6
89
38
38 �5.2
6.3 �0.5
83
18
50 �11
7.7 �0.9
77
Middle
Hypoxia
19
28 �7.3
3.6 �0.7
87
28
33 �5.7
5.3 �0.5
84
7
60 � 17
11.4 �0.4
90
Late
Hypoxia
28
36.7 �6
3.4 �0.6
91
33
32 �5
5.2 �0.5
84
12
69 �15
10.3 �1
79
Continuous
Hypoxia
47
26.4 �6.2
3.2 �0.6
88
10
42 �8.7
4.9 �0.8
88
0
N/A
N/A
N/A
59

Table 4. Mean hematocrit (%) and hemoglobin (g%) during development for control and each treatment group at days 10, 15,
and hatch. No significant differences were measured.
Day 10
Day 15
Hatch
n
Hematocrit (%)
n
Hemoglobin (g%)
n
Hematocrit (%)
n
Hemoglobin
(g%)
n
Hematocrit (%)
n
Hemoglobin (g%)
Control
16
23.4 � 3.2
18
6.6 � 0.8
8
29.6 � 6.1
9
9.3 � 1.3
18
26 � 3.9
17
9.5 � 1.3
Early
Hypoxia
21
21.4 � 3.5
17
6.7 � 1.1
20
26.9 � 7.6
10
8.9 � 1.2
12
27.8 � 4.9
14
8.8 � 1.7
Middle
Hypoxia
8
21.4 � 4.3
10
6.6 � 1.2
13
25.2 � 4.2
6
9.4 � 1.0
5
26.6 � 4.3
5
9.1 � 1.3
Late
Hypoxia
19
22.2 � 3.4
19
6.5 � 1.3
9
27.8 � 7.6
7
8.1 � 1.8
8
29.9 � 3.7
8
9.1 � 1.4
Continuous
Hypoxia
13
22.2 � 5.3
16
6.6 � 1.6
5
26.5 � 1.0
5
7.4 � 0.0
0
N/A
0
N/A
60