morningstar document research - procter & gamble · became a wholly owned subsidiary of...
TRANSCRIPT

Morningstar® Document Research℠
FORM 8-KPROCTER & GAMBLE CO - pgFiled: January 29, 2010 (period: January 29, 2010)
Report of unscheduled material events or corporate changes.
Table of Contents
UNITED STATESSECURITIES AND EXCHANGE COMMISSION
Washington, D.C. 20549
FORM 8-K
CURRENT REPORT
Pursuant to Section 13 OR 15(d) of TheSecurities Exchange Act Of 1934
Date of Report (Date of earliest event reported) January 29, 2010
THE PROCTER & GAMBLE COMPANY(Exact name of registrant as specified in its charter)
Ohio 1-434 31-0411980(State or other jurisdiction
of incorporation) (CommissionFile Number)
(IRS EmployerIdentification Number)
One Procter & Gamble Plaza, Cincinnati, Ohio 45202(Address of principal executive offices) Zip Code
(513) 983-1100(Registrant’s telephone number, including area code)
Check the appropriate box below if the Form 8-K filing is intended to simultaneously satisfy the filing obligation of the registrant under any of the followingprovisions:
� Written communications pursuant to Rule 425 under the Securities Act (17 CFR 230.425)
� Soliciting material pursuant to Rule 14a-12 under the Exchange Act (17 CFR 240.14a-12)
� Pre-commencement communications pursuant to Rule 14d-2(b) under the Exchange Act (17 CFR 240.14d-2(b))
� Pre-commencement communications pursuant to Rule 13e-4(c) under the Exchange Act (17 CFR 240.13e-4(c))
Source: PROCTER & GAMBLE CO, 8-K, January 29, 2010 Powered by Morningstar® Document Research℠

Table of ContentsTABLE OF CONTENTS
ITEM 8.01 OTHER EVENTSSIGNATUREEXHIBIT INDEXEX-99.1EX-99.2EX-11EX-12EX-99.3EX-23EX-101.INS*EX-101.SCH*EX-101.CAL*EX-101.DEF*EX-101.LAB*EX-101.PRE*
* XBRL (Extensible Business Reporting Language) information is furnished and not filed or a part of a registration statement or prospectus forpurposes of sections 11 or 12 of the Securities Act of 1933, is deemed not filed for purposes of section 18 of the Securities Exchange Act of 1934,and otherwise is not subject to liability under these sections.
2
Source: PROCTER & GAMBLE CO, 8-K, January 29, 2010 Powered by Morningstar® Document Research℠
Table of Contents
ITEM 8.01 OTHER EVENTS
On October 30, 2009, The Procter & Gamble Company (the “Company”) sold its global pharmaceuticals business to Warner Chilcott plc (“Warner Chilcott”) for$2.8 billion. Under the terms of the agreement, Warner Chilcott acquired the Company’s portfolio of branded pharmaceuticals products, prescription drugproduct pipeline and manufacturing facilities in Puerto Rico and Germany. The pharmaceuticals business had historically been part of the Company’s HealthCare reportable segment. In accordance with the applicable accounting guidance for the impairment or disposal of long-lived assets, the Company is required topresent the results of the pharmaceuticals business as discontinued operations. As such, the Company has amended its previously filed Management’s Discussionand Analysis (MD&A) and Consolidated Financial Statements and accompanying footnotes to exclude the results of the pharmaceuticals business from bothcontinuing operations and segment results for the years ended June 30, 2009, 2008 and 2007.
Effective July 1, 2009, the Company implemented a number of changes to its organization structure for the Beauty Global Business Unit (GBU), which resultedin changes to the components of its segment structure. As a result, the Beauty GBU became the Beauty and Grooming GBU and reportable segments under theGBU moved to a new consumer-oriented alignment. The two reportable segments within the Beauty and Grooming GBU continue to be Beauty and Grooming.However, female blades and razors transitioned from Grooming to Beauty. In addition, certain male-focused brands and businesses, such as Old Spice andGillette personal care, moved from Beauty to Grooming. The Company has revised the MD&A and accompanying Consolidated Financial Statements for theyears ended June 30, 2009, 2008 and 2007, to reflect the new organizational structure implemented on July 1, 2009.
This Form 8-K provides revised (1) MD&A and (2) Consolidated Financial Statements and accompanying footnotes.
Exhibit 99.1 provides a revised MD&A; Exhibit 99.2 provides revised Consolidated Financial Statements and accompanying footnotes; Exhibit 11 provides theComputation of Earnings per Share; Exhibit 12 provides the Computation of Ratio of Earnings to Fixed Charges; Exhibit 99.3 provides an updated report of theindependent registered public accountant; Exhibit 23 provides the Consent of Deloitte & Touche LLP; Exhibit 101.INS provides XBRL Instance Document;Exhibit 101.SCH provides XBRL Taxonomy Extension Schema Document; Exhibit 101.CAL provides XBRL Taxonomy Extension Calculation LinkbaseDocument; Exhibit 101.DEF provides XBRL Taxonomy Definition Linkbase Document; Exhibit 101.LAB provides XBRL Taxonomy Extension Label LinkbaseDocument; and Exhibit 101.PRE provides XBRL Taxonomy Extension Presentation Linkbase Document.
3
Source: PROCTER & GAMBLE CO, 8-K, January 29, 2010 Powered by Morningstar® Document Research℠

Table of ContentsSIGNATURE
Pursuant to the requirements of the Securities Exchange Act of 1934, the Registrant has duly caused this Report to be signed on its behalf by the undersignedhereunto duly authorized.
THE PROCTER & GAMBLE COMPANY
BY: /S/ E.J. WUNSCH E.J. Wunsch
Assistant SecretaryJanuary 29, 2010
4
Source: PROCTER & GAMBLE CO, 8-K, January 29, 2010 Powered by Morningstar® Document Research℠

Table of ContentsEXHIBIT(S)
99.1 Revised Management’s Discussion and Analysis
99.2 Revised Consolidated Financial Statements and Accompanying Footnotes
11 Computation of Earnings per Share
12 Computation of Ratio of Earnings to Fixed Charges
99.3 Updated Report of the Independent Registered Public Accountant
23 Consent of Deloitte & Touche LLP
101.INS* XBRL Instance Document
101.SCH* XBRL Taxonomy Extension Schema Document
101.CAL* XBRL Taxonomy Extension Calculation Linkbase Document
101.DEF* XBRL Taxonomy Definition Linkbase Document
101.LAB* XBRL Taxonomy Extension Label Linkbase Document
101.PRE* XBRL Taxonomy Extension Presentation Linkbase Document
* XBRL (Extensible Business Reporting Language) information is furnished and not filed or a part of a registration statement or prospectus forpurposes of sections 11 or 12 of the Securities Act of 1933, is deemed not filed for purposes of section 18 of the Securities Exchange Act of 1934,and otherwise is not subject to liability under these sections.
5
Source: PROCTER & GAMBLE CO, 8-K, January 29, 2010 Powered by Morningstar® Document Research℠

Exhibit 99.1: Revised Management’s Discussion and Analysis
Management’s Discussion and Analysis
The purpose of this discussion is to provide an understanding of P&G’s financial results and condition by focusing on changes in certain key measures from yearto year. Management’s Discussion and Analysis (MD&A) is organized in the following sections:
• Overview
• Summary of 2009 Results
• Forward-Looking Statements
• Results of Operations
• Segment Results
• Financial Condition
• Significant Accounting Policies and Estimates
• Other Information
Throughout MD&A, we refer to measures used by management to evaluate performance, including unit volume growth, net outside sales and net earnings. Wealso refer to a number of financial measures that are not defined under accounting principles generally accepted in the United States of America (U.S. GAAP),including organic sales growth, free cash flow and free cash flow productivity. We believe these measures provide investors with important information that isuseful in understanding our business results and trends. The explanation at the end of MD&A provides more details on the use and the derivation of thesemeasures. Management also uses certain market share and market consumption estimates to evaluate performance relative to competition despite somelimitations on the availability and comparability of share information. References to market share and market consumption in MD&A are based on a combinationof vendor-reported consumption and market size data, as well as internal estimates.
In October 2009, we sold our global pharmaceuticals business to Warner Chilcott plc (Warner Chilcott) for $2.8 billion. Under the terms of the agreement,Warner Chilcott acquired our portfolio of branded pharmaceuticals products, our prescription drug product pipeline and manufacturing facilities in Puerto Ricoand Germany. The pharmaceuticals business had historically been part of the Health Care reportable segment. In accordance with the applicable accountingguidance for the impairment or disposal of long-lived assets, the results of our pharmaceuticals business are presented as discontinued operations and, as such,have been excluded from continuing operations and from segment results for all periods presented.
Effective July 1, 2009, we implemented a number of changes to our organization structure for the Beauty Global Business Unit (GBU), which resulted in changesto the components of its segment structure. As a result, the Beauty GBU became the Beauty and Grooming GBU and reportable segments under the GBU movedto a new consumer-oriented alignment. The two reportable segments within the Beauty and Grooming GBU continue to be Beauty and Grooming. However,female blades and razors transitioned from Grooming to Beauty. In addition, certain male-focused brands and businesses, such as Old Spice and Gillette personalcare, moved from Beauty to Grooming. These changes have been reflected in our segment reporting beginning in fiscal year 2010. Our historical segmentreporting for the years ended June 30, 2007, 2008 and 2009 has been restated to reflect the new structure. The GBU and segment discussions in the MD&A andaccompanying Consolidated Financial Statements have been revised to reflect the new organizational structure implemented on July 1, 2009.
In November 2008, we completed the divestiture of our coffee business through the merger of our Folgers coffee subsidiary into The J.M. Smucker Company(Smucker) in an all-stock reverse Morris Trust transaction. In connection with the merger, 38.7 million shares of P&G common stock were tendered by ourshareholders and exchanged for all shares of Folgers common stock. Pursuant to the merger, a Smucker subsidiary merged with and into Folgers and Folgersbecame a wholly owned subsidiary of Smucker. The Company recognized an after-tax gain on the disposition of $2.0 billion, which is included as part of netearnings from discontinued operations.
- 1 -
Source: PROCTER & GAMBLE CO, 8-K, January 29, 2010 Powered by Morningstar® Document Research℠

The coffee business had historically been part of the Company’s Snacks, Coffee and Pet Care reportable segment, as well as the coffee portion of theaway-from-home business which was included in the Fabric Care and Home Care reportable segment. In accordance with the applicable accounting guidance forthe impairment or disposal of long-lived assets, the results of our coffee business are presented as discontinued operations and, as such, have been excluded fromcontinuing operations and from segment results for all periods presented. The Snacks, Coffee and Pet Care reportable segment was renamed Snacks and Pet Careto reflect this change.
OVERVIEW
P&G’s business is focused on providing branded consumer packaged goods. Our goal is to provide products of superior quality and value to improve the lives ofthe world’s consumers. We believe this will result in leadership sales, earnings and value creation, allowing employees, shareholders and the communities inwhich we operate to prosper.
Our products are sold in more than 180 countries primarily through mass merchandisers, grocery stores, membership club stores, drug stores and “high frequencystores,” the neighborhood stores which serve many consumers in developing markets. We continue to expand our presence in other channels includingdepartment stores, perfumeries, pharmacies, salons and e-commerce. We have on-the-ground operations in approximately 80 countries.
Our market environment is highly competitive, with global, regional and local competitors. In many of the markets and industry segments in which we sell ourproducts, we compete against other branded products as well as retailers’ private-label brands. Additionally, many of the product segments in which we competeare differentiated by price (referred to as super-premium, premium, mid-tier value and low-tier economy products). Generally speaking, we compete withsuper-premium, premium and mid-tier value products and are well positioned in the industry segments and markets in which we operate – often holding aleadership or significant market share position.
Organizational Structure
Our organizational structure is comprised of three Global Business Units (GBUs), Global Operations, Global Business Services (GBS) and Corporate Functions(CF).
Global Business Units
Our three GBUs are Beauty and Grooming, Health and Well-Being and Household Care. The primary responsibility of the GBUs is to develop the overallstrategy for our brands. They identify common consumer needs, develop new product innovations and upgrades and build our brands through effectivecommercial innovations and marketing plans.
Under U.S. GAAP, the business units comprising the GBUs were aggregated into six reportable segments: Beauty; Grooming; Health Care; Snacks and Pet Care;Fabric Care and Home Care; and Baby Care and Family Care. The following provides additional detail on our GBUs and reportable segments and the keyproduct and brand composition within each.
GBU Reportable
Segment % of
Net Sales* % of Net
Earnings* Key Products Billion Dollar BrandsBeauty and Grooming
Beauty
24%
24%
Female Beauty Products(Cosmetics, Deodorants, FemaleBlades and Razors, PersonalCleansing, Skin Care), Hair Care(Retail & Salon Professional),Prestige Fragrances
Head & Shoulders, Olay,Pantene, Wella
Grooming
10%
13%
Electric Hair Removal Devices,Home Appliances, Male Bladesand Razors, Male Personal CareProducts (Deodorants, face andShave Products, Hair Care,Personal Cleansing)
Braun, Fusion, Gillette, Mach3
Health and Well-Being
Health Care
14%
17%
Feminine Care, Oral Care,Personal Health Care
Always, Crest, Oral-B
Snacks and PetCare
4%
2%
Pet Food, Snacks
Iams, Pringles
Household Care
Fabric Care andHome Care
30%
28%
Air Care, Batteries, Dish Care,Fabric Care, Surface Care
Ariel, Dawn, Downy, Duracell,Gain, Tide
Baby Care andFamily Care
18%
16%
Baby Wipes, Bath Tissue,Diapers, Facial Tissue, PaperTowels
Bounty, Charmin, Pampers
* Percent of net sales and net earnings from continuing operations for the year ended June 30, 2009 (excluding results held in Corporate).
- 2 -
Source: PROCTER & GAMBLE CO, 8-K, January 29, 2010 Powered by Morningstar® Document Research℠

Beauty and Grooming
Beauty: We are a global market leader in the beauty category. Most of the beauty markets in which we compete are highly fragmented with a large numberof global and local competitors. In female beauty, we compete with a wide variety of products, ranging from cosmetics to female blades and razors to skincare. Our largest female beauty brand is Olay, which is the top facial skin care retail brand in the world. In hair care, we compete in both the retail andsalon professional channels. We are the global market leader in the retail hair care market with over 20% of the global market share. In the prestigechannel, we compete primarily with prestige fragrances and the SK-II brand. We are one of the global market leaders in prestige fragrances, primarilybehind the Gucci, Hugo Boss and Dolce & Gabbana fragrance brands.
Grooming: We hold leadership market share in the male blades and razors market on a global basis and in almost all of the geographies in which wecompete. Our global male blades and razors market share is over 70%, primarily behind the Gillette franchise including Mach3 and Fusion. We alsocompete in male personal care with deodorants, face and shave preparation, hair care and personal cleansing products. Our electric hair removal devicesand small home appliances are sold under the Braun brand in a number of markets around the world, where we compete against both global and regionalcompetitors. Our primary focus in this area is electric hair removal devices, such as electric razors and epilators, where we hold approximately 30% and50% of the male and female markets, respectively.
Health and Well-Being
Health Care: We compete in oral care, feminine care and personal health. In oral care, there are several global competitors in the market, and we have thenumber two market share position with approximately 20% of the global market. We are the global market leader in the feminine care category with over35% of the global market share. In personal health, we are the market leader in nonprescription heartburn medications and in respiratory treatments withPrilosec OTC and Vicks, respectively.
Snacks and Pet Care: In snacks, we compete against both global and local competitors and have a global market share of approximately 10% in the potatochips market behind our Pringles brand. In pet care, we compete in several markets around the globe in the premium pet care segment, with the Iams andEukanuba brands. The vast majority of our pet care business is in North America, where we have approximately a 10% share of the market.
Household Care
Fabric Care and Home Care: This segment is comprised of a variety of fabric care products, including laundry cleaning products and fabric conditioners;home care products, including dishwashing liquids and detergents, surface cleaners and air fresheners; and batteries. In fabric care, we generally have thenumber one or number two share position in the markets in which we compete and are the global market leader, with over 30% of the global market share.Our global home care market share is over 15% across the categories in which we compete. In batteries, we compete primarily behind the Duracell brandand have over 25% of the global general purpose battery market share.
Baby Care and Family Care: In baby care, we compete primarily in diapers, training pants and baby wipes, with approximately 35% of the global marketshare. We are the number one or number two baby care competitor in most of the key markets in which we compete, primarily behind Pampers, theCompany’s largest brand, with annual net sales of approximately $8 billion. Our family care business is predominantly a North American businesscomprised primarily of the Bounty paper towel and Charmin toilet tissue brands, with U.S. market shares of over 45% and 25%, respectively.
Global Operations
Global Operations is comprised of our Market Development Organization (MDO), which is responsible for developing go-to-market plans at the local level. TheMDO includes dedicated retail customer, trade channel and country-specific teams. It is organized along five geographic units: North America, Western Europe,Central &
- 3 -
Source: PROCTER & GAMBLE CO, 8-K, January 29, 2010 Powered by Morningstar® Document Research℠

Eastern Europe/Middle East/Africa (CEEMEA), Latin America and Asia, which is comprised of Japan, Greater China and ASEAN/Australia/India/Korea(AAIK). Throughout MD&A, we reference business results in developing markets, which we define as the aggregate of CEEMEA, Latin America, AAIK andGreater China, and developed markets, which are comprised of North America, Western Europe and Japan.
Global Business Services
GBS provides technology, processes and standard data tools to enable the GBUs and the MDO to better understand the business and better serve consumers andcustomers. The GBS organization is responsible for providing world-class solutions at a low cost and with minimal capital investment.
Corporate Functions
CF provides Company-level strategy and portfolio analysis, corporate accounting, treasury, external relations, governance, human resources and legal, as well asother centralized functional support.
Strategic Focus
P&G is focused on strategies that we believe are right for the long-term health of the Company and will increase returns for our shareholders. The Company’slong-term financial targets are:
• Organic sales growth of 4% to 6%. This is comprised of:
• 3% to 4% of market growth, plus
• 1% to 2% of share growth
• 0% to 1% of mix enhancement and whitespace expansion, plus
• 1% of growth acceleration behind revenue synergies associated with the Gillette acquisition.
• Operating margin expansion of 50 to 75 basis points.
• Diluted net earnings per share (EPS) growth of 10%.
• Free cash flow productivity of 90% or greater (defined as the ratio of operating cash flow less capital expenditures to net earnings).
• Capital spending at or below 4% of net sales annually.
As a result of the recent global economic downturn, market growth rates have slowed and for 2010 are expected to be below the range that underpins ourlong-term financial growth targets. We are continuing to monitor market growth and may reassess our long-term targets in the future.
In order to achieve these targets, we will focus on three primary areas:
• Grow our leading, global brands and core categories. Our portfolio includes 22 brands that generate over $1 billion in annual sales and 20 brandsthat generate approximately $500 million or more in annual sales. Combined, these 42 brands account for 85% or more of our sales andprofits. These brands are platforms for future innovations that will drive sales growth, expand categories for retail customers and differentiate brandsin the minds of consumers. Our core categories, Baby Care, Blades and Razors, Fabric Care, Family Care, Feminine Care, Home Care, Oral Care,Prestige Fragrances, Retail Hair Care and Skin Care, have opportunities for continued growth. We will focus on profitable share growth across all ofour businesses by leveraging our core strengths in innovation and brand-building.
• Build business with underserved and unserved consumers. We are increasing our presence in developing markets, where 86% of the world’spopulation lives. We will increase the amount of sales from these markets by focusing on affordability, accessibility and awareness of our brands.We are extending our distribution systems to reach more consumers through underserved retail channels such as e-commerce and high frequencystores. And, we are creating a broader and deeper product portfolio. Our initiative pipeline has new and improved products that extend andstrengthen our category and brand portfolios vertically and horizontally.
- 4 -
Source: PROCTER & GAMBLE CO, 8-K, January 29, 2010 Powered by Morningstar® Document Research℠
• Continue to grow and develop faster-growing, structurally attractive businesses with global leadership potential. We are continually optimizing our
portfolio of brands and businesses with an emphasis on opportunities in Beauty, Health Care and selective portfolio and geographic acquisitions inHousehold Care. We will also identify growth opportunities in services, particularly businesses that can be franchised and expanded rapidly.
To achieve our targets, we will also leverage core strengths that create competitive advantages and are critical to winning in the consumer products industry:consumer knowledge, innovation, brand-building, go-to-market capabilities and scale. We are placing particular emphasis on execution, simplification and scaleas key improvement areas that will enable P&G to create the greatest value and competitive advantage. Finally, we are strengthening the depth, breadth andquality of leadership at all levels of the Company to make P&G a more demand-driven, real-time, future-focused organization.
SUMMARY OF 2009 RESULTS
• Net sales decreased 3% to $76.7 billion.
• Organic sales, which exclude the impacts of acquisitions, divestitures and foreign exchange, increased 2%, which is below our organic salesgrowth target range.
• Net earnings increased 11% to $13.4 billion.
• Net earnings from continuing operations decreased 5% to $10.7 billion primarily due to lower net sales and a higher effective tax rate.
• Operating margin declined 20 basis points versus the prior year behind a commodity-driven reduction in gross margins, partially offset byreduced selling, general and administrative expenses (SG&A).
• Net earnings from discontinued operations increased $2.0 billion to $2.8 billion mainly due to the impact of the Folgers coffee divestiture.
• Diluted net earnings per share increased 17% to $4.26.
• Earnings per share included $0.87 from discontinued operations, an increase of $0.63 primarily due to the gain on the sale of the Folgerscoffee business.
• Earnings per share from continuing operations were $3.39, down $0.01 versus the prior fiscal year.
• Earnings per share grew ahead of net earnings due to the impact of share repurchases and the shares tendered in the Folgers coffeetransaction.
• Cash flow from operating activities was $14.9 billion.
• Free cash flow, which is operating cash flow less capital spending, was $11.7 billion.
• Free cash flow productivity, which is the ratio of free cash flow to net earnings, was 87% and included a negative 15% impact resultingfrom the non-cash gain on the Folgers coffee transaction.
FORWARD-LOOKING STATEMENTS
We discuss expectations regarding future performance, events and outcomes, such as our business outlook and objectives, in annual and quarterly reports, pressreleases and other written and oral communications. All such statements, except for historical and present factual information, are “forward-looking statements,”and are based on financial data and our business plans available only as of the time the statements are made, which may become out-of-date or incomplete. Weassume no obligation to update any forward-looking statements as a result of new information, future events or other factors. Forward-looking statements areinherently uncertain and investors must recognize that events could be significantly different from our expectations. For more information on risks that couldimpact our results, refer to Item 1A Risk Factors in our most recent 10-Q, 10-K and 8-K filings.
Ability to Achieve Business Plans. We are a consumer products company and rely on continued demand for our brands and products. To achieve business goals,we must develop and sell products that appeal to consumers and retail trade customers. Our continued success is dependent on leading-edge innovation withrespect to both products and operations and on the continued positive reputations of our brands. This means we must be able to
- 5 -
Source: PROCTER & GAMBLE CO, 8-K, January 29, 2010 Powered by Morningstar® Document Research℠

obtain patents and respond to technological advances and patents granted to competition. Our success is also dependent on effective sales, advertising andmarketing programs in an increasingly fragmented media environment. Our ability to innovate and execute in these areas will determine the extent to which weare able to grow existing sales and volume profitably, especially with respect to the product categories and geographic markets (including developing markets) inwhich we have chosen to focus. There are high levels of competitive activity in the environments in which we operate. To address these challenges, we mustrespond to competitive factors, including pricing, promotional incentives, trade terms and product initiatives. We must manage each of these factors, as well asmaintain mutually beneficial relationships with our key customers, in order to effectively compete and achieve our business plans. As a company that manages aportfolio of consumer brands, our ongoing business model involves a certain level of ongoing acquisition and divestiture activities. We must be able tosuccessfully manage the impacts of these activities, while at the same time delivering against base business objectives. Our success will also depend on ourability to maintain key information technology systems.
Cost Pressures. Our costs are subject to fluctuations, particularly due to changes in commodity prices, raw materials, cost of labor, foreign exchange and interestrates. Therefore, our success is dependent, in part, on our continued ability to manage these fluctuations through pricing actions, cost savings projects, sourcingdecisions and certain hedging transactions. We also must manage our debt and currency exposure, especially in certain countries, such as Venezuela, China andIndia. We need to maintain key manufacturing and supply arrangements, including sole supplier and sole manufacturing plant arrangements. We mustimplement, achieve and sustain cost improvement plans, including our outsourcing projects and those related to general overhead and workforce optimization.Successfully managing these changes, including identifying, developing and retaining key employees, is critical to our success.
Global Economic Conditions. Economic changes, terrorist activity and political unrest may result in business interruption, inflation, deflation or decreaseddemand for our products. Our success will depend, in part, on our ability to manage continued global political and/or economic uncertainty, especially in oursignificant geographic markets, as well as any political or economic disruption due to terrorist and other hostile activities.
Regulatory Environment. Changes in laws, regulations and the related interpretations may alter the environment in which we do business. This includes changesin environmental, competitive and product-related laws, as well as changes in accounting standards and taxation requirements. Our ability to manage regulatory,tax and legal matters (including product liability, patent, intellectual property, competition law matters and tax policy) and to resolve pending legal matters withincurrent estimates may impact our results.
RESULTS OF OPERATIONS
Net Sales
Net sales decreased 3% in 2009 to $76.7 billion behind a 3% decline in unit volume. Unfavorable foreign exchange reduced net sales by 4% as many foreigncurrencies weakened versus the U.S. dollar. Price increases, taken across all segments, primarily to offset higher commodity costs and foreign exchange impacts,added 5% to net sales. Negative product mix reduced net sales by 1% mainly due to disproportionate volume declines in our more discretionary categories andchannels (primarily Prestige, Salon Professional and Braun appliances), along with Personal Health Care, all of which have higher than Company average sellingprices. Every reportable segment except Baby Care and Family Care reported volume declines led by mid-single-digit declines in Grooming and Snacks and PetCare. Volume in both developed and developing regions was below previous year levels. Organic volume, which excludes the impact of acquisitions anddivestitures, declined 2%. Organic sales increased 2% behind the net benefit of pricing and mix. The global economic downturn, credit crisis and price increaseshave contributed to market contractions, trade inventory reductions and share declines in certain businesses, resulting in organic sales below the Company’slong-term financial target range. These impacts were more pronounced in our more discretionary categories and may continue to negatively impact results ofoperations into fiscal 2010.
- 6 -
Source: PROCTER & GAMBLE CO, 8-K, January 29, 2010 Powered by Morningstar® Document Research℠

Net sales increased 9% in 2008 to $79.3 billion behind 4% unit volume growth, a favorable 5% foreign exchange impact and a positive 1% pricing impact.Favorable foreign exchange resulted primarily from the strengthening of European and other currencies relative to the U.S. dollar. Price increases were takenacross a number of our businesses primarily to offset higher commodity costs. Mix had a negative 1% impact on net sales primarily due to disproportionategrowth in developing regions, where selling prices are below the Company average. Each reportable segment posted year-on-year volume growth, withmid-single-digit growth in Fabric Care and Home Care, Baby Care and Family Care, Grooming and Health Care and low single-digit growth in Beauty andSnacks and Pet Care. Each geographic region posted year-on-year volume growth except Western Europe, which was down low single digits due to the impact ofdivestitures. Volume grew primarily behind initiative activity on key brands and continued double-digit growth in developing regions. Organic sales increased5% behind organic volume growth of 5%. Each reportable segment posted year-on-year organic sales and organic volume growth.
Operating Costs
YEARS ENDED JUNE 30
Comparisons as a percentage of net sales 2009
BasisPoint
Change 2008
BasisPoint
Change 2007 Gross margin 49.5% (100) 50.5% (70) 51.2% Selling, general and administrative 29.5% (80) 30.3% (90) 31.2% Operating margin 20.0% (20) 20.2% 20 20.0% Earnings from continuing operations before income taxes 18.8% 0 18.8% (10) 18.9% Net earnings from continuing operations 13.9% (30) 14.2% 90 13.3%
- 7 -
Source: PROCTER & GAMBLE CO, 8-K, January 29, 2010 Powered by Morningstar® Document Research℠
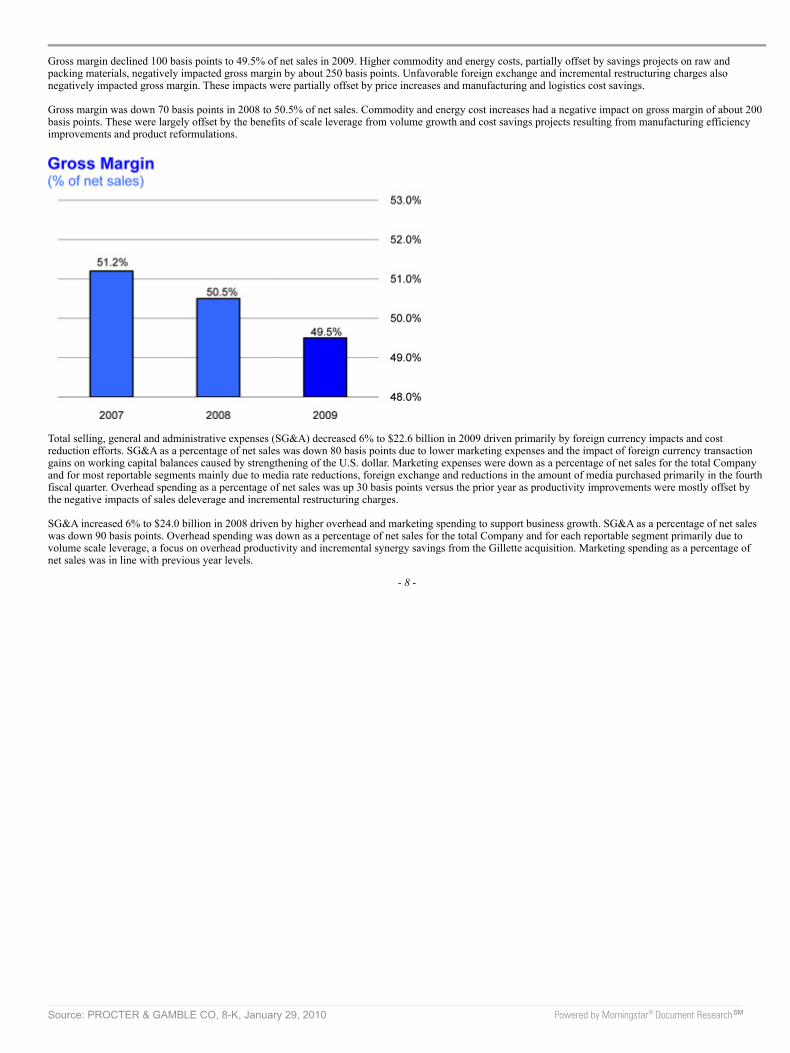
Gross margin declined 100 basis points to 49.5% of net sales in 2009. Higher commodity and energy costs, partially offset by savings projects on raw andpacking materials, negatively impacted gross margin by about 250 basis points. Unfavorable foreign exchange and incremental restructuring charges alsonegatively impacted gross margin. These impacts were partially offset by price increases and manufacturing and logistics cost savings.
Gross margin was down 70 basis points in 2008 to 50.5% of net sales. Commodity and energy cost increases had a negative impact on gross margin of about 200basis points. These were largely offset by the benefits of scale leverage from volume growth and cost savings projects resulting from manufacturing efficiencyimprovements and product reformulations.
Total selling, general and administrative expenses (SG&A) decreased 6% to $22.6 billion in 2009 driven primarily by foreign currency impacts and costreduction efforts. SG&A as a percentage of net sales was down 80 basis points due to lower marketing expenses and the impact of foreign currency transactiongains on working capital balances caused by strengthening of the U.S. dollar. Marketing expenses were down as a percentage of net sales for the total Companyand for most reportable segments mainly due to media rate reductions, foreign exchange and reductions in the amount of media purchased primarily in the fourthfiscal quarter. Overhead spending as a percentage of net sales was up 30 basis points versus the prior year as productivity improvements were mostly offset bythe negative impacts of sales deleverage and incremental restructuring charges.
SG&A increased 6% to $24.0 billion in 2008 driven by higher overhead and marketing spending to support business growth. SG&A as a percentage of net saleswas down 90 basis points. Overhead spending was down as a percentage of net sales for the total Company and for each reportable segment primarily due tovolume scale leverage, a focus on overhead productivity and incremental synergy savings from the Gillette acquisition. Marketing spending as a percentage ofnet sales was in line with previous year levels.
- 8 -
Source: PROCTER & GAMBLE CO, 8-K, January 29, 2010 Powered by Morningstar® Document Research℠

We fund a number of restructuring-type activities primarily related to manufacturing and workforce optimization efforts to maintain a competitive cost structure.We have incurred annual charges of approximately $400 million after tax in recent years. In 2009, we implemented additional restructuring-type activities inorder to offset the dilution caused by the disposition of our coffee business. These incremental charges, which impacted both gross margin and SG&A as apercentage of net sales, reduced operating margin by about 40 basis points in 2009.
Non-Operating Items
Non-operating items primarily include interest expense, divestiture gains and interest and investment income. Interest expense decreased 7% in 2009 to $1.4billion primarily driven by a reduction in U.S. dollar interest rates partially offset by a higher debt level primarily to fund the Company’s previously announcedshare repurchase program. In July 2007, the Company announced plans to repurchase $24 - 30 billion of P&G stock over a three-year period. In 2008, interestexpense increased 13% to $1.5 billion driven by a higher interest rate on our long-term borrowings and a higher debt level to fund the Company’s previouslyannounced share repurchase program.
Other non-operating income increased $24 million in 2009 mainly due to higher divestiture gains from the current year sales of Thermacare, Noxzema, Infusiumand other minor brands. In 2008, other non-operating income decreased $108 million versus the prior year primarily due to lower interest income resulting fromlower interest rates and cash balances. Divestiture gains in 2008 were in line with previous year levels and included the sale of the Western European tissue andJapanese adult incontinence businesses as well as other minor brands.
The effective tax rate from continuing operations in 2009 was up 180 basis points to 25.9% primarily due to a lower level of net favorable adjustments toreserves for previously existing uncertain tax positions and the utilization of tax credits, partially offset by unfavorable geographic mix of earnings across allreporting segments resulting from a weakening of key foreign currencies versus the U.S. dollar. During the current year, net adjustments to reserves for uncertaintax positions benefitted the effective tax rate by 130 basis points, versus a benefit of 340 basis points in 2008. The effective tax rate from continuing operationsdeclined from 29.3% in 2007 to 24.1% in 2008. Approximately 300 basis points of the decline was due to the tax reserve adjustments for previously existinguncertain tax positions. The balance of the decline in 2008 was primarily driven by a more favorable geographic mix of earnings and a reduction in the Germanstatutory tax rate, which reduced our deferred tax liabilities related to acquired intangible assets.
Net Earnings
Net earnings from continuing operations decreased 5% to $10.7 billion in 2009 mainly due to lower net sales and a higher effective tax rate. Operating marginwas down 20 basis points behind a commodity-driven decline in gross margin, partially offset by lower SG&A as a percentage of net sales. Net earnings fromcontinuing operations in 2008 increased 17% to $11.3 billion behind sales growth, a 20-basis point improvement in operating margin and a lower tax rate.Operating margin increased in 2008 due to lower SG&A as a percentage of net sales, which more than offset lower gross margin.
- 9 -
Source: PROCTER & GAMBLE CO, 8-K, January 29, 2010 Powered by Morningstar® Document Research℠

Net earnings from discontinued operations, which includes the results of the coffee and pharmaceuticals businesses, increased $2.0 billion in 2009 primarily dueto a $2.0 billion after-tax gain on the sale of the coffee business in November 2008. The loss of earnings contribution from the coffee business in 2009 wasmostly offset by an increase in earnings of the pharmaceuticals business. In 2008, net earnings from discontinued operations were $784 million, an increase of$106 million over 2007 driven by higher net earnings of the pharmaceuticals business.
Diluted net earnings per share in 2009 increased 17% to $4.26. The increase was due mainly to the gain on the sale of our coffee business, partially offset bylower net earnings from continuing operations. Diluted net earnings per share from continuing operations in 2009 decreased $0.01 to $3.39. Diluted net earningsper share from discontinued operations was $0.87, comprised primarily of the gain on the sale of the coffee business and current year earnings of thepharmaceuticals business. Diluted net earnings per share was positively impacted by fewer shares outstanding as a result of share repurchase activity and sharestendered in the Folgers coffee transaction. Treasury shares in the amount of $6.4 billion were repurchased in 2009, nearly all of which were made under ourpublicly announced share repurchase program.
Diluted net earnings per share in 2008 were up 20% versus the prior year to $3.64 per share, comprised of $3.40 per share from continuing operations and $0.24per share from discontinued operations. Diluted net earnings per share growth exceeded net earnings growth due to share repurchase activity. Treasury shares inthe amount of $10.0 billion were repurchased in 2008, nearly all of which were made under our publicly announced share repurchase program. Gillette wasmodestly accretive to earnings per share results in 2008, compared to dilution of approximately $0.10 - $0.12 per share in 2007. The elimination of Gillettedilution on earnings per share drove approximately 4 percentage points of earnings per share growth in 2008.
SEGMENT RESULTS
Results for the segments reflect information on the same basis we use for internal management reporting and performance evaluation. Within the Beauty andGrooming GBU, we provide data for the Beauty and the Grooming reportable segments. In the Health and Well-Being GBU, we provide data for the Health Careand the Snacks and Pet Care reportable segments. In the Household Care GBU, we provide data for the Fabric Care and Home Care and the Baby Care andFamily Care reportable segments. All references to net earnings throughout the discussion of segment results refer to net earnings from continuing operations.
The results of these reportable business segments do not include certain non-business unit specific costs such as interest expense, investing activities and certainrestructuring costs. These costs are reported in our Corporate segment and are included as part of our Corporate segment discussion. Additionally, as described inNote 11 to
- 10 -
Source: PROCTER & GAMBLE CO, 8-K, January 29, 2010 Powered by Morningstar® Document Research℠

the Consolidated Financial Statements, we have investments in certain companies over which we exert significant influence, but do not control the financial andoperating decisions and, therefore, do not consolidate them for U.S. GAAP purposes (“unconsolidated entities”). Given that certain of these investments aremanaged as integral parts of the Company’s business units, they are accounted for as if they were consolidated subsidiaries for management and segmentreporting purposes. This means pretax earnings in the business units include 100% of each pretax income statement component. In determining after-tax earningsin the business units, we eliminate the share of earnings applicable to other ownership interests, in a manner similar to minority interest, and apply the statutorytax rates. Eliminations to adjust each line item to U.S. GAAP are included in our Corporate segment.
Net Sales Change Drivers vs. Year Ago (2009 vs. 2008)
Volume withAcquisitions &
Divestitures
VolumeExcluding
Acquisitions &Divestitures
ForeignExchange Price Mix/Other
Net SalesGrowth
Beauty and Grooming Beauty -2% -2% -4% 2% 0% -4%Grooming -5% -5% -6% 4% -2% -9%
Health and Well-Being Health Care -3% -3% -5% 3% -2% -7%Snacks and Pet Care -6% -6% -4% 9% -2% -3%
Household Care Fabric Care and Home Care -3% -3% -5% 6% 0% -2%Baby Care and Family Care 1% 2% -4% 5% -1% 1%
Total Company -3% -2% -4% 5% -1% -3%
Sales percentage changes are approximations based on quantitative formulas that are consistently applied.
Beauty and Grooming
Beauty
2009 Change vs.Prior Year 2008
Change vs.Prior Year
Volume n/a -2% n/a +3%Net sales ($ millions) $ 18,924 -4% $ 19,666 +9%Net earnings ($ millions) $ 2,664 -6% $ 2,827 +5%
Beauty net sales decreased 4% in 2009 to $18.9 billion on a 2% decline in unit volume. Price increases to offset higher commodity costs added 2% to net sales.Unfavorable foreign exchange reduced net sales by 4%. Organic sales increased 1% versus the prior year behind price increases. Volume in developed regionsdeclined mid-single digits, while volume in developing regions grew low single digits. Hair Care volume in the retail channel grew low single digits behindgrowth of Pantene, Head & Shoulders and Rejoice. Salon Professional volume declined mid-single digits mainly due to market contractions and trade inventoryreductions. Volume in Female Beauty declined mid-single digits primarily due to competitive activity affecting shipments of Olay and lower shipments ofpersonal cleansing products driven by trade inventory reductions, market contractions and the divestiture of Noxzema. Prestige volume declined high singledigits primarily due to market contractions and trade inventory reductions of prestige fragrances. Our market shares in key categories within Beauty weregenerally consistent with the prior year.
Net earnings decreased 6% in 2009 to $2.7 billion mainly due to lower net sales and reduced net earnings margin. Net earnings margin contracted 30 basis pointsdue to reduced gross margin and a higher effective tax rate, partially offset by reduced SG&A as a percentage of net sales. Gross margin declined due to highercommodity costs, which were only partially offset by price increases and manufacturing cost savings. SG&A was down primarily due to lower marketingspending as a percentage of net sales.
- 11 -
Source: PROCTER & GAMBLE CO, 8-K, January 29, 2010 Powered by Morningstar® Document Research℠
Beauty net sales increased 9% in 2008 to $19.7 billion behind 3% volume growth and 6% of favorable foreign exchange. Volume in developing regions grewhigh single digits, while volume in developed regions was consistent with the prior year. Hair Care volume in retail channels was up mid-single digits, led byhigh single-digit growth in developing regions. Hair Care volume in developed regions was flat as a double-digit volume increase of Head & Shoulders wasoffset by a double-digit volume decline of Pantene in North America. Global market share of retail hair care was in line with the prior year level. SalonProfessional volume declined mid-single digits as growth from color was more than offset by declines in care and styling. Female Beauty volume was up lowsingle digits as initiative-driven growth of female blades and razors, skin care and cosmetic products behind Venus Embrace and Breeze, Olay Definity andRegenerist and Cover Girl Lash Blast Mascara was partially offset by lower shipments of deodorants due to trade inventory reductions and lower promotionalactivity. Our global skin care market share was up slightly, driven primarily by about a 1 point increase in our U.S. market share. Prestige volume was up lowsingle digits and organic volume was up high single digits behind new product launches on Dolce & Gabbana and Hugo Boss. Net earnings in Beauty increased5% to $2.8 billion in 2008 as the impact of higher net sales was partially offset by a lower net earnings margin. Net earnings margin was down 60 basis points aslower gross margin and the impact of base period divestiture gains on minor brands more than offset the benefit of a lower tax rate due to geographic mix. Grossmargin was down due to higher commodity costs, which more than offset the benefit of increased volume scale leverage and manufacturing cost savings projects.SG&A decreased slightly as lower overhead spending as a percentage of net sales was partially offset by higher marketing spending as a percentage of net sales.
Grooming
2009 Change vs.Prior Year 2008
Change vs.Prior Year
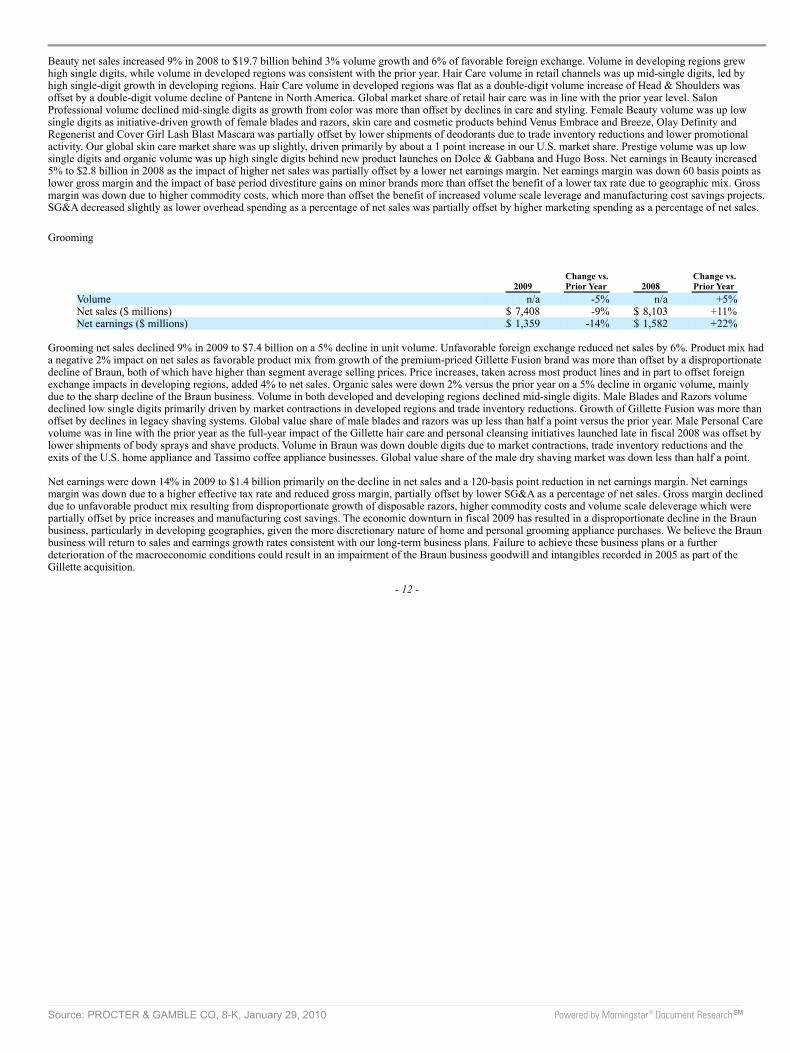
Volume n/a -5% n/a +5%Net sales ($ millions) $ 7,408 -9% $ 8,103 +11%Net earnings ($ millions) $ 1,359 -14% $ 1,582 +22%
Grooming net sales declined 9% in 2009 to $7.4 billion on a 5% decline in unit volume. Unfavorable foreign exchange reduced net sales by 6%. Product mix hada negative 2% impact on net sales as favorable product mix from growth of the premium-priced Gillette Fusion brand was more than offset by a disproportionatedecline of Braun, both of which have higher than segment average selling prices. Price increases, taken across most product lines and in part to offset foreignexchange impacts in developing regions, added 4% to net sales. Organic sales were down 2% versus the prior year on a 5% decline in organic volume, mainlydue to the sharp decline of the Braun business. Volume in both developed and developing regions declined mid-single digits. Male Blades and Razors volumedeclined low single digits primarily driven by market contractions in developed regions and trade inventory reductions. Growth of Gillette Fusion was more thanoffset by declines in legacy shaving systems. Global value share of male blades and razors was up less than half a point versus the prior year. Male Personal Carevolume was in line with the prior year as the full-year impact of the Gillette hair care and personal cleansing initiatives launched late in fiscal 2008 was offset bylower shipments of body sprays and shave products. Volume in Braun was down double digits due to market contractions, trade inventory reductions and theexits of the U.S. home appliance and Tassimo coffee appliance businesses. Global value share of the male dry shaving market was down less than half a point.
Net earnings were down 14% in 2009 to $1.4 billion primarily on the decline in net sales and a 120-basis point reduction in net earnings margin. Net earningsmargin was down due to a higher effective tax rate and reduced gross margin, partially offset by lower SG&A as a percentage of net sales. Gross margin declineddue to unfavorable product mix resulting from disproportionate growth of disposable razors, higher commodity costs and volume scale deleverage which werepartially offset by price increases and manufacturing cost savings. The economic downturn in fiscal 2009 has resulted in a disproportionate decline in the Braunbusiness, particularly in developing geographies, given the more discretionary nature of home and personal grooming appliance purchases. We believe the Braunbusiness will return to sales and earnings growth rates consistent with our long-term business plans. Failure to achieve these business plans or a furtherdeterioration of the macroeconomic conditions could result in an impairment of the Braun business goodwill and intangibles recorded in 2005 as part of theGillette acquisition.
- 12 -
Source: PROCTER & GAMBLE CO, 8-K, January 29, 2010 Powered by Morningstar® Document Research℠

Grooming net sales increased 11% to $8.1 billion in 2008. Net sales were up behind 5% volume growth, a 7% favorable foreign exchange impact and a 1%positive pricing impact driven by price increases on premium shaving systems. Product mix had a negative 2% impact on net sales as positive product mix fromgrowth on the premium-priced Gillette Fusion brand was more than offset by the impact of disproportionate growth in developing regions, where selling pricesare below the segment average. Male Blades and Razors volume increased mid-single digits behind double-digit growth in developing regions driven primarilyby Gillette Fusion expansion and the Prestobarba3 launch. In developed regions, Male Blades and Razors volume was down mid-single digits as double-digitgrowth on Fusion was more than offset by lower shipments of legacy shaving systems. Gillette Fusion delivered more than $1 billion in net sales for 2008. MalePersonal Care volume grew high single digits behind improved retailer support of shave products, the launch of the Gillette hair care and personal cleansinginitiatives and strong growth in developing regions. Braun volume was down mid-single digits primarily due to supply constraints at a contract manufacturer, theannounced exits of certain appliance businesses and the divestiture of the thermometer and blood pressure devices business. Net earnings in Grooming were up22% in 2008 to $1.6 billion behind net sales growth and a 180-basis point earnings margin expansion. Earnings margin improved behind lower SG&A as apercentage of net sales, partially offset by a reduction in gross margin. Gross margin declined due to higher costs incurred at a contract manufacturer on theBraun home appliance business, which more than offset benefits from higher pricing and volume scale leverage. SG&A as a percentage of net sales was downprimarily due to lower overhead spending driven largely by synergies from the integration of Gillette into P&G’s infrastructure.
Health and Well-Being
Health Care
2009 Change vs.Prior Year 2008
Change vs.Prior Year
Volume n/a -3% n/a +6%Net sales ($ millions) $ 11,288 -7% $ 12,087 +10%Net earnings ($ millions) $ 1,835 -9% $ 2,021 +10%
Health Care net sales were down 7% to $11.3 billion in 2009 on a 3% decline in unit volume. Unfavorable foreign exchange reduced net sales by 5%. Negativeproduct mix from disproportionately higher volume declines of Personal Health Care, which have higher than segment average selling prices, reduced net salesby 2%. These negative impacts were partially offset by positive pricing impacts of 3%. Organic sales were down 1% versus fiscal 2008. Volume declinedmid-single digits in developed regions and low single digits in developing regions. Personal Health Care volume was down double digits due to the loss ofmarketplace exclusivity of Prilosec in North America, the impact of a mild cold and flu season on Vicks and the divestiture of Thermacare. All-outlet value shareof the U.S. personal health care market has declined over 2 points, including a double-digit share decline of Prilosec OTC. The impact from the loss of Prilosecexclusivity is expected to continue. Oral Care volume declined low single digits behind trade inventory reductions and market contractions in North America andCEEMEA. Our global market share of oral care was in line with the prior year. Feminine Care volume was down low single digits mainly due to trade inventoryreductions and market contractions in North America and CEEMEA. Our global feminine care market share was down half a point versus the prior year.
Net earnings declined 9% to $1.8 billion in 2009 mainly due to lower net sales. Net earnings margin was down 50 basis points due primarily to lower grossmargin and higher overhead spending as a percentage of net sales, partially offset by a reduction in marketing spending as a percentage of net sales. The declinein gross margin was driven by higher commodity costs, which were partially offset by price increases and manufacturing cost savings.
- 13 -
Source: PROCTER & GAMBLE CO, 8-K, January 29, 2010 Powered by Morningstar® Document Research℠

Health Care net sales increased 10% in 2008 to $12.1 billion behind a 6% increase in unit volume. Foreign exchange had a positive 6% impact on net sales.Disproportionate growth in developing regions, which have selling prices below the segment average, resulted in a negative 2% mix impact. Feminine Carevolume increased mid-single digits and organic volume was up high single digits behind double-digit growth on Naturella and high single-digit growth onAlways, which more than offset a low single-digit decline on Tampax. Our global feminine care market share increased slightly in 2008. Oral Care volume wasup mid-single digits behind initiative-driven growth on Oral-B toothbrushes and Crest. Volume in Personal Health was up double digits behind growth indiagnostics product and the impact of adding the Swiss Precision Diagnostics business, partially offset by lower shipments of Prilosec OTC and PuR. The PuRdecline was from adjustments to a Whirlpool® water filters licensing agreement. Prilosec OTC volume began to decline in the third fiscal quarter of 2008 due tothe loss of marketplace exclusivity and the entry of competing products into the market. This is expected to continue and to have an adverse effect on the resultsof the Health Care segment in future periods. Net earnings in Health Care were up 10% in 2008 to $2.0 billion mainly due to higher net sales. Net earningsmargin was consistent with the prior year as reduced SG&A as a percentage of net sales and a lower tax rate were offset by lower gross margin. Gross marginwas down due to higher commodity costs and a less profitable mix driven primarily by disproportionate growth in developing regions and lower shipments ofPrilosec OTC, which more than offset the benefit of increased volume scale leverage and manufacturing cost savings. SG&A improved behind lower overheadspending as a percentage of net sales due to a focus on productivity improvement and Gillette synergy benefits and lower marketing spending as a percentage ofnet sales behind marketing spending efficiencies.
Snacks and Pet Care
2009 Change vs.Prior Year 2008
Change vs.Prior Year
Volume n/a -6% n/a +3%Net sales ($ millions) $ 3,114 -3% $ 3,204 +7%Net earnings ($ millions) $ 234 -10% $ 261 +7%
Snacks and Pet Care net sales decreased 3% to $3.1 billion in 2009 on a 6% decline in unit volume. Price increases to offset higher commodity costs added 9% tonet sales. Product mix reduced net sales by 2% due to lower shipments of Eukanuba and premium snack products, which have higher than segment averageselling prices. Unfavorable foreign exchange reduced net sales by 4%. Organic sales increased 1%. Snacks volume decreased high single digits due to lowermerchandising support and trade inventory levels, a high base period, which included the Rice Infusion, Extreme Flavors and Stix product launches and marketshare declines following price increases. Our global snacks market share declined about 1 point versus the prior year. Volume in Pet Care declined mid-singledigits mainly due to declines in the premium nutrition business following multiple price increases.
Net earnings in 2009 were down 10% to $234 million on lower net sales and a 60-basis point reduction in net earnings margin. A reduction in gross margin and ahigher effective tax rate each reduced net earnings margin. These impacts were partially offset by lower SG&A as a percentage of net sales. Gross margindeclined due to higher commodity costs, partially offset by higher selling prices and manufacturing cost savings. SG&A as a percentage of net sales declined dueto reductions in both marketing and overhead spending.
Snacks and Pet Care net sales increased 7% to $3.2 billion in 2008. Net sales grew behind a 3% volume increase, a positive 1% price impact resulting from priceincreases in Pet Care and a 4% favorable foreign exchange impact. Product mix had a negative 1% impact on net sales from an increase in Snacks volume, whichhas lower selling prices than the segment average. Snacks volume was up high single digits behind the launch of Rice Infusion in Western Europe and ExtremeFlavors and Pringles Stix in North America. In Pet Care, volume was down low single digits due to negative impacts from the voluntary wet pet food recall in theU.S. in March 2007 that contributed to approximately a 1% decline in our U.S. market share. Net earnings in Snacks and Pet Care were up 7% to $261 million in2008 due to sales growth. Operating margin was consistent with the prior year as
- 14 -
Source: PROCTER & GAMBLE CO, 8-K, January 29, 2010 Powered by Morningstar® Document Research℠

lower gross margin was offset by improved SG&A as a percentage of net sales. Gross margin was down as higher commodity costs across the segment more thanoffset price increases, base period pet food recall impacts and manufacturing cost savings. SG&A decreased as a percentage of net sales due to reductions in bothoverhead and marketing spending as a percentage of net sales.
Household Care
Fabric Care and Home Care
2009 Change vs.Prior Year 2008
Change vs.Prior Year
Volume n/a -3% n/a +6%Net sales ($ millions) $ 23,186 -2% $ 23,714 +11%Net earnings ($ millions) $ 3,032 -11% $ 3,411 +9%
Fabric Care and Home Care net sales were down 2% in 2009 to $23.2 billion on a 3% decline in unit volume. Price increases, taken primarily to offset highercommodity costs, added 6% to net sales, while unfavorable foreign exchange reduced net sales by 5%. Organic sales increased 3%. Fabric Care, Home Care andBatteries unit volume were each down in both developed and developing regions. Volume in Fabric Care declined low single digits due to trade inventoryreductions and net market share declines following price increases. Lower shipments of premium-priced Tide and Ariel were only partially offset by growth ofGain and Downy. Global value share of the fabric care market was down less than half a point behind declines in U.S. all-outlet shares of Tide and Downy,partially offset by share growth of Gain. Home Care volume was down low single digits due to market contractions and trade inventory reductions. Batteriesvolume declined high single digits due to market contractions, trade inventory reductions and competitive activity, which drove a 1-point market share decline ofgeneral purpose batteries.
Net earnings declined 11% to $3.0 billion primarily due to reduced net earnings margin and lower net sales. Net earnings margin contracted 130 basis pointsbehind lower operating margin. Operating margin was down primarily due to a commodity-driven decline in gross margin, which was partially offset by priceincreases and manufacturing cost savings. Lower marketing spending as a percentage of net sales was largely offset by higher overhead spending as a percentageof net sales.
Fabric Care and Home Care net sales in 2008 increased 11% to $23.7 billion. Volume was up 6%, price increases added 1% and favorable foreign exchangeadded 5% to net sales growth. This was partially offset by a negative 1% mix impact primarily from disproportionate growth in developing regions and a shifttoward larger sizes in fabric care, both of which have selling prices below the segment average. Fabric Care volume increased mid-single digits behind highsingle-digit growth in developing regions and mid-single-digit growth in developed regions. Growth was driven by the liquid laundry detergent compactionlaunch in North America and initiative activity on Tide, Gain, Ariel and Downy. Home Care volume was up mid-single digits due to double-digit growth indeveloping regions and high-teens growth on Febreze from the launch of Febreze Candles. Batteries volume was up mid-single digits behind double-digit growthin developing regions and mid-single-digit growth in developed regions. Net earnings in Fabric Care and Home Care increased 9% to $3.4 billion in 2008primarily behind higher net sales. Net earnings margin was down 20 basis points primarily due to lower gross margin, partially offset by a reduction in SG&A asa percentage of net sales. Gross margin was down due to higher commodity costs, which more than offset benefits from pricing, increased volume scale leverageand manufacturing cost savings projects. SG&A improved as a percentage of net sales due to lower overhead spending as a percentage of net sales resulting froma focus on overhead productivity improvements.
Baby Care and Family Care
2009 Change vs.Prior Year 2008
Change vs.Prior Year
Volume n/a +1% n/a +4%Net sales ($ millions) $ 14,103 +1% $ 13,898 +9%Net earnings ($ millions) $ 1,770 +2% $ 1,728 +20%
- 15 -
Source: PROCTER & GAMBLE CO, 8-K, January 29, 2010 Powered by Morningstar® Document Research℠
Baby Care and Family Care net sales increased 1% to $14.1 billion in 2009 on 1% volume growth. Pricing to help recover higher commodity and energy costscontributed 5% to net sales growth. Unfavorable foreign exchange reduced net sales by 4%. Negative product mix from higher shipments of mid-tier brands,which have lower than segment average selling prices, reduced net sales by 1%. Organic sales were up 7% on a 2% increase in organic volume. Volume growthwas driven by low single-digit growth in developing regions, while volume in developed regions was in line with the prior year. Baby Care volume increased lowsingle digits due to growth of Pampers primarily in developing regions and double-digit growth of Luvs in North America. Our global market share of baby carewas up nearly half a point. Family Care volume was down low single digits due to the Western European family care divestiture. Organic volume for FamilyCare was up low single digits behind double-digit growth of Charmin Basic and Bounty Basic. U.S. market share on Bounty was up nearly 1 point, whileCharmin market share remained consistent with the prior year.
Net earnings were up 2% versus the prior year to $1.8 billion due to net sales growth and higher net earnings margin. Net earnings margin increased 10 basispoints as higher gross margin was partially offset by an increase in SG&A as a percentage of net sales and a higher effective tax rate. Gross margin improved dueto the impact of price increases, manufacturing cost savings and more positive product mix following the Western European family care divestiture, which morethan offset higher commodity and energy costs. SG&A as a percentage of net sales increased due to the higher current period overhead spending and base periodreimbursements for services related to the Western European family care divestiture, partially offset by lower marketing spending.
Baby Care and Family Care net sales increased 9% in 2008 to $13.9 billion. Volume was up 4%, including the impact of the Western European family caredivestiture. Price increases contributed 1% to net sales and foreign exchange had a positive 4% impact on net sales. Organic volume and organic sales, whichexclude the impacts of the Western European family care divestiture and foreign exchange, both grew 8%. Organic volume growth was balanced across thesegment with high single-digit growth in both Baby Care and Family Care. Baby Care volume in developed regions was up mid-single digits behind growth onthe Pampers Baby Stages of Development and on the Baby Dry Caterpillar Flex initiative. In developing regions, Baby Care volume was up double digits behindcontinued growth on Pampers. Family Care volume was down low single digits due to the divestiture of the Western European family care business but was uphigh single digits on an organic basis behind the Bounty and Charmin product restages. U.S. market share on both Bounty and Charmin was up over 1 point. Netearnings in Baby Care and Family Care were up 20% to $1.7 billion in 2008 behind higher net sales and earnings margin expansion. Net earnings marginimproved 110 basis points primarily behind higher gross margin and lower SG&A as a percentage of net sales. Gross margin was up due to a more profitableproduct mix following the Western Europe family care divestiture, the benefit of increased volume scale leverage, pricing and manufacturing cost savingsprojects, which more than offset higher commodity and energy costs. SG&A improved as a percentage of net sales due to lower overhead spending as apercentage of net sales, partially offset by higher marketing expenses as a percentage of net sales.
Corporate
Corporate includes certain operating and non-operating activities not allocated to specific business units. These include: the incidental businesses managed at thecorporate level; financing and investing activities; other general corporate items; the historical results of certain divested brands and categories; and certainrestructuring-type activities to maintain a competitive cost structure, including manufacturing and workforce optimization. Corporate also includes reconcilingitems to adjust the accounting policies used in the segments to U.S. GAAP. The most significant reconciling items include income taxes (to adjust from statutoryrates that are reflected in the segments to the overall Company effective tax rate), adjustments for unconsolidated entities (to eliminate sales, cost of products soldand SG&A for entities that are consolidated in the segments but accounted for using the equity method for U.S. GAAP) and minority interest adjustments forsubsidiaries where we do not have 100%
- 16 -
Source: PROCTER & GAMBLE CO, 8-K, January 29, 2010 Powered by Morningstar® Document Research℠

ownership. Since certain unconsolidated entities and less than 100%-owned subsidiaries are managed as integral parts of the Company, they are accounted forsimilar to a wholly owned subsidiary for management and segment purposes. This means our segment results recognize 100% of each income statementcomponent through before-tax earnings in the segments, with eliminations for unconsolidated entities in Corporate. In determining segment after-tax netearnings, we apply the statutory tax rates (with adjustments to arrive at the Company’s effective tax rate in Corporate) and eliminate the share of earningsapplicable to other ownership interests, in a manner similar to minority interest.
Corporate net sales primarily reflect the adjustment to eliminate the sales of unconsolidated entities included in business segment results. Accordingly, Corporatenet sales is generally a negative balance. Negative net sales in Corporate declined $86 million in 2009 primarily driven by lower adjustments to eliminate thesesales. These adjustments decreased due to lower net sales of existing unconsolidated entities. Net expenses from continuing operations decreased $325 million to$214 million. The decrease was primarily due to corporate hedging impacts, lower interest expense and higher current period divestiture gains, partially offset byhigher restructuring spending. These items are discussed in more detail in the Results of Operations section.
In 2008, negative net sales increased $474 million in Corporate primarily driven by higher adjustments to eliminate the impact of joint venture net sales forunconsolidated entities. These adjustments increased due to sales growth of existing unconsolidated entities and the addition of the Swiss Precision Diagnosticsbusiness. Net expenses in Corporate decreased $434 million in 2008. The decrease was driven primarily by a lower tax rate resulting from the net benefits ofadjustments to reserves for uncertain tax positions.
FINANCIAL CONDITION
We believe our financial condition continues to be of high quality, as evidenced by our ability to generate substantial cash from operations and ready access tocapital markets at competitive rates.
Operating cash flow provides the primary source of funds to finance operating needs and capital expenditures. Excess operating cash is used first to fundshareholder dividends. Other discretionary uses include share repurchases and “tack-on” acquisitions to complement our portfolio of brands and geographies. Asnecessary, we may supplement operating cash flow with debt to fund these activities. The overall cash position of the Company reflects our strong businessresults and a global cash management strategy that takes into account liquidity management, economic factors and tax considerations.
Operating Activities
Operating cash flow was $14.9 billion in 2009, a decrease of 1% versus the prior year total of $15.0 billion. Operating cash flow resulted primarily from netearnings adjusted for non-cash items (depreciation and amortization, stock-based compensation, deferred income taxes and gain on the sale of businesses). Thecombination of net earnings and non-cash items provided $15.3 billion of operating cash as compared to $16.7 billion in the prior year. The decrease in operatingcash flow versus 2008 was primarily due to a decline in net earnings from continuing operations. A net decrease in working capital also added to cash flow in thecurrent year as lower accounts receivable and inventory balances were partially offset by a decline in accounts payable. The decrease in working capital wasprimarily due to the impact of lower net sales and our ability to adequately adjust production to better meet unit volume requirements. Accounts receivable daysdeclined primarily due to improved collection efforts. Inventory and accounts payable days declined due in part to the optimization of our manufacturing processand inventory levels and a moderation of commodity costs late in the year. Other operating assets and liabilities reduced cash flow primarily due to changes inpostretirement benefit plans. Cash flow from discontinued operations contributed $662 million to operating cash flow.
In 2008, operating cash flow increased 12% over the prior year to $15.0 billion. Both operating cash flow and the increase in operating cash flow over the prioryear resulted primarily from higher net earnings and non-cash charges (depreciation and amortization, stock-based compensation, deferred income taxes and gainon the sale of businesses). Working capital balances increased primarily to support business growth resulting in a net use of cash. Cash flow from discontinuedoperations contributed $762 million to operating cash flow.
- 17 -
Source: PROCTER & GAMBLE CO, 8-K, January 29, 2010 Powered by Morningstar® Document Research℠

Free Cash Flow. We view free cash flow as an important measure because it is one factor impacting the amount of cash available for dividends and discretionaryinvestment. It is defined as operating cash flow less capital expenditures and is one of the measures used to evaluate senior management and determine theirat-risk compensation. Free cash flow was $11.7 billion in 2009, compared to $12.0 billion in 2008. Free cash flow decreased as a result of higher capital spendingand lower operating cash flow. Free cash flow productivity, defined as the ratio of free cash flow to net earnings, was 87% in 2009. This is below our 90% targetprimarily due to the gain on the Folgers coffee transaction which lowered productivity by approximately 15% because the gain is included in net earnings but hadno impact on operating cash flow.
In 2008, free cash flow was $12.0 billion, compared to $10.5 billion in 2007. Free cash flow increased primarily as a result of higher operating cash flow. Capitalexpenditures were $3.0 billion and 3.8% of net sales. Free cash flow productivity was 99% in 2008, ahead of our 90% target.
Investing Activities
Net investing activities used $2.4 billion of cash in 2009 and $2.5 billion in 2008 mainly due to capital spending. Discontinued operations contributed $69million to cash from investing activities in 2009 and consumed $8 million in 2008.
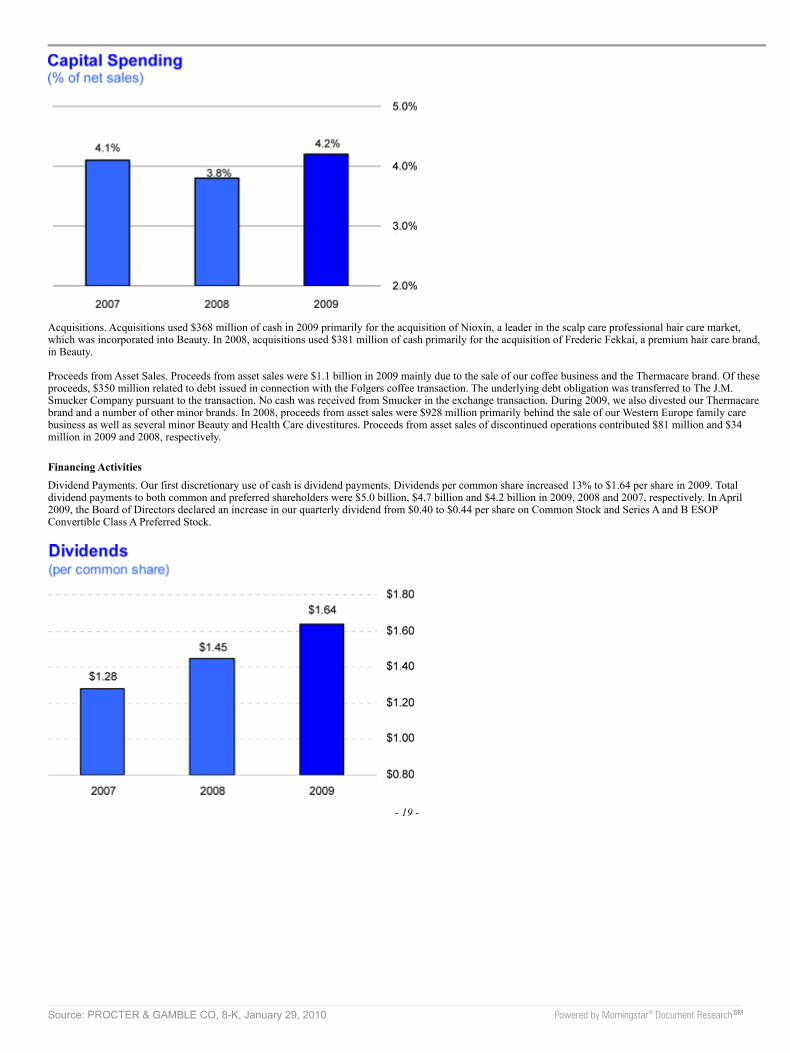
Capital Spending. We view capital spending efficiency as a critical component of our overall cash management strategy. Capital expenditures in 2009 were $3.2billion, compared to $3.0 billion in 2008. Capital spending as a percentage of net sales was 4.2% in 2009, compared to 3.8% in 2008, as we continued to makeinvestments to support capacity, innovation and cost savings. Capital spending for our discontinued coffee and pharmaceuticals businesses was $11 million and$42 million in 2009 and 2008, respectively.
- 18 -
Source: PROCTER & GAMBLE CO, 8-K, January 29, 2010 Powered by Morningstar® Document Research℠
Acquisitions. Acquisitions used $368 million of cash in 2009 primarily for the acquisition of Nioxin, a leader in the scalp care professional hair care market,which was incorporated into Beauty. In 2008, acquisitions used $381 million of cash primarily for the acquisition of Frederic Fekkai, a premium hair care brand,in Beauty.
Proceeds from Asset Sales. Proceeds from asset sales were $1.1 billion in 2009 mainly due to the sale of our coffee business and the Thermacare brand. Of theseproceeds, $350 million related to debt issued in connection with the Folgers coffee transaction. The underlying debt obligation was transferred to The J.M.Smucker Company pursuant to the transaction. No cash was received from Smucker in the exchange transaction. During 2009, we also divested our Thermacarebrand and a number of other minor brands. In 2008, proceeds from asset sales were $928 million primarily behind the sale of our Western Europe family carebusiness as well as several minor Beauty and Health Care divestitures. Proceeds from asset sales of discontinued operations contributed $81 million and $34million in 2009 and 2008, respectively.
Financing Activities
Dividend Payments. Our first discretionary use of cash is dividend payments. Dividends per common share increased 13% to $1.64 per share in 2009. Totaldividend payments to both common and preferred shareholders were $5.0 billion, $4.7 billion and $4.2 billion in 2009, 2008 and 2007, respectively. In April2009, the Board of Directors declared an increase in our quarterly dividend from $0.40 to $0.44 per share on Common Stock and Series A and B ESOPConvertible Class A Preferred Stock.
- 19 -
Source: PROCTER & GAMBLE CO, 8-K, January 29, 2010 Powered by Morningstar® Document Research℠

Long-Term and Short-Term Debt. We maintain debt levels we consider appropriate after evaluating a number of factors, including cash flow expectations, cashrequirements for ongoing operations, investment and financing plans (including acquisitions and share repurchase activities) and the overall cost of capital. Totaldebt was $37.0 billion in 2009, $36.7 billion in 2008 and $35.4 billion in 2007. Debt increased in 2009 and 2008 primarily to fund our share repurchase plandiscussed below.
Treasury Purchases. In 2007, we began to acquire $24 - 30 billion of our outstanding shares under a publicly announced three-year share repurchase plan. Todate, we have acquired $16.3 billion of shares under this repurchase plan. Total share repurchases were $6.4 billion in 2009 and $10.0 billion in 2008, nearly allof which were made under our publicly announced share repurchase plan. Total share repurchases under the publicly announced plan may be below theannounced range due to lower earnings growth in fiscal 2009 and 2010 versus expectations at the time the plan was publicly announced.
In November 2008, we completed the divestiture of our Folgers coffee subsidiary. In connection with this divestiture, 38.7 million shares of P&G common stockwere tendered by shareholders and exchanged for all shares of Folgers common stock, resulting in an increase of treasury stock of $2.5 billion.
Liquidity
Our current liabilities exceeded current assets by $9.0 billion, driven by our short-term debt position. We utilize short- and long-term debt to fund discretionaryitems such as acquisitions and share repurchases. We anticipate being able to support our short-term liquidity and operating needs largely through cash generatedfrom operations. We have strong short- and long-term debt ratings which despite the current credit crisis have enabled and should continue to enable us torefinance our debt as it becomes due at favorable rates in commercial paper and bond markets. In addition, we have agreements with a diverse group of financialinstitutions that, if needed, should provide sufficient credit funding to meet short-term financing requirements.
On June 30, 2009, our short-term credit ratings from Moody’s and Standard & Poor’s (S&P) are P-1 and A-1+, respectively. Our Moody’s and S&P long-termcredit ratings are Aa3 with a negative outlook and AA- with a stable outlook, respectively.
We maintain three bank credit facilities: a $6 billion 5-year facility expiring in August 2012, a $3 billion 5-year facility expiring in August 2012 and a $1.8billion 364-day facility expiring in June 2010. The credit facilities are in place to support our ongoing commercial paper program. The two 5-year facilities canbe extended for certain periods of time as specified in, and in accordance with, the terms of each of these credit agreements. We anticipate that these facilitieswill remain largely undrawn for the foreseeable future. These credit facilities do not have cross-default or ratings triggers, nor do they have material adverseevents clauses, except at the time of signing. In addition to these credit facilities, we have an automatically effective registration statement on Form S-3 filed withthe SEC that is available for registered offerings of short- or long-term debt securities.
Guarantees and Other Off-Balance Sheet Arrangements
We do not have guarantees or other off-balance sheet financing arrangements, including variable interest entities, which we believe could have a material impacton financial condition or liquidity.
Contractual Commitments
The following table provides information on the amount and payable date of our contractual commitments as of June 30, 2009.
($ millions) Total Less Than
1 Year 1-3 Years 3-5 Years After 5Years
Recorded liabilities Total debt $ 36,631 $ 16,270 $ 1,438 $ 6,091 $ 12,832Capital leases 392 46 84 76 186Unrecognized tax benefit(1)
— — — — — Other Interest payments relating to long-term debt 12,616 1,183 2,469 1,788 7,176Operating leases(2)
1,620 305 495 378 442Minimum pension funding(3)
1,499 616 883 — — Purchase obligations(4)
3,897 1,258 1,659 681 299
Total Contractual Commitments 56,655 19,678 7,028 9,014 20,935
- 20 -
Source: PROCTER & GAMBLE CO, 8-K, January 29, 2010 Powered by Morningstar® Document Research℠

(1) As of June 30, 2009, the Company’s Consolidated Balance Sheet reflects a liability for unrecognized tax benefits of $2.7 billion, including $736 of interestand penalties. Due to the high degree of uncertainty regarding the timing of future cash outflows of liabilities for unrecognized tax benefits, a reasonableestimate of the period of cash settlement beyond the balance sheet date of June 30, 2009, can not be made.
(2) Operating lease obligations are shown net of guaranteed sublease income.(3) Represents future pension payments to comply with local funding requirements. The projected payments beyond fiscal year 2012 are not currently
determinable.(4) Primarily reflects future contractual payments under various take-or-pay arrangements entered into as part of the normal course of business. Commitments
made under take-or-pay obligations represent future purchases in line with expected usage to obtain favorable pricing. Approximately 43% relates toservice contracts for information technology, human resources management and facilities management activities that have been outsourced. While theamounts listed represent contractual obligations, we do not believe it is likely that the full contractual amount would be paid if the underlying contractswere canceled prior to maturity. In such cases, we generally are able to negotiate new contracts or cancellation penalties, resulting in a reduced payment.The amounts do not include obligations related to other contractual purchase obligations that are not take-or-pay arrangements. Such contractual purchaseobligations are primarily purchase orders at fair value that are part of normal operations and are reflected in historical operating cash flow trends. We donot believe such purchase obligations will adversely affect our liquidity position.
SIGNIFICANT ACCOUNTING POLICIES AND ESTIMATES
In preparing our financial statements in accordance with U.S. GAAP, there are certain accounting policies that are particularly important. These include revenuerecognition, income taxes, certain employee benefits, acquisitions and goodwill and intangible assets. We believe these accounting policies, and others set forthin Note 1 to the Consolidated Financial Statements, should be reviewed as they are integral to understanding the results of operations and financial condition ofthe Company. In the case of revenue recognition, these policies simply represent required accounting and there is minimal judgment or estimation involved. Inother areas, they may represent a choice between acceptable accounting methods or may require substantial judgment or estimation in their application.
Due to the nature of our business, these estimates generally are not considered highly uncertain at the time of estimation. Accordingly, they are not expected toresult in changes that would materially affect our financial condition, results of operations or cash flows in any given year. However, for ongoing impairmenttesting of goodwill and intangible valuations, significant changes in the underlying assumptions used in the valuation models, including discount and tax rates orfuture cash flow projections, versus those anticipated at the time of the initial valuations, could result in impairment charges that could materially affect thefinancial statements in any given year.
The Company has discussed the selection of significant accounting policies and the effect of estimates with the Audit Committee of the Company’s Board ofDirectors.
Revenue Recognition
Most of our revenue transactions represent sales of inventory. We recognize revenue when title, ownership and risk of loss transfer to the customer, which can beon the date of shipment or the date of receipt by the customer. The revenue recorded is presented net of sales and other taxes we collect on behalf ofgovernmental authorities and includes shipping and handling costs, which generally are included in the list price to the customer. A provision for paymentdiscounts and product return allowances is recorded as a reduction of sales within the same period that the revenue is recognized. We offer sales incentives tocustomers and consumers through various programs, consisting primarily of customer pricing allowances, merchandising funds and consumer coupons. The costof these programs is recognized as incurred and recorded as a reduction of sales. Given the nature of our business, revenue recognition practices do not containestimates that materially affect results of operations.
- 21 -
Source: PROCTER & GAMBLE CO, 8-K, January 29, 2010 Powered by Morningstar® Document Research℠

Income Taxes
Our annual tax rate is determined based on our income, statutory tax rates and the tax impacts of items treated differently for tax purposes than for financialreporting purposes. Tax law requires certain items to be included in the tax return at different times than the items are reflected in the financial statements. Someof these differences are permanent, such as expenses that are not deductible in our tax return, and some differences are temporary, reversing over time, such asdepreciation expense. These temporary differences create deferred tax assets and liabilities.
Deferred tax assets generally represent the tax effect of items that can be used as a tax deduction or credit in future years for which we have already recorded thetax benefit in our income statement. Deferred tax liabilities generally represent tax expense recognized in our financial statements for which payment has beendeferred, or the tax effect of expenditures for which a deduction has already been taken in our tax return but has not yet been recognized in our financialstatements or assets recorded at fair value in business combinations for which there was no corresponding tax basis adjustment.
Inherent in determining our annual tax rate are judgments regarding business plans, planning opportunities and expectations about future outcomes. Realizationof certain deferred tax assets is dependent upon generating sufficient taxable income in the appropriate jurisdiction prior to the expiration of the carry-forwardperiods. Although realization is not assured, management believes it is more likely than not that our deferred tax assets, net of valuation allowances, will berealized.
We operate in multiple jurisdictions with complex regulatory environments subject to different interpretations by the taxpayer and respective governmentaltaxing authorities. In certain of these jurisdictions we may take positions that management believes are supportable, but are potentially subject to successfulchallenge by the applicable taxing authority. We evaluate our tax positions and establish liabilities in accordance with the applicable accounting guidance onuncertainty in income taxes. We review these tax uncertainties in light of the changing facts and circumstances, such as the progress of tax audits, and adjustthem accordingly. We have a number of audits in process in various jurisdictions. Although the resolution of these tax positions is uncertain, based on currentlyavailable information, we believe that the ultimate outcomes will not have a material adverse effect on our financial position, results of operations or cash flows.
Because there are a number of estimates and assumptions inherent in calculating the various components of our tax provision, certain changes or future eventssuch as changes in tax legislation, geographic mix of earnings, completion of tax audits or earnings repatriation plans could have an impact on those estimatesand our effective tax rate.
Employee Benefits
We sponsor various post-employment benefits throughout the world. These include pension plans, both defined contribution plans and defined benefit plans, andother post-employment benefit (OPEB) plans, consisting primarily of health care and life insurance for retirees. For accounting purposes, the defined benefit andOPEB plans require assumptions to estimate the projected and accumulated benefit obligations, including the following variables: discount rate; expected salaryincreases; certain employee-related factors, such as turnover, retirement age and mortality; expected return on assets and health care cost trend rates. These andother assumptions affect the annual expense and obligations recognized for the underlying plans. Our assumptions reflect our historical experiences andmanagement’s best judgment regarding future expectations. In accordance with U.S. GAAP, the net amount by which actual results differ from our assumptionsis deferred. If this net deferred amount exceeds 10% of the greater of plan assets or liabilities, a portion of the deferred amount is included in expense for thefollowing year. The cost or benefit of plan changes, such as increasing or decreasing benefits for prior employee service (prior service cost), is deferred andincluded in expense on a straight-line basis over the average remaining service period of the employees expected to receive benefits.
The expected return on plan assets assumption is important, since many of our defined benefit plans and our primary OPEB plan are funded. The process forsetting the expected rates of return is described in Note 8 to the Consolidated Financial Statements. For 2009, the average return on assets assumptions forpension plan assets and OPEB assets were 7.4% and 9.3%, respectively. A change in the rate of return of 0.5% for both pension and OPEB assets would impactannual benefit expense by less than $40 million after tax.
- 22 -
Source: PROCTER & GAMBLE CO, 8-K, January 29, 2010 Powered by Morningstar® Document Research℠
Since pension and OPEB liabilities are measured on a discounted basis, the discount rate is a significant assumption. Discount rates used for our U.S. definedbenefit and OPEB plans are based on a yield curve constructed from a portfolio of high quality bonds for which the timing and amount of cash outflowsapproximate the estimated payouts of the plan. For our international plans, the discount rates are set by benchmarking against investment grade corporate bondsrated AA or better. The average discount rate on the defined benefit pension plans of 6.0% represents a weighted average of local rates in countries where suchplans exist. A 0.5% change in the discount rate would impact annual after-tax defined benefit pension expense by less than $50 million. The average discountrate on the OPEB plan of 6.4% reflects the higher interest rates generally applicable in the U.S., which is where a majority of the plan participants receivebenefits. A 0.5% change in the discount rate would impact annual after-tax OPEB expense by less than $20 million.
Certain defined contribution pension and OPEB benefits in the U.S. are funded by the Employee Stock Ownership Plan (ESOP), as discussed in Note 8 to theConsolidated Financial Statements.
Acquisitions
We account for acquired businesses using the purchase method of accounting. Under the purchase method, our Consolidated Financial Statements reflect theoperations of an acquired business starting from the completion of the acquisition. In addition, the assets acquired and liabilities assumed must be recorded at thedate of acquisition at their respective estimated fair values, with any excess of the purchase price over the estimated fair values of the net assets acquired recordedas goodwill.
Significant judgment is required in estimating the fair value of intangible assets and in assigning their respective useful lives. Accordingly, we typically obtainthe assistance of third-party valuation specialists for significant items. The fair value estimates are based on available historical information and on futureexpectations and assumptions deemed reasonable by management, but are inherently uncertain.
We typically use an income method to estimate the fair value of intangible assets, which is based on forecasts of the expected future cash flows attributable to therespective assets. Significant estimates and assumptions inherent in the valuations reflect a consideration of other marketplace participants, and include theamount and timing of future cash flows (including expected growth rates and profitability), the underlying product or technology life cycles, economic barriers toentry, a brand’s relative market position and the discount rate applied to the cash flows. Unanticipated market or macroeconomic events and circumstances mayoccur, which could affect the accuracy or validity of the estimates and assumptions.
Determining the useful life of an intangible asset also requires judgment. Certain brand intangibles are expected to have indefinite lives based on their history andour plans to continue to support and build the acquired brands. Other acquired brands are expected to have determinable useful lives. Our assessment as to brandsthat have an indefinite life and those that have a determinable life is based on a number of factors including competitive environment, market share, brandhistory, underlying product life cycles, operating plans and the macroeconomic environment of the countries in which the brands are sold. Our estimates of theuseful lives of determinable-lived intangibles, primarily including brands, technologies and customer relationships, are primarily based on these same factors. Allof our acquired technology and customer-related intangibles are expected to have determinable useful lives.
Other significant estimates associated with the accounting for acquisitions include exit costs. Provided certain criteria are met, exit costs related to acquiredoperations are treated as assumed liabilities. If those criteria are not met, the costs are treated as operating expenses of the combined company as incurred. Exitcosts, consisting primarily of severance costs, facility closure and other exit costs related to redundant manufacturing, selling, general and administrativefunctions, are based upon plans that have been committed to by management but which are subject to refinement. Significant estimates and assumptions inherentin the calculation of exit costs relate to the number of employees that will be terminated, future costs to operate and eventually vacate duplicate
- 23 -
Source: PROCTER & GAMBLE CO, 8-K, January 29, 2010 Powered by Morningstar® Document Research℠

facilities and costs to terminate agreements. These estimates and assumptions may change as we execute approved plans. Decreases to the estimated costs aregenerally recorded as an adjustment to goodwill. Increases to the estimates are generally recorded as an adjustment to goodwill during the purchase priceallocation period (generally within one year of the acquisition date) and as operating expenses thereafter. For acquisitions closed after June 30, 2009, exit costswill no longer be treated as acquired liabilities. Rather, they will be charged to expense as incurred post acquisition in accordance with the applicable newaccounting guidance (see discussion of the new business combinations accounting guidance in the New Accounting Pronouncements section below).
Goodwill and Intangible Assets
Acquired intangible assets may represent indefinite-lived assets (e.g., certain trademarks or brands), determinable-lived intangibles (e.g., certain trademarks orbrands, customer relationships, patents and technologies) or residual goodwill. Of these, only the costs of determinable-lived intangibles are amortized to expenseover their estimated life. The value of indefinite-lived intangible assets and residual goodwill is not amortized, but is tested at least annually for impairment. Ourimpairment testing for goodwill is performed separately from our impairment testing of indefinite-lived intangibles. We test goodwill for impairment, at leastannually, by reviewing the book value compared to the fair value at the reportable unit level. We test individual indefinite-lived intangibles at least annually byreviewing the individual book values compared to the fair value. We determine the fair value of our reporting units based on the income approach. Under theincome approach, we calculate the fair value of our reporting units based on the present value of estimated future cash flows. Considerable managementjudgment is necessary to evaluate the impact of operating and macroeconomic changes and to estimate future cash flows to measure fair value. Assumptions usedin our impairment evaluations, such as forecasted growth rates and cost of capital, are consistent with internal projections and operating plans. We believe suchassumptions and estimates are also comparable to those that would be used by other marketplace participants. When certain events or changes in operatingconditions occur, indefinite-lived intangible assets may be reclassified to a determinable life asset and an additional impairment assessment may be performed.We did not recognize any material impairment charges for goodwill or intangible assets during the years presented.
Our annual impairment testing for both goodwill and indefinite-lived intangible assets indicated that all reporting units and intangible assets fair values exceededtheir respective recorded values. However, future changes in the judgments, assumptions and estimates that are used in our impairment testing for goodwill andindefinite-lived intangible assets, including discount and tax rates or future cash flow projections, could result in significantly different estimates of the fairvalues, which could result in impairment charges that could materially affect the financial statements in any given year. The recorded value of goodwill andintangible assets from recently acquired businesses are derived from more recent business operating plans and macroeconomic environmental conditions andtherefore are more susceptible to an adverse change that could require an impairment charge. For example, because the Gillette intangible and goodwill amountsrepresent current values as of the relatively recent acquisition date, such amounts are more susceptible to an impairment risk if business operating results ormacroeconomic conditions deteriorate. Gillette indefinite-lived intangible assets represent approximately 89% of the $26.9 billion of indefinite-lived intangibleassets at June 30, 2009. Goodwill allocated to reporting units consisting entirely of businesses purchased as part of the Gillette acquisition (Blades and Razors,Braun, Batteries) represents 47% of the $56.5 billion of goodwill at June 30, 2009. With the exception of our Braun business, all of our other reporting units havefair values that significantly exceed recorded values. While the fair value of our Braun business exceeds its carrying value, which includes goodwill andindefinite-lived intangibles of $2.4 billion, the economic downturn in 2009 has resulted in a disproportionate decline in that business in developing geographiesgiven the more discretionary nature of home and personal grooming appliances purchases. Our valuation of the Braun business has it returning to sales andearnings growth rates consistent with our long-term business plans. Failure to achieve these business plans or a further deterioration of the macroeconomicconditions could result in a valuation that would trigger an impairment of the Braun business goodwill and intangibles.
New Accounting Pronouncements
On July 1, 2008, we adopted new accounting guidance on fair value measurements. This new guidance defines fair value, establishes a framework for measuringfair value in generally accepted accounting principles and expands disclosures about fair value measurements. The new guidance was effective for the Companybeginning
- 24 -
Source: PROCTER & GAMBLE CO, 8-K, January 29, 2010 Powered by Morningstar® Document Research℠

July 1, 2008, for certain financial assets and liabilities. Refer to Note 5 for additional information regarding our fair value measurements for financial assets andliabilities. The new guidance is effective for non-financial assets and liabilities recognized or disclosed at fair value on a non-recurring basis beginning July 1,2009.
On January 1, 2009, we adopted new accounting guidance on disclosures about derivative instruments and hedging activities. The new guidance impactsdisclosures only and requires additional qualitative and quantitative information on the use of derivatives and their impact on an entity’s financial position, resultsof operations and cash flows. Refer to Note 5 for additional information regarding our risk management activities, including derivative instruments and hedgingactivities.
On July 1, 2009, we adopted new accounting guidance on business combinations and noncontrolling interests in consolidated financial statements. The newguidance revises the method of accounting for a number of aspects of business combinations and noncontrolling interests, including acquisition costs,contingencies (including contingent assets, contingent liabilities and contingent purchase price), the impacts of partial and step-acquisitions (including thevaluation of net assets attributable to non-acquired minority interests), and post acquisition exit activities of acquired businesses.
No other new accounting pronouncement issued or effective during the fiscal year has had or is expected to have a material impact on the Consolidated FinancialStatements.
OTHER INFORMATION
Hedging and Derivative Financial Instruments
As a multinational company with diverse product offerings, we are exposed to market risks, such as changes in interest rates, currency exchange rates andcommodity prices. We evaluate exposures on a centralized basis to take advantage of natural exposure netting and correlation. To the extent we choose tomanage volatility associated with the net exposures, we enter into various financial transactions which we account for using the applicable accounting guidancefor derivative instruments and hedging activities. These financial transactions are governed by our policies covering acceptable counterparty exposure,instrument types and other hedging practices. Note 5 to the Consolidated Financial Statements includes a detailed discussion of our accounting policies forfinancial instruments.
Derivative positions are monitored using techniques including market valuation, sensitivity analysis and value-at-risk modeling. The tests for interest rate,currency rate and commodity price exposures discussed below are based on the CorporateManager ™ value-at-risk model using a one-year horizon and a 95%confidence level. The model incorporates the impact of correlation (the degree to which exposures move together over time) and diversification (from holdingmultiple currency, commodity and interest rate instruments) and assumes that financial returns are normally distributed. Estimates of volatility and correlations ofmarket factors are drawn from the RiskMetrics™ dataset as of June 30, 2009. In cases where data is unavailable in RiskMetrics™, a reasonable proxy isincluded.
Our market risk exposures relative to interest rates, currency rates and commodity prices, as discussed below, have not changed materially versus the previousreporting period. In addition, we are not aware of any facts or circumstances that would significantly impact such exposures in the near term.
Interest Rate Exposure on Financial Instruments. Interest rate swaps are used to hedge exposures to interest rate movement on underlying debt obligations.Certain interest rate swaps denominated in foreign currencies are designated to hedge exposures to currency exchange rate movements on our investments inforeign operations. These currency interest rate swaps are designated as hedges of the Company’s foreign net investments.
Based on our overall interest rate exposure as of and during the year ended June 30, 2009, including derivative and other instruments sensitive to interest rates,we believe a near-term change in interest rates, at a 95% confidence level based on historical interest rate movements, would not materially affect our financialstatements.
- 25 -
Source: PROCTER & GAMBLE CO, 8-K, January 29, 2010 Powered by Morningstar® Document Research℠

Currency Rate Exposure on Financial Instruments. Because we manufacture and sell products in a number of countries throughout the world, we are exposed tothe impact on revenue and expenses of movements in currency exchange rates. The primary purpose of our currency hedging activities is to reduce the risk thatour financial position will be adversely affected by short-term changes in exchange rates. Corporate policy prescribes the range of allowable hedging activity. Weprimarily use forward contracts with maturities of less than 18 months. In addition, we enter into certain currency swaps with maturities of up to five years tohedge our exposure to exchange rate movements on intercompany financing transactions.
Based on our overall currency rate exposure as of and during the year ended June 30, 2009, we believe, at a 95% confidence level based on historical currencyrate movements, the impact of a near-term change in currency rates on derivative and other instruments would not materially affect our financial statements.
Commodity Price Exposure on Financial Instruments. We use raw materials that are subject to price volatility caused by weather, supply conditions, political andeconomic variables and other unpredictable factors. In addition to fixed price contracts, we use futures, options and swap contracts to manage the volatilityrelated to the above exposures.
Based on our overall commodity price exposure as of and during the year ended June 30, 2009, we believe, at a 95% confidence level based on historicalcommodity price movements, the impact of a near-term change in commodity prices on derivative and other instruments would not materially affect our financialstatements.
Measures Not Defined By U.S. GAAP
Our discussion of financial results includes several “non-GAAP” financial measures. We believe these measures provide our investors with additionalinformation about our underlying results and trends, as well as insight to some of the metrics used to evaluate management. When used in MD&A, we haveprovided the comparable GAAP measure in the discussion. These measures include:
Organic Sales Growth. Organic sales growth measures sales growth excluding the impacts of foreign exchange, acquisitions and divestitures from year-over-yearcomparisons. We believe this provides investors with a more complete understanding of underlying results and trends by providing sales growth on a consistentbasis.
The following tables provide a numerical reconciliation of organic sales growth to reported net sales growth:
FY 2009
NetSales
Growth
ForeignExchange
Impact
Acquisition/Divestiture
Impact
OrganicSales
GrowthBeauty -4% 4% 1% 1%Grooming -9% 6% 1% -2%Health Care -7% 5% 1% -1%Snacks and Pet Care -3% 4% 0% 1%Fabric Care and Home Care -2% 5% 0% 3%Baby Care and Family Care 1% 4% 2% 7%
Total P&G -3% 4% 1% 2%
FY 2008
NetSales
Growth
ForeignExchange
Impact
Acquisition/Divestiture
Impact
OrganicSales
GrowthBeauty 9% -6% 1% 4%Grooming 11% -7% 0% 4%Health Care 10% -6% -1% 3%Snacks and Pet Care 7% -4% 0% 3%Fabric Care and Home Care 11% -5% 0% 6%Baby Care and Family Care 9% -4% 3% 8%
Total P&G 9% -5% 1% 5%
- 26 -
Source: PROCTER & GAMBLE CO, 8-K, January 29, 2010 Powered by Morningstar® Document Research℠
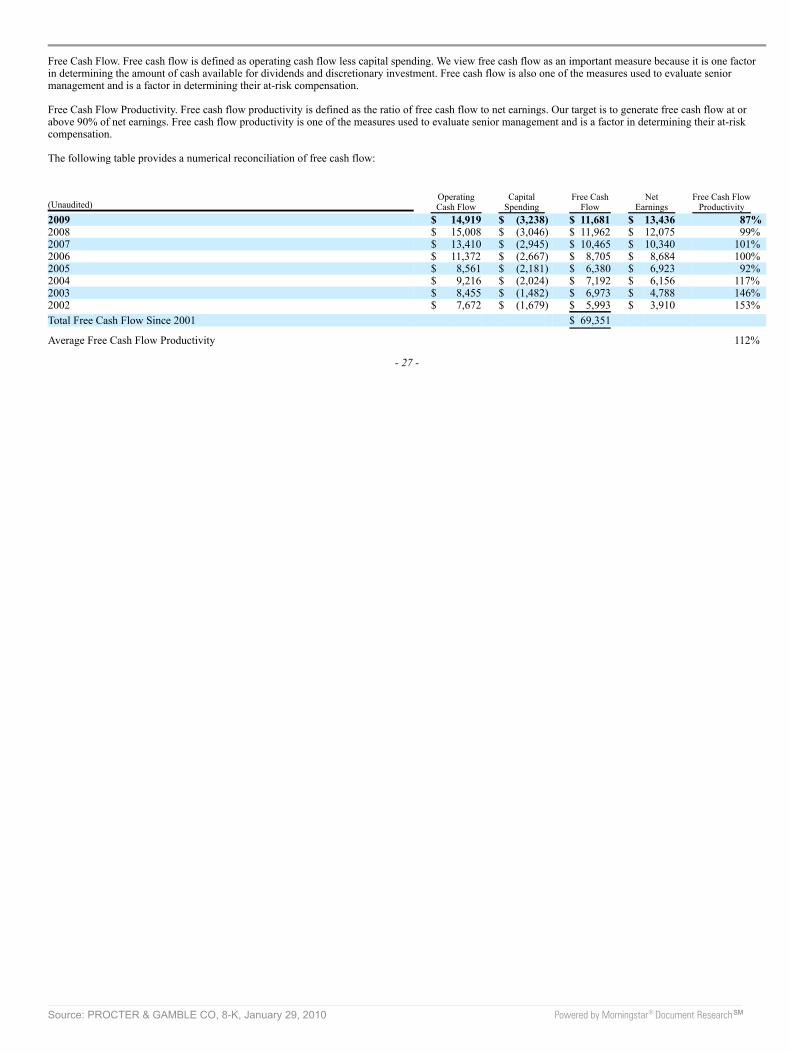
Free Cash Flow. Free cash flow is defined as operating cash flow less capital spending. We view free cash flow as an important measure because it is one factorin determining the amount of cash available for dividends and discretionary investment. Free cash flow is also one of the measures used to evaluate seniormanagement and is a factor in determining their at-risk compensation.
Free Cash Flow Productivity. Free cash flow productivity is defined as the ratio of free cash flow to net earnings. Our target is to generate free cash flow at orabove 90% of net earnings. Free cash flow productivity is one of the measures used to evaluate senior management and is a factor in determining their at-riskcompensation.
The following table provides a numerical reconciliation of free cash flow:
(Unaudited) OperatingCash Flow
CapitalSpending
Free CashFlow
NetEarnings
Free Cash FlowProductivity
2009 $ 14,919 $ (3,238) $ 11,681 $ 13,436 87% 2008 $ 15,008 $ (3,046) $ 11,962 $ 12,075 99% 2007 $ 13,410 $ (2,945) $ 10,465 $ 10,340 101% 2006 $ 11,372 $ (2,667) $ 8,705 $ 8,684 100% 2005 $ 8,561 $ (2,181) $ 6,380 $ 6,923 92% 2004 $ 9,216 $ (2,024) $ 7,192 $ 6,156 117% 2003 $ 8,455 $ (1,482) $ 6,973 $ 4,788 146% 2002 $ 7,672 $ (1,679) $ 5,993 $ 3,910 153%
Total Free Cash Flow Since 2001 $ 69,351
Average Free Cash Flow Productivity 112%
- 27 -
Source: PROCTER & GAMBLE CO, 8-K, January 29, 2010 Powered by Morningstar® Document Research℠

Exhibit 99.2: Revised Consolidated Financial Statements and Accompanying Footnotes
CONSOLIDATED STATEMENTS OF EARNINGS
Amounts in millions except per share amounts; Years ended June 30 2009 2008 2007NET SALES $ 76,694 $ 79,257 $ 72,441Cost of products sold 38,690 39,261 35,376Selling, general and administrative expense 22,630 24,017 22,580
OPERATING INCOME 15,374 15,979 14,485
Interest expense 1,358 1,467 1,304Other non-operating income, net 397 373 481
EARNINGS FROM CONTINUING OPERATIONS BEFORE INCOME TAXES 14,413 14,885 13,662
Income taxes on continuing operations 3,733 3,594 4,000
NET EARNINGS FROM CONTINUING OPERATIONS 10,680 11,291 9,662
NET EARNINGS FROM DISCONTINUED OPERATIONS 2,756 784 678
NET EARNINGS $ 13,436 $ 12,075 $ 10,340
BASIC NET EARNINGS PER COMMON SHARE: Earnings from continuing operations $ 3.55 $ 3.61 $ 3.01Earnings from discontinued operations 0.94 0.25 0.21
BASIC NET EARNINGS PER COMMON SHARE 4.49 3.86 3.22
DILUTED NET EARNINGS PER COMMON SHARE: Earnings from continuing operations 3.39 3.40 2.84Earnings from discontinued operations 0.87 0.24 0.20
DILUTED NET EARNINGS PER COMMON SHARE 4.26 3.64 3.04
DIVIDENDS PER COMMON SHARE $ 1.64 $ 1.45 $ 1.28
See accompanying Notes to Consolidated Financial Statements.
- 1 -
Source: PROCTER & GAMBLE CO, 8-K, January 29, 2010 Powered by Morningstar® Document Research℠

CONSOLIDATED BALANCE SHEETS
Amounts in millions; June 30 2009 2008 ASSETS CURRENT ASSETS Cash and cash equivalents $ 4,781 $ 3,313 Accounts receivable 5,836 6,761 Inventories
Materials and supplies 1,557 2,262 Work in process 672 765 Finished goods 4,651 5,389
Total inventories 6,880 8,416 Deferred income taxes 1,209 2,012 Prepaid expenses and other current assets 3,199 4,013
TOTAL CURRENT ASSETS 21,905 24,515 PROPERTY, PLANT AND EQUIPMENT
Buildings 6,724 7,052 Machinery and equipment 29,042 30,145 Land 885 889
Total property, plant and equipment 36,651 38,086 Accumulated depreciation (17,189) (17,446)
NET PROPERTY, PLANT AND EQUIPMENT 19,462 20,640 GOODWILL AND OTHER INTANGIBLE ASSETS
Goodwill 56,512 59,767 Trademarks and other intangible assets, net 32,606 34,233
NET GOODWILL AND OTHER INTANGIBLE ASSETS 89,118 94,000 OTHER NONCURRENT ASSETS 4,348 4,837
TOTAL ASSETS $ 134,833 $ 143,992
See accompanying Notes to Consolidated Financial Statements.
- 2 -
Source: PROCTER & GAMBLE CO, 8-K, January 29, 2010 Powered by Morningstar® Document Research℠

CONSOLIDATED BALANCE SHEETS
Amounts in millions; June 30 2009 2008 LIABILITIES AND SHAREHOLDERS’ EQUITY CURRENT LIABILITIES Accounts payable $ 5,980 $ 6,775 Accrued and other liabilities 8,601 11,099 Debt due within one year 16,320 13,084
TOTAL CURRENT LIABILITIES 30,901 30,958 LONG-TERM DEBT 20,652 23,581 DEFERRED INCOME TAXES 10,752 11,805 OTHER NONCURRENT LIABILITIES 9,146 7,864
TOTAL LIABILITIES 71,451 74,208
SHAREHOLDERS’ EQUITY Convertible Class A preferred stock, stated value $1 per share (600 shares authorized) 1,324 1,366 Non-Voting Class B preferred stock, stated value $1 per share (200 shares authorized) — — Common stock, stated value $1 per share (10,000 shares authorized; shares issued: 2009 - 4,007.3, 2008 - 4,001.8) 4,007 4,002 Additional paid-in capital 61,118 60,307 Reserve for ESOP debt retirement (1,340) (1,325) Accumulated other comprehensive income (loss) (3,358) 3,746 Treasury stock, at cost (shares held: 2009 - 1,090.3, 2008 - 969.1) (55,961) (47,588) Retained earnings 57,309 48,986 Noncontrolling interest 283 290
TOTAL SHAREHOLDERS’ EQUITY 63,382 69,784
TOTAL LIABILITIES AND SHAREHOLDERS’ EQUITY $ 134,833 $ 143,992
See accompanying Notes to Consolidated Financial Statements.
- 3 -
Source: PROCTER & GAMBLE CO, 8-K, January 29, 2010 Powered by Morningstar® Document Research℠

CONSOLIDATED STATEMENTS OF SHAREHOLDERS’ EQUITY
Dollars in millions/Shares in thousands Common
Shares Outstanding Common
Stock Preferred
Stock Additional
Paid-In Capital
Reserve forESOP DebtRetirement
AccumulatedOther
ComprehensiveIncome
NoncontrollingInterest Treasury Stock
RetainedEarnings Total
BALANCE JUNE 30, 2006 3,178,841 $ 3,976 $ 1,451 $ 57,856 $ (1,288) $ (518) $ 263 $ (34,235) $ 35,666 $ 63,171
Net earnings 10,340 10,340 Other comprehensive income:
Financial statementtranslation 2,419 2,419
Hedges and investmentsecurities, net of $459 tax (951) (951)
Total comprehensive income $ 11,808
Cumulative impact for adoption ofnew accounting guidance 1 (333) (333)
Dividends to shareholders: Common (4,048) (4,048) Preferred, net of tax benefits (161) (161)
Treasury purchases (89,829) (5,578) (5,578) Employee plan issuances 37,824 14 1,167 1,003 2,184 Preferred stock conversions 5,110 (45) 7 38 — ESOP debt impacts (20) (20) Noncontrolling interest (11) (11)
BALANCE JUNE 30, 2007 3,131,946 3,990 1,406 59,030 (1,308) 617 252 (38,772) 41,797 67,012
Net earnings 12,075 12,075 Other comprehensive income:
Financial statementtranslation 6,543 6,543
Hedges and investmentsecurities, net of $1,664tax (2,906) (2,906)
Defined benefit retirementplans, net of $120 tax (508) (508)
Total comprehensive income $ 15,204
Cumulative impact for adoption ofnew accounting guidance 1 (232) (232)
Dividends to shareholders: Common (4,479) (4,479) Preferred, net of tax benefits (176) (176)
Treasury purchases (148,121) (10,047) (10,047) Employee plan issuances 43,910 12 1,272 1,196 2,480 Preferred stock conversions 4,982 (40) 5 35 — ESOP debt impacts (17) 1 (16) Noncontrolling interest 38 38
BALANCE JUNE 30, 2008 3,032,717 4,002 1,366 60,307 (1,325) 3,746 290 (47,588) 48,986 69,784
Net earnings 13,436 13,436 Other comprehensive income:
Financial statementtranslation (6,151) (6,151)
Hedges and investmentsecurities, net of $452 tax 748 748
Defined benefit retirementplans, net of $879 tax (1,701) (1,701)
Total comprehensive income $ 6,332
Cumulative impact for adoption ofnew accounting guidance 1 (84) (84)
Dividends to shareholders: Common (4,852) (4,852) Preferred, net of tax benefits (192) (192)
Treasury purchases (98,862) (6,370) (6,370) Employee plan issuances 16,841 5 804 428 1,237 Preferred stock conversions 4,992 (42) 7 35 — Shares tendered for Folgers coffee
subsidiary (38,653) (2,466) (2,466) ESOP debt impacts (15) 15 — Noncontrolling interest (7) (7)
BALANCE JUNE 30, 2009 2,917,035 $ 4,007 $ 1,324 $ 61,118 $ (1,340) $ (3,358) $ 283 $ (55,961) $ 57,309 $ 63,382
1 Cumulative impact of adopting new accounting guidance relates to: 2007 - defined benefit and post retirement plans; 2008 - uncertainty in income taxes;2009 - split-dollar life insurance arrangements.
See accompanying Notes to Consolidated Financial Statements.
- 4 -
Source: PROCTER & GAMBLE CO, 8-K, January 29, 2010 Powered by Morningstar® Document Research℠
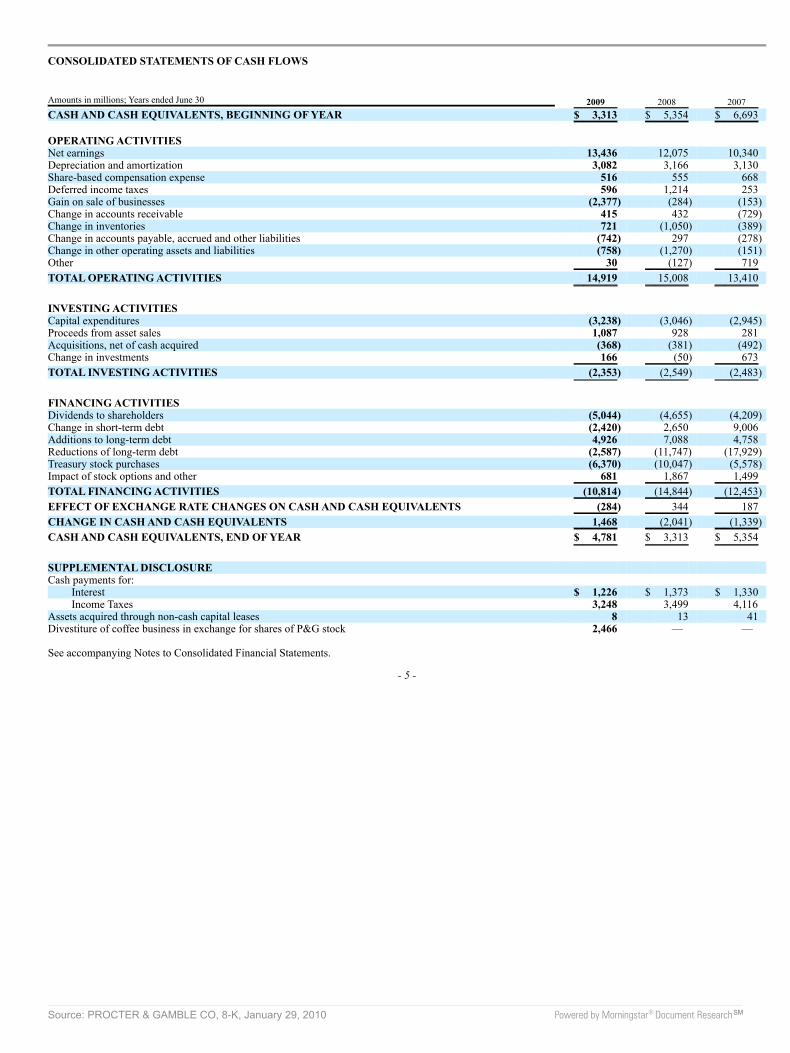
CONSOLIDATED STATEMENTS OF CASH FLOWS
Amounts in millions; Years ended June 30 2009 2008 2007 CASH AND CASH EQUIVALENTS, BEGINNING OF YEAR $ 3,313 $ 5,354 $ 6,693
OPERATING ACTIVITIES Net earnings 13,436 12,075 10,340 Depreciation and amortization 3,082 3,166 3,130 Share-based compensation expense 516 555 668 Deferred income taxes 596 1,214 253 Gain on sale of businesses (2,377) (284) (153) Change in accounts receivable 415 432 (729) Change in inventories 721 (1,050) (389) Change in accounts payable, accrued and other liabilities (742) 297 (278) Change in other operating assets and liabilities (758) (1,270) (151) Other 30 (127) 719
TOTAL OPERATING ACTIVITIES 14,919 15,008 13,410
INVESTING ACTIVITIES Capital expenditures (3,238) (3,046) (2,945) Proceeds from asset sales 1,087 928 281 Acquisitions, net of cash acquired (368) (381) (492) Change in investments 166 (50) 673
TOTAL INVESTING ACTIVITIES (2,353) (2,549) (2,483)
FINANCING ACTIVITIES Dividends to shareholders (5,044) (4,655) (4,209) Change in short-term debt (2,420) 2,650 9,006 Additions to long-term debt 4,926 7,088 4,758 Reductions of long-term debt (2,587) (11,747) (17,929) Treasury stock purchases (6,370) (10,047) (5,578) Impact of stock options and other 681 1,867 1,499
TOTAL FINANCING ACTIVITIES (10,814) (14,844) (12,453)
EFFECT OF EXCHANGE RATE CHANGES ON CASH AND CASH EQUIVALENTS (284) 344 187
CHANGE IN CASH AND CASH EQUIVALENTS 1,468 (2,041) (1,339)
CASH AND CASH EQUIVALENTS, END OF YEAR $ 4,781 $ 3,313 $ 5,354
SUPPLEMENTAL DISCLOSURE Cash payments for:
Interest $ 1,226 $ 1,373 $ 1,330 Income Taxes 3,248 3,499 4,116
Assets acquired through non-cash capital leases 8 13 41 Divestiture of coffee business in exchange for shares of P&G stock 2,466 — —
See accompanying Notes to Consolidated Financial Statements.
- 5 -
Source: PROCTER & GAMBLE CO, 8-K, January 29, 2010 Powered by Morningstar® Document Research℠
NOTES TO CONSOLIDATED FINANCIAL STATEMENTS
NOTE 1 SUMMARY OF SIGNIFICANT ACCOUNTING POLICIES
Nature of Operations
The Procter & Gamble Company’s (the “Company,” “we” or “us”) business is focused on providing branded consumer goods products of superior quality andvalue. Our products are sold in more than 180 countries primarily through retail operations including mass merchandisers, grocery stores, membership clubstores, drug stores, department stores, salons and high-frequency stores. We have on-the-ground operations in approximately 80 countries.
Basis of Presentation
The Consolidated Financial Statements include the Company and its controlled subsidiaries. Intercompany transactions are eliminated.
Use of Estimates
Preparation of financial statements in conformity with accounting principles generally accepted in the United States of America (U.S. GAAP) requiresmanagement to make estimates and assumptions that affect the amounts reported in the Consolidated Financial Statements and accompanying disclosures. Theseestimates are based on management’s best knowledge of current events and actions the Company may undertake in the future. Estimates are used in accountingfor, among other items, consumer and trade promotion accruals, pensions, post-employment benefits, stock options, valuation of acquired intangible assets,useful lives for depreciation and amortization, future cash flows associated with impairment testing for goodwill, indefinite-lived intangible assets and long-livedassets, deferred tax assets, uncertain income tax positions and contingencies. Actual results may ultimately differ from estimates, although management does notgenerally believe such differences would materially affect the financial statements in any individual year. However, in regard to ongoing impairment testing ofgoodwill and indefinite-lived intangible assets, significant deterioration in future cash flow projections or other assumptions used in valuation models, versusthose anticipated at the time of the initial valuations, could result in impairment charges that may materially affect the financial statements in a given year.
Revenue Recognition
Sales are recognized when revenue is realized or realizable and has been earned. Most revenue transactions represent sales of inventory. The revenue recorded ispresented net of sales and other taxes we collect on behalf of governmental authorities and includes shipping and handling costs, which generally are included inthe list price to the customer. Our policy is to recognize revenue when title to the product, ownership and risk of loss transfer to the customer, which can be onthe date of shipment or the date of receipt by the customer. A provision for payment discounts and product return allowances is recorded as a reduction of sales inthe same period that the revenue is recognized.
- 6 -
Source: PROCTER & GAMBLE CO, 8-K, January 29, 2010 Powered by Morningstar® Document Research℠

Trade promotions, consisting primarily of customer pricing allowances, merchandising funds and consumer coupons, are offered through various programs tocustomers and consumers. Sales are recorded net of trade promotion spending, which is recognized as incurred, generally at the time of the sale. Most of thesearrangements have terms of approximately one year. Accruals for expected payouts under these programs are included as accrued marketing and promotion in theaccrued and other liabilities line item in the Consolidated Balance Sheets.
Cost of Products Sold
Cost of products sold is primarily comprised of direct materials and supplies consumed in the manufacture of product, as well as manufacturing labor,depreciation expense and direct overhead expense necessary to acquire and convert the purchased materials and supplies into finished product. Cost of productssold also includes the cost to distribute products to customers, inbound freight costs, internal transfer costs, warehousing costs and other shipping and handlingactivity.
Selling, General and Administrative Expense
Selling, general and administrative expense (SG&A) is primarily comprised of marketing expenses, selling expenses, research and development costs,administrative and other indirect overhead costs, depreciation and amortization expense on non-manufacturing assets and other miscellaneous operating items.Research and development costs are charged to expense as incurred and were $1,864 in 2009, $1,946 in 2008, and $1,823 in 2007. Advertising costs, charged toexpense as incurred, include worldwide television, print, radio, internet and in-store advertising expenses and were $7,519 in 2009, $8,520 in 2008 and $7,799 in2007. Non-advertising related components of the Company’s total marketing spending include costs associated with consumer promotions, product sampling andsales aids, all of which are included in SG&A, as well as coupons and customer trade funds, which are recorded as reductions to net sales.
Other Non-Operating Income, Net
Other non-operating income, net, primarily includes net divestiture gains and interest and investment income.
Currency Translation
Financial statements of operating subsidiaries outside the United States of America (U.S.) generally are measured using the local currency as the functionalcurrency. Adjustments to translate those statements into U.S. dollars are recorded in other comprehensive income. Currency translation adjustments inaccumulated other comprehensive income were gains of $3,333 and $9,484 at June 30, 2009 and 2008, respectively. For subsidiaries operating in highlyinflationary economies, the U.S. dollar is the functional currency. Remeasurement adjustments for financial statements in highly inflationary economies andother transactional exchange gains and losses are reflected in earnings.
Cash Flow Presentation
The Statements of Cash Flows are prepared using the indirect method, which reconciles net earnings to cash flow from operating activities. The reconciliationadjustments include the removal of timing differences between the occurrence of operating receipts and payments and their recognition in net earnings. Theadjustments also remove cash flows arising from investing and financing activities, which are presented separately from operating activities. Cash flows fromforeign currency transactions and operations are translated at an average exchange rate for the period. Cash flows from hedging activities are included in thesame category as the items being hedged. Cash flows from derivative instruments designated as net investment hedges are classified as financing activities.Realized gains and losses from non-qualifying derivative instruments used to hedge currency exposures resulting from intercompany financing transactions arealso classified as financing activities. Cash flows from other derivative instruments used to manage interest, commodity or other currency exposures areclassified as operating activities. Cash payments related to income taxes are classified as operating activities.
* Amounts in millions of dollars except per share amounts or as otherwise specified.
- 7 -
Source: PROCTER & GAMBLE CO, 8-K, January 29, 2010 Powered by Morningstar® Document Research℠
Cash Equivalents
Highly liquid investments with remaining stated maturities of three months or less when purchased are considered cash equivalents and recorded at cost.
Investments
Investment securities consist of readily marketable debt and equity securities. Unrealized gains or losses are charged to earnings for investments classified astrading. Unrealized gains or losses on securities classified as available-for-sale are generally recorded in shareholders’ equity. If an available-for-sale security isother than temporarily impaired, the loss is charged to either earnings or shareholders’ equity depending on our intent and ability to retain the security until werecover the full cost basis and the extent of the loss attributable to the creditworthiness of the issuer. Investments in certain companies over which we exertsignificant influence, but do not control the financial and operating decisions, are accounted for as equity method investments and are classified as othernoncurrent assets. Other investments that are not controlled, and over which we do not have the ability to exercise significant influence, are accounted for underthe cost method.
Inventory Valuation
Inventories are valued at the lower of cost or market value. Product-related inventories are primarily maintained on the first-in, first-out method. Minor amountsof product inventories, including certain cosmetics and commodities, are maintained on the last-in, first-out method. The cost of spare part inventories ismaintained using the average cost method.
Property, Plant and Equipment
Property, plant and equipment is recorded at cost reduced by accumulated depreciation. Depreciation expense is recognized over the assets’ estimated useful livesusing the straight-line method. Machinery and equipment includes office furniture and fixtures (15-year life), computer equipment and capitalized software (3- to5-year lives) and manufacturing equipment (3- to 20-year lives). Buildings are depreciated over an estimated useful life of 40 years. Estimated useful lives areperiodically reviewed and, when appropriate, changes are made prospectively. When certain events or changes in operating conditions occur, asset lives may beadjusted and an impairment assessment may be performed on the recoverability of the carrying amounts.
Goodwill and Other Intangible Assets
Goodwill and indefinite-lived brands are not amortized, but are evaluated for impairment annually or when indicators of a potential impairment are present. Ourimpairment testing of goodwill is performed separately from our impairment testing of individual indefinite-lived intangibles. The annual evaluation forimpairment of goodwill and indefinite-lived intangibles is based on valuation models that incorporate assumptions and internal projections of expected futurecash flows and operating plans. We believe such assumptions are also comparable to those that would be used by other marketplace participants.
We have a number of acquired brands that have been determined to have indefinite lives due to the nature of our business. We evaluate a number of factors todetermine whether an indefinite life is appropriate, including the competitive environment, market share, brand history, product life cycles, operating plans andthe macroeconomic environment of the countries in which the brands are sold. When certain events or changes in operating conditions occur, an impairmentassessment is performed and indefinite-lived brands may be adjusted to a determinable life.
* Amounts in millions of dollars except per share amounts or as otherwise specified.
- 8 -
Source: PROCTER & GAMBLE CO, 8-K, January 29, 2010 Powered by Morningstar® Document Research℠
The cost of intangible assets with determinable useful lives is amortized to reflect the pattern of economic benefits consumed, either on a straight-line oraccelerated basis over the estimated periods benefited. Patents, technology and other intangibles with contractual terms are generally amortized over theirrespective legal or contractual lives. Customer relationships and other non-contractual intangible assets with determinable lives are amortized over periodsgenerally ranging from 5 to 40 years. When certain events or changes in operating conditions occur, an impairment assessment is performed and lives ofintangible assets with determinable lives may be adjusted.
Fair Values of Financial Instruments
Certain financial instruments are required to be recorded at fair value. The estimated fair values of such financial instruments (including certain debt instruments,investment securities and derivatives) have been determined using market information and valuation methodologies, primarily discounted cash flow analysis.Changes in assumptions or estimation methods could affect the fair value estimates; however, we do not believe any such changes would have a material impacton our financial condition, results of operations or cash flows. Other financial instruments, including cash equivalents, other investments and short-term debt, arerecorded at cost, which approximates fair value. The fair values of long-term debt and derivative instruments are disclosed in Note 4 and Note 5, respectively.
Subsequent Events
For the fiscal year ended June 30, 2009, the Company has evaluated subsequent events for potential recognition and disclosure through August 14, 2009, theoriginal date of financial statement issuance, and through January 29, 2010, the date of the financial statement reissuance.
New Accounting Pronouncements and Policies
Other than as described below, no new accounting pronouncement issued or effective during the fiscal year has had or is expected to have a material impact onthe Consolidated Financial Statements.
FAIR VALUE MEASUREMENTS
On July 1, 2008, we adopted new accounting guidance on fair value measurements. The new guidance defines fair value, establishes a framework for measuringfair value under U.S. GAAP, and expands disclosures about fair value measurements. It was effective for the Company beginning July 1, 2008, for certainfinancial assets and liabilities. Refer to Note 5 for additional information regarding our fair value measurements for financial assets and liabilities. The newguidance is effective for non-financial assets and liabilities recognized or disclosed at fair value on a nonrecurring basis beginning July 1, 2009. The Companybelieves that the adoption of the new guidance applicable to non-financial assets and liabilities will not have a material effect on its financial position, results ofoperations or cash flows.
DISCLOSURES ABOUT DERIVATIVE INSTRUMENTS AND HEDGING ACTIVITIES
On January 1, 2009, we adopted new accounting guidance on disclosures about derivative instruments and hedging activities. The new guidance impactsdisclosures only and requires additional qualitative and quantitative information on the use of derivatives and their impact on an entity’s financial position, resultsof operations and cash flows. Refer to Note 5 for additional information regarding our risk management activities, including derivative instruments and hedgingactivities.
BUSINESS COMBINATIONS
In December 2007, the Financial Accounting Standards Board (FASB) issued new accounting guidance on business combinations. The new guidance revises themethod of accounting for a number of aspects of business combinations including acquisition costs, contingencies (including contingent assets, contingentliabilities and contingent purchase price) and post-acquisition exit activities of acquired businesses. The new guidance will be effective for the Company duringour fiscal year beginning July 1, 2009. The Company believes that the adoption of the new guidance will not have a material effect on its financial position,results of operations or cash flows.
* Amounts in millions of dollars except per share amounts or as otherwise specified.
- 9 -
Source: PROCTER & GAMBLE CO, 8-K, January 29, 2010 Powered by Morningstar® Document Research℠

NONCONTROLLING INTERESTS IN CONSOLIDATED FINANCIAL STATEMENTS
In December 2007, the FASB also issued new accounting guidance on noncontrolling interests in consolidated financial statements. The new accountingguidance requires that a noncontrolling interest in the equity of a subsidiary be accounted for and reported as equity, provides revised guidance on the treatmentof net income and losses attributable to the noncontrolling interest and changes in ownership interests in a subsidiary and requires additional disclosures thatidentify and distinguish between the interests of the controlling and noncontrolling owners. The Company retrospectively adopted the presentation and disclosurerequirements of the new guidance on July 1, 2009. The adoption of the new guidance did not have a material effect on our financial position, results of operationsor cash flows. Noncontrolling interests of $283 and $290 at June 30, 2009 and 2008, respectively, were reclassified from liabilities to shareholders’ equity in theConsolidated Balance Sheets. Net expense for income attributable to the noncontrolling interest totaling $86 in 2009, $78 in 2008 and $70 in 2007 are notpresented separately in the Consolidated Statements of Earnings due to immateriality, but are reflected within other non-operating income, net. Net earningsrepresents net income attributable to the Company’s common shareholders.
* Amounts in millions of dollars except per share amounts or as otherwise specified.
- 10 -
Source: PROCTER & GAMBLE CO, 8-K, January 29, 2010 Powered by Morningstar® Document Research℠

NOTE 2 GOODWILL AND INTANGIBLE ASSETS
The change in the net carrying amount of goodwill by Global Business Unit (GBU) was as follows:
2009 2008 BEAUTY & GROOMING GBU
Beauty, beginning of year $ 19,662 $ 17,994 Acquisitions and divestitures 66 154 Translation and other (1,060) 1,514
Goodwill, June 30 18,668 19,662
Grooming, beginning of year 22,553 21,576 Acquisitions and divestitures (214) (236) Translation and other (948) 1,213
Goodwill, June 30 21,391 22,553
HEALTH & WELL-BEING GBU Health Care, beginning of year 8,750 8,482
Acquisitions and divestitures (81) (59) Translation and other (265) 327
Goodwill, June 30 8,404 8,750
Snacks and Pet Care, beginning of year 2,434 2,407 Acquisitions and divestitures (356) (5) Translation and other (23) 32
Goodwill, June 30 2,055 2,434
HOUSEHOLD CARE GBU Fabric Care and Home Care, beginning of year 4,655 4,470
Acquisitions and divestitures (46) (43) Translation and other (201) 228
Goodwill, June 30 4,408 4,655
Baby Care and Family Care, beginning of year 1,713 1,623 Acquisitions and divestitures (7) (34) Translation and other (120) 124
Goodwill, June 30 1,586 1,713
GOODWILL, Net, beginning of year 59,767 56,552 Acquisitions and divestitures (638) (223) Translation and other (2,617) 3,438
Goodwill, June 30 56,512 59,767
The acquisition and divestiture impact during fiscal 2009 in Snacks and Pet Care is primarily due to the divestiture of the Coffee business. The remainingdecrease in goodwill during fiscal 2009 is primarily due to currency translation across all GBUs.
* Amounts in millions of dollars except per share amounts or as otherwise specified.
- 11 -
Source: PROCTER & GAMBLE CO, 8-K, January 29, 2010 Powered by Morningstar® Document Research℠
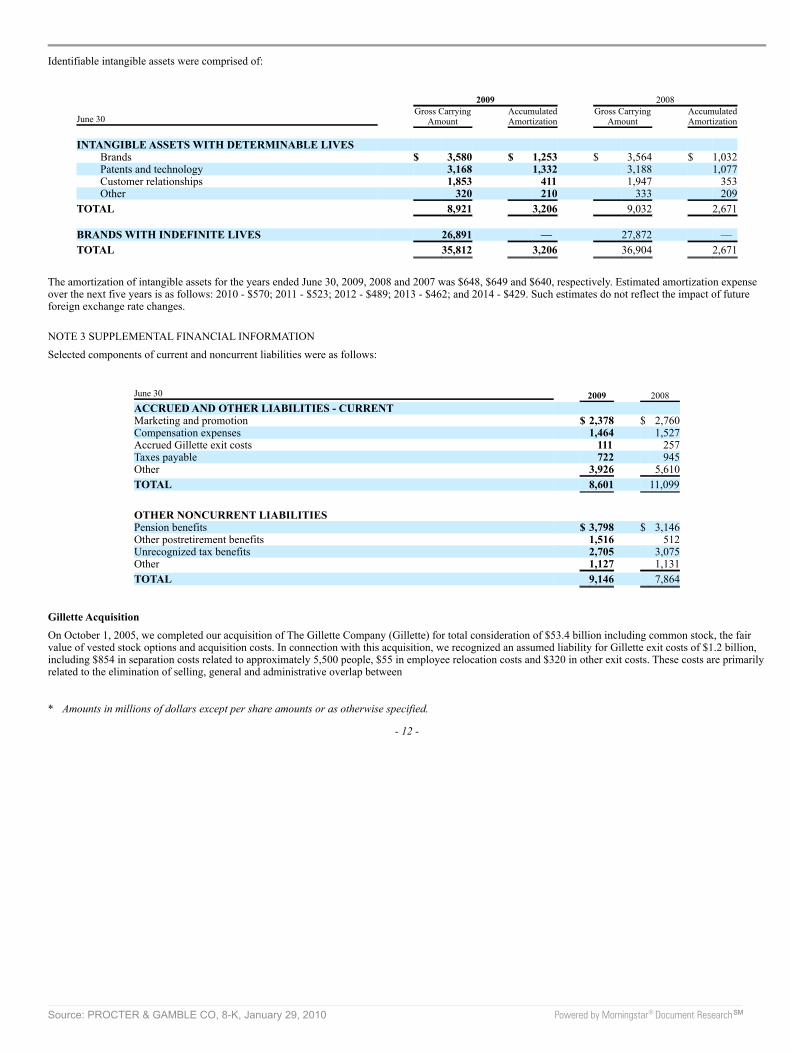
Identifiable intangible assets were comprised of:
2009 2008
June 30 Gross Carrying
Amount AccumulatedAmortization
Gross CarryingAmount
AccumulatedAmortization
INTANGIBLE ASSETS WITH DETERMINABLE LIVES Brands $ 3,580 $ 1,253 $ 3,564 $ 1,032Patents and technology 3,168 1,332 3,188 1,077Customer relationships 1,853 411 1,947 353Other 320 210 333 209
TOTAL 8,921 3,206 9,032 2,671
BRANDS WITH INDEFINITE LIVES 26,891 — 27,872 —
TOTAL 35,812 3,206 36,904 2,671
The amortization of intangible assets for the years ended June 30, 2009, 2008 and 2007 was $648, $649 and $640, respectively. Estimated amortization expenseover the next five years is as follows: 2010 - $570; 2011 - $523; 2012 - $489; 2013 - $462; and 2014 - $429. Such estimates do not reflect the impact of futureforeign exchange rate changes.
NOTE 3 SUPPLEMENTAL FINANCIAL INFORMATION
Selected components of current and noncurrent liabilities were as follows:
June 30 2009 2008ACCRUED AND OTHER LIABILITIES - CURRENT Marketing and promotion $ 2,378 $ 2,760Compensation expenses 1,464 1,527Accrued Gillette exit costs 111 257Taxes payable 722 945Other 3,926 5,610
TOTAL 8,601 11,099
OTHER NONCURRENT LIABILITIES Pension benefits $ 3,798 $ 3,146Other postretirement benefits 1,516 512Unrecognized tax benefits 2,705 3,075Other 1,127 1,131
TOTAL 9,146 7,864
Gillette Acquisition
On October 1, 2005, we completed our acquisition of The Gillette Company (Gillette) for total consideration of $53.4 billion including common stock, the fairvalue of vested stock options and acquisition costs. In connection with this acquisition, we recognized an assumed liability for Gillette exit costs of $1.2 billion,including $854 in separation costs related to approximately 5,500 people, $55 in employee relocation costs and $320 in other exit costs. These costs are primarilyrelated to the elimination of selling, general and administrative overlap between
* Amounts in millions of dollars except per share amounts or as otherwise specified.
- 12 -
Source: PROCTER & GAMBLE CO, 8-K, January 29, 2010 Powered by Morningstar® Document Research℠

the two companies in areas like Global Business Services, corporate staff and go-to-market support, as well as redundant manufacturing capacity. These activitiesare substantially complete as of June 30, 2009. Total integration plan charges against the assumed liability were $51, $286 and $438 for the years ended June2009, 2008 and 2007, respectively. A total of $106 and $121 of the liability was reversed during the years ended June 2009 and 2008, respectively, related tounderspending on a number of projects that were concluded during the period, which resulted in a reduction of goodwill during those years.
NOTE 4 SHORT-TERM AND LONG-TERM DEBT
June 30 2009 2008DEBT DUE WITHIN ONE YEAR Current portion of long-term debt $ 6,941 $ 1,746Commercial paper 5,027 9,748Floating rate notes 4,250 1,500Other 102 90
TOTAL 16,320 13,084
The weighted average short-term interest rates were 2.0% and 2.7% as of June 30, 2009 and 2008, respectively, including the effects of interest rate swapsdiscussed in Note 5.
* Amounts in millions of dollars except per share amounts or as otherwise specified.
- 13 -
Source: PROCTER & GAMBLE CO, 8-K, January 29, 2010 Powered by Morningstar® Document Research℠

June 30 2009 2008 LONG-TERM DEBT Floating rate note due July 2009 $ 1,750 $ 1,750 Floating rate note due August 2009 1,500 1,500 6.88% USD note due September 2009 1,000 1,000 Floating rate note due March 2010 750 — 2% JPY note due June 2010 522 467 4.88% EUR note due October 2011 1,411 1,573 3.38% EUR note due December 2012 1,975 2,203 4.60% USD note due January 2014 2,000 — 4.50% EUR note due May 2014 2,116 2,360 4.95% USD note due August 2014 900 900 3.50% USD note due February 2015 750 — 4.85% USD note due December 2015 700 700 5.13% EUR note due October 2017 1,552 1,731 4.70% USD note due February 2019 1,250 — 4.13% EUR note due December 2020 846 944 9.36% ESOP debentures due 2009-2021(1)
896 934 4.88% EUR note due May 2027 1,411 1,573 6.25% GBP note due January 2030 832 993 5.50% USD note due February 2034 500 500 5.80% USD note due August 2034 600 600 5.55% USD note due March 2037 1,400 1,400 Capital lease obligations 392 407 All other long-term debt 2,540 3,792 Current portion of long-term debt (6,941) (1,746)
TOTAL 20,652 23,581
(1) Debt issued by the ESOP is guaranteed by the Company and must be recorded as debt of the Company as discussed in Note 8.
Long-term weighted average interest rates were 4.9% and 4.5% as of June 30, 2009 and 2008, respectively, including the effects of interest rate swaps and netinvestment hedges discussed in Note 5.
The fair value of the long-term debt was $21,514 and $23,276 at June 30, 2009 and 2008, respectively. Long-term debt maturities during the next five years areas follows: 2010 - $6,941; 2011 - $47; 2012 - $1,474; 2013 - $2,013; and 2014 - $4,154.
The Procter & Gamble Company fully and unconditionally guarantees the registered debt and securities issued by its 100% owned finance subsidiaries.
NOTE 5 RISK MANAGEMENT ACTIVITIES AND FAIR VALUE MEASUREMENTS
As a multinational company with diverse product offerings, we are exposed to market risks, such as changes in interest rates, currency exchange rates andcommodity prices. We evaluate exposures on a centralized basis to take advantage of natural exposure netting and correlation. To the extent we choose tomanage volatility associated with the net exposures, we enter into various financial transactions which we account for using the applicable accounting guidancefor derivative instruments and hedging activities. These financial transactions are governed by our policies covering acceptable counterparty exposure,instrument types and other hedging practices.
* Amounts in millions of dollars except per share amounts or as otherwise specified.
- 14 -
Source: PROCTER & GAMBLE CO, 8-K, January 29, 2010 Powered by Morningstar® Document Research℠

At inception, we formally designate and document qualifying instruments as hedges of underlying exposures. We formally assess, both at inception and at leastquarterly, whether the financial instruments used in hedging transactions are effective at offsetting changes in either the fair value or cash flows of the relatedunderlying exposure. Fluctuations in the value of these instruments generally are offset by changes in the fair value or cash flows of the underlying exposuresbeing hedged. This offset is driven by the high degree of effectiveness between the exposure being hedged and the hedging instrument. The ineffective portion ofa change in the fair value of a qualifying instrument is immediately recognized in earnings. The amount of ineffectiveness recognized is immaterial for allperiods presented.
Credit Risk Management
We have counterparty credit guidelines and generally enter into transactions with investment grade financial institutions. Counterparty exposures are monitoreddaily and downgrades in credit rating are reviewed on a timely basis. Credit risk arising from the inability of a counterparty to meet the terms of our financialinstrument contracts generally is limited to the amounts, if any, by which the counterparty’s obligations to us exceed our obligations to the counterparty. We havenot incurred and do not expect to incur material credit losses on our risk management or other financial instruments.
Certain of the Company’s financial instruments used in hedging transactions are governed by industry standard netting agreements with counterparties. If theCompany’s credit rating were to fall below the levels stipulated in the agreements, the counterparties could demand either collateralization or termination of thearrangement. The aggregate fair value of the instruments covered by these contractual features that are in a net liability position as of June 30, 2009 was $288million. The Company has never been required to post any collateral as a result of these contractual features.
Interest Rate Risk Management
Our policy is to manage interest cost using a mixture of fixed-rate and variable-rate debt. To manage this risk in a cost-efficient manner, we enter into interestrate swaps in which we agree to exchange with the counterparty, at specified intervals, the difference between fixed and variable interest amounts calculated byreference to an agreed-upon notional amount.
Interest rate swaps that meet specific accounting criteria are accounted for as fair value and cash flow hedges. There were no fair value hedging instruments atJune 30, 2009 or June 30, 2008. For cash flow hedges, the effective portion of the changes in fair value of the hedging instrument is reported in othercomprehensive income (OCI) and reclassified into interest expense over the life of the underlying debt. The ineffective portion, which is not material for any yearpresented, is immediately recognized in earnings.
Foreign Currency Risk Management
We manufacture and sell our products in a number of countries throughout the world and, as a result, are exposed to movements in foreign currency exchangerates. The purpose of our foreign currency hedging program is to manage the volatility associated with short-term changes in exchange rates.
To manage this exchange rate risk, we have historically utilized a combination of forward contracts, options and currency swaps. As of June 30, 2009, we hadcurrency swaps with maturities up to five years, which are intended to offset the effect of exchange rate fluctuations on intercompany loans denominated inforeign currencies and are therefore accounted for as cash flow hedges. The Company has also utilized forward contracts and options to offset the effect ofexchange rate fluctuations on forecasted sales, inventory purchases and intercompany royalties
* Amounts in millions of dollars except per share amounts or as otherwise specified.
- 15 -
Source: PROCTER & GAMBLE CO, 8-K, January 29, 2010 Powered by Morningstar® Document Research℠
denominated in foreign currencies. The effective portion of the changes in fair value of these instruments is reported in OCI and reclassified into earnings in thesame financial statement line item and in the same period or periods during which the related hedged transactions affect earnings. The ineffective portion, whichis not material for any year presented, is immediately recognized in earnings.
The change in value of certain non-qualifying instruments used to manage foreign exchange exposure of intercompany financing transactions, income frominternational operations and other balance sheet items subject to revaluation is immediately recognized in earnings, substantially offsetting the foreign currencymark-to-market impact of the related exposure. The net earnings impact of such instruments was a $1,047 loss in 2009 and gains of $1,397 and $56 in 2008 and2007, respectively.
Net Investment Hedging
We hedge certain net investment positions in major foreign subsidiaries. To accomplish this, we either borrow directly in foreign currencies and designate all or aportion of foreign currency debt as a hedge of the applicable net investment position or enter into foreign currency swaps that are designated as hedges of ourrelated foreign net investments. Changes in the fair value of these instruments are immediately recognized in OCI to offset the change in the value of the netinvestment being hedged. Currency effects of these hedges reflected in OCI were an after-tax gain of $964 in 2009 and $2,951 loss in 2008. Accumulated netbalances were a $4,059 and a $5,023 after-tax loss as of June 30, 2009 and 2008, respectively.
Commodity Risk Management
Certain raw materials used in our products or production processes are subject to price volatility caused by weather, supply conditions, political and economicvariables and other unpredictable factors. To manage the volatility related to anticipated purchases of certain of these materials, we use futures and options withmaturities generally less than one year and swap contracts with maturities up to five years. These market instruments generally are designated as cash flowhedges. The effective portion of the changes in fair value for these instruments is reported in OCI and reclassified into earnings in the same financial statementline item and in the same period or periods during which the hedged transactions affect earnings. The ineffective and non-qualifying portions, which are notmaterial for any year presented, are immediately recognized in earnings.
Insurance
We self insure for most insurable risks. In addition, we purchase insurance for Directors and Officers Liability and certain other coverage in situations where it isrequired by law, by contract, or deemed to be in the interest of the Company.
Fair Value Hierarchy
New accounting guidance on fair value measurements for certain financial assets and liabilities requires that assets and liabilities carried at fair value be classifiedand disclosed in one of the following three categories:
Level 1: Quoted market prices in active markets for identical assets or liabilities.
Level 2: Observable market-based inputs or unobservable inputs that are corroborated by market data.
Level 3: Unobservable inputs reflecting the reporting entity’s own assumptions or external inputs from inactive markets.
In valuing assets and liabilities, we are required to maximize the use of quoted market prices and minimize the use of unobservable inputs. We calculate the fairvalue of our Level 1 and Level 2 instruments based on the exchange traded price of similar or identical instruments where available or based on other observableinstruments. The fair value of our Level 3 instruments is calculated as the net present value of expected cash
* Amounts in millions of dollars except per share amounts or as otherwise specified.
- 16 -
Source: PROCTER & GAMBLE CO, 8-K, January 29, 2010 Powered by Morningstar® Document Research℠

flows based on externally provided inputs. These calculations take into consideration the credit risk of both the Company and our counterparties. The Companyhas not changed its valuation techniques in measuring the fair value of any financial assets and liabilities during the period.
The following table sets forth the Company’s financial assets and liabilities as of June 30, 2009 that are measured at fair value on a recurring basis during theperiod, segregated by level within the fair value hierarchy:
At June 30 Level 1 Level 2 Level 3 2009 2008Assets at fair value:
Investment securities $ — $ 174 $ 38 $ 212 $ 282Derivatives relating to:
Foreign currency hedges — — — — 4Other foreign currency instruments
(1) — 300 — 300 190
Net investment hedges — 83 — 83 26Commodities 3 25 — 28 229
Total assets at fair value(2)
3 582 38 623 731
Liabilities at fair value: Derivatives relating to:
Foreign currency hedges — 103 — 103 37Other foreign currency instruments
(1) — 39 — 39 33
Net investment hedges — 85 — 85 1,210Interest rate — 13 — 13 17Commodities 2 96 3 101 —
Total liabilities at fair value(3)
2 336 3 341 1,297
(1) The other foreign currency instruments are comprised of non-qualifying foreign currency financial instruments.
(2) All derivative assets are presented in prepaid expenses and other current assets or other noncurrent assets with the exception of investment securities whichare only presented in other noncurrent assets.
(3) All liabilities are presented in accrued and other liabilities or other noncurrent liabilities.
The table below sets forth a reconciliation of the Company’s beginning and ending Level 3 financial assets and liabilities balances for the year ended June 30,2009.
Derivatives InvestmentSecurities
BEGINNING OF YEAR $ 17 $ 46 Total gains or (losses) (realized/unrealized) included in earnings (or changes in
net assets) — (2) Total gains or (losses) (realized/unrealized) included in OCI (27) (6) Net purchases, issuances and settlements 7 — Transfers in/(out) of Level 3 — —
END OF YEAR (3) 38
* Amounts in millions of dollars except per share amounts or as otherwise specified.
- 17 -
Source: PROCTER & GAMBLE CO, 8-K, January 29, 2010 Powered by Morningstar® Document Research℠

Disclosures about Derivative Instruments
The fair values and amounts of gains and losses on qualifying and non-qualifying financial instruments used in hedging transactions as of, and for the year ended,June 30, 2009 are as follows:
Derivatives in Cash Flow Hedging Relationships Notional Amount(Ending Balance)
Fair Value Asset(Liability)
Amount of Gain or(Loss) Recognized in
OCI on Derivative(Effective Portion)
Amount of Gain or(Loss) Reclassified fromAccumulated OCI into
Income (EffectivePortion) (1)
June 30 June 30 June 30 Twelve Months Ended
June 30 Interest rate contracts $ 4,000 $ (13) $ 18 $ (56) Foreign currency contracts 690 (103) 26 (66) Commodity contracts 503 (73) (62) (170)
Total 5,193 (189) (18) (292)
Derivatives in Net Investment Hedging Relationships Notional Amount(Ending Balance)
Fair Value Asset(Liability)
Amount of Gain or(Loss) Recognized in
OCI on Derivative(Effective Portion)
Amount of Gain or(Loss) Recognized inIncome on Derivative
(Ineffective Portion andAmount Excluded from
Effectiveness Testing) (1)
June 30 June 30 June 30 Twelve Months Ended
June 30 Net investment hedges $ 2,271 $ (2) $ (2) $ (5)
Total 2,271 (2) (2) (5)
Derivatives Not Designated as Hedging Instruments Notional Amount(Ending Balance)
Fair Value Asset(Liability)
Amount of Gain or(Loss) Recognized in
Income on Derivative (1)
June 30 June 30
Twelve MonthsEnded
June 30 Foreign currency contracts $ 12,348 $ 261 $ (1,047) Commodity contracts — — (5)
Total 12,348 261 (1,052)
(1) The gain or loss reclassified from accumulated OCI into income is included in the consolidated statement of earnings as follows: interest rate contracts ininterest expense, foreign currency contracts in SG&A and interest expense, commodity contracts in cost of products sold and net investment hedges ininterest expense.
During the next 12 months, the amount of the June 30, 2009 OCI balance that will be reclassified to earnings is expected to be immaterial. In addition, the totalnotional amount of contracts outstanding at the end of the period is indicative of the level of the Company’s derivative activity during the period.
NOTE 6 EARNINGS PER SHARE
Net earnings less preferred dividends (net of related tax benefits) are divided by the weighted average number of common shares outstanding during the year tocalculate basic net earnings per common share. Diluted net earnings per common share are calculated to give effect to stock options and other stock-based awards(see Note 7) and assume conversion of preferred stock (see Note 8).
* Amounts in millions of dollars except per share amounts or as otherwise specified.
- 18 -
Source: PROCTER & GAMBLE CO, 8-K, January 29, 2010 Powered by Morningstar® Document Research℠

Net earnings and common shares used to calculate basic and diluted net earnings per share were as follows:
Years ended June 30 2009 2008 2007 NET EARNINGS FROM CONTINUING OPERATIONS $ 10,680 $ 11,291 $ 9,662 Preferred dividends, net of tax benefit (192) (176) (161)
NET EARNINGS FROM CONTINUING OPERATIONS AVAILABLE TOCOMMON SHAREHOLDERS 10,488 11,115 9,501
Preferred dividends, net of tax benefit 192 176 161
DILUTED NET EARNINGS FROM CONTINUING OPERATIONS 10,680 11,291 9,662
Net earnings from discontinued operations 2,756 784 678
NET EARNINGS 13,436 12,075 10,340
Shares in millions; Years ended June 30 2009 2008 2007 Basic weighted average common shares outstanding 2,952.2 3,080.8 3,159.0 Effect of dilutive securities
Conversion of preferred shares (1) 139.2 144.2 149.6 Exercise of stock options and other unvested equity awards (2) 62.7 91.8 90.0
DILUTED WEIGHTED AVERAGE COMMON SHARES OUTSTANDING 3,154.1 3,316.8 3,398.6
(1) Despite being included currently in diluted net earnings per common share, the actual conversion to common stock occurs pursuant to the repayment of theESOPs’ obligations through 2035.
(2) Approximately 92 million in 2009, 40 million in 2008 and 41 million in 2007 of the Company’s outstanding stock options were not included in the dilutednet earnings per share calculation because the options were out of the money or to do so would have been antidilutive (i.e., the total proceeds upon exercisewould have exceeded the market value of the underlying common shares).
NOTE 7 STOCK-BASED COMPENSATION
We have stock-based compensation plans under which we annually grant stock option and restricted stock awards to key managers and directors. Exercise priceson options granted have been and continue to be set equal to the market price of the underlying shares on the date of the grant. The key manager stock optionawards granted since September 2002 are vested after three years and have a 10-year life. The key manager stock option awards granted from July 1998 throughAugust 2002 vested after three years and have a 15-year life. Key managers can elect to receive up to 50% of the value of their option award in restricted stockunits (RSUs). Key manager RSUs are vested and settled in shares of common stock five years from the grant date. The awards provided to the Company’sdirectors are in the form of restricted stock and RSUs. In addition to our key manager and director grants, we make other minor stock option and RSU grants toemployees for which the terms are not substantially different.
A total of 229 million shares of common stock were authorized for issuance under stock-based compensation
* Amounts in millions of dollars except per share amounts or as otherwise specified.
- 19 -
Source: PROCTER & GAMBLE CO, 8-K, January 29, 2010 Powered by Morningstar® Document Research℠

plans approved by shareholders in 2001 and 2003, of which 12 million remain available for grant. An additional 20 million shares of common stock available forissuance under a plan approved by Gillette shareholders in 2004 were assumed by the Company in conjunction with the acquisition of Gillette. A total of10 million of these shares remain available for grant under this plan.
Total stock-based compensation expense for stock option grants was $460, $522 and $612 for 2009, 2008 and 2007, respectively. The total income tax benefitrecognized in the income statement for these stock-based compensation arrangements was $126, $141 and $163 for 2009, 2008 and 2007, respectively. Totalcompensation cost for restricted stock, RSUs and other stock-based grants was $56, $33 and $56 in 2009, 2008 and 2007, respectively.
In calculating the compensation expense for stock options granted, we utilize a binomial lattice-based valuation model. Assumptions utilized in the model, whichare evaluated and revised, as necessary, to reflect market conditions and experience, were as follows:
Years ended June 30 2009 2008 2007 Interest rate 0.7-3.8% 1.3-3.8% 4.3-4.8% Weighted average interest rate 3.6% 3.4% 4.5% Dividend yield 2.0% 1.9% 1.9% Expected volatility 18-34% 19-25% 16-20% Weighted average volatility 21% 20% 19%
Expected life in years 8.7 8.3 8.7
Because lattice-based option valuation models incorporate ranges of assumptions for inputs, those ranges are disclosed in the preceding table. Expectedvolatilities are based on a combination of historical volatility of our stock and implied volatilities of call options on our stock. We use historical data to estimateoption exercise and employee termination patterns within the valuation model. The expected life of options granted is derived from the output of the optionvaluation model and represents the average period of time that options granted are expected to be outstanding. The interest rate for periods within the contractuallife of the options is based on the U.S. Treasury yield curve in effect at the time of grant.
A summary of options outstanding under the plans as of June 30, 2009, and activity during the year then ended is presented below:
Options in thousands Options Weighted Avg.Exercise Price
Weighted Avg.Remaining
Contractual Life inYears
AggregateIntrinsic Value(in millions)
Outstanding, beginning of year 337,177 $ 48.25 Granted 37,623 50.30 Exercised (16,199) 39.45 Canceled (1,284) 57.62
OUTSTANDING, END OF YEAR 357,317 48.83 6.3 $ 2,084
EXERCISABLE 259,362 44.93 5.4 1,984
The weighted average grant-date fair value of options granted was $11.67, $15.91 and $17.29 per share in 2009, 2008 and 2007, respectively. The total intrinsicvalue of options exercised was $434, $1,129 and $894 in 2009, 2008 and 2007, respectively. The total grant-date fair value of options that vested during 2009,2008 and 2007 was $537, $532 and $552, respectively. We have no specific policy to repurchase common shares to mitigate the dilutive impact of options;however, we have historically made adequate discretionary purchases, based on cash availability, market trends and other factors, to satisfy stock option exerciseactivity.
* Amounts in millions of dollars except per share amounts or as otherwise specified.
- 20 -
Source: PROCTER & GAMBLE CO, 8-K, January 29, 2010 Powered by Morningstar® Document Research℠

At June 30, 2009, there was $524 of compensation cost that has not yet been recognized related to stock awards. That cost is expected to be recognized over aremaining weighted average period of 2.0 years.
Cash received from options exercised was $639, $1,837 and $1,422 in 2009, 2008 and 2007, respectively. The actual tax benefit realized for the tax deductionsfrom option exercises totaled $146, $318 and $265 in 2009, 2008 and 2007, respectively.
NOTE 8 POSTRETIREMENT BENEFITS AND EMPLOYEE STOCK OWNERSHIP PLAN
We offer various postretirement benefits to our employees.
Defined Contribution Retirement Plans
We have defined contribution plans which cover the majority of our U.S. employees, as well as employees in certain other countries. These plans are fullyfunded. We generally make contributions to participants’ accounts based on individual base salaries and years of service. Total global defined contributionexpense was $364, $290, and $273 in 2009, 2008 and 2007, respectively.
The primary U.S. defined contribution plan (the U.S. DC plan) comprises the majority of the balances and expense for the Company’s defined contribution plans.For the U.S. DC plan, the contribution rate is set annually. Total contributions for this plan approximated 15% of total participants’ annual wages and salaries in2009, 2008 and 2007.
We maintain The Procter & Gamble Profit Sharing Trust (Trust) and Employee Stock Ownership Plan (ESOP) to provide a portion of the funding for the U.S.DC plan, as well as other retiree benefits. Operating details of the ESOP are provided at the end of this Note. The fair value of the ESOP Series A sharesallocated to participants reduces our cash contribution required to fund the U.S. DC plan.
Defined Benefit Retirement Plans and Other Retiree Benefits
We offer defined benefit retirement pension plans to certain employees. These benefits relate primarily to local plans outside the U.S. and, to a lesser extent,plans assumed in the Gillette acquisition covering U.S. employees.
We also provide certain other retiree benefits, primarily health care and life insurance, for the majority of our U.S. employees who become eligible for thesebenefits when they meet minimum age and service requirements. Generally, the health care plans require cost sharing with retirees and pay a stated percentage ofexpenses, reduced by deductibles and other coverages. These benefits are primarily funded by ESOP Series B shares, as well as certain other assets contributedby the Company.
* Amounts in millions of dollars except per share amounts or as otherwise specified.
- 21 -
Source: PROCTER & GAMBLE CO, 8-K, January 29, 2010 Powered by Morningstar® Document Research℠

Obligation and Funded Status. We use a June 30 measurement date for our defined benefit retirement plans and other retiree benefit plans. The followingprovides a reconciliation of benefit obligations, plan assets and funded status of these plans:
Pension Benefits (1) Other Retiree Benefits (2) Years ended June 30 2009 2008 2009 2008 CHANGE IN BENEFIT OBLIGATION Benefit obligation at beginning of year (3) $ 10,095 $ 9,819 $ 3,553 $ 3,558 Service cost 214 263 91 95 Interest cost 551 539 243 226 Participants’ contributions 15 14 55 58 Amendments 47 52 — (11) Actuarial (gain) loss 456 (655) 186 (232) Acquisitions (divestitures) (3) (7) (17) 2 Curtailments and settlements 3 (68) — (3) Special termination benefits 3 1 16 2 Currency translation and other (867) 642 27 67 Benefit payments (498) (505) (226) (209)
BENEFIT OBLIGATION AT END OF YEAR (3) 10,016 10,095 3,928 3,553
CHANGE IN PLAN ASSETS Fair value of plan assets at beginning of year 7,225 7,350 3,225 3,390 Actual return on plan assets (401) (459) (678) (29) Acquisitions (divestitures) — — — — Employer contributions 657 507 18 21 Participants’ contributions 15 14 55 58 Currency translation and other (688) 318 (4) 1 ESOP debt impacts (4) — — 4 (7) Benefit payments (498) (505) (226) (209)
FAIR VALUE OF PLAN ASSETS AT END OF YEAR 6,310 7,225 2,394 3,225
FUNDED STATUS (3,706) (2,870) (1,534) (328)
(1) Primarily non-U.S.-based defined benefit retirement plans.
(2) Primarily U.S.-based other postretirement benefit plans.
(3) For the pension benefit plans, the benefit obligation is the projected benefit obligation. For other retiree benefit plans, the benefit obligation is theaccumulated postretirement benefit obligation.
(4) Represents the net impact of ESOP debt service requirements, which is netted against plan assets for Other Retiree Benefits.
* Amounts in millions of dollars except per share amounts or as otherwise specified.
- 22 -
Source: PROCTER & GAMBLE CO, 8-K, January 29, 2010 Powered by Morningstar® Document Research℠

Pension Benefits Other Retiree Benefits Years ended June 30 2009 2008 2009 2008 CLASSIFICATION OF NET AMOUNT RECOGNIZED Noncurrent assets $ 133 $ 321 $ — $ 200 Current liability (41) (45) (18) (16) Noncurrent liability (3,798) (3,146) (1,516) (512)
NET AMOUNT RECOGNIZED (3,706) (2,870) (1,534) (328)
AMOUNTS RECOGNIZED IN ACCUMULATED OTHER COMPREHENSIVEINCOME (AOCI)
Net actuarial loss 1,976 715 1,860 578 Prior service cost (credit) 227 213 (152) (175)
NET AMOUNTS RECOGNIZED IN AOCI 2,203 928 1,708 403
CHANGE IN PLAN ASSETS AND BENEFIT OBLIGATIONS RECOGNIZED INACCUMULATED OTHER COMPREHENSIVE INCOME (AOCI)
Net actuarial loss - current year 1,335 361 1,309 226 Prior service cost (credit) - current year 47 52 — (11) Amortization of net actuarial loss (29) (9) (2) (7) Amortization of prior service (cost) credit (14) (14) 23 21 Settlement / Curtailment cost — (32) — (2) Currency translation and other (64) 19 (25) 24
TOTAL CHANGE IN AOCI 1,275 377 1,305 251
NET AMOUNTS RECOGNIZED IN PERIODIC BENEFIT COST AND AOCI 1,616 609 1,088 33
The underfunding of pension benefits is primarily a function of the different funding incentives that exist outside of the U.S. In certain countries, there are nolegal requirements or financial incentives provided to companies to pre-fund pension obligations. In these instances, benefit payments are typically paid directlyfrom the Company’s cash as they become due.
The accumulated benefit obligation for all defined benefit retirement pension plans was $8,637 and $8,750 at June 30, 2009 and June 30, 2008, respectively.Pension plans with accumulated benefit obligations in excess of plan assets and plans with projected benefit obligations in excess of plan assets consist of thefollowing:
Accumulated Benefit ObligationExceeds the Fair Value of Plan
Assets
Projected Benefit ObligationExceeds the Fair Value of Plan
AssetsYears ended June 30 2009 2008 2009 2008Projected benefit obligation $ 6,509 $ 5,277 $ 9,033 $ 7,987Accumulated benefit obligation 5,808 4,658 7,703 6,737Fair value of plan assets 3,135 2,153 5,194 4,792
* Amounts in millions of dollars except per share amounts or as otherwise specified.
- 23 -
Source: PROCTER & GAMBLE CO, 8-K, January 29, 2010 Powered by Morningstar® Document Research℠
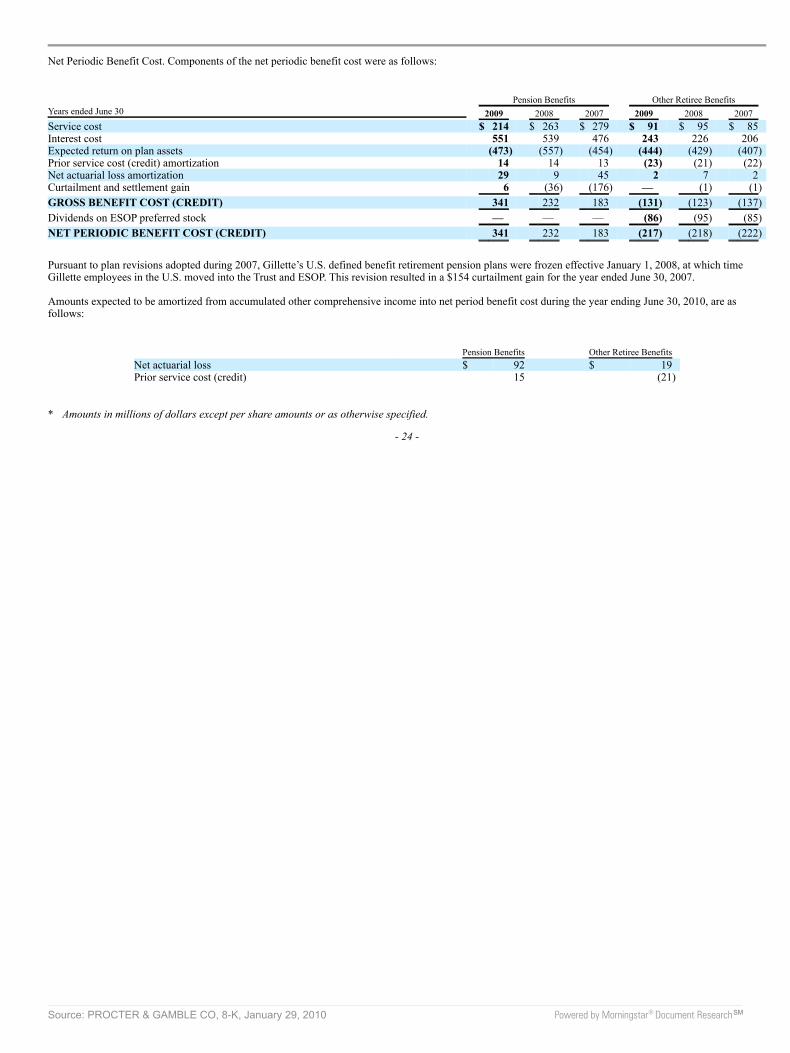
Net Periodic Benefit Cost. Components of the net periodic benefit cost were as follows:
Pension Benefits Other Retiree Benefits Years ended June 30 2009 2008 2007 2009 2008 2007 Service cost $ 214 $ 263 $ 279 $ 91 $ 95 $ 85 Interest cost 551 539 476 243 226 206 Expected return on plan assets (473) (557) (454) (444) (429) (407) Prior service cost (credit) amortization 14 14 13 (23) (21) (22) Net actuarial loss amortization 29 9 45 2 7 2 Curtailment and settlement gain 6 (36) (176) — (1) (1)
GROSS BENEFIT COST (CREDIT) 341 232 183 (131) (123) (137)
Dividends on ESOP preferred stock — — — (86) (95) (85)
NET PERIODIC BENEFIT COST (CREDIT) 341 232 183 (217) (218) (222)
Pursuant to plan revisions adopted during 2007, Gillette’s U.S. defined benefit retirement pension plans were frozen effective January 1, 2008, at which timeGillette employees in the U.S. moved into the Trust and ESOP. This revision resulted in a $154 curtailment gain for the year ended June 30, 2007.
Amounts expected to be amortized from accumulated other comprehensive income into net period benefit cost during the year ending June 30, 2010, are asfollows:
Pension Benefits Other Retiree Benefits Net actuarial loss $ 92 $ 19 Prior service cost (credit) 15 (21)
* Amounts in millions of dollars except per share amounts or as otherwise specified.
- 24 -
Source: PROCTER & GAMBLE CO, 8-K, January 29, 2010 Powered by Morningstar® Document Research℠

Assumptions. We determine our actuarial assumptions on an annual basis. These assumptions are weighted to reflect each country that may have an impact onthe cost of providing retirement benefits. The weighted average assumptions for the defined benefit and other retiree benefit calculations, as well as assumedhealth care trend rates, were as follows:
Pension Benefits Other Retiree Benefits Years ended June 30 2009 2008 2009 2008 ASSUMPTIONS USED TO DETERMINE BENEFIT OBLIGATIONS (1)
Discount rate 6.0% 6.3% 6.4% 6.9% Rate of compensation increase 3.7% 3.7% — —
ASSUMPTIONS USED TO DETERMINE NET PERIODIC BENEFIT COST (2) Discount rate 6.3% 5.5% 6.9% 6.3% Expected return on plan assets 7.4% 7.4% 9.3% 9.3% Rate of compensation increase 3.7% 3.1% — —
ASSUMED HEALTH CARE COST TREND RATES Health care cost trend rates assumed for next year — — 8.5% 8.6% Rate to which the health care cost trend rate is assumed to decline (ultimate trend
rate) — — 5.0% 5.1% Year that the rate reaches the ultimate trend rate — — 2016 2015
(1) Determined as of end of year.
(2) Determined as of beginning of year and adjusted for acquisitions.
Several factors are considered in developing the estimate for the long-term expected rate of return on plan assets. For the defined benefit retirement plans, theseinclude historical rates of return of broad equity and bond indices and projected long-term rates of return obtained from pension investment consultants. Theexpected long-term rates of return for plan assets are 8%-9% for equities and 5%-6% for bonds. For other retiree benefit plans, the expected long-term rate ofreturn reflects the fact that the assets are comprised primarily of Company stock. The expected rate of return on Company stock is based on the long-termprojected return of 9.5% and reflects the historical pattern of favorable returns.
Assumed health care cost trend rates could have a significant effect on the amounts reported for the other retiree benefit plans. A one-percentage point change inassumed health care cost trend rates would have the following effects:
One-PercentagePoint Increase
One-PercentagePoint Decrease
Effect on total of service and interest cost components $ 58 $ (46) Effect on postretirement benefit obligation 549 (447)
Plan Assets. Our target asset allocation for the year ended June 30, 2009, and actual asset allocation by asset category as of June 30, 2009 and 2008, were asfollows:
* Amounts in millions of dollars except per share amounts or as otherwise specified.
- 25 -
Source: PROCTER & GAMBLE CO, 8-K, January 29, 2010 Powered by Morningstar® Document Research℠
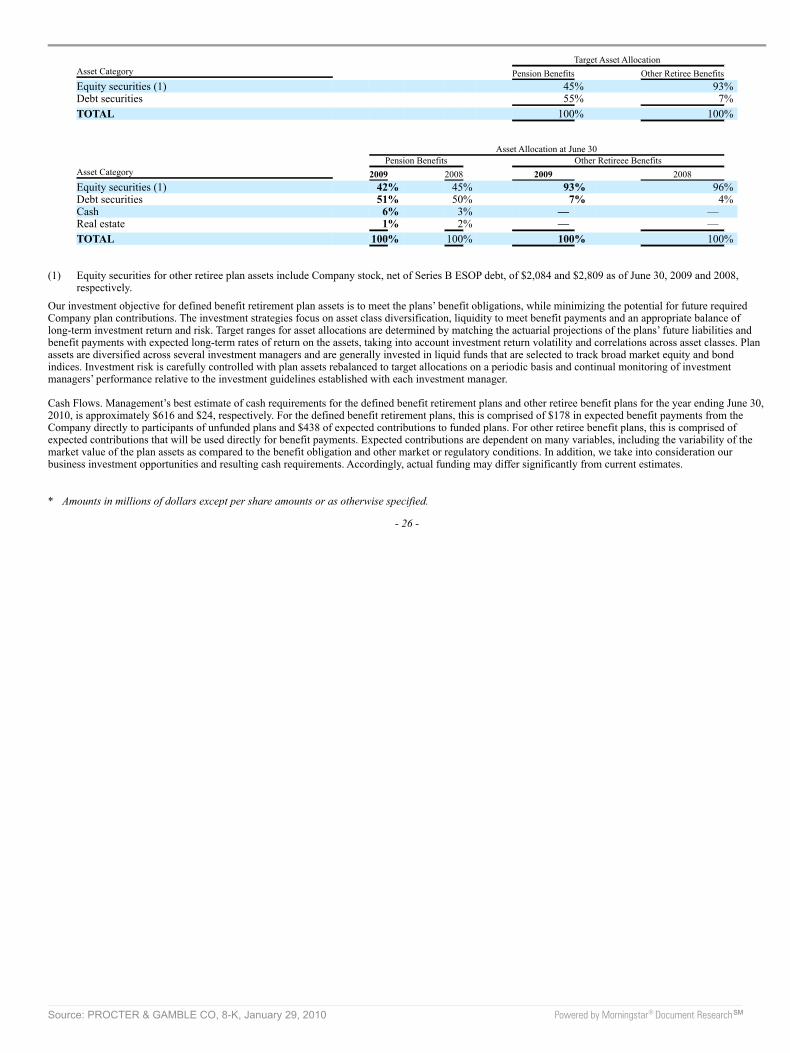
Target Asset Allocation Asset Category Pension Benefits Other Retiree Benefits Equity securities (1) 45% 93% Debt securities 55% 7%
TOTAL 100% 100%
Asset Allocation at June 30 Pension Benefits Other Retireee Benefits Asset Category 2009 2008 2009 2008 Equity securities (1) 42% 45% 93% 96% Debt securities 51% 50% 7% 4% Cash 6% 3% — — Real estate 1% 2% — —
TOTAL 100% 100% 100% 100%
(1) Equity securities for other retiree plan assets include Company stock, net of Series B ESOP debt, of $2,084 and $2,809 as of June 30, 2009 and 2008,respectively.
Our investment objective for defined benefit retirement plan assets is to meet the plans’ benefit obligations, while minimizing the potential for future requiredCompany plan contributions. The investment strategies focus on asset class diversification, liquidity to meet benefit payments and an appropriate balance oflong-term investment return and risk. Target ranges for asset allocations are determined by matching the actuarial projections of the plans’ future liabilities andbenefit payments with expected long-term rates of return on the assets, taking into account investment return volatility and correlations across asset classes. Planassets are diversified across several investment managers and are generally invested in liquid funds that are selected to track broad market equity and bondindices. Investment risk is carefully controlled with plan assets rebalanced to target allocations on a periodic basis and continual monitoring of investmentmanagers’ performance relative to the investment guidelines established with each investment manager.
Cash Flows. Management’s best estimate of cash requirements for the defined benefit retirement plans and other retiree benefit plans for the year ending June 30,2010, is approximately $616 and $24, respectively. For the defined benefit retirement plans, this is comprised of $178 in expected benefit payments from theCompany directly to participants of unfunded plans and $438 of expected contributions to funded plans. For other retiree benefit plans, this is comprised ofexpected contributions that will be used directly for benefit payments. Expected contributions are dependent on many variables, including the variability of themarket value of the plan assets as compared to the benefit obligation and other market or regulatory conditions. In addition, we take into consideration ourbusiness investment opportunities and resulting cash requirements. Accordingly, actual funding may differ significantly from current estimates.
* Amounts in millions of dollars except per share amounts or as otherwise specified.
- 26 -
Source: PROCTER & GAMBLE CO, 8-K, January 29, 2010 Powered by Morningstar® Document Research℠

Total benefit payments expected to be paid to participants, which include payments funded from the Company’s assets, as discussed above, as well as paymentsfrom the plans, are as follows:
Years ending June 30 Pension Benefits Other Retiree BenefitsEXPECTED BENEFIT PAYMENTS 2010 $ 499 $ 1842011 496 2012012 507 2172013 525 2322014 552 2472015-2019 3,096 1,453
Employee Stock Ownership Plan
We maintain the ESOP to provide funding for certain employee benefits discussed in the preceding paragraphs.
The ESOP borrowed $1.0 billion in 1989 and the proceeds were used to purchase Series A ESOP Convertible Class A Preferred Stock to fund a portion of theU.S. DC plan. Principal and interest requirements of the borrowing were paid by the Trust from dividends on the preferred shares and from advances provided bythe Company. The original borrowing of $1.0 billion has been repaid in full, and advances from the Company of $178 remain outstanding at June 30, 2009. Eachshare is convertible at the option of the holder into one share of the Company’s common stock. The dividend for the current year was equal to the common stockdividend of $1.64 per share. The liquidation value is $6.82 per share.
In 1991, the ESOP borrowed an additional $1.0 billion. The proceeds were used to purchase Series B ESOP Convertible Class A Preferred Stock to fund aportion of retiree health care benefits. These shares, net of the ESOP’s debt, are considered plan assets of the Other Retiree Benefits plan discussed above. Debtservice requirements are funded by preferred stock dividends, cash contributions and advances provided by the Company, of which $266 is outstanding atJune 30, 2009. Each share is convertible at the option of the holder into one share of the Company’s common stock. The dividend for the current year was equalto the common stock dividend of $1.64 per share. The liquidation value is $12.96 per share.
Our ESOP accounting practices are consistent with current ESOP accounting guidance, including the permissible continuation of certain provisions from prioraccounting guidance. ESOP debt, which is guaranteed by the Company, is recorded as debt (see Note 4) with an offset to the Reserve for ESOP Debt Retirement,which is presented within Shareholders’ Equity. Advances to the ESOP by the Company are recorded as an increase in the Reserve for ESOP Debt Retirement.Interest incurred on the ESOP debt is recorded as interest expense. Dividends on all preferred shares, net of related tax benefits, are charged to retained earnings.
The series A and B preferred shares of the ESOP are allocated to employees based on debt service requirements, net of advances made by the Company to theTrust. The number of preferred shares outstanding at June 30 was as follows:
Shares in thousands 2009 2008 2007Allocated 56,818 58,557 60,402Unallocated 16,651 18,665 20,807
TOTAL SERIES A 73,469 77,222 81,209
Allocated 20,991 21,134 21,105Unallocated 42,522 43,618 44,642
TOTAL SERIES B 63,513 64,752 65,747
For purposes of calculating diluted net earnings per common share, the preferred shares held by the ESOP are considered converted from inception.
* Amounts in millions of dollars except per share amounts or as otherwise specified.
- 27 -
Source: PROCTER & GAMBLE CO, 8-K, January 29, 2010 Powered by Morningstar® Document Research℠

In connection with the Gillette acquisition, we assumed the Gillette ESOP, which was established to assist Gillette employees in financing retiree medical costs.These ESOP accounts are held by participants and must be used to reduce the Company’s other retiree benefit obligations. Such accounts reduced our obligationby $171 at June 30, 2009.
NOTE 9 INCOME TAXES
Income taxes are recognized for the amount of taxes payable for the current year and for the impact of deferred tax liabilities and assets, which represent futuretax consequences of events that have been recognized differently in the financial statements than for tax purposes. Deferred tax assets and liabilities areestablished using the enacted statutory tax rates and are adjusted for any changes in such rates in the period of change.
Earnings from continuing operations before income taxes consisted of the following:
Years ended June 30 2009 2008 2007United States $ 8,409 $ 8,167 $ 8,268International 6,004 6,718 5,394
TOTAL 14,413 14,885 13,662
The provision for income taxes on continuing operations consisted of the following:
Years ended June 30 2009 2008 2007CURRENT TAX EXPENSE U.S. federal $ 1,619 $ 670 $ 2,354International 1,268 1,515 1,294U.S. state and local 229 188 91
3,116 2,373 3,739
DEFERRED TAX EXPENSE U.S. federal 595 1,272 240International and other 22 (51) 21
617 1,221 261
TOTAL TAX EXPENSE 3,733 3,594 4,000
A reconciliation of the U.S. federal statutory income tax rate to our actual income tax rate on continuing operations is provided below:
Years ended June 30 2009 2008 2007 U.S. federal statutory income tax rate 35.0% 35.0% 35.0% Country mix impacts of foreign operations -7.1% -6.8% -4.5% Income tax reserve adjustments -1.3% -3.4% -0.3% Other -0.7% -0.7% -0.9%
EFFECTIVE INCOME TAX RATE 25.9% 24.1% 29.3%
Income tax reserve adjustments represent changes in our net liability for unrecognized tax benefits related to prior year tax positions.
* Amounts in millions of dollars except per share amounts or as otherwise specified.
- 28 -
Source: PROCTER & GAMBLE CO, 8-K, January 29, 2010 Powered by Morningstar® Document Research℠
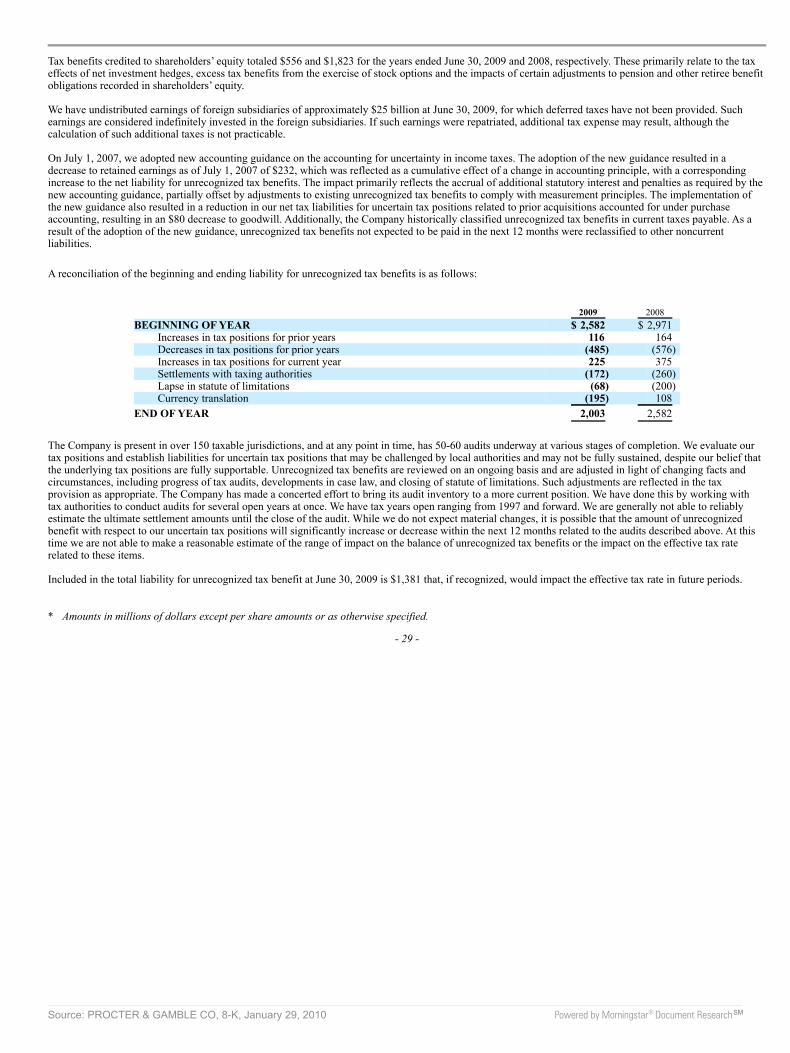
Tax benefits credited to shareholders’ equity totaled $556 and $1,823 for the years ended June 30, 2009 and 2008, respectively. These primarily relate to the taxeffects of net investment hedges, excess tax benefits from the exercise of stock options and the impacts of certain adjustments to pension and other retiree benefitobligations recorded in shareholders’ equity.
We have undistributed earnings of foreign subsidiaries of approximately $25 billion at June 30, 2009, for which deferred taxes have not been provided. Suchearnings are considered indefinitely invested in the foreign subsidiaries. If such earnings were repatriated, additional tax expense may result, although thecalculation of such additional taxes is not practicable.
On July 1, 2007, we adopted new accounting guidance on the accounting for uncertainty in income taxes. The adoption of the new guidance resulted in adecrease to retained earnings as of July 1, 2007 of $232, which was reflected as a cumulative effect of a change in accounting principle, with a correspondingincrease to the net liability for unrecognized tax benefits. The impact primarily reflects the accrual of additional statutory interest and penalties as required by thenew accounting guidance, partially offset by adjustments to existing unrecognized tax benefits to comply with measurement principles. The implementation ofthe new guidance also resulted in a reduction in our net tax liabilities for uncertain tax positions related to prior acquisitions accounted for under purchaseaccounting, resulting in an $80 decrease to goodwill. Additionally, the Company historically classified unrecognized tax benefits in current taxes payable. As aresult of the adoption of the new guidance, unrecognized tax benefits not expected to be paid in the next 12 months were reclassified to other noncurrentliabilities.
A reconciliation of the beginning and ending liability for unrecognized tax benefits is as follows:
2009 2008 BEGINNING OF YEAR $ 2,582 $ 2,971
Increases in tax positions for prior years 116 164 Decreases in tax positions for prior years (485) (576) Increases in tax positions for current year 225 375 Settlements with taxing authorities (172) (260) Lapse in statute of limitations (68) (200) Currency translation (195) 108
END OF YEAR 2,003 2,582
The Company is present in over 150 taxable jurisdictions, and at any point in time, has 50-60 audits underway at various stages of completion. We evaluate ourtax positions and establish liabilities for uncertain tax positions that may be challenged by local authorities and may not be fully sustained, despite our belief thatthe underlying tax positions are fully supportable. Unrecognized tax benefits are reviewed on an ongoing basis and are adjusted in light of changing facts andcircumstances, including progress of tax audits, developments in case law, and closing of statute of limitations. Such adjustments are reflected in the taxprovision as appropriate. The Company has made a concerted effort to bring its audit inventory to a more current position. We have done this by working withtax authorities to conduct audits for several open years at once. We have tax years open ranging from 1997 and forward. We are generally not able to reliablyestimate the ultimate settlement amounts until the close of the audit. While we do not expect material changes, it is possible that the amount of unrecognizedbenefit with respect to our uncertain tax positions will significantly increase or decrease within the next 12 months related to the audits described above. At thistime we are not able to make a reasonable estimate of the range of impact on the balance of unrecognized tax benefits or the impact on the effective tax raterelated to these items.
Included in the total liability for unrecognized tax benefit at June 30, 2009 is $1,381 that, if recognized, would impact the effective tax rate in future periods.
* Amounts in millions of dollars except per share amounts or as otherwise specified.
- 29 -
Source: PROCTER & GAMBLE CO, 8-K, January 29, 2010 Powered by Morningstar® Document Research℠

We recognize accrued interest and penalties related to unrecognized tax benefits in income tax expense. As of June 30, 2009 and 2008, we had accrued interest of$636 and $656 and penalties of $100 and $155, respectively, that are not included in the above table. During the fiscal years ended June 30, 2009 and 2008, werecognized $119 and $213 in interest and $(4) and $35 in penalties, respectively.
Deferred income tax assets and liabilities were comprised of the following:
June 30 2009 2008 DEFERRED TAX ASSETS
Pension and postretirement benefits $ 1,395 $ 633 Stock-based compensation 1,182 1,082 Unrealized loss on financial and foreign exchange transactions 577 1,274 Loss and other carryforwards 439 482 Goodwill and other intangible assets 331 267 Accrued marketing and promotion expense 167 125 Accrued interest and taxes 120 123 Fixed assets 114 100 Inventory 97 114 Advance payments 15 302 Other 885 1,048 Valuation allowances (104) (173)
TOTAL 5,218 5,377
DEFERRED TAX LIABILITIES Goodwill and other intangible assets 11,922 12,371 Fixed assets 1,654 1,847 Other 146 151
TOTAL 13,722 14,369
Net operating loss carryforwards were $1,428 and $1,515 at June 30, 2009 and 2008, respectively. If unused, $462 will expire between 2010 and 2029. Theremainder, totaling $966 at June 30, 2009, may be carried forward indefinitely.
NOTE 10 COMMITMENTS AND CONTINGENCIES
Guarantees
In conjunction with certain transactions, primarily divestitures, we may provide routine indemnifications (e.g., indemnification for representations and warrantiesand retention of previously existing environmental, tax and employee liabilities) which terms range in duration and in some circumstances are not explicitlydefined. The maximum obligation under some indemnifications is also not explicitly stated and, as a result, the overall amount of these obligations cannot bereasonably estimated. Other than obligations recorded as liabilities at the time of divestiture, we have not made significant payments for these indemnifications.We believe that if we were to incur a loss on any of these matters, the loss would not have a material effect on our financial position, results of operations or cashflows.
* Amounts in millions of dollars except per share amounts or as otherwise specified.
- 30 -
Source: PROCTER & GAMBLE CO, 8-K, January 29, 2010 Powered by Morningstar® Document Research℠

In certain situations, we guarantee loans for suppliers and customers. The total amount of guarantees issued under such arrangements is not material.
Off-Balance Sheet Arrangements
We do not have off-balance sheet financing arrangements, including variable interest entities, that have a material impact on our financial statements.
Purchase Commitments
We have purchase commitments for materials, supplies, services and property, plant and equipment as part of the normal course of business. Commitments madeunder take-or-pay obligations are as follows: 2010 - $1,258; 2011 - $872; 2012 - $787; 2013 - $525; 2014 - $156; and $299 thereafter. Such amounts representfuture purchases in line with expected usage to obtain favorable pricing. Approximately 43% of our purchase commitments relate to service contracts forinformation technology, human resources management and facilities management activities that have been outsourced to third-party suppliers. Due to theproprietary nature of many of our materials and processes, certain supply contracts contain penalty provisions for early termination. We do not expect to incurpenalty payments under these provisions that would materially affect our financial position, results of operations or cash flows.
Operating Leases
We lease certain property and equipment for varying periods. Future minimum rental commitments under noncancelable operating leases are as follows: 2010 -$305; 2011 - $272; 2012 - $223; 2013 - $202; 2014 - $176; and $442 thereafter. Operating lease obligations are shown net of guaranteed sublease income.
Litigation
We are subject to various legal proceedings and claims arising out of our business which cover a wide range of matters such as governmental regulations,antitrust and trade regulations, product liability, patent and trademark matters, income taxes and other actions.
As previously disclosed, the Company is subject to a variety of investigations into potential competition law violations in Europe, including investigationsinitiated in the fourth quarter of fiscal 2008 by the European Commission with the assistance of national authorities from a variety of countries. We believe thesematters involve a number of other consumer products companies and/or retail customers. The Company’s policy is to comply with all laws and regulations,including all antitrust and competition laws, and to cooperate with investigations by relevant regulatory authorities, which the Company is doing. Competitionand antitrust law inquiries often continue for several years and, if violations are found, can result in substantial fines. In other industries, fines have amounted tohundreds of millions of dollars. At this point, no significant formal claims have been made against the Company or any of our subsidiaries in connection with anyof the above inquiries.
In response to the actions of the European Commission and national authorities, the Company has launched its own internal investigations into potentialviolations of competition laws, some of which are ongoing. The Company has identified violations in certain European countries and appropriate actions arebeing taken. It is still too early for us to reasonably estimate the fines to which the Company will be subject as a result of these competition law issues. However,the ultimate resolution of these matters will likely result in fines or other costs that could materially impact our income statement and cash flows in the period inwhich they are accrued and paid, respectively. As these matters evolve the Company will, if necessary, recognize the appropriate reserves.
* Amounts in millions of dollars except per share amounts or as otherwise specified.
- 31 -
Source: PROCTER & GAMBLE CO, 8-K, January 29, 2010 Powered by Morningstar® Document Research℠
With respect to other litigation and claims, while considerable uncertainty exists, in the opinion of management and our counsel, the ultimate resolution of thevarious lawsuits and claims will not materially affect our financial position, results of operations or cash flows.
We are also subject to contingencies pursuant to environmental laws and regulations that in the future may require us to take action to correct the effects on theenvironment of prior manufacturing and waste disposal practices. Based on currently available information, we do not believe the ultimate resolution ofenvironmental remediation will have a material adverse effect on our financial position, results of operations or cash flows.
NOTE 11 SEGMENT INFORMATION
Effective July 1, 2009, the Company implemented a number of changes to the organization structure of the Beauty GBU, which resulted in changes to thecomponents of its reportable segment structure. The following discussion and segment information reflect the organizational changes for all periods presented.We are organized under three GBUs as follows:
• The Beauty and Grooming GBU includes the Beauty and the Grooming businesses. The Beauty business is comprised of female beauty products includingcosmetics, deodorants, female blades and razors, personal cleansing and skin care, as well as hair care retail and salon professional and prestige fragrances.The Grooming business includes electric hair removal devices, home appliances, male blades and razors and male personal care products includingdeodorants, face and shave products, hair care and personal cleansing.
• The Health and Well-Being GBU includes the Health Care and the Snacks and Pet Care businesses. The Health Care business includes feminine care, oralcare and personal health care. The Snacks and Pet Care business includes pet food and snacks.
• The Household Care GBU includes the Fabric Care and Home Care as well as the Baby Care and Family Care businesses. The Fabric Care and Home Carebusiness includes air care, batteries, dish care, fabric care and surface care. The Baby Care and Family Care business includes baby wipes, bath tissue,diapers, facial tissue and paper towels.
Under U.S. GAAP, we have six reportable segments: Beauty; Grooming; Health Care; Snacks and Pet Care; Fabric Care and Home Care; and Baby Care andFamily Care. The accounting policies of the businesses are generally the same as those described in Note 1. Differences between these policies and U.S. GAAPprimarily reflect: income taxes, which are reflected in the businesses using applicable blended statutory rates; the recording of fixed assets at historical exchangerates in certain high-inflation economies; and the treatment of certain unconsolidated investees. Certain unconsolidated investees are managed as integral parts ofour business units for management reporting purposes. Accordingly, these partially owned operations are reflected as consolidated subsidiaries in segmentresults, with 100% recognition of the individual income statement line items through before-tax earnings. Eliminations to adjust these line items to U.S. GAAPare included in Corporate. In determining after-tax earnings for the businesses, we eliminate the share of earnings applicable to other ownership interests, in amanner similar to minority interest and apply statutory tax rates. Adjustments to arrive at our effective tax rate are also included in Corporate.
Corporate includes certain operating and non-operating activities that are not reflected in the operating results used internally to measure and evaluate thebusinesses, as well as eliminations to adjust management reporting principles to U.S. GAAP. Operating activities in Corporate include the results of incidentalbusinesses managed at the corporate level along with the elimination of individual revenues and expenses generated by certain unconsolidated investeesdiscussed in the preceding paragraph over which we exert significant influence, but do not control. Operating elements also include certain employee benefitcosts, the costs of certain restructuring-type activities to maintain a competitive cost structure, including manufacturing and workforce rationalization and othergeneral Corporate items. The non-operating elements in Corporate primarily include interest expense, divestiture gains and interest and investing income. Inaddition, Corporate includes the historical results of certain divested businesses. Corporate assets primarily include cash, investment securities and all goodwill.
* Amounts in millions of dollars except per share amounts or as otherwise specified.
- 32 -
Source: PROCTER & GAMBLE CO, 8-K, January 29, 2010 Powered by Morningstar® Document Research℠

The Company had net sales in the U.S. of $29.6 billion, $29.7 billion and $28.8 billion for the years ended June 30, 2009, 2008 and 2007, respectively. Assets inthe U.S. totaled $71.9 billion and $73.8 billion as of June 30, 2009 and 2008, respectively.
Our largest customer, Wal-Mart Stores, Inc. and its affiliates, accounted for 16% of consolidated net sales in 2009, 2008 and 2007.
Global Segment Results Net Sales
Earnings fromContinuingOperations
BeforeIncome Taxes
Net Earningsfrom
ContinuingOperations
Depreciationand
Amortization Total Assets Capital
ExpendituresBEAUTY AND GROOMING GBU
BEAUTY 2009 $ 18,924 $ 3,558 $ 2,664 $ 454 $ 14,392 $ 526 2008 19,666 3,673 2,827 450 15,324 462 2007 17,993 3,553 2,695 426 14,327 435
GROOMING 2009 7,408 1,900 1,359 721 23,130 294 2008 8,103 2,154 1,582 743 24,342 308 2007 7,333 1,782 1,299 722 24,580 310
HEALTH AND WELL-BEING GBU HEALTH CARE 2009 11,288 2,786 1,835 369 8,430 372
2008 12,087 3,030 2,021 372 9,479 420 2007 10,990 2,773 1,838 361 8,373 333
SNACKS AND PET CARE 2009 3,114 388 234 100 1,382 72 2008 3,204 409 261 102 1,651 78 2007 2,985 381 244 121 1,570 94
HOUSEHOLD CARE GBU FABRIC CARE AND HOME CARE 2009 23,186 4,663 3,032 578 12,457 808
2008 23,714 5,060 3,411 599 13,708 763 2007 21,355 4,636 3,119 567 12,113 706
BABY CARE AND FAMILY CARE 2009 14,103 2,827 1,770 570 7,363 902 2008 13,898 2,700 1,728 612 8,102 763 2007 12,726 2,291 1,440 671 7,731 769
CORPORATE (1) 2009 (1,329) (1,709) (214) 224 67,679 264 2008 (1,415) (2,141) (539) 181 71,386 252 2007 (941) (1,754) (973) 135 69,320 298
TOTAL COMPANY 2009 76,694 14,413 10,680 3,016 134,833 3,238 2008 79,257 14,885 11,291 3,059 143,992 3,046 2007 72,441 13,662 9,662 3,003 138,014 2,945
(1) The Corporate reportable segment includes the total assets and capital expenditures of the coffee and pharmaceuticals businesses prior to their divestituresin November 2008 and October 2009, respectively.
NOTE 12 DISCONTINUED OPERATIONS
In October 2009, the Company completed the divestiture of our global pharmaceuticals business to Warner Chilcott plc (Warner Chilcott) for $2.8 billion ofcash, net of assumed and transferred liabilities. Under the terms of the agreement, Warner Chilcott acquired our portfolio of branded pharmaceutical products,our prescription drug product pipeline and manufacturing facilities in Puerto Rico and Germany. In addition, the majority of the 2,300 employees working on thepharmaceuticals business were transferred to Warner Chilcott.
The pharmaceuticals business had historically been part of the Company’s Health Care reportable segment. In accordance with the applicable accountingguidance for the disposal of long-lived assets, the results of the pharmaceuticals business are presented as discontinued operations and, as such, have beenexcluded from both continuing operations and segment results for all periods presented.
* Amounts in millions of dollars except per share amounts or as otherwise specified.
- 33 -
Source: PROCTER & GAMBLE CO, 8-K, January 29, 2010 Powered by Morningstar® Document Research℠
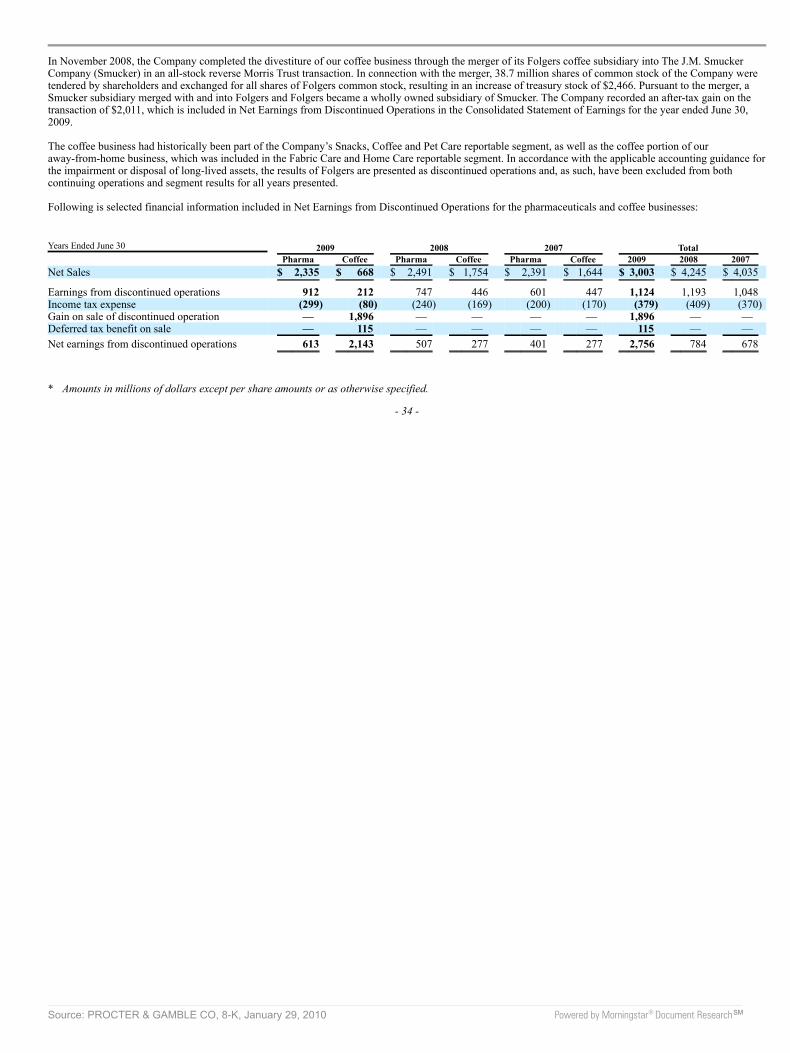
In November 2008, the Company completed the divestiture of our coffee business through the merger of its Folgers coffee subsidiary into The J.M. SmuckerCompany (Smucker) in an all-stock reverse Morris Trust transaction. In connection with the merger, 38.7 million shares of common stock of the Company weretendered by shareholders and exchanged for all shares of Folgers common stock, resulting in an increase of treasury stock of $2,466. Pursuant to the merger, aSmucker subsidiary merged with and into Folgers and Folgers became a wholly owned subsidiary of Smucker. The Company recorded an after-tax gain on thetransaction of $2,011, which is included in Net Earnings from Discontinued Operations in the Consolidated Statement of Earnings for the year ended June 30,2009.
The coffee business had historically been part of the Company’s Snacks, Coffee and Pet Care reportable segment, as well as the coffee portion of ouraway-from-home business, which was included in the Fabric Care and Home Care reportable segment. In accordance with the applicable accounting guidance forthe impairment or disposal of long-lived assets, the results of Folgers are presented as discontinued operations and, as such, have been excluded from bothcontinuing operations and segment results for all years presented.
Following is selected financial information included in Net Earnings from Discontinued Operations for the pharmaceuticals and coffee businesses:
Years Ended June 30 2009 2008 2007 Total Pharma Coffee Pharma Coffee Pharma Coffee 2009 2008 2007 Net Sales $ 2,335 $ 668 $ 2,491 $ 1,754 $ 2,391 $ 1,644 $ 3,003 $ 4,245 $ 4,035
Earnings from discontinued operations 912 212 747 446 601 447 1,124 1,193 1,048 Income tax expense (299) (80) (240) (169) (200) (170) (379) (409) (370) Gain on sale of discontinued operation — 1,896 — — — — 1,896 — — Deferred tax benefit on sale — 115 — — — — 115 — —
Net earnings from discontinued operations 613 2,143 507 277 401 277 2,756 784 678
* Amounts in millions of dollars except per share amounts or as otherwise specified.
- 34 -
Source: PROCTER & GAMBLE CO, 8-K, January 29, 2010 Powered by Morningstar® Document Research℠
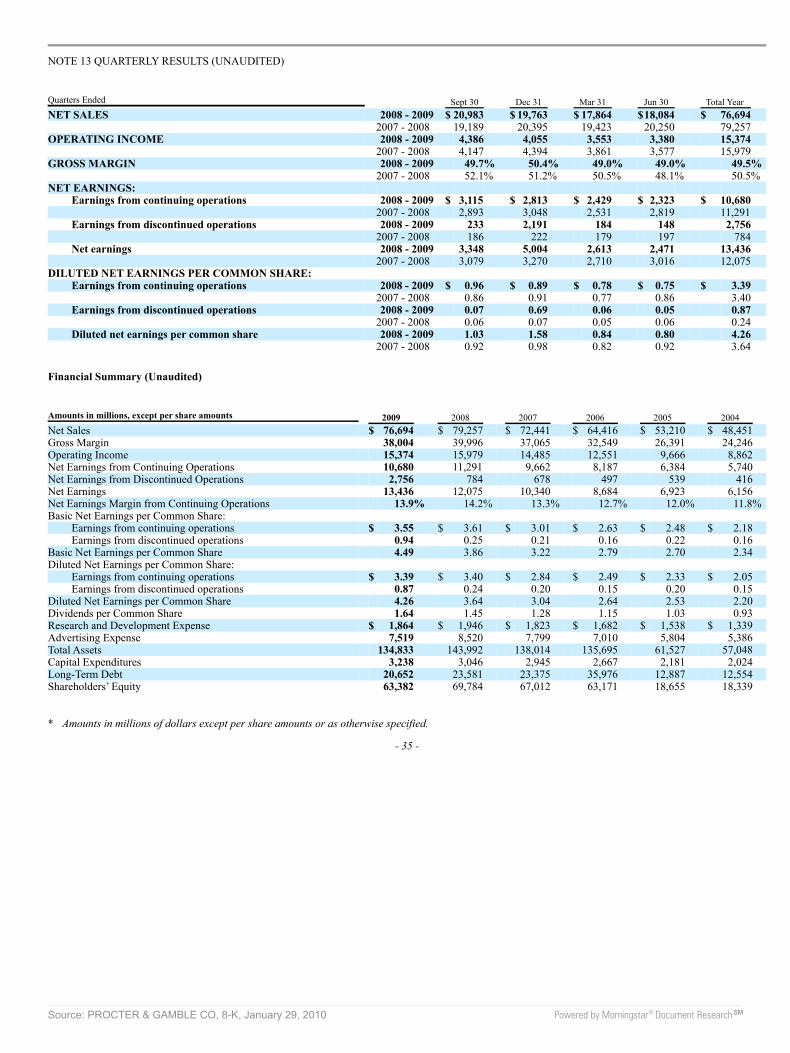
NOTE 13 QUARTERLY RESULTS (UNAUDITED)
Quarters Ended Sept 30 Dec 31 Mar 31 Jun 30 Total Year NET SALES 2008 - 2009 $ 20,983 $ 19,763 $ 17,864 $18,084 $ 76,694
2007 - 2008 19,189 20,395 19,423 20,250 79,257 OPERATING INCOME 2008 - 2009 4,386 4,055 3,553 3,380 15,374
2007 - 2008 4,147 4,394 3,861 3,577 15,979 GROSS MARGIN 2008 - 2009 49.7% 50.4% 49.0% 49.0% 49.5%
2007 - 2008 52.1% 51.2% 50.5% 48.1% 50.5% NET EARNINGS:
Earnings from continuing operations 2008 - 2009 $ 3,115 $ 2,813 $ 2,429 $ 2,323 $ 10,680 2007 - 2008 2,893 3,048 2,531 2,819 11,291
Earnings from discontinued operations 2008 - 2009 233 2,191 184 148 2,756 2007 - 2008 186 222 179 197 784
Net earnings 2008 - 2009 3,348 5,004 2,613 2,471 13,436 2007 - 2008 3,079 3,270 2,710 3,016 12,075
DILUTED NET EARNINGS PER COMMON SHARE: Earnings from continuing operations 2008 - 2009 $ 0.96 $ 0.89 $ 0.78 $ 0.75 $ 3.39
2007 - 2008 0.86 0.91 0.77 0.86 3.40 Earnings from discontinued operations 2008 - 2009 0.07 0.69 0.06 0.05 0.87
2007 - 2008 0.06 0.07 0.05 0.06 0.24 Diluted net earnings per common share 2008 - 2009 1.03 1.58 0.84 0.80 4.26
2007 - 2008 0.92 0.98 0.82 0.92 3.64
Financial Summary (Unaudited)
Amounts in millions, except per share amounts 2009 2008 2007 2006 2005 2004 Net Sales $ 76,694 $ 79,257 $ 72,441 $ 64,416 $ 53,210 $ 48,451 Gross Margin 38,004 39,996 37,065 32,549 26,391 24,246 Operating Income 15,374 15,979 14,485 12,551 9,666 8,862 Net Earnings from Continuing Operations 10,680 11,291 9,662 8,187 6,384 5,740 Net Earnings from Discontinued Operations 2,756 784 678 497 539 416 Net Earnings 13,436 12,075 10,340 8,684 6,923 6,156 Net Earnings Margin from Continuing Operations 13.9% 14.2% 13.3% 12.7% 12.0% 11.8% Basic Net Earnings per Common Share:
Earnings from continuing operations $ 3.55 $ 3.61 $ 3.01 $ 2.63 $ 2.48 $ 2.18 Earnings from discontinued operations 0.94 0.25 0.21 0.16 0.22 0.16
Basic Net Earnings per Common Share 4.49 3.86 3.22 2.79 2.70 2.34 Diluted Net Earnings per Common Share:
Earnings from continuing operations $ 3.39 $ 3.40 $ 2.84 $ 2.49 $ 2.33 $ 2.05 Earnings from discontinued operations 0.87 0.24 0.20 0.15 0.20 0.15
Diluted Net Earnings per Common Share 4.26 3.64 3.04 2.64 2.53 2.20 Dividends per Common Share 1.64 1.45 1.28 1.15 1.03 0.93 Research and Development Expense $ 1,864 $ 1,946 $ 1,823 $ 1,682 $ 1,538 $ 1,339 Advertising Expense 7,519 8,520 7,799 7,010 5,804 5,386 Total Assets 134,833 143,992 138,014 135,695 61,527 57,048 Capital Expenditures 3,238 3,046 2,945 2,667 2,181 2,024 Long-Term Debt 20,652 23,581 23,375 35,976 12,887 12,554 Shareholders’ Equity 63,382 69,784 67,012 63,171 18,655 18,339
* Amounts in millions of dollars except per share amounts or as otherwise specified.
- 35 -
Source: PROCTER & GAMBLE CO, 8-K, January 29, 2010 Powered by Morningstar® Document Research℠
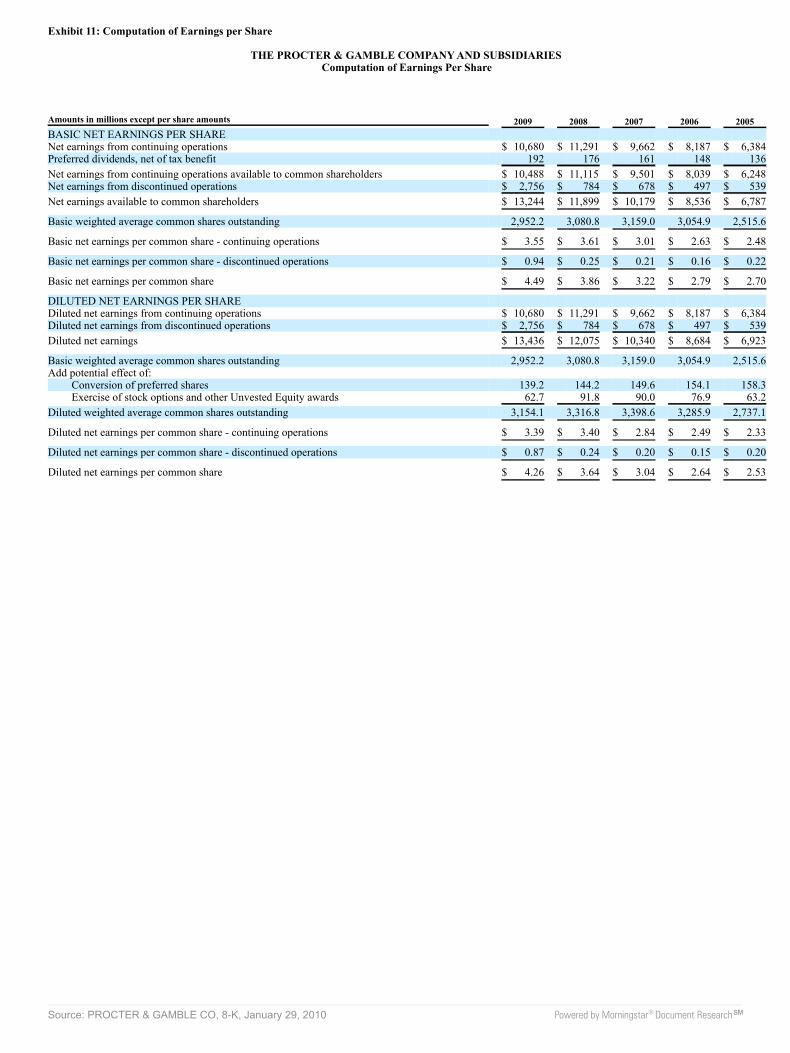
Exhibit 11: Computation of Earnings per Share
THE PROCTER & GAMBLE COMPANY AND SUBSIDIARIESComputation of Earnings Per Share
Amounts in millions except per share amounts 2009 2008 2007 2006 2005BASIC NET EARNINGS PER SHARE Net earnings from continuing operations $ 10,680 $ 11,291 $ 9,662 $ 8,187 $ 6,384Preferred dividends, net of tax benefit 192 176 161 148 136
Net earnings from continuing operations available to common shareholders $ 10,488 $ 11,115 $ 9,501 $ 8,039 $ 6,248Net earnings from discontinued operations $ 2,756 $ 784 $ 678 $ 497 $ 539
Net earnings available to common shareholders $ 13,244 $ 11,899 $ 10,179 $ 8,536 $ 6,787
Basic weighted average common shares outstanding 2,952.2 3,080.8 3,159.0 3,054.9 2,515.6
Basic net earnings per common share - continuing operations $ 3.55 $ 3.61 $ 3.01 $ 2.63 $ 2.48
Basic net earnings per common share - discontinued operations $ 0.94 $ 0.25 $ 0.21 $ 0.16 $ 0.22
Basic net earnings per common share $ 4.49 $ 3.86 $ 3.22 $ 2.79 $ 2.70
DILUTED NET EARNINGS PER SHARE Diluted net earnings from continuing operations $ 10,680 $ 11,291 $ 9,662 $ 8,187 $ 6,384Diluted net earnings from discontinued operations $ 2,756 $ 784 $ 678 $ 497 $ 539
Diluted net earnings $ 13,436 $ 12,075 $ 10,340 $ 8,684 $ 6,923
Basic weighted average common shares outstanding 2,952.2 3,080.8 3,159.0 3,054.9 2,515.6Add potential effect of:
Conversion of preferred shares 139.2 144.2 149.6 154.1 158.3Exercise of stock options and other Unvested Equity awards 62.7 91.8 90.0 76.9 63.2
Diluted weighted average common shares outstanding 3,154.1 3,316.8 3,398.6 3,285.9 2,737.1
Diluted net earnings per common share - continuing operations $ 3.39 $ 3.40 $ 2.84 $ 2.49 $ 2.33
Diluted net earnings per common share - discontinued operations $ 0.87 $ 0.24 $ 0.20 $ 0.15 $ 0.20
Diluted net earnings per common share $ 4.26 $ 3.64 $ 3.04 $ 2.64 $ 2.53
Source: PROCTER & GAMBLE CO, 8-K, January 29, 2010 Powered by Morningstar® Document Research℠

Exhibit 12: Computation of Ratio of Earnings to Fixed Charges
THE PROCTER & GAMBLE COMPANY AND SUBSIDIARIESCOMPUTATION OF RATIO OF EARNINGS TO FIXED CHARGES
Years Ended June 30Amounts in millions 2009 2008 2007 2006 2005EARNINGS, AS DEFINED
Earnings from operations before income taxes and before adjustments for minority interests inconsolidated subsidiaries and after eliminating undistributed earnings of equity methodinvestees $ 14,461 $ 14,927 $ 13,698 $ 11,658 $ 9,128
Fixed charges (excluding amortization capitalized interest) 1,576 1,640 1,458 1,268 948
TOTAL EARNINGS, AS DEFINED $ 16,037 $ 16,567 $ 15,156 $ 12,926 $ 10,076
FIXED CHARGES, AS DEFINED Interest expense (including capitalized interest) $ 1,431 $ 1,546 $ 1,374 $ 1,153 $ 8691/3 of rental expense 177 137 124 122 90
TOTAL FIXED CHARGES, AS DEFINED $ 1,608 $ 1,683 $ 1,498 $ 1,275 $ 959
RATIO OF EARNINGS TO FIXED CHARGES 10.0x 9.8x 10.1x 10.1x 10.5x
Source: PROCTER & GAMBLE CO, 8-K, January 29, 2010 Powered by Morningstar® Document Research℠
Exhibit 99.3: Updated Report of the Independent Registered Public Accountant
Report of Independent Registered Public Accounting Firm
To the Board of Directors and Stockholders ofThe Procter & Gamble Company
We have audited the accompanying Consolidated Balance Sheets of The Procter & Gamble Company and subsidiaries (the “Company”) as of June 30, 2009 and2008, and the related Consolidated Statements of Earnings, Shareholders’ Equity, and Cash Flows for each of the three years in the period ended June 30, 2009.These financial statements are the responsibility of the Company’s management. Our responsibility is to express an opinion on these financial statements basedon our audits.
We conducted our audits in accordance with the standards of the Public Company Accounting Oversight Board (United States). Those standards require that weplan and perform the audit to obtain reasonable assurance about whether the financial statements are free of material misstatement. An audit includes examining,on a test basis, evidence supporting the amounts and disclosures in the financial statements. An audit also includes assessing the accounting principles used andsignificant estimates made by management, as well as evaluating the overall financial statement presentation. We believe that our audits provide a reasonablebasis for our opinion.
In our opinion, such Consolidated Financial Statements present fairly, in all material respects, the financial position of the Company at June 30, 2009 and 2008,and the results of its operations and cash flows for each of the three years in the period ended June 30, 2009, in conformity with accounting principles generallyaccepted in the United States of America.
As discussed in Note 9 to the Consolidated Financial Statements, the Company adopted new accounting guidance on the accounting for uncertainty in incometaxes, effective July 1, 2007.
We have also audited, in accordance with the standards of the Public Company Accounting Oversight Board (United States), the Company’s internal control overfinancial reporting as of June 30, 2009, based on the criteria established in Internal Control—Integrated Framework issued by the Committee of SponsoringOrganizations of the Treadway Commission and our report dated August 14, 2009, not included herein, expressed an unqualified opinion on the Company’sinternal control over financial reporting.
/s/ Deloitte & Touche LLPCincinnati, Ohio
August 14, 2009 (January 29, 2010 as to the effects of the pharmaceuticals business divestiture described in Note 12, the segment changes described in Note 11,and the adoption of new accounting guidance for noncontrolling interests described in Note 1)
Source: PROCTER & GAMBLE CO, 8-K, January 29, 2010 Powered by Morningstar® Document Research℠
Exhibit 23: Consent of Deloitte & Touche LLP
CONSENT OF INDEPENDENT REGISTERED PUBLIC ACCOUNTING FIRM
We consent to the incorporation by reference in the following documents of our report dated August 14, 2009 (January 29, 2010 as to the effects of thepharmaceuticals business divestiture described in Note 12, the segment changes described in Note 11, and the adoption of new accounting guidance fornoncontrolling interests described in Note 1), relating to the consolidated financial statements of The Procter & Gamble Company and subsidiaries (which reportexpresses an unqualified opinion and includes an explanatory paragraph regarding the Company’s adoption of new accounting guidance on the accounting foruncertainty in income taxes, effective July 1, 2007) appearing in this Current Report on Form 8-K of the Procter & Gamble Company and subsidiaries datedJanuary 29, 2010.
1. Amendment No. 1 on Form S-8 Registration Statement No. 33-31855 on Form S-4 (now S-8) for the 1982 Noxell Employees’ Stock Option Planand the 1984 Noxell Employees’ Stock Option Plan;
2. Post-Effective Amendment No. 1 to Registration Statement No. 33-49289 on Form S-8 for The Procter & Gamble 1992 Stock Plan;
3. Registration Statement No. 33-47656 on Form S-8 for The Procter & Gamble International Stock Ownership Plan;
4. Registration Statement No. 33-50273 on Form S-8 for The Procter & Gamble Commercial Company Employees’ Savings Plan;
5. Registration Statement No. 33-51469 on Form S-8 for The Procter & Gamble 1993 Non-Employee Directors’ Stock Plan;
6. Registration Statement No. 333-05715 on Form S-8 for The Procter & Gamble Profit Sharing Trust and Employee Stock Ownership Plan;
7. Post-Effective Amendment No. 2 to Registration Statement No. 33-59257 on Form S-3 for The Procter & Gamble Shareholder Investment Program;
8. Registration Statement No. 333-14381 on Form S-8 for Profit Sharing Retirement Plan of The Procter & Gamble Commercial Company;
9. Registration Statement No. 333-14397 on Form S-8 for Procter & Gamble Subsidiaries Savings Plan;
10. Registration Statement No. 333-21783 on Form S-8 for The Procter & Gamble 1992 Stock Plan (Belgian Version);
11. Registration Statement No. 333-37905 on Form S-8 for The Procter & Gamble Future Shares Plan;
12. Registration Statement No. 333-51213 on Form S-8 for Group Profit Sharing, Incentive, and Employer Contribution Plan (France);
13. Registration Statement No. 333-51219 on Form S-8 for Procter & Gamble Ireland Employees Share Ownership Plan;
14. Registration Statement No. 333-51221 on Form S-8 for Employee Stock Purchase Plan (Japan);
15. Registration Statement No. 333-51223 on Form S-8 for Savings and Thrift Plan (Saudi Arabia);
Source: PROCTER & GAMBLE CO, 8-K, January 29, 2010 Powered by Morningstar® Document Research℠

16. Registration Statement No. 333-34606 on Form S-8 for The Procter & Gamble Future Shares Plan;
17. Registration Statement No. 333-40264 on Form S-8 for Savings and Thrift Plan Saudi Arabia;
18. Registration Statement No. 333-44034 on Form S-8 for The Procter & Gamble International Stock Ownership Plan;
19. Registration Statement No. 333-47132 on Form S-8 for Employee Stock Purchase Plan (Japan);
20. Registration Statement No. 333-49764 on Form S-3 for The Procter & Gamble U.K. Share Investment Scheme;
21. Registration Statement No. 333-75030 on Form S-8 for The Procter & Gamble 2001 Stock and Incentive Compensation Plan;
22. Registration Statement No. 333-100561 on Form S-8 for The Procter & Gamble (U.K.) 1-4-1 Plan;
23. Registration Statement No. 333-108753 on Form S-8 for The Procter & Gamble Profit Sharing Trust and Employee Stock Ownership Plan;
24. Registration Statement No. 333-108991 on Form S-8 for The Procter & Gamble 1992 Stock Plan (Belgian Version);
25. Registration Statement No. 333-108992 on Form S-8 for Savings and Thrift Plan (Saudi Arabia);
26. Registration Statement No. 333-108993 on Form S-8 for Employee Stock Purchase Plan (Japan);
27. Registration Statement No. 333-108994 on Form S-8 for Procter & Gamble Ireland Employees Share Plan;
28. Registration Statement No. 333-108995 on Form S-8 for Group Profit Sharing, Incentive, and Employer Contribution Plan (France);
29. Registration Statement No. 333-108997 on Form S-8 for The Procter & Gamble International Stock Ownership Plan;
30. Registration Statement No. 333-108998 on Form S-8 for The Procter & Gamble 1993 Non-Employee Directors’ Stock Plan;
31. Registration Statement No. 333-108999 on Form S-8 for The Procter & Gamble 1992 Stock Plan;
32. Registration Statement No. 333-111304 on Form S-8 for The Procter & Gamble 2003 Non-Employee Directors’ Stock Plan;
33. Registration Statement No. 333-111305 on Form S-8 for The Procter & Gamble U.K. Share Investment Scheme;
34. Amendment No. 1 to Registration Statement No. 333-113515 on Form S-3 for The Procter & Gamble Company Debt Securities and Warrants;
35. Amendment No. 3 to Registration Statement No. 333-123309 on Form S-4 for The Procter & Gamble Company;
Source: PROCTER & GAMBLE CO, 8-K, January 29, 2010 Powered by Morningstar® Document Research℠
36. Registration Statement No. 333-128859 on Form S-8 for certain employee benefit plans of The Gillette Company (2004 Long-TermIncentive Plan of The Gillette Company; 1971 Stock Option Plan of The Gillette Company; James M. Kilts Non-Statutory Stock OptionPlan; The Gillette Company Employees’ Savings Plan; The Gillette Company Supplemental Savings Plan; The Gillette Company GlobalEmployee Stock Ownership Plan (GESOP));
37. Registration Statement No. 333-143801 on Form S-8 for The Procter & Gamble Savings Plan;
38. Registration Statement No. 333-145938 on Form S-3 for The Procter & Gamble Company and Procter & Gamble International Funding SCA;
39. Registration Statement No. 333-155046 on Form S-8 for Employee Stock Purchase Plan (Japan);
40. Registration Statement No. 333-156032 on Form S-3 for The Procter & Gamble U.K. Share Investment Scheme; and
41. Registration Statement No. 333-156033 on Form S-3 for The Procter & Gamble Shareholder Investment Program; and
42. Registration Statement No. 333-161767 on Form S-3 for The Procter & Gamble Company and Procter & Gamble International Funding SCA; and
43. Registration Statement No. 333-161725 on Form S-8 for The Procter & Gamble Savings Plan.
/s/ Deloitte & Touche LLPCincinnati, OhioJanuary 29, 2010
Source: PROCTER & GAMBLE CO, 8-K, January 29, 2010 Powered by Morningstar® Document Research℠

Source: PROCTER & GAMBLE CO, 8-K, January 29, 2010 Powered by Morningstar® Document Research℠
_____________________________________
Created by Morningstar® Document Research℠http://documentresearch.morningstar.com
Source: PROCTER & GAMBLE CO, 8-K, January 29, 2010 Powered by Morningstar® Document Research℠