morning insight - kotak securitiesapollo tyres, ceat, mrf betting big on rising local demand.the...
TRANSCRIPT
AUGUST 6, 2018
Morning Insight
Kotak Securities Limited has two independent equity research groups: Institutional Equities and Private Client Group. This report has been prepared by the Private Client Group. The views and opinions expressed in this document may or may not match or may be contrary with the views, estimates, rating, target price of the Institutional Equities Research Group of Kotak Securities Limited.
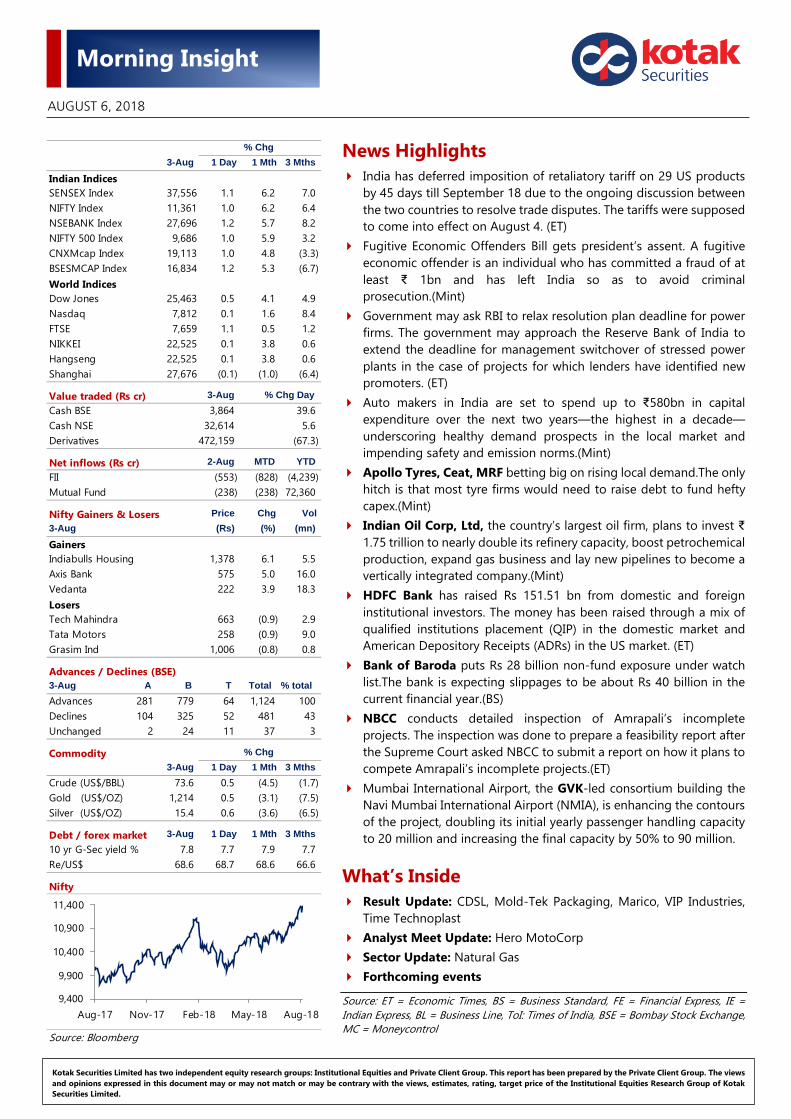
News Highlights India has deferred imposition of retaliatory tariff on 29 US products
by 45 days till September 18 due to the ongoing discussion between the two countries to resolve trade disputes. The tariffs were supposed to come into effect on August 4. (ET)
Fugitive Economic Offenders Bill gets president’s assent. A fugitive economic offender is an individual who has committed a fraud of at least ₹ 1bn and has left India so as to avoid criminal prosecution.(Mint)
Government may ask RBI to relax resolution plan deadline for power firms. The government may approach the Reserve Bank of India to extend the deadline for management switchover of stressed power plants in the case of projects for which lenders have identified new promoters. (ET)
Auto makers in India are set to spend up to ₹580bn in capital expenditure over the next two years—the highest in a decade—underscoring healthy demand prospects in the local market and impending safety and emission norms.(Mint)
Apollo Tyres, Ceat, MRF betting big on rising local demand.The only hitch is that most tyre firms would need to raise debt to fund hefty capex.(Mint)
Indian Oil Corp, Ltd, the country’s largest oil firm, plans to invest ₹ 1.75 trillion to nearly double its refinery capacity, boost petrochemical production, expand gas business and lay new pipelines to become a vertically integrated company.(Mint)
HDFC Bank has raised Rs 151.51 bn from domestic and foreign institutional investors. The money has been raised through a mix of qualified institutions placement (QIP) in the domestic market and American Depository Receipts (ADRs) in the US market. (ET)
Bank of Baroda puts Rs 28 billion non-fund exposure under watch list.The bank is expecting slippages to be about Rs 40 billion in the current financial year.(BS)
NBCC conducts detailed inspection of Amrapali’s incomplete projects. The inspection was done to prepare a feasibility report after the Supreme Court asked NBCC to submit a report on how it plans to compete Amrapali’s incomplete projects.(ET)
Mumbai International Airport, the GVK-led consortium building the Navi Mumbai International Airport (NMIA), is enhancing the contours of the project, doubling its initial yearly passenger handling capacity to 20 million and increasing the final capacity by 50% to 90 million.
What’s Inside Result Update: CDSL, Mold-Tek Packaging, Marico, VIP Industries,
Time Technoplast
Analyst Meet Update: Hero MotoCorp
Sector Update: Natural Gas
Forthcoming events
Source: ET = Economic Times, BS = Business Standard, FE = Financial Express, IE = Indian Express, BL = Business Line, ToI: Times of India, BSE = Bombay Stock Exchange, MC = Moneycontrol
3-Aug 1 Day 1 Mth 3 Mths
Indian Indices SENSEX Index 37,556 1.1 6.2 7.0 NIFTY Index 11,361 1.0 6.2 6.4 NSEBANK Index 27,696 1.2 5.7 8.2 NIFTY 500 Index 9,686 1.0 5.9 3.2 CNXMcap Index 19,113 1.0 4.8 (3.3) BSESMCAP Index 16,834 1.2 5.3 (6.7)
World IndicesDow Jones 25,463 0.5 4.1 4.9 Nasdaq 7,812 0.1 1.6 8.4 FTSE 7,659 1.1 0.5 1.2 NIKKEI 22,525 0.1 3.8 0.6 Hangseng 22,525 0.1 3.8 0.6 Shanghai 27,676 (0.1) (1.0) (6.4)
Value traded (Rs cr)Cash BSE 39.6 Cash NSE 5.6 Derivatives (67.3)
Net inflows (Rs cr) 2-Aug MTD YTDFII (553) (828) (4,239)Mutual Fund (238) (238) 72,360
Nifty Gainers & Losers Price Chg Vol3-Aug (Rs) (%) (mn)
GainersIndiabulls Housing 1,378 6.1 5.5 Axis Bank 575 5.0 16.0 Vedanta 222 3.9 18.3
LosersTech Mahindra 663 (0.9) 2.9 Tata Motors 258 (0.9) 9.0 Grasim Ind 1,006 (0.8) 0.8
Advances / Declines (BSE)3-Aug A B T Total % totalAdvances 281 779 64 1,124 100 Declines 104 325 52 481 43 Unchanged 2 24 11 37 3
Commodity3-Aug 1 Day 1 Mth 3 Mths
Crude (US$/BBL) 73.6 0.5 (4.5) (1.7) Gold (US$/OZ) 1,214 0.5 (3.1) (7.5) Silver (US$/OZ) 15.4 0.6 (3.6) (6.5)
Debt / forex market 3-Aug 1 Day 1 Mth 3 Mths10 yr G-Sec yield % 7.8 7.7 7.9 7.7 Re/US$ 68.6 68.7 68.6 66.6
Nifty
Source: Bloomberg
% Chg
472,159
% Chg
% Chg Day3-Aug3,864
32,614
9,400
9,900
10,400
10,900
11,400
Aug-17 Nov-17 Feb-18 May-18 Aug-18

Kotak Securities – Private Client Research Please see the Disclosure/Disclaimer on the last page For Private Circulation 2
AUGUST 6, 2018
CENTRAL DEPOSITORY SERVICES (INDIA) LTD PRICE RS. 268 TARGET RS.320 BUY
Central Depository Services (CDSL) 1QFY19 operating performance was in line, but lower other income weigh on PAT. Owing to the volatile capital markets, key segments (except data processing) grew at subdued pace. Data Processing revenue declined on challenging capital markets and lesser primary market traction.
Key Highlights
Central Depository Services (CDSL) has reported an in-line EBITDA in 1QFY19, which rose 11.9% YoY to Rs257 mn (-13% QoQ), with an EBITDA margin of 56.8% vs 56.6% in 1QFY18 (supported by cost control).
CDSL continues to focus on increasing DPs with net beneficial owner accounts rising by 24% YoY to 15.3mn, which implies the highest ever incremental addition of ~3mn accounts, with an incremental market share of 71%.
Valuation & outlook
CDSL’s annuity based revenue stream, new growth avenues of Insurance & Academics, fixed operating costs, robust cash flow generation coupled with a strong balance sheet and stable dividend policy is likely to drive earnings growth and keep valuation at the higher side. Return ratios are optically suppressed due to cash in the Balance Sheet. Besides this, compulsory demat of unlisted companies if it materializes, will further support higher valuation. We reiterate our BUY rating with an unchanged target price of Rs320. At CMP, the stock is trading at 25.3x/22.4x FY19E/FY20E earnings.
Quarterly performance table
Particulars (Rs Mn) 1QFY19 1QFY18 YoY (%) 4QFY18 QoQ (%)
Revenue 453 405 11.6 518 (12.6)
Employee Expenses 80 70 14.1 96 (16.0)
Other Expenses 92 82 11.5 102 (10.4)
Total Expenses 196 176 223
EBITDA 257 230 11.9 295 (13.0)
EBITDA Margin (%) 56.8 56.6 57.0
Depreciation 25 10 138.5 27 (5.8)
EBIT 232 219 5.9 269 (13.7)
Interest 0 0 0
Other Income 52 98 (47.2) 99 (47.7)
Exceptional Items 0 0 0
PBT 284 317 (10.5) 367 (22.8)
Tax 64 62 2.1 108 (41.3)
ETR (%) 22.4 19.6 29.4
PAT 220 255 (13.6) 259 (15.1)
Source: Company, Kotak Securities – Private Client Research
Key Risks
a) Low pricing power, b) dependence on capital market volume, c) regulatory oversight, d) loss of KYC business after the appointment of Central Registry of Securitization Asset Reconstruction and Security Interest of India (CERSAI) are the key risks to our estimates
Result Update
Stock Details
Market cap (Rs mn) : 28006
52-wk Hi/Lo (Rs) : 398 / 251
Face Value (Rs) : 10
3M Avg. daily vol (Nos) : 360,442
Shares o/s (m) : 105
Source: Bloomberg
Financial Summary
Y/E Mar (Rs mn) FY18 FY19E FY20E
Revenue 1,910 2,089 2,366
Growth (%) 30.8 9.4 13.2
EBITDA 1,137 1,230 1,401
EBITDA margin (%) 59.5 58.9 59.2
PAT 1,032 1,105 1,251
EPS 9.9 10.6 12.0
EPS Growth (%) 20.3 7.1 13.2
BV (Rs/share) 10 11 12
Dividend/share (Rs) 3.5 4.2 4.8
ROE (%) 17.2 16.6 16.9
ROCE (%) 17.8 17.1 17.4
P/E (x) 27.1 25.3 22.4
EV/EBITDA (x) 19.7 17.9 15.3
P/BV (x) 4.7 4.2 3.8
Source: Company, Kotak Securities - PCG
Shareholding Pattern (%)
(%) Jun-18 Mar-18 Dec-17
Promoters 24.0 24.0 24.0
FII 1.6 2.2 2.3
DII 48.7 48.0 48.9
Others 25.7 25.8 24.8
Source: Company
Price Performance (%)
(%) 1M 3M 6M
Central Dep Ser (0.7) (5.4) (15.9)
Nifty 6.2 6.4 5.6
Source: Bloomberg
Price chart (Rs)
Source: Bloomberg
Jatin Damania [email protected] +91 22 6218 6440
250
300
350
400
Aug-17 Dec-17 Apr-18 Aug-18
Kotak Securities – Private Client Research Please see the Disclosure/Disclaimer on the last page For Private Circulation 3
AUGUST 6, 2018
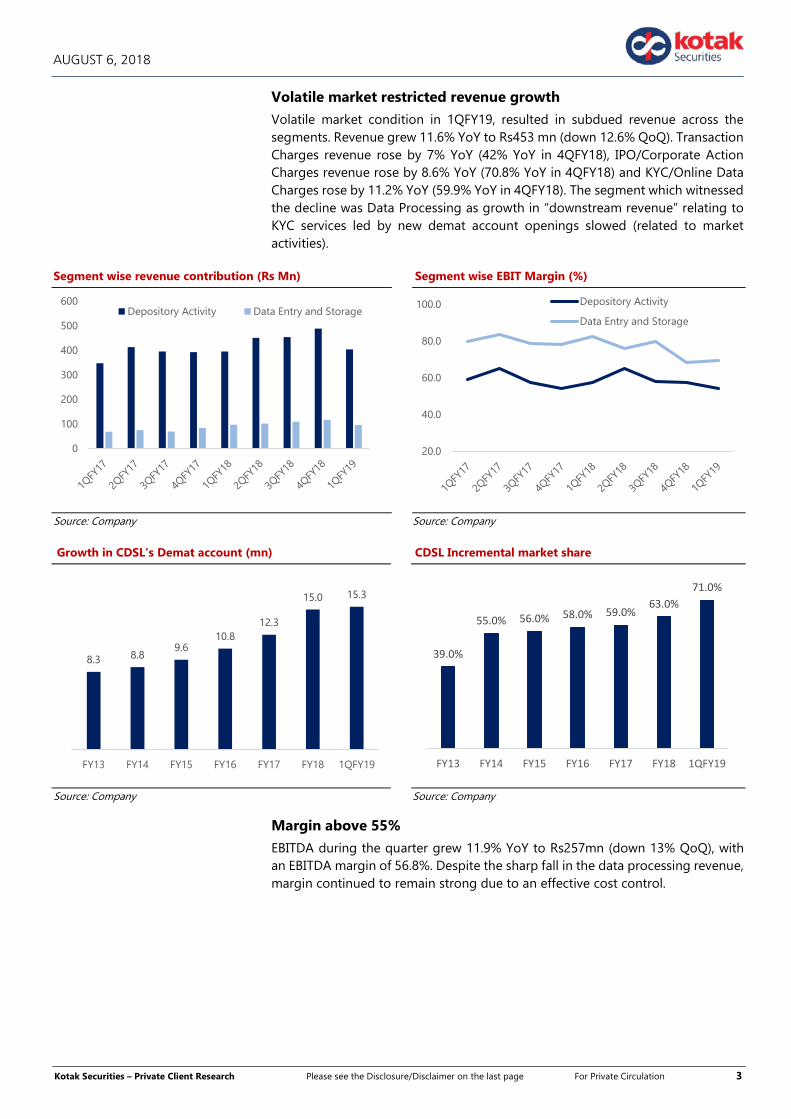
Volatile market restricted revenue growth
Volatile market condition in 1QFY19, resulted in subdued revenue across the segments. Revenue grew 11.6% YoY to Rs453 mn (down 12.6% QoQ). Transaction Charges revenue rose by 7% YoY (42% YoY in 4QFY18), IPO/Corporate Action Charges revenue rose by 8.6% YoY (70.8% YoY in 4QFY18) and KYC/Online Data Charges rose by 11.2% YoY (59.9% YoY in 4QFY18). The segment which witnessed the decline was Data Processing as growth in “downstream revenue” relating to KYC services led by new demat account openings slowed (related to market activities).
Segment wise revenue contribution (Rs Mn) Segment wise EBIT Margin (%)
Source: Company Source: Company
Growth in CDSL’s Demat account (mn) CDSL Incremental market share
Source: Company Source: Company
Margin above 55%
EBITDA during the quarter grew 11.9% YoY to Rs257mn (down 13% QoQ), with an EBITDA margin of 56.8%. Despite the sharp fall in the data processing revenue, margin continued to remain strong due to an effective cost control.
0
100
200
300
400
500
600Depository Activity Data Entry and Storage
8.3 8.89.6
10.812.3
15.0 15.3
FY13 FY14 FY15 FY16 FY17 FY18 1QFY19
39.0%
55.0% 56.0% 58.0% 59.0%63.0%
71.0%
FY13 FY14 FY15 FY16 FY17 FY18 1QFY19
20.0
40.0
60.0
80.0
100.0 Depository Activity
Data Entry and Storage

Kotak Securities – Private Client Research Please see the Disclosure/Disclaimer on the last page For Private Circulation 4
AUGUST 6, 2018
EBITDA and EBITDA Margin (%) trend
Source: Company
Other Highlights
CDSL continues to sustain leadership in demat segment in terms of incremental market share (71% in 1QFY19). Overall market share improved 50bps to 47%.
Transaction charges during the quarter was up 7% YoY to Rs96.6 mn, as against 20% YoY growth in cash delivery volume in the market.
The company had invested in new office facilities in 4QFY18, which resulted into steep rise in depreciation YoY.
Lower other income in 1QFY19 is attributed to lower MTM value of investments (Rs19.4mn vs. Rs52mn in 1QFY18).
The company is looking to diversify its e-voting business beyond corporates to other potential customers like insolvency professionals and academic institutes etc. It enabled conduct of student union elections in Tata Institute of Social Sciences (TISS) through its e-voting service.
CDSL Ventures sustained its leadership with 17.4mn accounts at the end of 1QFY19 vs 1.70mn at the end of 4QFY18 in KYC business.
Clarity on dematerialization of unlisted companies should come in the next two months, as per the management. If it materializes, revenue will start reflecting from 3Q onwards.
National Academic Depository service has tied up with ~300 universities as against ~250 of NSDL. The rampup of these services will provide additional revenue growth drivers over the long term
Recommend BUY
CDSL’s annuity based revenue stream, new growth avenues of Insurance & Academics, fixed operating costs, robust cash flow generation coupled with a strong balance sheet and stable dividend policy is likely to drive earnings growth and keep valuation at the higher side. Return ratios are optically suppressed due to cash in the Balance Sheet. Besides this, compulsory demat of unlisted companies if it materializes, will further support higher valuation. We reiterate our BUY rating with an unchanged target price of Rs320. At CMP, the stock is trading at 25.3x/22.4x FY19E/FY20E earnings.
52.8
61.3
53.349.9
56.663.5 61.1 57.0 56.8
0.0
15.0
30.0
45.0
60.0
75.0
0
50
100
150
200
250
300
350
1QFY17 2QFY17 3QFY17 4QFY17 1QFY18 2QFY18 3QFY18 4QFY18 1QFY19
EBITDA (Rs Mn) EBTIDA Margin (%)
Kotak Securities – Private Client Research Please see the Disclosure/Disclaimer on the last page For Private Circulation 5
AUGUST 6, 2018
Company Background
Central Depository Services (India) Limited (“CDSL” or the “Company”) was set up with the objective of providing convenient, dependable and secure depository services at affordable cost to all market participants. A depository facilitates holding of securities in the electronic form and enables securities transactions to be processed by book entry by a Depository participant (DP) who as an agent of the depository, offers depository services to investors. CDSL is the leading securities depository in India by incremental growth of Beneficial Owner (BO) accounts over the last three Fiscal years.
Kotak Securities – Private Client Research Please see the Disclosure/Disclaimer on the last page For Private Circulation 6
AUGUST 6, 2018
Financials: Consolidated
Profit and Loss Statement (Rs mn)
(Year-end Mar) FY17 FY18 FY19E FY20E
Net sales 1,460 1,910 2,089 2,366 growth (%) 18.8 30.8 9.4 13.2 Operating expenses 666 773 859 965 EBITDA 794 1,137 1,230 1,401 growth (%) 24.3 43.2 8.2 13.9 Depreciation 37 69 90 108 EBIT 757 1,068 1,140 1,292 Other income 408 347 380 428 Interest paid 0 0 0 0 Exceptional items 0 0 0 0 PBT 1,166 1,414 1,520 1,720 Tax 300 378 410 464 Effective tax rate (%) 25.7 26.7 27.0 27.0 Net profit 866 1,036 1,110 1,256 Minority interest 8 5 5 5 Reported Net profit 858 1,032 1,105 1,251 Non-recurring items 0 0 0 0 Adjusted Net profit 858 1,032 1,105 1,251 growth (%) 48.2 20.3 7.1 13.2
Source: Company, Kotak Securities – Private Client Research
Cash flow Statement (Rs mn)
(Year-end Mar) FY17 FY18 FY19E FY20E
PBT 1,159 1,410 1,520 1,720 Depreciation 37 69 90 108 Chg in working capital 47 129 59 12 Taxes 300 378 410 464 Others 20 (12) Operating CF 963 1,218 1,259 1,377 Capital expenditure (53) (706) (275) (275) Chg in investments (454) (146) (258) (270) Other investing activities 0 0 0 0 Investing CF (507) (852) (532) (544) Equity raised/(repaid) 0 0 0 0 Debt raised/(repaid) 0 0 0 0 Dividend (incl. tax) 376 439 533 603 Other financing activities 0 0 0 0
Financing CF (376) (439) (533) (603) Net chg in cash & bank bal. 79 (73) 194 230 Closing cash & bank bal 483 410 604 834
Source: Company, Kotak Securities – Private Client Research
Balance sheet (Rs mn)
(Year-end Mar) FY17 FY18 FY19E FY20E
Cash & Bank balances 483 411 604 834 Other Current assets 351 417 350 385 Investments 5,029 5,175 5,434 5,705 Net fixed assets 55 761 1,035 1,310 Goodwill & intangible assets 0 0 0 0 Other non-current assets 154 170 172 173 Total assets 6,072 6,933 7,595 8,407 Current liabilities 571 765 762 812 Borrowings 0 0 0 0 Other non-current liabilities 14 20 13 13 Total liabilities 584 785 775 825 Share capital 1,045 1,045 1,045 1,045 Reserves & surplus 4,288 4,943 5,608 6,362 Shareholders' funds 5,333 5,988 6,653 7,407 Minority interest 155 159 167 176 Total equity & liabilities 6,072 6,932 7,595 8,407
Source: Company, Kotak Securities – Private Client Research
Ratio Analysis
(Year-end Mar) FY17 FY18 FY19E FY20E
Profitability and return ratios (%) EBITDAM 54.4 59.5 58.9 59.2 EBITM 51.9 55.9 54.6 54.6 NPM 58.8 54.0 52.9 52.9 RoE 16.1 17.2 16.6 16.9 RoCE 14.2 17.8 17.1 17.4 RoIC 99.0 57.7 58.3 54.2 Per share data (Rs) EPS 8.2 9.9 10.6 12.0 FDEPS 8.2 9.9 10.6 12.0 CEPS 8.6 10.5 11.4 13.0 BV 51.0 57.3 63.7 70.9 DPS 3.0 3.5 4.2 4.8 Valuation ratios (x) PE 32.6 27.1 25.3 22.4 P/BV 5.3 4.7 4.2 3.8
EV/EBITDA 28.3 19.7 17.9 15.3 EV/Sales 15.4 11.7 10.5 9.1 Other key ratios DSO (days) 33 36 36 36
Source: Company, Kotak Securities – Private Client Research
Kotak Securities – Private Client Research Please see the Disclosure/Disclaimer on the last page For Private Circulation 7
AUGUST 6, 2018
MOLD-TEK PACKAGING LIMITED (MTPL) PRICE RS. 305 TARGET RS.351 BUY
MTPL Q1FY19 PAT was in-line with estimates, but EBITDA was above estimates, due to higher realisation. Despite the increase in raw materials costs, margin during the quarter remained flat QoQ, backed by higher IML sales and higher realisation. MTPL is on its way of sustainable growth story, backed by capacity addition at Mysuru, Vizag, greenfield plant at Hyderabad for Food and FMCG, ramp-up at RAK, increasing share of IML and strong clientele.
Key Highlights
The recovery in edible oil is visible, with the acceptance of Packs of S.l5 and 17 liters in Edible oil and ghee segments. Management is planning to launch a small (50ml to 1000 ml) retail pack from Oct’18.
The contribution from IML continued to remain strong at 61.7% in value terms in 1QFY19 and expect the momentum to continue.
RAK operations will take some more time to break-even, as various products are under development stage and the management is also realigning the product mix in favor of F&F. The current utilisation stands at 30-35%.
Valuation & outlook
Rising sales of IML in the revenue, has helped the company to report improvement in EBITDA/kg to Rs32.6/kg (standalone) in 1QFY19. We expect EBITDA/kg to remain strong in the next two years, driven by higher contribution from the F&F segment. Increasing share of IML in the overall revenue mix and higher visibility of volume augurs well for the company. Given the company's strong tool room capability and structural improvement in business mix supports our positive view on the MTPL. At CMP, the stock is trading at 20.9x/18.3x FY19E/FY20E earnings, which in our view is attractive. We reiterate BUY with an unchanged target price of Rs351.
Quarterly performance table
Particulars (Rs Mn) 1QFY19 1QFY18 YoY (%) 4QFY18 QoQ (%)
Net sales 1,023 899 13.7 946 8.2
Materials & subcontracting 621 526 18.1 564 9.9
Employee Expenses 104 87 19.0 97 6.6
Total Expenditure 845 741 14.0 781 8.2
EBITDA 178 158 12.7 165 8.0
EBITDA Margin (%) 17.4 17.6 17.4
Depreciation 37 30 23.0 35 6.3
Interest 16 10 57.1 15 10.8
EBT 125 117 6.1 115 8.2
Other income 4 3 23.7 2 78.8
PBT 129 121 6.6 118 9.7
Provision for tax 47 50 (6.0) 49 (4.4)
-effective tax rate (%) 36.3 41.2 41.7
PAT (reported) 82 71 15.4 68 19.8
Minority/ Share of Profit 0 0 0
PAT (Adjusted) 82 71 15.4 68 19.8
NPM (%) 8.0 7.9 7.2
Source: Company, Kotak Securities – Private Client Research
Result Update
Stock Details
Market cap (Rs mn) : 8501
52-wk Hi/Lo (Rs) : 374 / 254
Face Value (Rs) : 5
3M Avg. daily vol (Nos) : 40,010
Shares o/s (mn) : 27.7
Source: Bloomberg
Financial Summary
Y/E Mar (Rs mn) FY18 FY19E FY20E
Revenue 3,577 4,074 4,641
Growth (%) 15.8 13.9 13.9
EBITDA 615 765 876
EBITDA margin (%) 17.2 18.8 18.9
PAT 278 403 462
EPS 10.1 14.6 16.7
EPS Growth (%) 14.7 44.9 14.6
BV (Rs/share) 4.0 5.0 5.0
Dividend/share (Rs) 61.2 70.8 82.0
ROE (%) 16.0 20.5 20.4
ROCE (%) 16.3 17.2 17.3
P/E (x) 30.3 20.9 18.3
EV/EBITDA (x) 15.3 12.4 9.6
P/BV (x) 4.9 4.3 3.7
Source: Company, Kotak Securities - PCG
Shareholding Pattern (%)
(%) Jun-18 Mar-18 Dec-17
Promoters 35.6 35.8 35.8
FII 8.3 7.5 6.5
DII 12.6 13.6 13.9
Others 43.6 43.1 43.8
Source: Company
Price Performance (%)
(%) 1M 3M 6M
Mold-Tek Packaging (1.0) (9.3) (10.4)
Nifty 6.2 6.4 5.6
Source: Bloomberg
Price chart (Rs)
Source: Bloomberg
Jatin Damania [email protected] +91 22 6218 6440
265
290
315
340
365
Aug-17 Dec-17 Apr-18 Aug-18
Kotak Securities – Private Client Research Please see the Disclosure/Disclaimer on the last page For Private Circulation 8
AUGUST 6, 2018
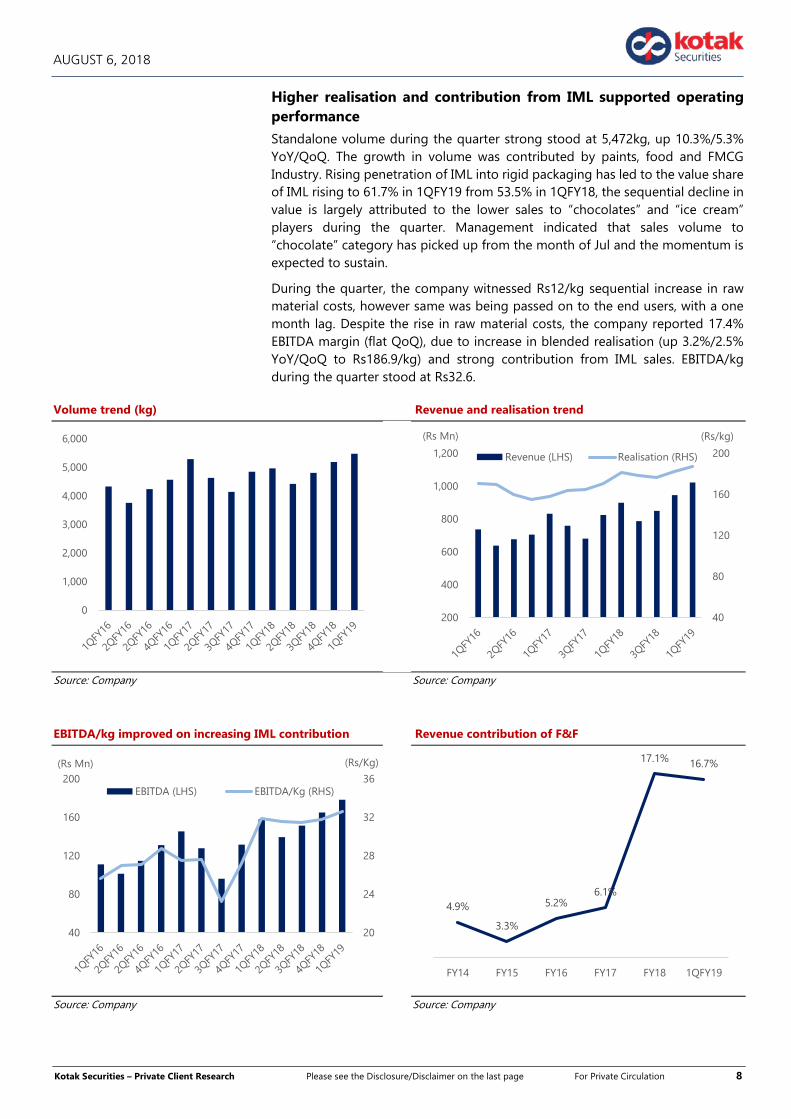
Higher realisation and contribution from IML supported operating performance
Standalone volume during the quarter strong stood at 5,472kg, up 10.3%/5.3% YoY/QoQ. The growth in volume was contributed by paints, food and FMCG Industry. Rising penetration of IML into rigid packaging has led to the value share of IML rising to 61.7% in 1QFY19 from 53.5% in 1QFY18, the sequential decline in value is largely attributed to the lower sales to “chocolates” and “ice cream” players during the quarter. Management indicated that sales volume to “chocolate” category has picked up from the month of Jul and the momentum is expected to sustain.
During the quarter, the company witnessed Rs12/kg sequential increase in raw material costs, however same was being passed on to the end users, with a one month lag. Despite the rise in raw material costs, the company reported 17.4% EBITDA margin (flat QoQ), due to increase in blended realisation (up 3.2%/2.5% YoY/QoQ to Rs186.9/kg) and strong contribution from IML sales. EBITDA/kg during the quarter stood at Rs32.6.
Volume trend (kg) Revenue and realisation trend
Source: Company Source: Company
EBITDA/kg improved on increasing IML contribution Revenue contribution of F&F
Source: Company Source: Company
0
1,000
2,000
3,000
4,000
5,000
6,000
40
80
120
160
200
200
400
600
800
1,000
1,200
(Rs/kg)(Rs Mn)
Revenue (LHS) Realisation (RHS)
20
24
28
32
36
40
80
120
160
200
(Rs/Kg)(Rs Mn)
EBITDA (LHS) EBITDA/Kg (RHS)
4.9%
3.3%
5.2%6.1%
17.1% 16.7%
FY14 FY15 FY16 FY17 FY18 1QFY19

Kotak Securities – Private Client Research Please see the Disclosure/Disclaimer on the last page For Private Circulation 9
AUGUST 6, 2018
F&F segment contribution to go up further
Post, the successful execution of “Mondelez” order, the company is developing the IML containers for leading Food and FMCG companies. Any successful closure, would take contribution of F&F segment higher from 16.7% in 1QFY19 (17.1% in FY18). Besides this, the company acceptance of pails in Edible oil and ghee segment, would further strengthen the company’s position in Food and FMCG industry. In order to further penetrate into the segment, the company is launching a smaller retail pack from the month of October onwards. MTPL, expects the growth from this range of products would further strengthen its Food and FMCG portfolio in the coming years.
Other Highlights: Expansion: Mysuru plant and Vizag plant expansion for Asian paints, is on
track and the production is expected to start from Oct/Nov’18 at Mysuru and Jan’19 at Vizag. The company received their first order from Asian Paint-Mysuru units, which will be executed by end of Sep’18, from their existing plant location.
Capex: MTPL is expected to spend Rs520 mn in FY19 for Asian Paint facilities and expanding the food and FMCG capacity in Hyderabad (greenfield project), which is expected to come on stream by 2HFY20. The second phase of Mysuru expansion will be undertaken in Q4FY19 and Q2FY20 for Vizag.
Volume Growth: On standalone basis, the management expects 15% volume growth in FY19E and over 20% from FY20E onwards, once the Mysuru and Vizag facilities comes on stream.
RAK: The facility is currently operating at 30-35% utilisation and it requires 60% utilisation to reach a break even. The company has developed certain product, if it materialized in a final order, the management expects the facility can reach 60% utilisation by the end of 2QFY19 and achieve break-even in the month of October / November, 2018.
Maintain BUY
Rising sales of IML in the revenue, has helped the company to report improvement in EBITDA/kg to Rs32.6/kg (standalone) in 1QFY19. We expect EBITDA/kg to remain strong in the next two years, driven by higher contribution from the F&F segment. Increasing share of IML in the overall revenue mix and higher visibility of volume augurs well for the company. The company's strong tool room capability and structural improvement in business mix supports our positive view on the MTEP. At CMP, the stock is trading at 20.9x/18.3x FY19E/FY20E earnings, which in our view is attractive. We reiterate BUY with an unchanged target price of Rs351.
Company Background
Mold-Tek Packaging is the market leader in rigid plastic packaging in India with more than 20 years of experience. It is involved in manufacturing injection molded packaging containers, primarily pails (cylindrical containers) for paints, lubricants, food and other products. The company has a world-class integrated facility, from product inception to mold designing, processing and decorating products. It has seven processing plants in India, three stock points and ~70 molding machines. The company has capacity of ~27,000 tonnes in India and 3,000 tonnes in the UAE.
Kotak Securities – Private Client Research Please see the Disclosure/Disclaimer on the last page For Private Circulation 10
AUGUST 6, 2018
Financials: Consolidated
Profit and Loss Statement (Rs mn)
(Year-end Mar) FY17 FY18 FY19E FY20E
Net sales 3,089 3,577 4,074 4,641 growth (%) 12.1 15.8 13.9 13.9 Operating expenses 2,595 2,961 3,347 3,813 EBITDA 494 615 765 876 growth (%) 7.8 24.6 24.3 14.5 Depreciation 103 132 137 157 EBIT 391 484 628 719 Other income 10 10 11 13 Interest paid 19 46 33 38 Exceptional Items 1 0 0 0 PBT 383 447 606 694 Tax 140.3 168.8 202.3 231.8 Effective tax rate (%) 37 38 33 33 Net profit 243 278 403 462 Minority interest 0 0 0 0 Reported Net profit 243 278 403 462 growth (%) 0.7 14.7 44.9 14.6
Source: Company, Kotak Securities – Private Client Research
Cash flow Statement (Rs mn)
(Year-end Mar) FY17 FY18 FY19E FY20E
Pre-tax profit 383 447 606 694 Depreciation 103 132 137 157 Chg in working capital (234) (263) (276) (248) Other operating activities (122) (123) (170) (180) Operating CF 131 192 297 423 Capital expenditure (252) (330) (286) (200) Chg in investments 0 (71) 71 0 Other investing activities 0 0 0 0 Investing CF (252) (401) (215) (200) Equity raised/(repaid) 0 0 0 0 Debt raised/(repaid) 246 415 114 10 Dividend (incl. tax) 120 130 162 162 Other financing activities 32 17 33 38 Financing CF 120 210 (81) (190) Net chg in cash & bank bal. (2) 1 1 34
Closing cash & bank bal 9 10 11 45
Source: Company, Kotak Securities – Private Client Research
Balance sheet (Rs mn)
(Year-end Mar) FY17 FY18 FY19E FY20E
Cash & Bank balances 9 10 11 45 Other Current assets 1,321 1,473 1,900 2,189 Investments 32 103 32 32 Net fixed assets 1,147 1,477 1,757 1,957 Other non-current assets 12 76 76 76 Total assets 2,519 3,138 3,776 4,298 Current liabilities 510 339 767 939 Borrowings 540 957 1,069 1,079 Other non-current liab 58 102 135 176 Total liabilities 1,108 1,398 1,971 2,194 Share capital 138 138 138 138 Reserves & surplus 1,274 1,601 1,667 1,967 Shareholders' funds 1,413 1,740 1,805 2,105 Minority interest 0 0 0 0 Total equity & liabilities 2,519 3,138 3,776 4,298
Source: Company, Kotak Securities – Private Client Research
Ratio Analysis
(Year-end Mar) FY17 FY18 FY19E FY20E
Profitability and return ratios (%) EBITDAM 16.0 17.2 18.8 18.9 EBITM 12.7 13.5 15.4 15.5 NPM 7.9 7.8 9.9 10.0 RoE 15.9 16.0 20.5 20.4 RoCE 16.4 16.3 17.2 17.3 Per share data (Rs) EPS 8.8 10.1 14.6 16.7 CEPS 12.5 14.8 19.5 22.3 DPS 3.6 4.0 5.0 5.0 BV 55.1 61.2 70.8 82.0 Valuation ratios (x) PE (x) 34.8 30.3 20.9 18.3 P/BV (x) 5.5 4.9 4.3 3.7 EV/EBITDA (x) 18.3 15.3 12.4 9.6 EV/Sales (x) 2.9 2.6 2.3 1.8 Other key ratios D/E (x) 0.4 0.6 0.6 0.5
DSO (days) 61 74 74 74
Source: Company, Kotak Securities – Private Client Research
Kotak Securities – Private Client Research Please see the Disclosure/Disclaimer on the last page For Private Circulation 11
AUGUST 6, 2018
MARICO LTD (MARICO) PRICE RS.352 TARGET RS.375 ACCUMULATE
Marico has delivered strong quarterly performance in the backdrop of the extremely challenging input cost environment, with healthy volume growth across key segments including Parachute Rigids (+9% YoY), Value Added Hair Oils (VAHO) (+15% YoY) and Saffola (+15% YoY). YoY comparison is not possible as Q1FY18 was a pre-GST quarter. The company continue to face Gross margin pressure due to steep increase in copra prices, which Marico countered with price hikes in the Coconut Oil portfolio. While near-term earnings shall continue to face pressure on weaker margins (higher copra prices), we believe that Marico’s longer-term prospects remain strong, as the company continues to maintain/ gain market share in most of its categories. We maintain ACCUMULATE with a revised price target of Rs 375(Rs 334 earlier).
Key Highlights
Revenues was reported at Rs20.27 bn (+20.5% YoY), marginally ahead of expectations. Outperformance was driven by the domestic business with volumes growing by 12.4% (YoY), while the International business posted a volume growth of 3% YoY. Also rural growth (+28% YoY) outpaced urban growth (+16% YoY) for the fourth straight quarter.
Gross profit was reported at Rs 8.57 bn with gross margins of 42.3% (down 550 bps YoY). Gross Margins continued to remain under pressure owing to inflationary cost environment. Marico has taken price hikes in the Coconut Oil portfolio to counter the steep increase in copra prices. During the quarter, the average market price of copra was up 42% YoY, but down 6% sequentially. The downward trend in Copra prices is healthy for Marico.
During the quarter, other key inputs - Rice Bran Oil, Safflower Oil, Liquid Paraffin (LLP) and HDPE (a key ingredient in packaging material) were up 18%, 26%, 12% and 22%, respectively, on a YoY basis in sync with prices of edible oils and crude oil. However, Marico has the pricing power to pass on the raw material inflation gradually to customers.
Promotion expenses, employee cost, miscellaneous expenditure, depreciation and taxation remained stable for the company.
The company would continue to exercise a bias for franchise expansion as long as margins remain within a band and do not fall below a threshold at the overall business level.
Consequently company reported PAT of Rs 2.6 bn, marginally below our expectation
Result Update
Stock Details
Market cap (Rs mn) : 455030
52-wk Hi/Lo (Rs) : 375 / 284
Face Value (Rs) : 1
3M Avg. daily vol (Nos) : 2,106,798
Shares o/s (mn) : 1291
Source: Bloomberg
Financial Summary
Y/E Mar (Rs mn) FY18 FY19E FY20E
Revenue 63,222 75,727 85,738
Growth (%) 6.8 19.8 13.2
EBITDA 11,378 13,292 16,471
EBITDA margin (%) 17.1 18.4 18.5
PAT 8,155 9,308 11,508
EPS 6.3 7.2 8.9
EPS Growth (%) 0.4 24.5 13.9
BV (Rs/share) 19.7 22.2 25.3
Dividend/share (Rs) 3.8 4.1 5.0
ROE (%) 33.7 34.4 37.6
ROCE (%) 42.0 43.9 48.8
P/E (x) 55.7 48.8 39.5
EV/EBITDA (x) 37.2 32.0 26.0
P/BV (x) 17.8 15.9 13.9
Source: Company, Kotak Securities - PCG
Shareholding Pattern (%)
(%) Jun-18 Mar-18 Dec-17
Promoters 59.7 66.3 65.8
FII 25.6 18.0 18.0
DII 7.5 12.2 11.8
Others 6.9 3.5 4.4
Source: Company
Price Performance (%)
(%) 1M 3M 6M
Marico Ltd 3.4 12.9 15.8
Nifty 6.2 6.4 5.6
Source: Bloomberg
Price chart (Rs)
Source: Bloomberg
Amit Agarwal [email protected] +91 22 6218 6439
280
300
320
340
360
380
Aug-17 Dec-17 Apr-18 Aug-18
Kotak Securities – Private Client Research Please see the Disclosure/Disclaimer on the last page For Private Circulation 12
AUGUST 6, 2018
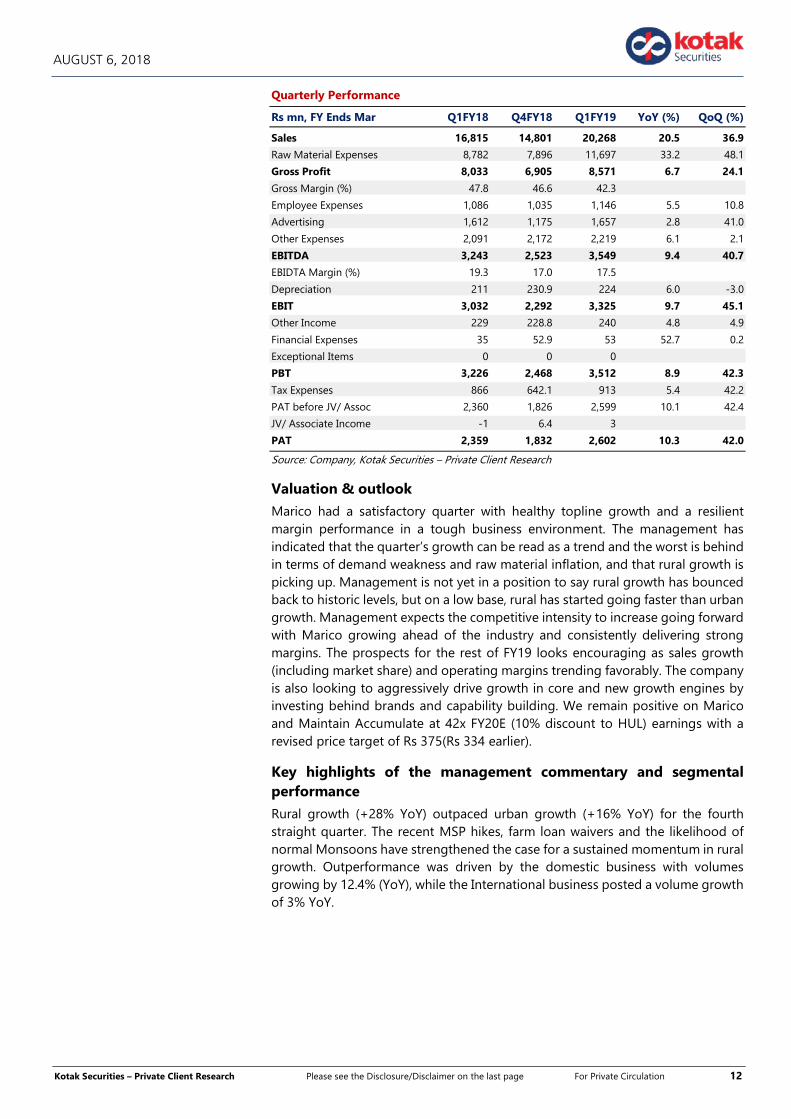
Quarterly Performance
Rs mn, FY Ends Mar Q1FY18 Q4FY18 Q1FY19 YoY (%) QoQ (%)
Sales 16,815 14,801 20,268 20.5 36.9
Raw Material Expenses 8,782 7,896 11,697 33.2 48.1
Gross Profit 8,033 6,905 8,571 6.7 24.1
Gross Margin (%) 47.8 46.6 42.3
Employee Expenses 1,086 1,035 1,146 5.5 10.8
Advertising 1,612 1,175 1,657 2.8 41.0
Other Expenses 2,091 2,172 2,219 6.1 2.1
EBITDA 3,243 2,523 3,549 9.4 40.7
EBIDTA Margin (%) 19.3 17.0 17.5
Depreciation 211 230.9 224 6.0 -3.0
EBIT 3,032 2,292 3,325 9.7 45.1
Other Income 229 228.8 240 4.8 4.9
Financial Expenses 35 52.9 53 52.7 0.2
Exceptional Items 0 0 0
PBT 3,226 2,468 3,512 8.9 42.3
Tax Expenses 866 642.1 913 5.4 42.2
PAT before JV/ Assoc 2,360 1,826 2,599 10.1 42.4
JV/ Associate Income -1 6.4 3
PAT 2,359 1,832 2,602 10.3 42.0
Source: Company, Kotak Securities – Private Client Research
Valuation & outlook
Marico had a satisfactory quarter with healthy topline growth and a resilient margin performance in a tough business environment. The management has indicated that the quarter’s growth can be read as a trend and the worst is behind in terms of demand weakness and raw material inflation, and that rural growth is picking up. Management is not yet in a position to say rural growth has bounced back to historic levels, but on a low base, rural has started going faster than urban growth. Management expects the competitive intensity to increase going forward with Marico growing ahead of the industry and consistently delivering strong margins. The prospects for the rest of FY19 looks encouraging as sales growth (including market share) and operating margins trending favorably. The company is also looking to aggressively drive growth in core and new growth engines by investing behind brands and capability building. We remain positive on Marico and Maintain Accumulate at 42x FY20E (10% discount to HUL) earnings with a revised price target of Rs 375(Rs 334 earlier).
Key highlights of the management commentary and segmental performance
Rural growth (+28% YoY) outpaced urban growth (+16% YoY) for the fourth straight quarter. The recent MSP hikes, farm loan waivers and the likelihood of normal Monsoons have strengthened the case for a sustained momentum in rural growth. Outperformance was driven by the domestic business with volumes growing by 12.4% (YoY), while the International business posted a volume growth of 3% YoY.

Kotak Securities – Private Client Research Please see the Disclosure/Disclaimer on the last page For Private Circulation 13
AUGUST 6, 2018
Domestic volume growth trend for Marico (%)
Source: Company, Kotak Securities – Private Client Research
Parachute Rigids reported a volume growth of 9% YoY. During the quarter, the average market price of copra was up 42% YoY, but down 6% sequentially .The downward trend in Copra prices is healthy for Marico.
The YoY increase in copra prices in Q1FY19 prompted Marico to take price hike in the Coconut Oil portfolio. As a result, the portfolio grew 38% in value terms. The Coconut Oil franchise strengthened its leadership, holding a volume market share of ~59% (June 2018 MAT). Two important observations for the coconut oil portfolio: 1) Parachute (Rigids) volume growth print of 9% despite price hikes and 2) Sequential fall in copra prices which is critical for the company to delivery healthy earnings growth. In the medium term, the company expects to deliver 5- 7% volume CAGR (guidance unchanged).
Parachute volume growth for Marico (%)
Source: Company, Kotak Securities – Private Client Research
Saffola refined edible oils grew 10% YoY in volume terms. The franchise gained traction in Modern Trade and E-Commerce. Management highlighted that the challenges for the brand are still not completely over. In addition to tactical inputs towards improving the consumer value proposition, Marico upped media investments in the brand in the quarter. Management expects a healthy growth trajectory for Saffola over the next 2-3 quarters and expects double-digit growth in the medium term. The brand consolidated its leadership position in the super premium refined edible oils segment with ~70% volume market share (June 2018 MAT).
6.05.5
10.58.4 8.0
3.4
-4.0
10.0
-9.0
8.09.4
1.0
12.4
-10.0
-5.0
0.0
5.0
10.0
15.0
8.011.0
4.06.0 7.0
-6.0
-1.0
15.0
-9.0
12.015.0
-5.0
9.0
-10.0
-5.0
0.0
5.0
10.0
15.0
20.0

Kotak Securities – Private Client Research Please see the Disclosure/Disclaimer on the last page For Private Circulation 14
AUGUST 6, 2018
Value Added Hair Oils (VAHO) - Domestic VAHO portfolio grew 15% in volume terms and 12% in value terms. Marico has consolidated its market leadership with a volume share of ~34% and value share of ~26% (June 2018 MAT). Going forward, the company targets double-digit volume growth in VAHO. They also aim to defend both their volume and value market share in the segment. For fueling growth in the segment: 1) Nihar Naturals Shanti Jasmine Coconut Hair Oil was launched in Maharashtra, Chhattisgarh, Madhya Pradesh and Gujarat and 2) Company launched a new-age hair nourishment product range to capture the hair nourishment needs of consumers who usually neglect their hair health for want of time.
Growth trends for other categories (YoY %)
Quarter Q4FY17 Q1FY18 Q2FY18 Q3FY18 Q4FY18 Q1FY19
VAHO 10.0 (8.0) 12.0 8.0 11.0 15.0
Saffola 6.0 (9.0) 3.0 0.0 (1.0) 10.0
Source: Company, Kotak Securities – Private Client Research
Healthy Foods grew by 23% YoY in value terms. Saffola Masala Oats continued to dominate the flavored oats category with a value market share of ~69%. During the quarter, the Company prototyped Saffola Masala Oats with Multigrain Crunchies, a first-of-its-kind innovation in the category, and also launched two new variants– Lemony Twist & Mint Chutney. With current vending machine network of 200, management believes that this initiative drives consumer trials and repeats. They continue to guide that they are aiming to grow the business first to Rs 2 bn by FY20 (achieve a critical mass) and will then chalk out a future strategy.
Male grooming portfolio grew 44% YoY in value terms during the quarter. Given the strong response to its pocket spray, company plans to extend it to beyond the initial launch markets. They have also launched its first exclusively digital brand – Set Wet Studio X – introducing products across seven categories such as Shampoo, Bodywash, Facewash, etc. Company seeks to build a consistent value growth trajectory of 20%+ in the category in the medium term.
Outperformance was driven by the domestic business with volumes growing by 12.4% (YoY), while the International business posted a volume growth of 3% YoY. Bangladesh grew by 9% in constant currency (cc) terms. Middle East and North Africa posted a volume led recovery, growing 17% (in cc terms).Vietnam was flattish as the growth in Home and Personal Care (HPC) was offset by the decline in Foods. Myanmar faced one-off supply constraints. South Africa (including Isoplus) posted a growth of 7% (in cc terms). New Country Development & Exports grew 5% in cc terms.
Valuation & outlook
In terms of numbers, we factor in 20%/13% growth in revenues for FY19/FY20. While gross margins are likely to contract in the coming year, we expect that the company shall be able to save costs in other lines to expand EBITDA margin by ~140 bps over FY18-FY20E. We expect EPS growth of 25%/14% in FY19/FY20.We expect earnings growth acceleration from 2HFY19 onwards on the back of improving underlying demand environment. Copra prices remain a risk but historical trends suggest favorable movement from here. We remain positive on Marico and Maintain Accumulate at 42x FY20E (10% discount to HUL) earnings with a revised price target of Rs 375(Rs 334 earlier).
Key risks to our investment view/ estimates include competitive risks, risks from higher raw material prices.

Kotak Securities – Private Client Research Please see the Disclosure/Disclaimer on the last page For Private Circulation 15
AUGUST 6, 2018
Company background
Marico is a leading Indian Group in Consumer Products in the Global Beauty and Wellness space. Marico markets well-known brands such as Parachute, Saffola, Hair & Care, Nihar, Parachute Advansed, Nihar Naturals, Mediker, Revive, Set Wet, Livon, Fiancée, HairCode, Caivil, Black Chic, Isoplus, Code 10, Ingwe, X-Men, and Thuan Phat. 90% of Marico’s portfolio of brands occupies leadership positions in their respective categories.

Kotak Securities – Private Client Research Please see the Disclosure/Disclaimer on the last page For Private Circulation 16
AUGUST 6, 2018
Financials: Consolidated
Profit and Loss Statement (Rs mn)
(Year-end Mar) FY17 FY18 FY19E FY20E
Revenues 59,178 63,222 75,727 85,738 % change YoY -1.6 6.8 19.8 13.2 Raw material cost 28,310 33,482 41,879 46,486 Employee cost 3,022 3,234 3,791 4,246 Other expenses 16,254 15,129 16,765 18,536 Total Operating expd 47,585 51,844 62,435 69,267 EBITDA 11,593 11,378 13,292 16,471 Depreciation 903 891 953 1,020 EBIT 10,690 10,487 12,339 15,451 Other income 973 846 900 1,020 Interest expense 166 162 162 222 Profit before tax 11,497 11,171 13,077 16,249 Tax 3,377 3,016 3,769 4,741 ETR (%) 29.4 27.0 28.8 29.2 Profit after tax 8,120 8,155 9,308 11,508 Minorities& Associates 0 0 0 0 Net income 8,120 8,155 9,308 11,508 % change YoY 13.7 0.4 14.1 23.6 Shares outstanding (m) 1,290 1,290 1,290 1,290
EPS (Rs) 6.3 6.3 7.2 8.9
Source: Company, Kotak Securities – Private Client Research
Cash flow Statement (Rs mn)
(Year-end Mar) FY17 FY18 FY19E FY20E
PAT 8,120 8,155 9,308 11,508 Depreciation 903 891 953 1,020 Change in working capital (1,827) (3,547) (1,940) (2,695) Cash flow from operations 7,196 5,500 8,322 9,833 Capex (401) (1,233) (500) (500) Investments (950) 358 - - Cash flow from investments (1,351) (875) (500) (500) Equity issuance (0) - - - Debt raised (918) 705 - - Dividend Paid (5,655) (5,686) (6,132) (7,496) Miscellanous items - - - - Cash flow from financing (6,573) (4,981) (6,132) (7,496) Net cash flow (728) (357) 1,690 1,837 Opening cash 3,171 2,443 2,086 3,776
Closing cash 2,443 2,086 3,776 5,613
Source: Company, Kotak Securities – Private Client Research
Balance sheet (Rs mn)
(Year-end Mar) FY17 FY18 FY19E FY20E
Cash 2,443 2,086 3,776 5,613 Debtors 2,470 3,406 4,072 5,237 Inventory 12,534 15,109 18,066 23,235 Other current assets 1,598 3,310 3,811 4,894 Total current assets 16,603 21,824 25,949 33,367 LT investments 6,082 5,724 5,724 5,724 Net fixed assets 10,733 11,076 10,622 10,103 Total assets 35,861 40,710 46,073 54,808 Creditors 6,966 8,217 9,825 13,301 Other current liabilities 2,567 2,948 3,525 4,772 Provisions 961 1,004 1,004 1,004 Total current liabilities 10,494 12,168 14,354 19,077 LT debt 2,388 3,093 3,093 3,093 Minority Interest 0 0 0 0 Equity Capital 1,290 1,290 1,290 1,290 Reserves 21,689 24,159 27,335 31,347 Networth 22,980 25,449 28,626 32,638 Total liabilities 35,861 40,710 46,073 54,808 BVPS (Rs) 17.8 19.7 22.2 25.3
Source: Company, Kotak Securities – Private Client Research
Ratio Analysis
(Year-end Mar) FY17 FY18 FY19E FY20E
EBITDA margin (%) 19.6 17.1 18.4 18.5 EBIT margin (%) 18.1 16.6 16.3 18.0 Net profit margin (%) 13.7 12.9 12.3 13.4 ROE (%) 37.3 33.7 34.4 37.6 ROCE (%) 47.4 42.0 43.9 48.8 DPS 3.8 3.8 4.1 5.0 Dividend payout (%) 37.9 32.2 29.9 30.6 Working capital turnover (days) 32.0 45.5 51.2 55.1 Debt Equity (x) 0.1 0.1 0.1 0.1 PER (x) 55.9 55.7 48.8 39.5 P/C (x) 50.3 50.2 44.3 36.3 Dividend yield (%) 1.1 1.1 1.2 1.4 P/B (x) 19.8 17.8 15.9 13.9 EV/Sales (x) 7.7 7.2 6.0 5.3
EV/ EBITDA (x) 36.1 37.2 32.0 26.0
Source: Company, Kotak Securities – Private Client Research
Kotak Securities – Private Client Research Please see the Disclosure/Disclaimer on the last page For Private Circulation 17
AUGUST 6, 2018
VIP INDUSTRIES LTD (VIP) PRICE RS.529 TARGET RS.570 ACCUMULATE
Multi quarter super performance – VIP Industries has reported its strongest quarter in the history of the company. The strength of the performance indicates strong volume growth in a seasonally strong quarter for the company, improvement in realisations with pass through of raw material price inflation and sustained efforts by the company to improve its performance.
Key Highlights
VIP has reported strong sales of Rs 5.18 bn (+42.8% QoQ and +29.5% YoY) net of all taxes. Management indicated that the domestic segment remains strong for the company. Reduction in GST rate from the peak of 28% to 18%, increase air travel and Q1 Indian marriage season propelled the demand.
Healthy realisations, strong demand and favorable product mix has helped the company with its strongest ever EBIDTA of Rs 911 mn with EBIDTA margin of 17.6 % (+260 bps QoQ and +230 bps YoY). It is commendable that the margins have improved by a significant proportion despite an inflationary cost environment. The current quarters strong margins has prompted us to increase our margin assumption by 100 bps each for FY19E and FY20E
Consequently PAT was reported at Rs 599 mn ahead of our expectation of Rs 411 mn. We interpret the results as very strong for the company.
Valuation & Outlook We estimate the company to be a major beneficiary of increasing penetration of luggage bags and back-packs in the country, improving living standards leading to increased air and rail travel and also the desire for travellers to have branded luggage.
We are increasing our earnings estimate to Rs 12.3 per share (from Rs 11) for FY19 and to Rs 14.2 per share (from 12.7) on the back of strong operational performance in Q1FY19, healthy volume growth and strong guidance We now estimate a revenue CAGR of 21% and earnings CAGR of 26% over FY18 to FY20E with strong operating margins and return ratios. The stock has run by more than 30% since our last update, but still offers upside owing to its continued strong performance. We now Recommend an ACCUMULATE for this high growth stock with an increased TP of Rs 570 (from Rs450) at 40x FY20E (increased from 35x).
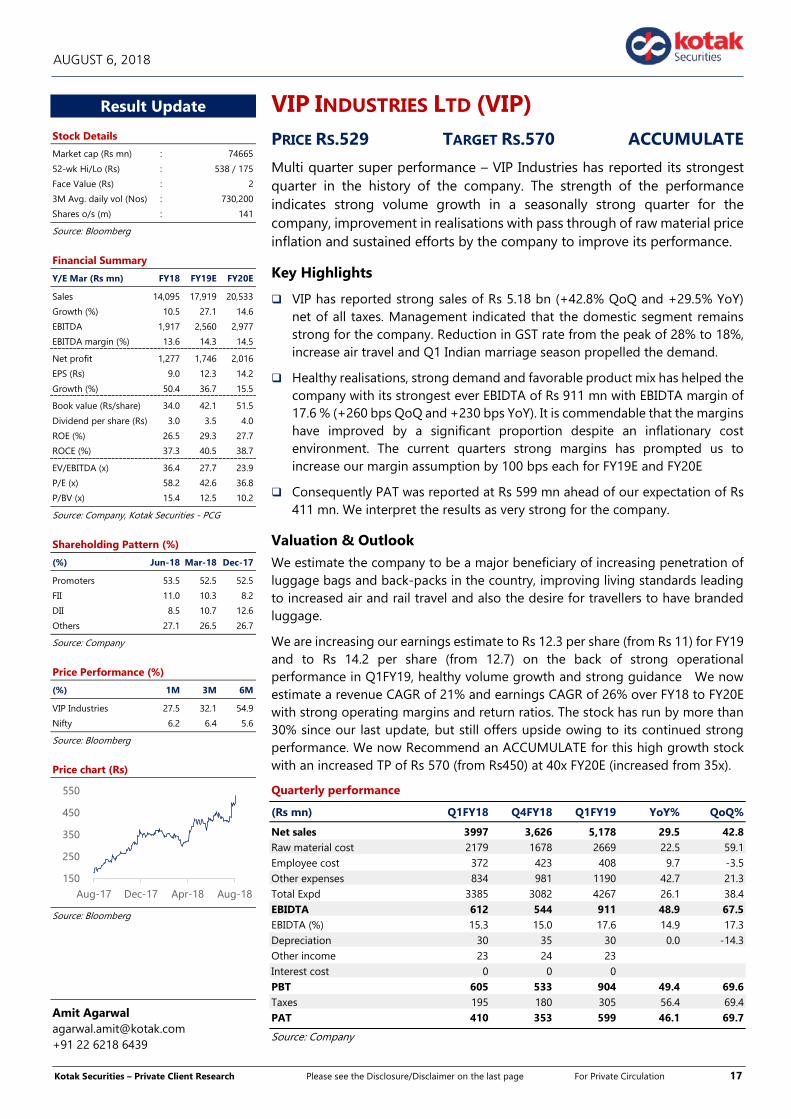
Quarterly performance
(Rs mn) Q1FY18 Q4FY18 Q1FY19 YoY% QoQ%
Net sales 3997 3,626 5,178 29.5 42.8 Raw material cost 2179 1678 2669 22.5 59.1 Employee cost 372 423 408 9.7 -3.5 Other expenses 834 981 1190 42.7 21.3 Total Expd 3385 3082 4267 26.1 38.4 EBIDTA 612 544 911 48.9 67.5 EBIDTA (%) 15.3 15.0 17.6 14.9 17.3 Depreciation 30 35 30 0.0 -14.3 Other income 23 24 23 Interest cost 0 0 0 PBT 605 533 904 49.4 69.6 Taxes 195 180 305 56.4 69.4 PAT 410 353 599 46.1 69.7
Source: Company
Result Update
Stock Details
Market cap (Rs mn) : 74665
52-wk Hi/Lo (Rs) : 538 / 175
Face Value (Rs) : 2
3M Avg. daily vol (Nos) : 730,200
Shares o/s (m) : 141
Source: Bloomberg
Financial Summary
Y/E Mar (Rs mn) FY18 FY19E FY20E
Sales 14,095 17,919 20,533
Growth (%) 10.5 27.1 14.6
EBITDA 1,917 2,560 2,977
EBITDA margin (%) 13.6 14.3 14.5
Net profit 1,277 1,746 2,016
EPS (Rs) 9.0 12.3 14.2
Growth (%) 50.4 36.7 15.5
Book value (Rs/share) 34.0 42.1 51.5
Dividend per share (Rs) 3.0 3.5 4.0
ROE (%) 26.5 29.3 27.7
ROCE (%) 37.3 40.5 38.7
EV/EBITDA (x) 36.4 27.7 23.9
P/E (x) 58.2 42.6 36.8
P/BV (x) 15.4 12.5 10.2
Source: Company, Kotak Securities - PCG
Shareholding Pattern (%)
(%) Jun-18 Mar-18 Dec-17
Promoters 53.5 52.5 52.5
FII 11.0 10.3 8.2
DII 8.5 10.7 12.6
Others 27.1 26.5 26.7
Source: Company
Price Performance (%)
(%) 1M 3M 6M
VIP Industries 27.5 32.1 54.9
Nifty 6.2 6.4 5.6
Source: Bloomberg
Price chart (Rs)
Source: Bloomberg
Amit Agarwal [email protected] +91 22 6218 6439
150
250
350
450
550
Aug-17 Dec-17 Apr-18 Aug-18
Kotak Securities – Private Client Research Please see the Disclosure/Disclaimer on the last page For Private Circulation 18
AUGUST 6, 2018
Currents quarter’s performance was propelled by volume growth across segments by the company including VIP, Aristocrat, Alfa, Skybags, Caprese and Carlton attributed to:
1. Increasing penetration of luggage bags
2. Customer preference for branded products
3. Substantial brand availability with wide distribution network
4. Diversified product portfolio
5. Implementation of GST
6. Healthy domestic air traffic
7. Seasonal marriage season in India
Strong traffic – creates demand for branded luggage
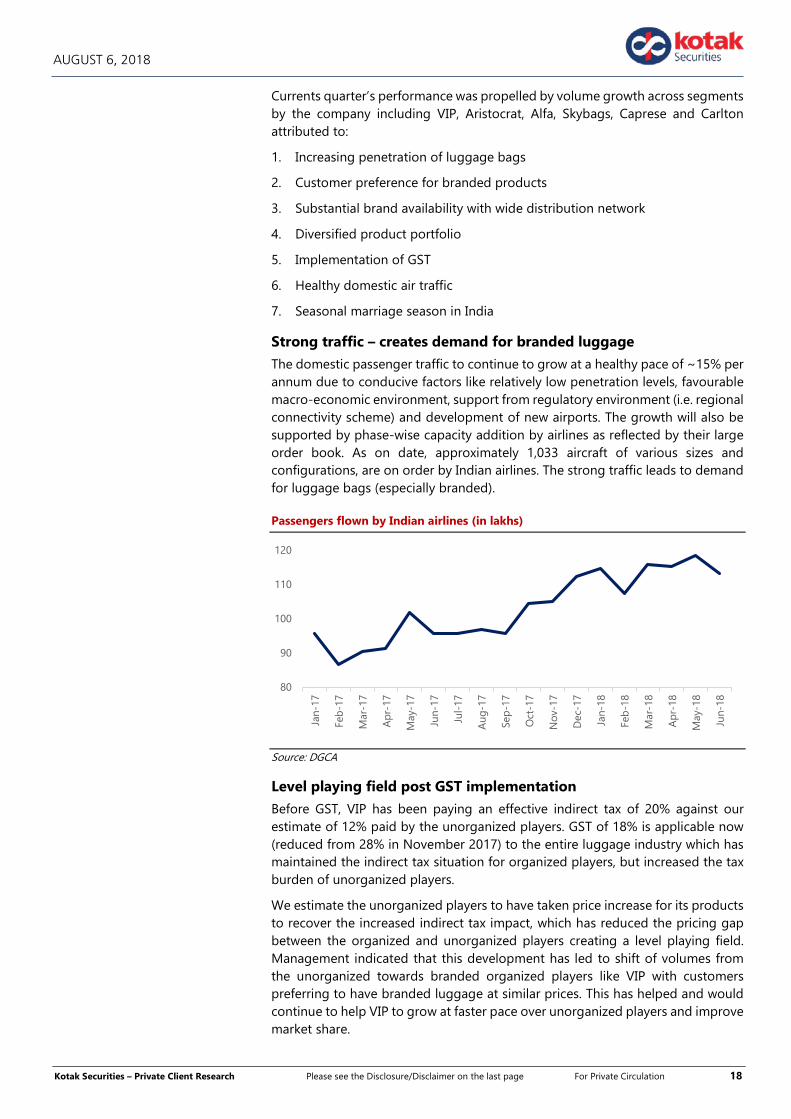
The domestic passenger traffic to continue to grow at a healthy pace of ~15% per annum due to conducive factors like relatively low penetration levels, favourable macro-economic environment, support from regulatory environment (i.e. regional connectivity scheme) and development of new airports. The growth will also be supported by phase-wise capacity addition by airlines as reflected by their large order book. As on date, approximately 1,033 aircraft of various sizes and configurations, are on order by Indian airlines. The strong traffic leads to demand for luggage bags (especially branded).
Passengers flown by Indian airlines (in lakhs)
Source: DGCA
Level playing field post GST implementation
Before GST, VIP has been paying an effective indirect tax of 20% against our estimate of 12% paid by the unorganized players. GST of 18% is applicable now (reduced from 28% in November 2017) to the entire luggage industry which has maintained the indirect tax situation for organized players, but increased the tax burden of unorganized players.
We estimate the unorganized players to have taken price increase for its products to recover the increased indirect tax impact, which has reduced the pricing gap between the organized and unorganized players creating a level playing field. Management indicated that this development has led to shift of volumes from the unorganized towards branded organized players like VIP with customers preferring to have branded luggage at similar prices. This has helped and would continue to help VIP to grow at faster pace over unorganized players and improve market share.
80
90
100
110
120
Jan-
17
Feb
-17
Mar
-17
Apr
-17
May
-17
Jun-
17
Jul-
17
Aug
-17
Sep
-17
Oct
-17
Nov
-17
Dec
-17
Jan-
18
Feb
-18
Mar
-18
Apr
-18
May
-18
Jun-
18
Kotak Securities – Private Client Research Please see the Disclosure/Disclaimer on the last page For Private Circulation 19
AUGUST 6, 2018
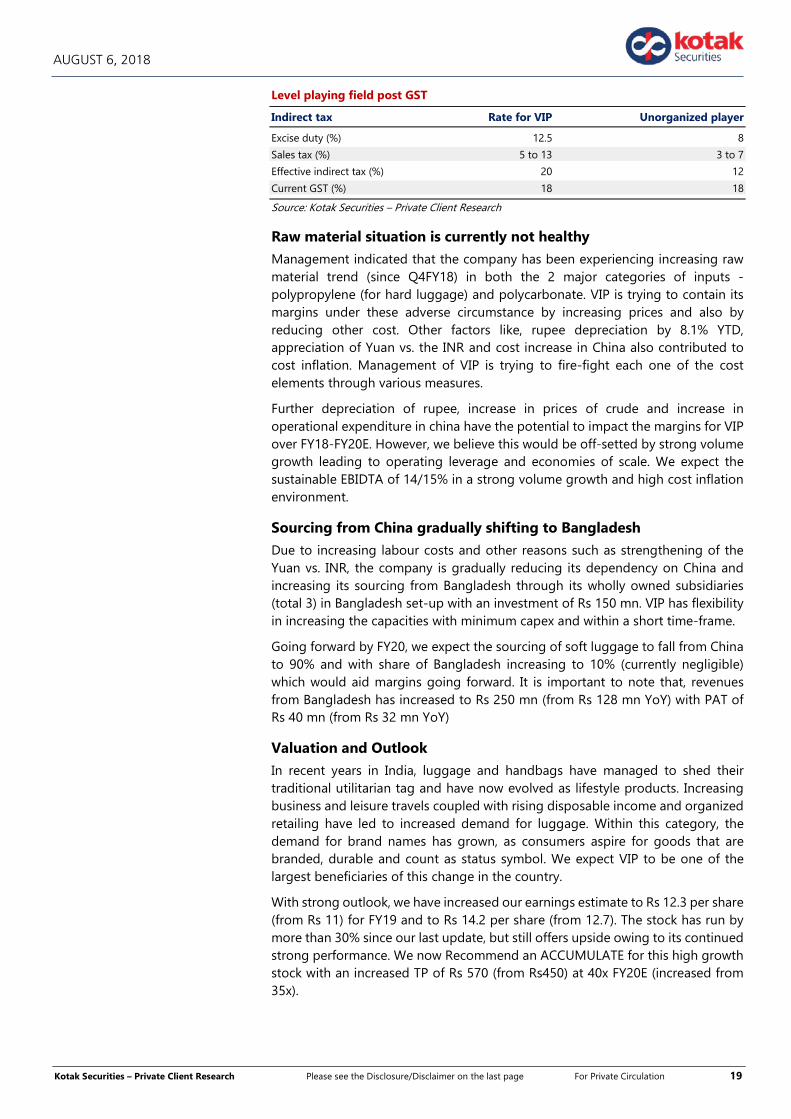
Level playing field post GST
Indirect tax Rate for VIP Unorganized player
Excise duty (%) 12.5 8
Sales tax (%) 5 to 13 3 to 7
Effective indirect tax (%) 20 12
Current GST (%) 18 18
Source: Kotak Securities – Private Client Research
Raw material situation is currently not healthy
Management indicated that the company has been experiencing increasing raw material trend (since Q4FY18) in both the 2 major categories of inputs - polypropylene (for hard luggage) and polycarbonate. VIP is trying to contain its margins under these adverse circumstance by increasing prices and also by reducing other cost. Other factors like, rupee depreciation by 8.1% YTD, appreciation of Yuan vs. the INR and cost increase in China also contributed to cost inflation. Management of VIP is trying to fire-fight each one of the cost elements through various measures.
Further depreciation of rupee, increase in prices of crude and increase in operational expenditure in china have the potential to impact the margins for VIP over FY18-FY20E. However, we believe this would be off-setted by strong volume growth leading to operating leverage and economies of scale. We expect the sustainable EBIDTA of 14/15% in a strong volume growth and high cost inflation environment.
Sourcing from China gradually shifting to Bangladesh
Due to increasing labour costs and other reasons such as strengthening of the Yuan vs. INR, the company is gradually reducing its dependency on China and increasing its sourcing from Bangladesh through its wholly owned subsidiaries (total 3) in Bangladesh set-up with an investment of Rs 150 mn. VIP has flexibility in increasing the capacities with minimum capex and within a short time-frame.
Going forward by FY20, we expect the sourcing of soft luggage to fall from China to 90% and with share of Bangladesh increasing to 10% (currently negligible) which would aid margins going forward. It is important to note that, revenues from Bangladesh has increased to Rs 250 mn (from Rs 128 mn YoY) with PAT of Rs 40 mn (from Rs 32 mn YoY)
Valuation and Outlook
In recent years in India, luggage and handbags have managed to shed their traditional utilitarian tag and have now evolved as lifestyle products. Increasing business and leisure travels coupled with rising disposable income and organized retailing have led to increased demand for luggage. Within this category, the demand for brand names has grown, as consumers aspire for goods that are branded, durable and count as status symbol. We expect VIP to be one of the largest beneficiaries of this change in the country.
With strong outlook, we have increased our earnings estimate to Rs 12.3 per share (from Rs 11) for FY19 and to Rs 14.2 per share (from 12.7). The stock has run by more than 30% since our last update, but still offers upside owing to its continued strong performance. We now Recommend an ACCUMULATE for this high growth stock with an increased TP of Rs 570 (from Rs450) at 40x FY20E (increased from 35x).
Kotak Securities – Private Client Research Please see the Disclosure/Disclaimer on the last page For Private Circulation 20
AUGUST 6, 2018
Company Background
VIP Industries, established in the year 1971, is a leading luggage maker in India offering a wide range of products in hard luggage and soft luggage segments including school bags, trolleys, backpacks, suitcases, executive cases, duffels and overnight travel solutions. Some of its brands include VIP, Caprese, Alfa, Aristocrat, Buddy and Carlton. The company is Asia’s No.1 luggage manufacturer and transforming its business strategy from time to time. The company has manufacturing facilities located at Haridwar in Uttarakhand, Jalgaon, Nagpur and Nashik in Maharashtra. The company has set up a subsidiary in Bangladesh to manufacture and market luggage and bags. The company is maintaining its market share of 50% in the organized luggage industry by offering wide range of product mix like Carlton and VIP catering to high-end segment, Aristocrat caters to mid-segment, Skybags cater to mid and sub-mid segment and Alfa for lower-end price segment.
Kotak Securities – Private Client Research Please see the Disclosure/Disclaimer on the last page For Private Circulation 21
AUGUST 6, 2018
Financials: Consolidated
Profit and Loss Statement (Rs mn)
(Year-end Mar) FY17 FY18 FY19E FY20E
Revenues 12,752 14,095 17,919 20,533 % change YoY 4.8 10.5 27.1 14.6 Raw material cost 6,759 7,140 8,849 10,121 Employee cost 1,415 1,582 1,864 2,135 Other expenses 3,259 3,456 4,647 5,300 Total Operating expd 11,433 12,178 15,359 17,556 EBITDA 1,319 1,917 2,560 2,977 Depreciation 128 124 147 157 EBIT 1,191 1,793 2,413 2,819 Other income 59 104 100 100 Interest expense 6 0 0 0 Profit before tax 1,244 1,897 2,513 2,919 Tax 395.0 620.0 767.0 903.1 ETR (%) 31.8 32.7 30.5 30.9 Profit after tax 849 1,277 1,746 2,016 Minorities& Associates 0 0 0 0 Net income 849 1,277 1,746 2,016 % change YoY 25.2 50.4 36.7 15.5 Shares outstanding (m) 142 142 142 142
EPS 6.0 9.0 12.3 14.2 DPS 2.2 3.0 3.5 4.0
Source: Company, Kotak Securities – Private Client Research
Cash flow Statement (Rs mn)
(Year-end Mar) FY17 FY18 FY19E FY20E
PAT 849 1,277 1,746 2,016 Depreciation 128 124 147 157 Changes in working capital 12 (372) (819) (534) Cash flow from operations 989 1,029 1,073 1,639 Capex (65) (228) (250) (250) Investments (679) 79 100 - Cash flow from investments (744) (149) (150) (250) Equity issuance - - - - Debt raised (145) (10) (3) - Dividend Paid (371) (514) (599) (685) Miscellanous items - - - - Cash flow from financing (516) (524) (602) (685) Net cash flow (271) 356 321 704
Opening cash 345 73 430 751 Closing cash 73 430 751 1,455
Source: Company, Kotak Securities – Private Client Research
Balance sheet (Rs mn)
(Year-end Mar) FY17 FY18 FY19E FY20E
Cash and cash equivalents 73 430 751 1,455 Debtors 1,209 1,520 1,943 2,129 Inventory 2,874 3,168 4,076 4,638 Loans and advances 558 666 853 948 Other current assets 46 56 68 80 Total current assets 4,687 5,409 6,940 7,795 LT investments 679 600 500 500 Net fixed assets 615 719 822 914 Total assets 6,054 7,158 9,013 10,664 Creditors 1,457 1,692 2,189 2,439 Provisions 113 257 311 304 Other current liabilities 425 397 556 633 Total current liabilities 1,995 2,345 3,057 3,377 LT debt 13 3 0 0 Minority Interest 0 0 0 0 Equity 283 283 283 283 Reserves 3,763 4,527 5,673 7,004
Networth 4,046 4,810 5,956 7,287 Total liabilities 6,054 7,158 9,013 10,664
Source: Company, Kotak Securities – Private Client Research
Ratio Analysis
(Year-end Mar) FY17 FY18 FY19E FY20E
EBITDA margin (%) 10.3 13.6 14.3 14.5 EBIT margin (%) 9.3 12.7 13.5 13.7 Net profit margin (%) 6.7 9.1 9.7 9.8 ROE (%) 21.0 26.5 29.3 27.7 ROCE (%) 29.3 37.3 40.5 38.7 Dividend payout (%) 43.8 40.2 34.3 34.0 BVPS (Rs) 28.6 34.0 42.1 51.5 Working capital turnover (days) 77.2 65.0 62.0 62.0 Debt Equity (x) 0.0 0.0 - - PER (x) 87.5 58.2 42.6 36.8 P/C (x) 76.0 53.0 39.2 34.2 Dividend yield (%) 0.4 0.6 0.7 0.8 P/B (x) 18.4 15.4 12.5 10.2
EV/Sales (x) 5.8 5.2 4.1 3.6 EV/ EBITDA (x) 53.4 36.4 27.7 23.9
Source: Company, Kotak Securities – Private Client Research
Kotak Securities – Private Client Research Please see the Disclosure/Disclaimer on the last page For Private Circulation 22
AUGUST 6, 2018
TIME TECHNOPLAST LTD PRICE RS.140 TARGET RS.195 BUY
Time Technoplast reported healthy operating level performance for Q1FY19. Profits exceeded our estimates. The company shared positive outlook on future growth and reiterated its target to scale up the ROCE to 20% plus by FY21.
Key Highlights
The company reported volume growth of 14% in Q1FY19
The share of value added products has risen to 19% of the total sales in Q1FY19 as against 17% in the corresponding quarter of previous year.
The company has envisaged capex of Rs 2.0 bn in FY19.
Valuation and Outlook
At CMP, TTL is trading at P/E of 13.6x and 10.8x FY19E and FY20E earnings respectively, which is attractive as it is at a discount to midcap index valuation. In recent months, the TTL stock has been derated in line with general sell-off in the midcaps and smallcaps universe. However, the Q1FY19 results should put at rest concerns related to growth and profit margins. Reiterate BUY.
Q1FY19 Results
(Rs mn) Q1 FY19 Q1 FY18 YoY (%) Q4FY18 QoQ (%)
Net Sales 7815 6806 14.8 9427 -17
Material costs 5395 4705 14.7 6588 -18
Staff costs 369 328 12.4 432 -15
Other expenditure 847 758 11.8 948 -11
Total Expenditure 6611 5791 14.2 7968 -17
PBIDT 1205 1015 18.6 1459 -17
Depreciation 392 328 19.6 386 2
Other Income 5 4 36.3 11 -58
EBIT 817 691 18.3 1085 -25
Interest 227 210 7.8 247 -8
PBT 590 480 22.8 837 -30
Tax 149 111 34.5 267 -44
Minority Interest 7.29 5.9 23.6 17 -57
Net Profit after Minority Interest 434 364 19.2 554 -22
EPS (Rs) 2.1 1.7 2.6
EBITDA (%) 15.4 14.9 15.5
Material costs to sales (%) 69.0 69.1 69.9
Other expenditure (%) 10.8 11.1 10.1
Tax rate (%) 25.3 23.1 31.8
NPM (%) 5.5 5.3 5.9
Source: Company
Earnings estimates
Reported Estimated
Net sales 7815 7622
EBITDA (%) 15.5 15.0
PAT 433 378
Source: Kotak Securities – Private Client Research
Result Update
Stock Details
Market cap (Rs mn) : 31706
52-wk Hi/Lo (Rs) : 233 / 116
Face Value (Rs) : 1
3M Avg. daily vol (Nos) : 314,967
Shares o/s (mn) : 226
Source: Bloomberg
Financial Summary
Y/E Mar (Rs mn) FY18 FY19E FY20E
Revenue 31,027 35,992 41,750
Growth (%) 12.6 16.0 16.0
EBITDA 4,731 5,579 6,680
EBITDA margin (%) 15.2 15.5 16.0
PAT 1,806 2,327 2,944
EPS 8.0 10.3 13.0
EPS Growth (%) 22.7 28.9 26.5
BV (Rs/share) 65.6 41.2 43.6
Dividend/share (Rs) 0.8 0.9 0.9
ROE (%) 12.9 14.7 16.1
ROCE (%) 11.0 12.4 13.6
P/E (x) 17.5 13.6 10.8
EV/EBITDA (x) 8.3 7.0 5.8
P/BV (x) 2.1 1.9 1.6
Source: Company, Kotak Securities - PCG
Shareholding Pattern (%)
(%) Jun-18 Mar-18 Dec-17
Promoters 52.4 52.4 52.5
FII 19.3 19.4 19.2
DII 9.0 9.1 9.0
Others 19.3 19.2 19.3
Source: Company
Price Performance (%)
(%) 1M 3M 6M
Time Technoplast 8.8 (6.8) (20.7)
Nifty 6.2 6.4 5.6
Source: Bloomberg
Price chart (Rs)
Source: Bloomberg
Sanjeev Zarbade [email protected] +91 22 6218 6424
110
140
170
200
230
Aug-17 Dec-17 Apr-18 Aug-18
Kotak Securities – Private Client Research Please see the Disclosure/Disclaimer on the last page For Private Circulation 23
AUGUST 6, 2018
Consolidated results highlights
The company reported consolidated net revenues of Rs 7.8 bn in Q1FY19, up 14.8% YoY.
Volume growth was at 14% during Q1FY19; indian and overseas markets grew 15% and 11% respectively in volume terms.
The management reflected optimism in the demand scenario on account of the ongoing shift in manufacturing of chemicals from developed countries to India.
The company’s overseas business accounted for 31% of sales.
Share of value added products like (IBCs and Mox films) in Q1FY19 rose to 19% as compared to 17% on a y-o-y basis.
The operating margin for the quarter stood at 15.4%, an expansion of 50 bps on a YoY basis.
Despite cost pressure from commodities like HDPE, gross margins for the quarter was stable at 30%, which could be attributed to the higher share of value added products in revenue.
Geography-wise, the EBITDA margins in India is more or less same as in the overseas locations. However, net profit margins are higher in overseas due to lower tax rates.
Interest cost reversed its declining trend and rose 7.8% y-o-y to Rs 227 mn in Q1FY19.
Tax rate stood at 25.3% in Q1FY19 as against 23.1% in corresponding quarter of the previous fiscal.
Net profits grew by 19.2% y-o-y to Rs 434 mn driven by healthy revenue growth coupled with margin expansion.
Gross debt on consolidated basis stands at Rs 7.7 bn (as against Rs 7.77 bn in FY18), a marginal decline on a q-o-q basis.
Capex Update
The company undertook capex of Rs 355 mn in Q1FY19 consisting of Rs 255 mn and Rs 100 mn on maintenance, capacity expansion and value added products.
Product update:
The management indicated healthy order book in PE Pipe and DWC Pipe business.
The company launched new generation multilayer pipes for power / communication cable ducts with silicon in-lining. The pipes / ducts have substantial business potential specially in development of Smart Cities.
Launched next generation Matting : Duro Gel, Duro Comfort, Duro Carpet & Duro Mat.
The management indicated that private gas distribution companies are aggressively promoting & distributing cylinders across PAN India. The Company is in the process of getting approvals for composite cylinders from Chile, Taiwan and Kenya.
The Company is innovating new applications of MOX films. It is also launching new products in the market like Truck covers, Pond Liners, Mulching Films & Poly house Films.
Kotak Securities – Private Client Research Please see the Disclosure/Disclaimer on the last page For Private Circulation 24
AUGUST 6, 2018
Management concall highlights
Crisil has upgraded the company’s credit rating on short term paper to A1+ from A1.
The company has order book of Rs 2.5 bn in PE pipes and of 1.5 mn in composite cylinders.
The company has envisaged capex of Rs 2.0 bn in FY19.
The company reiterated its target of reaching 20% ROCE by 2020-21, which is based on 15% cagr in revenue growth, reduction in working capital intensity (targeting 85 days of sales) and control over borrowings.
Discussions on for divestment of battery business.
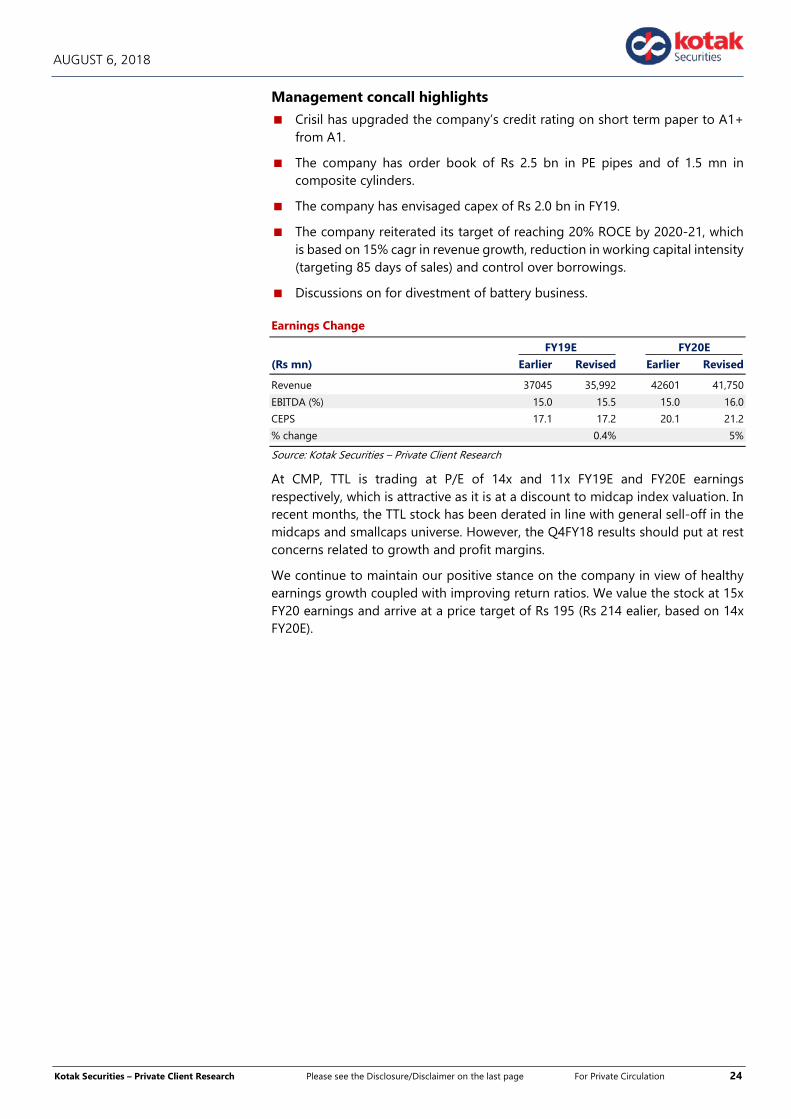
Earnings Change
FY19E FY20E (Rs mn) Earlier Revised Earlier Revised
Revenue 37045 35,992 42601 41,750
EBITDA (%) 15.0 15.5 15.0 16.0
CEPS 17.1 17.2 20.1 21.2
% change 0.4% 5%
Source: Kotak Securities – Private Client Research
At CMP, TTL is trading at P/E of 14x and 11x FY19E and FY20E earnings respectively, which is attractive as it is at a discount to midcap index valuation. In recent months, the TTL stock has been derated in line with general sell-off in the midcaps and smallcaps universe. However, the Q4FY18 results should put at rest concerns related to growth and profit margins.
We continue to maintain our positive stance on the company in view of healthy earnings growth coupled with improving return ratios. We value the stock at 15x FY20 earnings and arrive at a price target of Rs 195 (Rs 214 ealier, based on 14x FY20E).
Kotak Securities – Private Client Research Please see the Disclosure/Disclaimer on the last page For Private Circulation 25
AUGUST 6, 2018
Background
TTL’s products are based on the polymer platform and has access to major plastic moulding technologies including blow moulding and injection moulding.
The key product categories for the company are Industrial packaging products, lifestyle products (door mats, chairs, syringes), technical products (automotive components), infrastructure products (pipes and monolithic construction) and new products (composite cylinders). The largest segment is the industrial packaging accounting for 59% of revenues.
The company enjoys dominant market share in the industrial packaging business in India. The company’s multi-locational advantage enables it to respond to customer needs in an efficient basis. Also the company keeps coming out with innovations in its product offerings.
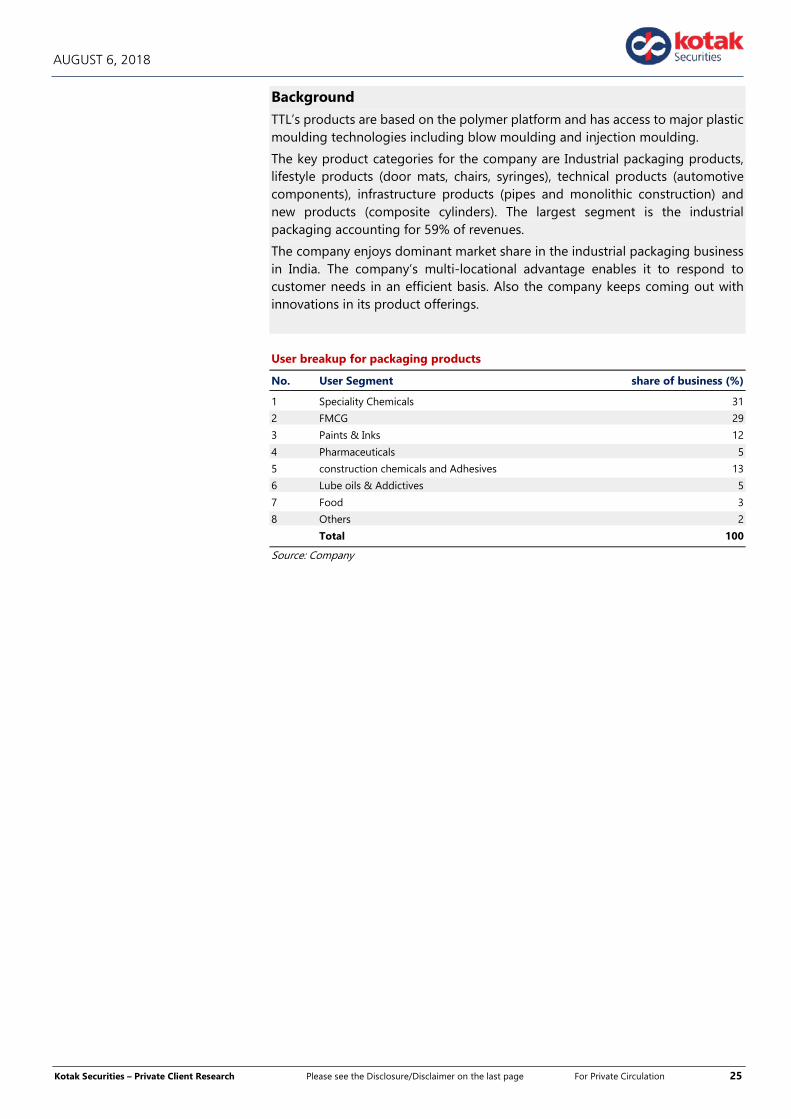
User breakup for packaging products
No. User Segment share of business (%)
1 Speciality Chemicals 31
2 FMCG 29
3 Paints & Inks 12
4 Pharmaceuticals 5
5 construction chemicals and Adhesives 13
6 Lube oils & Addictives 5
7 Food 3
8 Others 2
Total 100
Source: Company
Kotak Securities – Private Client Research Please see the Disclosure/Disclaimer on the last page For Private Circulation 26
AUGUST 6, 2018
Financials: Consolidated
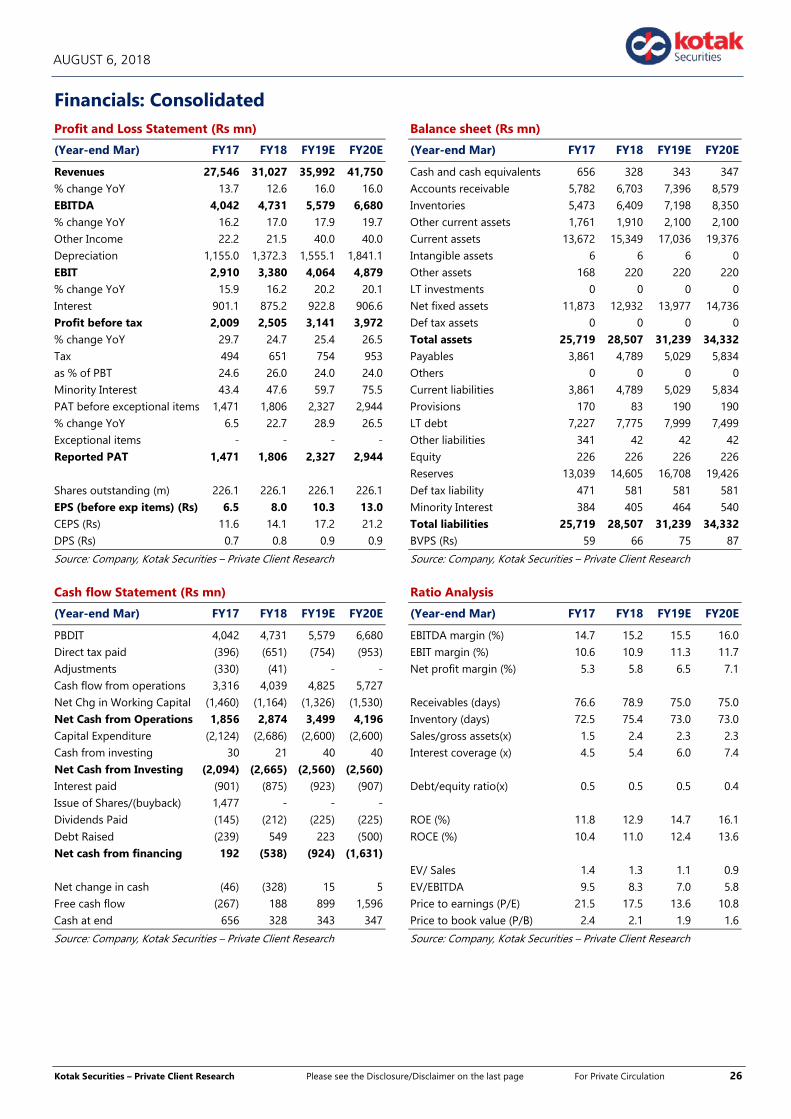
Profit and Loss Statement (Rs mn)
(Year-end Mar) FY17 FY18 FY19E FY20E
Revenues 27,546 31,027 35,992 41,750 % change YoY 13.7 12.6 16.0 16.0 EBITDA 4,042 4,731 5,579 6,680 % change YoY 16.2 17.0 17.9 19.7 Other Income 22.2 21.5 40.0 40.0 Depreciation 1,155.0 1,372.3 1,555.1 1,841.1 EBIT 2,910 3,380 4,064 4,879 % change YoY 15.9 16.2 20.2 20.1 Interest 901.1 875.2 922.8 906.6 Profit before tax 2,009 2,505 3,141 3,972 % change YoY 29.7 24.7 25.4 26.5 Tax 494 651 754 953 as % of PBT 24.6 26.0 24.0 24.0 Minority Interest 43.4 47.6 59.7 75.5 PAT before exceptional items 1,471 1,806 2,327 2,944 % change YoY 6.5 22.7 28.9 26.5 Exceptional items - - - - Reported PAT 1,471 1,806 2,327 2,944
Shares outstanding (m) 226.1 226.1 226.1 226.1 EPS (before exp items) (Rs) 6.5 8.0 10.3 13.0 CEPS (Rs) 11.6 14.1 17.2 21.2 DPS (Rs) 0.7 0.8 0.9 0.9
Source: Company, Kotak Securities – Private Client Research
Cash flow Statement (Rs mn)
(Year-end Mar) FY17 FY18 FY19E FY20E
PBDIT 4,042 4,731 5,579 6,680 Direct tax paid (396) (651) (754) (953) Adjustments (330) (41) - - Cash flow from operations 3,316 4,039 4,825 5,727 Net Chg in Working Capital (1,460) (1,164) (1,326) (1,530) Net Cash from Operations 1,856 2,874 3,499 4,196 Capital Expenditure (2,124) (2,686) (2,600) (2,600) Cash from investing 30 21 40 40 Net Cash from Investing (2,094) (2,665) (2,560) (2,560) Interest paid (901) (875) (923) (907) Issue of Shares/(buyback) 1,477 - - - Dividends Paid (145) (212) (225) (225)
Debt Raised (239) 549 223 (500) Net cash from financing 192 (538) (924) (1,631) Net change in cash (46) (328) 15 5 Free cash flow (267) 188 899 1,596 Cash at end 656 328 343 347
Source: Company, Kotak Securities – Private Client Research
Balance sheet (Rs mn)
(Year-end Mar) FY17 FY18 FY19E FY20E
Cash and cash equivalents 656 328 343 347 Accounts receivable 5,782 6,703 7,396 8,579 Inventories 5,473 6,409 7,198 8,350 Other current assets 1,761 1,910 2,100 2,100 Current assets 13,672 15,349 17,036 19,376 Intangible assets 6 6 6 0 Other assets 168 220 220 220 LT investments 0 0 0 0 Net fixed assets 11,873 12,932 13,977 14,736 Def tax assets 0 0 0 0 Total assets 25,719 28,507 31,239 34,332 Payables 3,861 4,789 5,029 5,834 Others 0 0 0 0 Current liabilities 3,861 4,789 5,029 5,834 Provisions 170 83 190 190 LT debt 7,227 7,775 7,999 7,499 Other liabilities 341 42 42 42 Equity 226 226 226 226 Reserves 13,039 14,605 16,708 19,426
Def tax liability 471 581 581 581 Minority Interest 384 405 464 540 Total liabilities 25,719 28,507 31,239 34,332 BVPS (Rs) 59 66 75 87
Source: Company, Kotak Securities – Private Client Research
Ratio Analysis
(Year-end Mar) FY17 FY18 FY19E FY20E
EBITDA margin (%) 14.7 15.2 15.5 16.0 EBIT margin (%) 10.6 10.9 11.3 11.7 Net profit margin (%) 5.3 5.8 6.5 7.1 Receivables (days) 76.6 78.9 75.0 75.0 Inventory (days) 72.5 75.4 73.0 73.0 Sales/gross assets(x) 1.5 2.4 2.3 2.3 Interest coverage (x) 4.5 5.4 6.0 7.4 Debt/equity ratio(x) 0.5 0.5 0.5 0.4 ROE (%) 11.8 12.9 14.7 16.1
ROCE (%) 10.4 11.0 12.4 13.6 EV/ Sales 1.4 1.3 1.1 0.9 EV/EBITDA 9.5 8.3 7.0 5.8 Price to earnings (P/E) 21.5 17.5 13.6 10.8 Price to book value (P/B) 2.4 2.1 1.9 1.6
Source: Company, Kotak Securities – Private Client Research
Kotak Securities – Private Client Research Please see the Disclosure/Disclaimer on the last page For Private Circulation 27
AUGUST 6, 2018
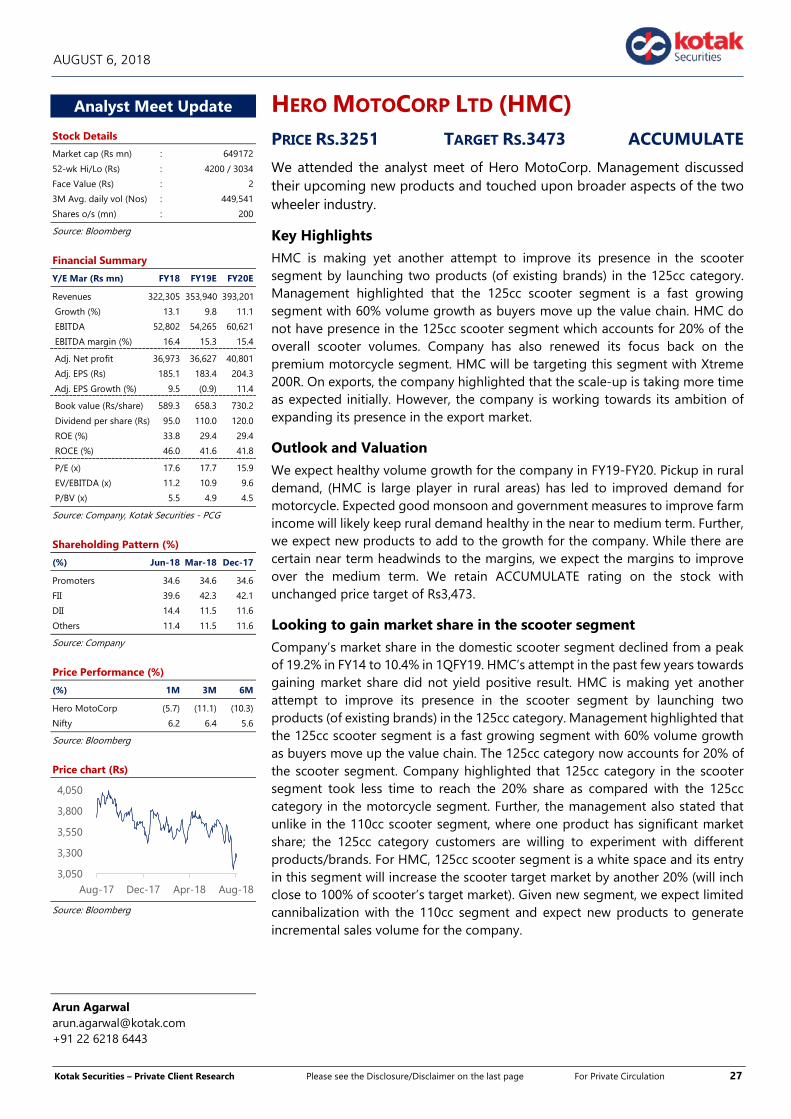
HERO MOTOCORP LTD (HMC) PRICE RS.3251 TARGET RS.3473 ACCUMULATE
We attended the analyst meet of Hero MotoCorp. Management discussed their upcoming new products and touched upon broader aspects of the two wheeler industry.
Key Highlights
HMC is making yet another attempt to improve its presence in the scooter segment by launching two products (of existing brands) in the 125cc category. Management highlighted that the 125cc scooter segment is a fast growing segment with 60% volume growth as buyers move up the value chain. HMC do not have presence in the 125cc scooter segment which accounts for 20% of the overall scooter volumes. Company has also renewed its focus back on the premium motorcycle segment. HMC will be targeting this segment with Xtreme 200R. On exports, the company highlighted that the scale-up is taking more time as expected initially. However, the company is working towards its ambition of expanding its presence in the export market.
Outlook and Valuation
We expect healthy volume growth for the company in FY19-FY20. Pickup in rural demand, (HMC is large player in rural areas) has led to improved demand for motorcycle. Expected good monsoon and government measures to improve farm income will likely keep rural demand healthy in the near to medium term. Further, we expect new products to add to the growth for the company. While there are certain near term headwinds to the margins, we expect the margins to improve over the medium term. We retain ACCUMULATE rating on the stock with unchanged price target of Rs3,473.
Looking to gain market share in the scooter segment
Company’s market share in the domestic scooter segment declined from a peak of 19.2% in FY14 to 10.4% in 1QFY19. HMC’s attempt in the past few years towards gaining market share did not yield positive result. HMC is making yet another attempt to improve its presence in the scooter segment by launching two products (of existing brands) in the 125cc category. Management highlighted that the 125cc scooter segment is a fast growing segment with 60% volume growth as buyers move up the value chain. The 125cc category now accounts for 20% of the scooter segment. Company highlighted that 125cc category in the scooter segment took less time to reach the 20% share as compared with the 125cc category in the motorcycle segment. Further, the management also stated that unlike in the 110cc scooter segment, where one product has significant market share; the 125cc category customers are willing to experiment with different products/brands. For HMC, 125cc scooter segment is a white space and its entry in this segment will increase the scooter target market by another 20% (will inch close to 100% of scooter’s target market). Given new segment, we expect limited cannibalization with the 110cc segment and expect new products to generate incremental sales volume for the company.
Analyst Meet Update
Stock Details
Market cap (Rs mn) : 649172
52-wk Hi/Lo (Rs) : 4200 / 3034
Face Value (Rs) : 2
3M Avg. daily vol (Nos) : 449,541
Shares o/s (mn) : 200
Source: Bloomberg
Financial Summary
Y/E Mar (Rs mn) FY18 FY19E FY20E
Revenues 322,305 353,940 393,201
Growth (%) 13.1 9.8 11.1
EBITDA 52,802 54,265 60,621
EBITDA margin (%) 16.4 15.3 15.4
Adj. Net profit 36,973 36,627 40,801
Adj. EPS (Rs) 185.1 183.4 204.3
Adj. EPS Growth (%) 9.5 (0.9) 11.4
Book value (Rs/share) 589.3 658.3 730.2
Dividend per share (Rs) 95.0 110.0 120.0
ROE (%) 33.8 29.4 29.4
ROCE (%) 46.0 41.6 41.8
P/E (x) 17.6 17.7 15.9
EV/EBITDA (x) 11.2 10.9 9.6
P/BV (x) 5.5 4.9 4.5
Source: Company, Kotak Securities - PCG
Shareholding Pattern (%)
(%) Jun-18 Mar-18 Dec-17
Promoters 34.6 34.6 34.6
FII 39.6 42.3 42.1
DII 14.4 11.5 11.6
Others 11.4 11.5 11.6
Source: Company
Price Performance (%)
(%) 1M 3M 6M
Hero MotoCorp (5.7) (11.1) (10.3)
Nifty 6.2 6.4 5.6
Source: Bloomberg
Price chart (Rs)
Source: Bloomberg
Arun Agarwal [email protected] +91 22 6218 6443
3,050
3,300
3,550
3,800
4,050
Aug-17 Dec-17 Apr-18 Aug-18
Kotak Securities – Private Client Research Please see the Disclosure/Disclaimer on the last page For Private Circulation 28
AUGUST 6, 2018
Re-entry into the premium motorcycle segment HMC is a small player (1% market share) in the domestic premium motorcycle segment. While the company had 12% market share in the premium segment in FY12, the presence has been very weak since FY16. Company has now renewed its focus back on the premium motorcycle segment. HMC will be targeting this segment with Xtreme 200R. HMC is looking to disrupt the current market dynamics by positioning Xtreme 200R as higher CC product with ABS technology at a slight premium price.
Exports – working towards increasing presence
On exports, the company highlighted that the scale-up is taking more time as expected initially. However, the company is working towards its ambition of expanding its presence in the export market. HMC has plants in Bangladesh (120,000 units annual capacity) and Columbia (80,000 units annual capacity). In Bangladesh, HMC has a market share of 30% (market leader for two consecutive months). For the African market, the company is modifying its products to suit regions requirement.
Other highlights of the analyst meet
Company shared that as per a study, the top five two wheeler buying factors are mileage, strength/durability, brand, styling/design and ownership cost.
In the domestic motorcycle industry, entry segment accounts for 26% of the volumes, deluxe segment is 51% of the volume and balance 23% comes from the premium segment. HMC has 58% market share in the entry level motorcycle segment, 71% market share in the deluxe segment and 1% market share in the premium segment.
Two wheeler penetration in India is ~30-40%. In the urban areas (accounts for 60% industry volumes) penetration levels is ~40-45% and in the rural areas (accounts for 40% industry volumes) penetration levels stands at ~20-25%.
HMC is working on the electric vehicle segment through its Centre of Innovation and Technology (CIT) and its investment in Ather Energy. HMC is developing its own product in the electric vehicle segment; however the management did not share the launch timeline. Ather Energy has launched its product in Bangalore and has received good response in the pre-order. Going ahead, Ather Energy will extend its offerings to few more cities.
In the two wheeler segment, first time buyer’s accounts for 51% of industry volume, replacement segment is 27% of industry volumes and 22% volumes comes from multiple two-wheeler owners. Two wheeler replacement cycle is down from ~7 years in 2001 to 4.5-5 years now.
In the domestic two wheeler industry, 36% of two wheelers sold are financed. Financed vehicle sales are higher in the urban areas as compared to rural areas (~20-25% sales in rural areas are financed). Management expects that higher access to finance options and lower cost of finance can give boost to demand.
On the aggressive strategy adopted by competition in the entry level motorcycle segment, the management says that currently the company is not looking to respond to the competition pricing action.
Kotak Securities – Private Client Research Please see the Disclosure/Disclaimer on the last page For Private Circulation 29
AUGUST 6, 2018
Outlook and Valuation HMC reported low sales volume growth between FY12-FY17. However, in FY18 the volume grew by 14%. We expect healthy volume growth for the company in FY19-FY20. Pickup in rural demand, (HMC is large player in rural areas) has led to improved demand for motorcycle. Expected good monsoon and government measures to improve farm income will likely keep rural demand healthy in the near to medium term. Further, we expect new products too to add to the growth for the company. While there are certain near term headwinds to the margins, we expect the margins to improve over the medium term. We retain ACCUMULATE rating on the stock with unchanged price target of Rs3,473. We have valued the stock at a PE of 17x on FY20E earnings.
Risk
Price war in the two wheeler segment remains key risk to volume and margin assumption.
Company background
HMC is the largest two wheeler player in India. In 2001, the company became the largest two-wheeler manufacturing company in India and globally in terms of unit volume sales in a calendar year. HMC is the market leader in the domestic motorcycle segment with 50% market share (overall two wheeler domestic market share is ~37%). In FY17, the company surpassed 70 million units in cumulative sales since its inception. HMC’s extensive sales and service network, comprising of authorised dealerships, service & parts outlets, and dealer-appointed outlets, spans over 6,000 customer touch points across the country. Company’s manufacturing plants are located at Gurugram, Dharuhera, Haridwar, Neemrana and Vadodara.
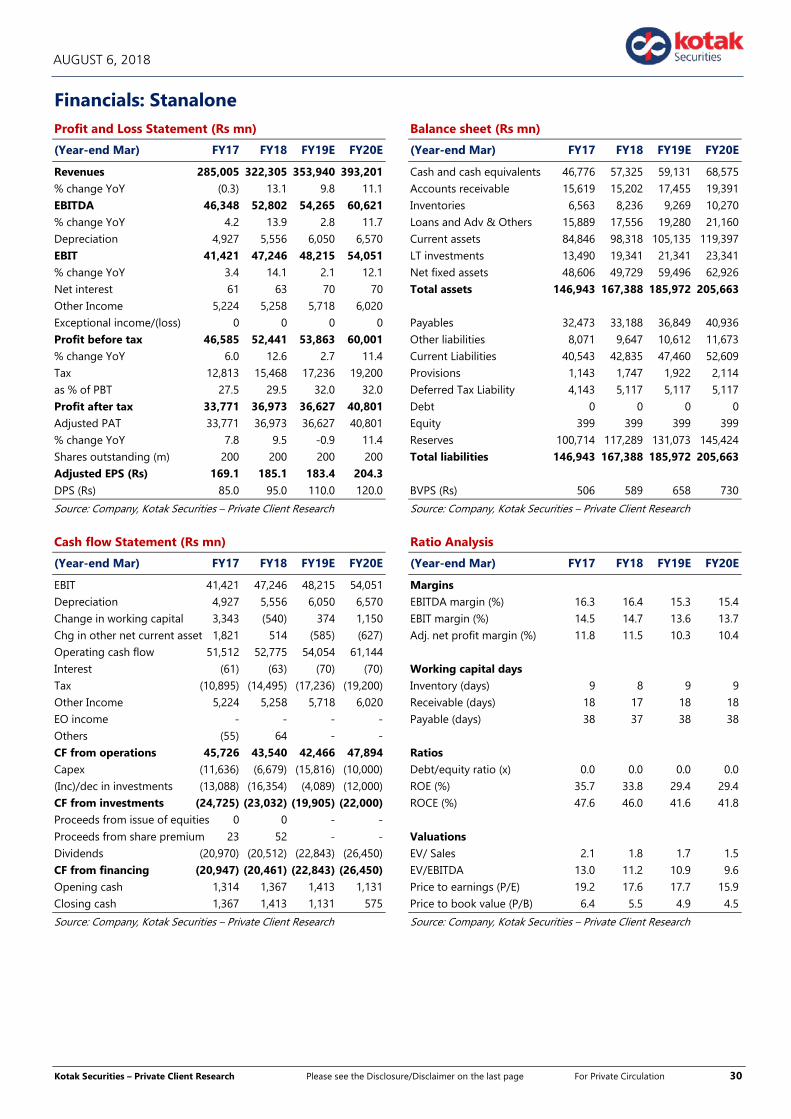
Kotak Securities – Private Client Research Please see the Disclosure/Disclaimer on the last page For Private Circulation 30
AUGUST 6, 2018
Financials: Stanalone
Profit and Loss Statement (Rs mn)
(Year-end Mar) FY17 FY18 FY19E FY20E
Revenues 285,005 322,305 353,940 393,201 % change YoY (0.3) 13.1 9.8 11.1 EBITDA 46,348 52,802 54,265 60,621 % change YoY 4.2 13.9 2.8 11.7 Depreciation 4,927 5,556 6,050 6,570 EBIT 41,421 47,246 48,215 54,051 % change YoY 3.4 14.1 2.1 12.1 Net interest 61 63 70 70 Other Income 5,224 5,258 5,718 6,020 Exceptional income/(loss) 0 0 0 0 Profit before tax 46,585 52,441 53,863 60,001 % change YoY 6.0 12.6 2.7 11.4 Tax 12,813 15,468 17,236 19,200 as % of PBT 27.5 29.5 32.0 32.0 Profit after tax 33,771 36,973 36,627 40,801 Adjusted PAT 33,771 36,973 36,627 40,801 % change YoY 7.8 9.5 -0.9 11.4 Shares outstanding (m) 200 200 200 200 Adjusted EPS (Rs) 169.1 185.1 183.4 204.3 DPS (Rs) 85.0 95.0 110.0 120.0
Source: Company, Kotak Securities – Private Client Research
Cash flow Statement (Rs mn)
(Year-end Mar) FY17 FY18 FY19E FY20E
EBIT 41,421 47,246 48,215 54,051 Depreciation 4,927 5,556 6,050 6,570 Change in working capital 3,343 (540) 374 1,150 Chg in other net current asset 1,821 514 (585) (627) Operating cash flow 51,512 52,775 54,054 61,144 Interest (61) (63) (70) (70) Tax (10,895) (14,495) (17,236) (19,200) Other Income 5,224 5,258 5,718 6,020 EO income - - - - Others (55) 64 - - CF from operations 45,726 43,540 42,466 47,894 Capex (11,636) (6,679) (15,816) (10,000) (Inc)/dec in investments (13,088) (16,354) (4,089) (12,000) CF from investments (24,725) (23,032) (19,905) (22,000) Proceeds from issue of equities 0 0 - -
Proceeds from share premium 23 52 - - Dividends (20,970) (20,512) (22,843) (26,450) CF from financing (20,947) (20,461) (22,843) (26,450) Opening cash 1,314 1,367 1,413 1,131 Closing cash 1,367 1,413 1,131 575
Source: Company, Kotak Securities – Private Client Research
Balance sheet (Rs mn)
(Year-end Mar) FY17 FY18 FY19E FY20E
Cash and cash equivalents 46,776 57,325 59,131 68,575 Accounts receivable 15,619 15,202 17,455 19,391 Inventories 6,563 8,236 9,269 10,270 Loans and Adv & Others 15,889 17,556 19,280 21,160 Current assets 84,846 98,318 105,135 119,397 LT investments 13,490 19,341 21,341 23,341 Net fixed assets 48,606 49,729 59,496 62,926 Total assets 146,943 167,388 185,972 205,663 Payables 32,473 33,188 36,849 40,936 Other liabilities 8,071 9,647 10,612 11,673 Current Liabilities 40,543 42,835 47,460 52,609 Provisions 1,143 1,747 1,922 2,114 Deferred Tax Liability 4,143 5,117 5,117 5,117 Debt 0 0 0 0 Equity 399 399 399 399 Reserves 100,714 117,289 131,073 145,424 Total liabilities 146,943 167,388 185,972 205,663
BVPS (Rs) 506 589 658 730
Source: Company, Kotak Securities – Private Client Research
Ratio Analysis
(Year-end Mar) FY17 FY18 FY19E FY20E
Margins EBITDA margin (%) 16.3 16.4 15.3 15.4 EBIT margin (%) 14.5 14.7 13.6 13.7 Adj. net profit margin (%) 11.8 11.5 10.3 10.4 Working capital days Inventory (days) 9 8 9 9 Receivable (days) 18 17 18 18 Payable (days) 38 37 38 38 Ratios Debt/equity ratio (x) 0.0 0.0 0.0 0.0 ROE (%) 35.7 33.8 29.4 29.4 ROCE (%) 47.6 46.0 41.6 41.8
Valuations EV/ Sales 2.1 1.8 1.7 1.5 EV/EBITDA 13.0 11.2 10.9 9.6 Price to earnings (P/E) 19.2 17.6 17.7 15.9 Price to book value (P/B) 6.4 5.5 4.9 4.5
Source: Company, Kotak Securities – Private Client Research
Kotak Securities – Private Client Research Please see the Disclosure/Disclaimer on the last page For Private Circulation 31
AUGUST 6, 2018
NATURAL GAS SECTOR UPDATE GO GREEN
India’s gas consumption growth stayed strong supported by higher LNG demand. RLNG’s gas consumption mix rose 690 bps yoy to 48% in June’18. On the flip side, India’s gas production declined 3% yoy due to decline in gas production by both public and Private/Joint Ventures (JVs) gas producers.
Higher RLNG consumption is positive for PLNG. CGD gas consumption growth is positive for IGL and MGL. Falling gas supply from Oil India/private players is negative for domestic upstream companies.
Monthly readings on natural gas production, availability and consumption in India
India’s total gas consumption: In June’18, India’s gas consumption increased by 9.6% yoy to 170 mmscmd due to strong gas demand from all the sectors except petrochemical.
RLNG consumption: Notable growth is witnessed in total RLNG consumption. In June’18, RLNG demand increased by 28% yoy to 82 mmscmd supported by double digit growth from both fertilizer (29% yoy) and power (74% yoy) sector growth. CGD sector imported gas demand also increased by 9% yoy.
The contribution of RLNG in India’s total gas consumption mix rose to 48% in June’18 vs 41.4% in June’17, reflecting rising gas demand. We expect this rising trend to continue in the medium to long term due to better cost economics relative to liquid fuel, continuously rising RLNG supply, and rising demand from industrial and commercial segment.
RLNG import: India’s LNG import jumped by 34% yoy in June’18 with the fall in international RLNG and lower domestic gas supply
Domestic gas supply: India’s gas production was marginally down by 3% yoy to 89 mmscmd in June’18 impacted by a decline in Oil India’s production to 7.3 mmscmd (–7.2% yoy), ONGC’s output declined marginally to 65 mmscmd (-1% yoy) and production from private players/JVs continued to decline and stands at 16.8 mmscmd (–7.2% yoy).
India’s total Gas consumption mix: Major consuming sectors are fertilizer (25%), power (20%), CGD (14%), refinery (12%), petrochemicals (5%) sector and balance by others.
India's natural-gas demand currently stands at 8% of the global per-capita average which is expected to get a boost from the government's plan to revitalize more than 10,000 kilometers of gas-pipeline projects by offering viability-gap funding" to stalled projects. This should help more than double gas transmission capacity to 962 mmscmd.
Top Picks: MGL (TP Rs.1030) & Petronet LNG (TP Rs.267)
Sector Update
Stock Details
BSE Oil Ind Mkt cap (Rs mn) : 5,430,120
52-wk Hi/Lo (Rs) : 16727 / 13232
No.of members : 10
BSE OIL Index Value 15,206
O&G weightage in Sensex 10.5
Source: Bloomberg
Comparison
3M 6M 1Y 2Y
RIL 23 31 44 0
GAIL 20 11 43 12
IGL 14 7 31 70
SENSEX 7 7 16 36
NIFTY 7 8 15 43
GUJS 14 4 7 58
MAHGL 12 2 (2)
BSEOIL 7 (1) 8 4
OINL (8) (5) 17 (4)
PLNG 6 (5) 12 22
ONGC (8) (12) 4 4
BPCL 6 (13) (15) 49
IOCL 4 (13) (8) (4)
HPCL 0 (18) (23) 56
CPCL 4 (18) (19) (55)
MRPL (17) (25) (28) (29)
ABAN (31) (41) (36) 35
Source: Company, Kotak Securities - PCG
Price Performance (%)
(%) 1M 3M 6M
BSE Oil and Gas Sector 11.0 6.8 (1.4)
Nifty 5.5 7.0 8.2
Source: Bloomberg
BSE Oil and Gas Index chart
Source: Bloomberg
Sumit Pokharna [email protected] +91 22 6218 438
12,500
14,500
16,500
18,500
Apr-17 Aug-17 Dec-17 Apr-18
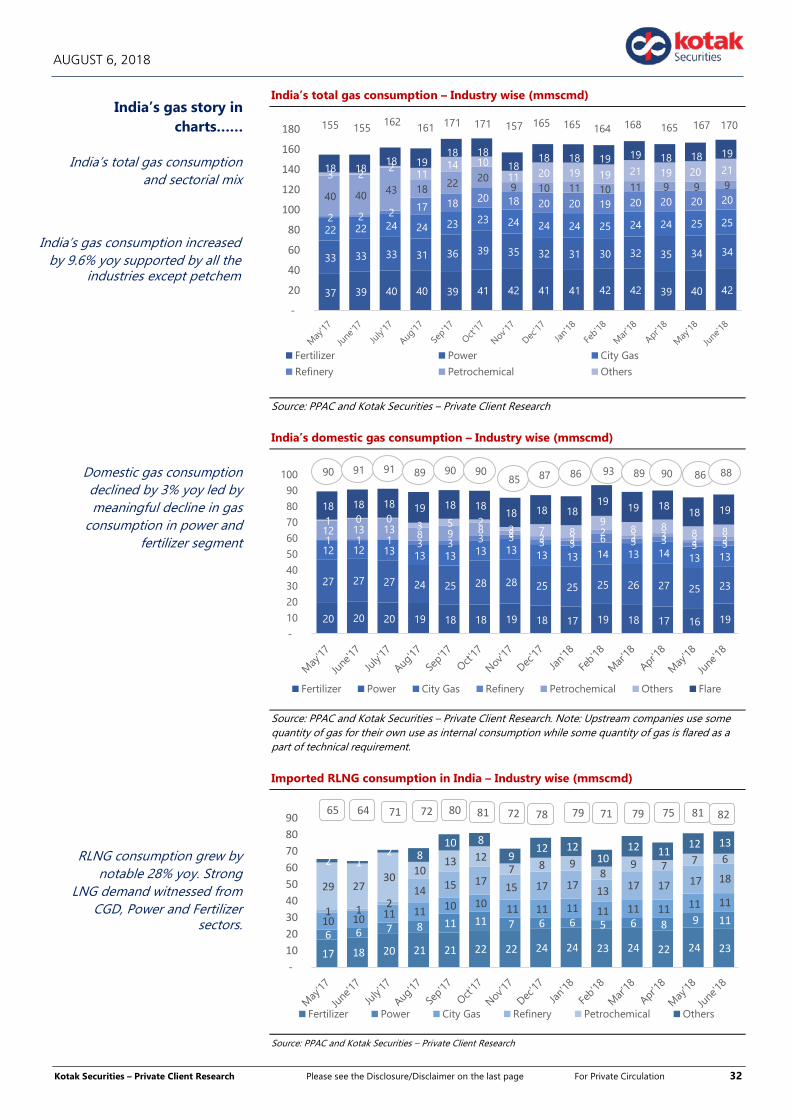
Kotak Securities – Private Client Research Please see the Disclosure/Disclaimer on the last page For Private Circulation 32
AUGUST 6, 2018
India’s total gas consumption – Industry wise (mmscmd)
Source: PPAC and Kotak Securities – Private Client Research
India’s domestic gas consumption – Industry wise (mmscmd)
Source: PPAC and Kotak Securities – Private Client Research. Note: Upstream companies use some quantity of gas for their own use as internal consumption while some quantity of gas is flared as a part of technical requirement.
Imported RLNG consumption in India – Industry wise (mmscmd)
Source: PPAC and Kotak Securities – Private Client Research
37 39 40 40 39 41 42 41 41 42 42 39 40 42
33 33 33 31 36 39 35 32 31 30 32 35 34 34
22 22 24 24 23 23 24 24 24 25 24 24 25 25 2 2 2 17 18 20 18 20 20 19 20 20 20 20 40 40 43 18 22 20 9 10 11 10 11 9 9 9
3 2 2
11 14 10
11 20 19 19 21 19 20 21 18 18 18 19
18 18 18
18 18 19 19 18 18 19
155 155 162 161 171 171 157 165 165 164 168 165 167 170
-
20
40
60
80
100
120
140
160
180
Fertilizer Power City Gas
Refinery Petrochemical Others
20 20 20 19 18 18 19 18 17 19 18 17 16 19
27 27 27 24 25 28 28 25 25 25 26 27 25 23
12 12 13 13 13 13 13 13 13 14 13 14 13 13
1 1 1 3 3 3 3 3 3 6 3 3 3 3 12 13 13 8 9 8 2 2 2
2 2 3 2 2
1 0 0 3 5 2
2 7 8 9
8 8 8 8
18 18 18 19 18 18 18 18 18
19 19 18
18 19
90 91 91 89 90 90 85 87 86 93 89 90 86 88
- 10 20 30 40 50 60 70 80 90
100
Fertilizer Power City Gas Refinery Petrochemical Others Flare
17 18 20 21 21 22 22 24 24 23 24 22 24 23 6 6 7 8 11 11 7 6 6 5 6 8 9 11 10 10 11 11 10 10 11 11 11 11 11 11 11 11 1 1 2
14 15 17 15 17 17 13 17 17 17 18 29 27
30 10 13 12
7 8 9 8
9 7 7 6 2 1 2 8
10 8 9
12 12 10
12 11 12 13
65 64 71 72 80 81 72 78 79 71 79 75 81 82
- 10 20 30 40 50 60 70 80 90
Fertilizer Power City Gas Refinery Petrochemical Others
India’s total gas consumption and sectorial mix
India’s gas consumption increased by 9.6% yoy supported by all the
industries except petchem
India’s gas story in charts……
Domestic gas consumption declined by 3% yoy led by meaningful decline in gas
consumption in power and fertilizer segment
RLNG consumption grew by notable 28% yoy. Strong
LNG demand witnessed from CGD, Power and Fertilizer
sectors.
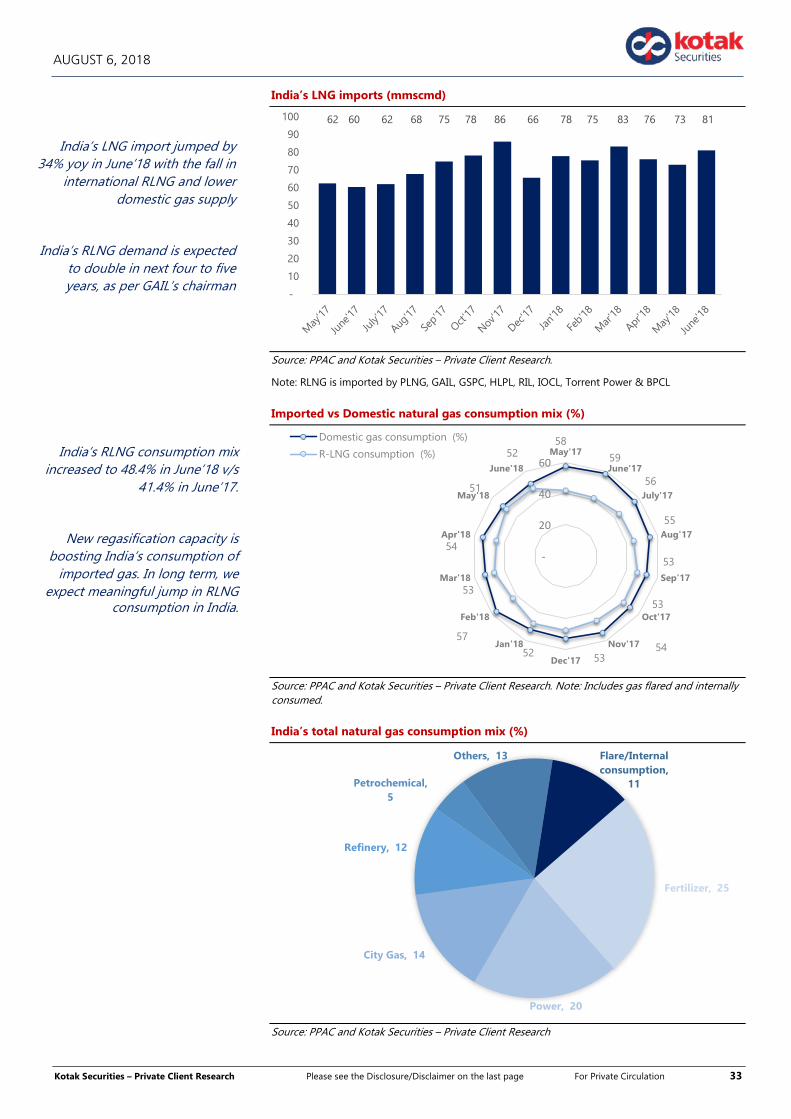
Kotak Securities – Private Client Research Please see the Disclosure/Disclaimer on the last page For Private Circulation 33
AUGUST 6, 2018
India’s LNG imports (mmscmd)
Source: PPAC and Kotak Securities – Private Client Research.
Note: RLNG is imported by PLNG, GAIL, GSPC, HLPL, RIL, IOCL, Torrent Power & BPCL
Imported vs Domestic natural gas consumption mix (%)
Source: PPAC and Kotak Securities – Private Client Research. Note: Includes gas flared and internally consumed.
India’s total natural gas consumption mix (%)
Source: PPAC and Kotak Securities – Private Client Research
62 60 62 68 75 78 86 66 78 75 83 76 73 81
-
10
20
30
40
50
60
70
80
90
100
58
59
56
55
53
53
54 53 52
57
53
54
51
52
-
20
40
60May'17
June'17
July'17
Aug'17
Sep'17
Oct'17
Nov'17
Dec'17
Jan'18
Feb'18
Mar'18
Apr'18
May'18
June'18
Domestic gas consumption (%)
R-LNG consumption (%)
Fertilizer, 25
Power, 20
City Gas, 14
Refinery, 12
Petrochemical, 5
Others, 13 Flare/Internal consumption,
11
India’s RLNG consumption mix increased to 48.4% in June’18 v/s
41.4% in June’17.
New regasification capacity is boosting India’s consumption of
imported gas. In long term, we expect meaningful jump in RLNG
consumption in India.
India’s LNG import jumped by 34% yoy in June’18 with the fall in
international RLNG and lower domestic gas supply
India’s RLNG demand is expected to double in next four to five years, as per GAIL’s chairman

Kotak Securities – Private Client Research Please see the Disclosure/Disclaimer on the last page For Private Circulation 34
AUGUST 6, 2018
India’s total gas production – (mmscmd)
Source: PPAC and Kotak Securities – Private Client Research
ONGC’s gas production from domestic fields (mmscmd)
Source: PPAC and Kotak Securities – Private Client Research
Oil India monthly gas production (MMSCMD)
Source: PPAC and Kotak Securities – Private Client Research
63 66 66 63 65 65 65 65 63 64 65 66 64 65
8 8 8 8 8 8 8 8 8 7 8 7 7 7.3
18 18 18 18 18 18 17 17 16 17 17 16 17 16.83
89 92 92 89 91 91 91 89 87 89 90 89 88 89
- 10 20 30 40 50 60 70 80 90
100
ONGC Oil India Limited Private/Joint Ventures (JVs)
63
66 66
63
65 65 65
65
63
64
65
66
64
65
62
63
63
64
64
65
65
66
66
67
67
7.9 7.98.1
8.4
8.2
7.8 7.87.6 7.7
7.57.6
7.4 7.3 7.3
6.5
7.0
7.5
8.0
8.5
9.0
Pressure on domestic gas supply yoy basis continues due to lower
supply from both public and private companies
ONGC is the highest domestic gas producer.
ONGC’s gas supply stands lower by 1% yoy

Kotak Securities – Private Client Research Please see the Disclosure/Disclaimer on the last page For Private Circulation 35
AUGUST 6, 2018
China Customs Liquefied Natural Gas Total Imports Quantity
Source: Bloomberg and Kotak Securities – Private Client Research
The world’s biggest energy-consuming region is focusing on the fossil fuel with the fastest growing demand this week with natural gas conferences in China and Singapore.
Henry Hub Natural Gas Futures Price (US$/mmbtu)
Source: Bloomberg and Kotak Securities – Private Client Research
Singapore SGX LNG and Oil price
Source: Bloomberg and Kotak Securities – Private Client Research
0.0
2.0
4.0
6.0
8.0
10.0
Jun-
15
Aug
-15
Oct
-15
Dec
-15
Feb
-16
Apr
-16
Jun-
16
Aug
-16
Oct
-16
Dec
-16
Feb
-17
Apr
-17
Jun-
17
Aug
-17
Oct
-17
Dec
-17
Feb
-18
Apr
-18
Jun-
18
China Customs Liquefied Natural Gas Total Imports Quantity (Mn ton)China Customs Natural Gas (via Pipeline) Total Imports Quantity (mn ton)
2.827
2.50
2.70
2.90
3.10
3.30
3.50
3.70
3-Jan-18 3-Feb-18 3-Mar-18 3-Apr-18 3-May-18 3-Jun-18 3-Jul-18 3-Aug-18
3.5
4.5
5.5
6.5
7.5
8.5
9.5
10.5
11.5
12.5
35
45
55
65
75
85
Sep
-16
Oct
-16
Nov
-16
Dec
-16
Dec
-16
Jan-
17Fe
b-1
7M
ar-1
7A
pr-1
7M
ay-1
7M
ay-1
7Ju
n-17
Jul-
17A
ug-1
7A
ug-1
7Se
p-1
7O
ct-1
7N
ov-1
7D
ec-1
7Ja
n-18
Jan-
18Fe
b-1
8M
ar-1
8A
pr-1
8M
ay-1
8M
ay-1
8Ju
n-18
Jul-
18
Oil ($/bbl) - LHS LNG ($/mmbtu) -RHS
China's LNG imports soared on clean energy
policies (Mton)
Singapore SGX LNG Index Group (SLInG) is a spot price index for
Asian LNG.
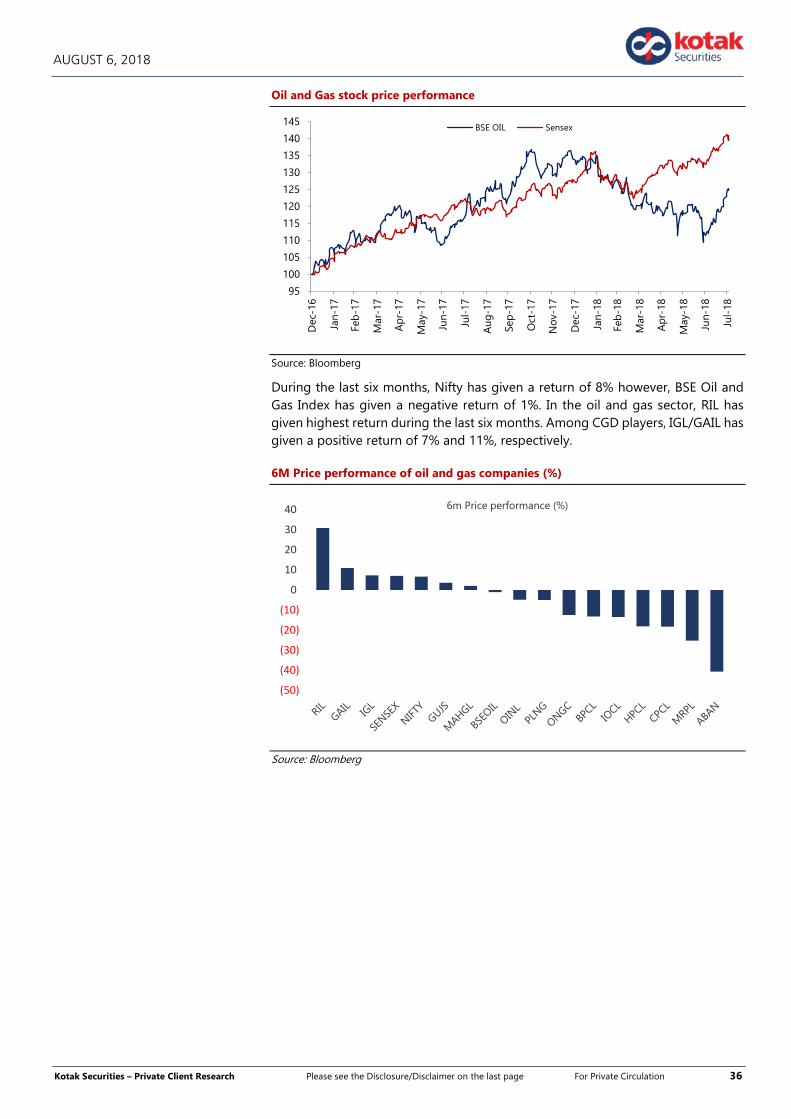
Kotak Securities – Private Client Research Please see the Disclosure/Disclaimer on the last page For Private Circulation 36
AUGUST 6, 2018
Oil and Gas stock price performance
Source: Bloomberg
During the last six months, Nifty has given a return of 8% however, BSE Oil and Gas Index has given a negative return of 1%. In the oil and gas sector, RIL has given highest return during the last six months. Among CGD players, IGL/GAIL has given a positive return of 7% and 11%, respectively.
6M Price performance of oil and gas companies (%)
Source: Bloomberg
95
100
105
110
115
120
125
130
135
140
145
Dec
-16
Jan-
17
Feb
-17
Mar
-17
Apr
-17
May
-17
Jun-
17
Jul-
17
Aug
-17
Sep
-17
Oct
-17
Nov
-17
Dec
-17
Jan-
18
Feb
-18
Mar
-18
Apr
-18
May
-18
Jun-
18
Jul-
18
BSE OIL Sensex
(50)
(40)
(30)
(20)
(10)
0
10
20
30
40 6m Price performance (%)

Kotak Securities – Private Client Research Please see the Disclosure/Disclaimer on the last page For Private Circulation 37
AUGUST 6, 2018
Forthcoming events
Date Event
6-Aug Adani Ports, Adani Power, Avanti Feeds, Britannia, Dena Bank, Vesuvius earnings expected
7-Aug Adani Ent, Balkrishna Ind, M&M, Motherson Sumi, Mphasis, Sobha, SRF, Trident, TVS Motor,
Wonderla Holidays earnings expected
8-Aug Bluestar, BPCL, Cipla, Gabriel, Greenply Ind, Lupin, NMDC, Phoenix Ltd, Supreme Ind,
Thermax earnings expected
9-Aug Aegis Logistics, AIA Engineering, Cummins India, Eicher Motor, Engineers India, Insecticides
Jindal Steel, MRF, MT Educare, Wabag earnings expected
Source: www.bseindia.com
Forthcoming Events
Kotak Securities – Private Client Research Please see the Disclosure/Disclaimer on the last page For Private Circulation 38
AUGUST 6, 2018
RATING SCALE
Definitions of ratings
BUY – We expect the stock to deliver more than 12% returns over the next 12 months
ACCUMULATE – We expect the stock to deliver 5% - 12% returns over the next 12 months
REDUCE – We expect the stock to deliver 0% - 5% returns over the next 12 months
SELL – We expect the stock to deliver negative returns over the next 12 months
NR – Not Rated. Kotak Securities is not assigning any rating or price target to the stock. The report has been prepared for information purposes only.
SUBSCRIBE - We advise investor to subscribe to the IPO.
RS – Rating Suspended. Kotak Securities has suspended the investment rating and price target for this stock, either because there is not a Sufficient fundamental basis for determining, or there are legal, regulatory or policy constraints around publishing, an investment rating or target. The previous investment rating and price target, if any, are no longer in effect for this stock and should not be relied upon.
NA – Not Available or Not Applicable. The information is not available for display or is not applicable
NM – Not Meaningful. The information is not meaningful and is therefore excluded.
NOTE – Our target prices are with a 12-month perspective. Returns stated in the rating scale are our internal benchmark.
FUNDAMENTAL RESEARCH TEAM
Rusmik Oza Arun Agarwal Amit Agarwal Nipun Gupta Krishna Nain Head of Research Auto & Auto Ancillary Transportation, Paints, FMCG Information Tech, Midcap Special Situations [email protected] [email protected] [email protected] [email protected] [email protected] +91 22 6218 6441 +91 22 6218 6443 +91 22 6218 6439 +91 22 6218 6433 +91 22 6218 7907 Sanjeev Zarbade Ruchir Khare Jatin Damania Cyndrella Carvalho K. Kathirvelu Cap. Goods & Cons. Durables Cap. Goods & Cons. Durables Metals & Mining, Midcap Pharmaceuticals Production [email protected] [email protected] [email protected] [email protected] [email protected] +91 22 6218 6424 +91 22 6218 6431 +91 22 6218 6440 +91 22 6218 6426 +91 22 6218 6427 Teena Virmani Sumit Pokharna Pankaj Kumar Jayesh Kumar Construction, Cement, Building Mat Oil and Gas, Information Tech Midcap Economy [email protected] [email protected] [email protected] [email protected] +91 22 6218 6432 +91 22 6218 6438 +91 22 6218 6434 +91 22 6218 5373
TECHNICAL RESEARCH TEAM
Shrikant Chouhan Amol Athawale [email protected] [email protected] +91 22 6218 5408 +91 20 6620 3350
DERIVATIVES RESEARCH TEAM
Sahaj Agrawal Malay Gandhi Prashanth Lalu Prasenjit Biswas, CMT, CFTe [email protected] [email protected] [email protected] [email protected] +91 79 6607 2231 +91 22 6218 6420 +91 22 6218 5497 +91 33 6625 9810

Kotak Securities – Private Client Research Please see the Disclosure/Disclaimer on the last page For Private Circulation 39
AUGUST 6, 2018
Disclosure/Disclaimer Kotak Securities Limited established in 1994, is a subsidiary of Kotak Mahindra Bank Limited. Kotak Securities is one of India's largest brokerage and distribution house. Kotak Securities Limited is a corporate trading and clearing member of Bombay Stock Exchange Limited (BSE), National Stock Exchange of India Limited (NSE), Metropolitan Stock Exchange of India Limited (MSE). Our businesses include stock broking, services rendered in connection with distribution of primary market issues and financial products like mutual funds and fixed deposits, depository services and Portfolio Management. Kotak Securities Limited is also a depository participant with National Securities Depository Limited (NSDL) and Central Depository Services (India) Limited (CDSL). Kotak Securities Limited is also registered with Insurance Regulatory and Development Authority as Corporate Agent for Kotak Mahindra Old Mutual Life Insurance Limited and is also a Mutual Fund Advisor registered with Association of Mutual Funds in India (AMFI). We are registered as a Research Analyst under SEBI (Research Analyst) Regulations, 2014. We hereby declare that our activities were neither suspended nor we have defaulted with any stock exchange authority with whom we are registered in last five years. However SEBI, Exchanges and Depositories have conducted the routine inspection and based on their observations have issued advise/warning/deficiency letters/ or levied minor penalty on KSL for certain operational deviations. We have not been debarred from doing business by any Stock Exchange / SEBI or any other authorities; nor has our certificate of registration been cancelled by SEBI at any point of time. We offer our research services to clients as well as our prospects. This document is not for public distribution and has been furnished to you solely for your information and must not be reproduced or redistributed to any other person. Persons into whose possession this document may come are required to observe these restrictions. This material is for the personal information of the authorized recipient, and we are not soliciting any action based upon it. This report is not to be construed as an offer to sell or the solicitation of an offer to buy any security in any jurisdiction where such an offer or solicitation would be illegal. It is for the general information of clients of Kotak Securities Ltd. It does not constitute a personal recommendation or take into account the particular investment objectives, financial situations, or needs of individual clients. We have reviewed the report, and in so far as it includes current or historical information, it is believed to be reliable though its accuracy or completeness cannot be guaranteed. Neither Kotak Securities Limited, nor any person connected with it, accepts any liability arising from the use of this document. The recipients of this material should rely on their own investigations and take their own professional advice. Price and value of the investments referred to in this material may go up or down. Past performance is not a guide for future performance. Certain transactions -including those involving futures, options and other derivatives as well as non-investment grade securities - involve substantial risk and are not suitable for all investors. Reports based on technical analysis centers on studying charts of a stock's price movement and trading volume, as opposed to focusing on a company's fundamentals and as such, may not match with a report on a company's fundamentals. Opinions expressed are our current opinions as of the date appearing on this material only. While we endeavor to update on a reasonable basis the information discussed in this material, there may be regulatory, compliance or other reasons that prevent us from doing so. Prospective investors and others are cautioned that any forward-looking statements are not predictions and may be subject to change without notice. Our proprietary trading and investment businesses may make investment decisions that are inconsistent with the recommendations expressed herein. Kotak Securities Limited has two independent equity research groups: Institutional Equities and Private Client Group. This report has been prepared by the Private Client Group. The views and opinions expressed in this document may or may not match or may be contrary with the views, estimates, rating, target price of the Institutional Equities Research Group of Kotak Securities Limited. We and our affiliates/associates, officers, directors, and employees, Research Analyst(including relatives) worldwide may: (a) from time to time, have long or short positions in, and buy or sell the securities thereof, of company (ies) mentioned herein or (b) be engaged in any other transaction involving such securities and earn brokerage or other compensation or act as a market maker in the financial instruments of the subject company/company (ies) discussed herein or act as advisor or lender / borrower to such company (ies) or have other potential/material conflict of interest with respect to any recommendation and related information and opinions at the time of publication of Research Report or at the time of public appearance. Kotak Securities Limited (KSL) may have proprietary long/short position in the above mentioned scrip(s) and therefore may be considered as interested. The views provided herein are general in nature and does not consider risk appetite or investment objective of particular investor; readers are requested to take independent professional advice before investing. This should not be construed as invitation or solicitation to do business with KSL. Kotak Securities Limited is also a Portfolio Manager. Portfolio Management Team (PMS) takes its investment decisions independent of the PCG research and accordingly PMS may have positions contrary to the PCG research recommendation. Kotak Securities Limited does not provide any promise or assurance of favourable view for a particular industry or sector or business group in any manner. The investor is requested to take into consideration all the risk factors including their financial condition, suitability to risk return profile and take professional advice before investing. The analyst for this report certifies that all of the views expressed in this report accurately reflect his or her personal views about the subject company or companies and its or their securities, and no part of his or her compensation was, is or will be, directly or indirectly related to specific recommendations or views expressed in this report. No part of this material may be duplicated in any form and/or redistributed without Kotak Securities' prior written consent. Details of Associates are available on our website ie www.kotak.com Research Analyst has served as an officer, director or employee of subject company(ies): No We or our associates may have received compensation from the subject company(ies) in the past 12 months. We or our associates have managed or co-managed public offering of securities for the subject company(ies) in the past 12 months: No We or our associates may have received compensation for investment banking or merchant banking or brokerage services from the subject company(ies) in the past 12 months. We or our associates may have received any compensation for products or services other than investment banking or merchant banking or brokerage services from the subject company(ies) in the past 12 months. We or our associates may have received compensation or other benefits from the subject company(ies) or third party in connection with the research report. Our associates may have financial interest in the subject company(ies). Research Analyst or his/her relative's financial interest in the subject company(ies): No Kotak Securities Limited has financial interest in the subject company(ies) at the end of the month immediately preceding the date of publication of Research Report: No Our associates may have actual/beneficial ownership of 1% or more securities of the subject company(ies) at the end of the month immediately preceding the date of publication of Research Report. Research Analyst or his/her relatives has actual/beneficial ownership of 1% or more securities of the subject company(ies) at the end of the month immediately preceding the date of publication of Research Report: No. Kotak Securities Limited has actual/beneficial ownership of 1% or more securities of the subject company(ies) at the end of the month immediately preceding the date of publication of Research Report: No Subject company(ies) may have been client during twelve months preceding the date of distribution of the research report. "A graph of daily closing prices of securities is available at www.nseindia.com and http://economictimes.indiatimes.com/markets/stocks/stock-quotes. (Choose a company from the list on the browser and select the "three years" icon in the price chart)." Kotak Securities Limited. Registered Office: 27 BKC, C 27, G Block, Bandra Kurla Complex, Bandra (E), Mumbai 400051. CIN: U99999MH1994PLC134051, Telephone No.: +22 43360000, Fax No.: +22 67132430. Website: www.kotak.com/www.kotaksecurities.com. Correspondence Address: Infinity IT Park, Bldg. No 21, Opp. Film City Road, A K Vaidya Marg, Malad (East), Mumbai 400097. Telephone No: 42856825. SEBI Registration No: NSE INB/INF/INE 230808130, BSE INB 010808153/INF 011133230, MSE INE 260808130/INB 260808135/INF 260808135, AMFI ARN 0164, PMS INP000000258 and Research Analyst INH000000586. NSDL/CDSL: IN-DP-NSDL-23-97. Our research should not be considered as an advertisement or advice, professional or otherwise. The investor is requested to take into consideration all the risk factors including their financial condition, suitability to risk return profile and the like and take professional advice before investing. Investments in securities market are subject to market risks, read all the related documents carefully before investing. Derivatives are a sophisticated investment device. The investor is requested to take into consideration all the risk factors before actually trading in derivative contracts. Compliance Officer Details: Mr. Manoj Agarwal. Call: 022 - 4285 8484, or Email: [email protected] case you require any clarification or have any concern, kindly write to us at below email ids: Level 1: For Trading related queries, contact our customer service at '[email protected]' and for demat account related queries contact us at
[email protected] or call us on: Toll free numbers 18002099191 / 1800222299, Offline Customers - 18002099292 Level 2: If you do not receive a satisfactory response at Level 1 within 3 working days, you may write to us at [email protected] or call us on 022-42858445 and
if you feel you are still unheard, write to our customer service HOD at [email protected] or call us on 022-42858208. Level 3: If you still have not received a satisfactory response at Level 2 within 3 working days, you may contact our Compliance Officer (Mr. Manoj Agarwal) at
[email protected] or call on 91- (022) 4285 8484. Level 4: If you have not received a satisfactory response at Level 3 within 7 working days, you may also approach CEO (Mr. Kamlesh Rao) at [email protected] or call
on 91- (022) 4285 8301.