morning insight - 13 may 2016 - centuryply.com · volume, has introduced a special "himalayan...
TRANSCRIPT

MAY 13, 2016
Economy News The Reserve Bank if India yesterday issued new guidelines on ownership in
private sector banks by bundling shareholding patterns into two broadcategories of individuals (natural persons) and legal entities/institutions,but retained the cap on foreign ownership at 74%. (Mint)
The Index of Industrial Production (IIP) rose 0.1% in March against a 2%increase in February that had raised hopes of a recovery after threeconsecutive months of contraction. (Mint)
The Securities and Exchange Board of India (SEBI) will tighten norms forparticipatory notes (P-Notes) further in an attempt to curb round-trippingor money laundering through this route. (Mint)
The International Finance Corporation (IFC), the private-sector investmentarm of the World Bank, is in talks with asset managers to assess potentialinvestment opportunities in India's bad-loan market. (BS)
Railways will increase the pace of laying new track to 19 km per day fromthe current 7.8 km which will likely generate Rs 800 bn business in theprocurement of cement, steel and cable among others in the next threeyears. (ET)
After months of debate, a new aviation policy, showcasing key areas ofreform, is ready for clearance by the Union cabinet in the run-up to thegovernment's second anniversary. (BS)
Corporate News Crompton Greaves, de-merged entity Crompton Greaves Consumer
Electrical, which deals in consumer products business, is going to listtoday. (ET)
Germany's Bayer AG may be considering a bid for U.S. seed companyMonsanto that would yield an even-larger international agriculturalgiant in a deal that could be worth as much as $65 billion. (ET)
The government has declined Anil Ambani-led Reliance Power's requestto let it mortgage coal blocks attached to Sasan Ultra Mega Power Project( UMPP) in Madhya Pradesh to lenders of the plant. (ET)
Maruti Suzuki has urged its component suppliers to make investmentfor the future as the company's requirements are expected to grow, withit predicting double-digit expansion in annual sales at least until 2020.(ET)]
Utility vehicle major Mahindra & Mahindra has launched a morepowerful variant of its compact SUV TUV300 priced at Rs 8.87 lakh.(BL)
Cairn India has extended the repayment period for a $1.25-billion loanto a group company by two years but at a higher interest rate. (BS)
Compared with the Trai prescribed norm of 2 per cent cap on call drops,Bharti has set itself a benchmark of maximum of 1.5 per cent call drops.(ET)
Jewellery exporter and retailer Rajesh Exports (REL) has said that itsBoard will meet next month to consider an acquisition in the Middle Eastto expand its global footprint. (ET)
Sun Pharmaceutical Industries said it isn't aware of any adversefindings related to the manufacturing plants of Ranbaxy Laboratories -which it acquired in 2014 - that are said to be part of an affidavit filed inthe Supreme Court by the regulator. (ET)
TVS Motor Company, the third largest scooter brand in India byvolume, has introduced a special "Himalayan Highs'' edition of TVS ScootyZest 110.(BL)
State Bank of India is likely to shortlist three potential partners to buyout GE Capital's stake in its cards business by the end of June. (ET)
Equity% Chg
12 May 16 1 Day 1 Mth 3 Mths
Indian IndicesSENSEX Index 25,790 0.8 0.6 12.2NIFTY Index 7,900 0.7 0.6 13.2BANKEX Index 19,281 0.9 4.0 21.6SPBSITIP Index 11,288 1.1 0.0 9.6BSETCG INDEX 13,576 (0.0) 2.6 20.7BSEOIL INDEX 9,250 0.8 (1.6) 13.1CNXMcap Index 13,182 0.7 0.4 14.8SPBSSIP Index 11,141 0.9 1.8 15.1
World IndicesDow Jones 17,721 0.1 (1.0) 10.9Nasdaq 4,737 (0.5) (4.2) 9.2FTSE 6,104 (0.9) (4.1) 6.9NIKKEI 16,646 0.4 0.6 10.2HANGSENG 19,915 (0.7) (6.7) 7.8
Value traded (Rs cr)12 May 16 % Chg - Day
Cash BSE 2,488 3.0Cash NSE 15,781 (11.3)Derivatives 234,915 (19.5)
Net inflows (Rs cr)11 May 16 % Chg MTD YTD
FII (324) (184) (213) 11,577Mutual Fund 1,583 1,204 2,439 5,036
FII open interest (Rs cr)11 May 16 % Chg
FII Index Futures 13,909 3.9FII Index Options 67,687 3.0FII Stock Futures 49,331 1.5FII Stock Options 3,695 5.3
Advances / Declines (BSE)12 May 16 A B T Total % total
Advances 201 747 26 974 64Declines 94 378 30 502 33Unchanged 3 47 3 53 3
Commodity % Chg
12 May 16 1 Day 1 Mth 3 Mths
Crude (US$/BBL) 46.1 (1.2) 10.5 56.7Gold (US$/OZ) 1,271.1 (0.1) 1.7 2.5Silver (US$/OZ) 17.1 (1.1) 4.5 8.1
Debt / forex market12 May 16 1 Day 1 Mth 3 Mths
10 yr G-Sec yield % 7.4 7.4 7.4 7.7Re/US$ 66.6 66.6 66.4 68.2
Sensex
Source: ET = Economic Times, BS = Business Standard, FE = Financial Express,BL = Business Line, ToI: Times of India, BSE = Bombay Stock Exchange
22700
24700
26700
28700
30700
May-15 Sep-15 Jan-16 May-16

Kotak Securities - Private Client Research Please see the disclaimer on the last page For Private Circulation 2
MORNING INSIGHT May 13, 2016
Kotak Securities Limited has two independent equity research groups: Institutional Equities and Private Client Group. This report hasbeen prepared by the Private Client Group. The views and opinions expressed in this document may or may not match or may be contrarywith the views, estimates, rating, target price of the Institutional Equities Research Group of Kotak Securities Limited.
HAVELLS INDIA LTD (HIL)PRICE: RS.341 RECOMMENDATION: SELLTARGET PRICE: RS.330 FY18E P/E: 29.5X
HIL Q4FY16 result was encouraging; revenue growth was satisfactory (inline with our estimates) on back of strong YoY growth in lighting division.Operating margins expanded YoY driven by switchgear/consumer durablebusiness. PAT outperformed our estimates due to sharp increase inswitchgear division margin and lower reported tax expenses in thequarter. Sylvania residual business (mainly Brazil and Thailand business)cut losses in Q4FY16 and reported EBIT at break-even level.
However we note that Havells stock has had a substantial run up of 25%in last three months. We believe that at current price, it fully discountspotential benefits arising from 1) improved focus/resource allocation inthe domestic market (post conclusion of Sylvania stake sale) and 2) revivalin consumer demand (2HFY16 revenue growth outperformed 1HFY16growth rate). We roll forward our valuation on FY18 earnings (value HILstock at 29x FY18 earnings) and arrive at a revised target price of Rs 330(Rs 320 earlier at 32xFY17 earnings). In view of downside to our revisedtarget price we change recommendation to 'SELL' from 'ACCUMULATE'earlier.
Quarterly performance - Standalone
(Rs mn) Q4FY16 Q4FY15 % YoY Q3FY16 QoQ%
Net Income 14754 13493 9.3 13445 9.7
Decrease/ (Increase) in stock (158) 951 99
Raw Material consumed 8745 7312 19.6 7666 14.1
Employee expenses 1018 803 26.8 974 4.5
Forex fluctuation (6) (17) (17)
Other expenses 2566 2347 9.3 2329 10.1
advertising expenses 388 284 36.3 561
Total expenditure 12553 11680 7.5 11613 8.1
EBITDA 2202 1813 21.4 1832 20.2
Other income 291.3 124.2 134.5 132.0 120.7
Depreciation 237.2 212.9 11.4 231.9 2.3
EBIT 2256 1725 30.8 1732 30.3
Finance Cost 48 12 297.5 19 151.1
Exceptional items 2023.9
Reported PBT 4231.8 1712.7 147.1 1712.6 147.1
Adj.PBT 2208 1713 28.9 1713 28.9
Tax 567 494 14.7 505 12.3
Reported PAT 3665 1219 200.8 1208 203.4
PAT 1641 1219 34.7 1208 35.9
Reported EPS (Rs) 5.9 2.0 200.8 1.9 203.4
Adj EPS 2.6 2.0 34.7 1.9 35.9
EBITDA (%) 14.9 13.4 13.6
Adj PAT (%) 11.1 9.0 9.0
RM/Sales (x) 59.3 54.2 57.0
Tax Rate (%) 25.7 28.9 29.5
Source: Company
Summary table
(Rs mn) FY16 FY17E FY18E
Sales 54,369 62,452 72,159Growth (%) 3.8 14.9 15.5EBITDA 6,535 7,479 8,770EBITDA margin (%) 13.8 14.0 14.3PBT 7721 8393 9834Net profit 5,130 6,208 7,207EPS (Rs) 8.2 9.5 11.4Growth (%) 40.2 14.9 16.1CEPS (Rs) 11.0 11.9 13.6BV (Rs/share) 30.8 35.5 41.6DPS (Rs) 6.0 3.5 4.5ROE (%) 27.4 28.6 29.5ROCE (%) 22.6 28.3 29.3Net cash (debt) 8,638 8,179 11,347NW Capital (Days) 39.0 0.5 4.4EV/Sales (x) 3.6 3.2 2.8EV/EBITDA (x) 26.7 22.7 19.4P/E (x) 39.4 34.3 29.5P/Cash Earnings (x) 31.0 28.6 25.0P/BV (x) 11.1 9.6 8.2
Source: Company, Kotak Securities - Pri-vate Client Research
RESULT UPDATE
Ruchir [email protected]+91 22 6218 6431
Kotak Securities - Private Client Research Please see the disclaimer on the last page For Private Circulation 3
MORNING INSIGHT May 13, 2016
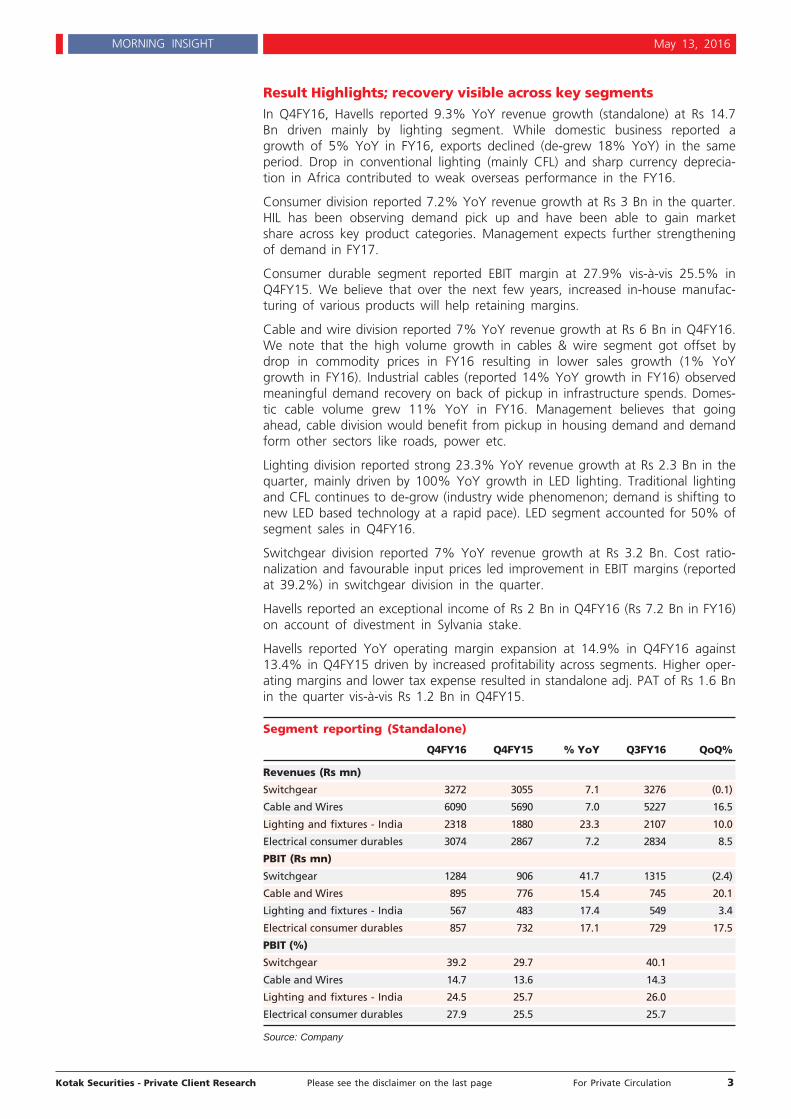
Result Highlights; recovery visible across key segments
In Q4FY16, Havells reported 9.3% YoY revenue growth (standalone) at Rs 14.7Bn driven mainly by lighting segment. While domestic business reported agrowth of 5% YoY in FY16, exports declined (de-grew 18% YoY) in the sameperiod. Drop in conventional lighting (mainly CFL) and sharp currency deprecia-tion in Africa contributed to weak overseas performance in the FY16.
Consumer division reported 7.2% YoY revenue growth at Rs 3 Bn in the quarter.HIL has been observing demand pick up and have been able to gain marketshare across key product categories. Management expects further strengtheningof demand in FY17.
Consumer durable segment reported EBIT margin at 27.9% vis-à-vis 25.5% inQ4FY15. We believe that over the next few years, increased in-house manufac-turing of various products will help retaining margins.
Cable and wire division reported 7% YoY revenue growth at Rs 6 Bn in Q4FY16.We note that the high volume growth in cables & wire segment got offset bydrop in commodity prices in FY16 resulting in lower sales growth (1% YoYgrowth in FY16). Industrial cables (reported 14% YoY growth in FY16) observedmeaningful demand recovery on back of pickup in infrastructure spends. Domes-tic cable volume grew 11% YoY in FY16. Management believes that goingahead, cable division would benefit from pickup in housing demand and demandform other sectors like roads, power etc.
Lighting division reported strong 23.3% YoY revenue growth at Rs 2.3 Bn in thequarter, mainly driven by 100% YoY growth in LED lighting. Traditional lightingand CFL continues to de-grow (industry wide phenomenon; demand is shifting tonew LED based technology at a rapid pace). LED segment accounted for 50% ofsegment sales in Q4FY16.
Switchgear division reported 7% YoY revenue growth at Rs 3.2 Bn. Cost ratio-nalization and favourable input prices led improvement in EBIT margins (reportedat 39.2%) in switchgear division in the quarter.
Havells reported an exceptional income of Rs 2 Bn in Q4FY16 (Rs 7.2 Bn in FY16)on account of divestment in Sylvania stake.
Havells reported YoY operating margin expansion at 14.9% in Q4FY16 against13.4% in Q4FY15 driven by increased profitability across segments. Higher oper-ating margins and lower tax expense resulted in standalone adj. PAT of Rs 1.6 Bnin the quarter vis-à-vis Rs 1.2 Bn in Q4FY15.
Segment reporting (Standalone)
Q4FY16 Q4FY15 % YoY Q3FY16 QoQ%
Revenues (Rs mn)
Switchgear 3272 3055 7.1 3276 (0.1)
Cable and Wires 6090 5690 7.0 5227 16.5
Lighting and fixtures - India 2318 1880 23.3 2107 10.0
Electrical consumer durables 3074 2867 7.2 2834 8.5
PBIT (Rs mn)
Switchgear 1284 906 41.7 1315 (2.4)
Cable and Wires 895 776 15.4 745 20.1
Lighting and fixtures - India 567 483 17.4 549 3.4
Electrical consumer durables 857 732 17.1 729 17.5
PBIT (%)
Switchgear 39.2 29.7 40.1
Cable and Wires 14.7 13.6 14.3
Lighting and fixtures - India 24.5 25.7 26.0
Electrical consumer durables 27.9 25.5 25.7
Source: Company

Kotak Securities - Private Client Research Please see the disclaimer on the last page For Private Circulation 4
MORNING INSIGHT May 13, 2016
Other Highlights
Management has guided for a double digit growth (15-18%) in FY17 on backof expected recovery across segments. Havells is likely to maintain marginsat current levels.
Management also stated that Q4FY16 reported margins is not the reflectionof entire year as typically Q4 margins are affected by factors like year-enddealers incentives etc.
Havells would save 50 bps on royalty payments from FY17 onwards. Manage-ment stated that the savings would be reinvested into the business toachieve growth.
Management stated that company is observing early signs of recovery. How-ever demand from housing continues to remain lackluster affectingSwitchgear sales.
Within consumer durables, fans and water heater continues to pull demand.Other appliances are expected grow at a reasonable pace in FY17.
Overall demand/penetration from small towns continues to remain strong.Havells has also been observing improved sales from West/South India,where it had weaker presence traditionally.
Havells management has guided for the capex in the range of Rs 2.6-2.8 Bnfor next year mainly towards capacity addition in -Cables, Switchgear andECB segment.
Management shared optimistic outlook for 'Standard' brands and expects toachieve sales of Rs 10 Bn by year 2020 (current sales at Rs 2 Bn). Companywill add new product categories in Standard brands as well.
Havells inorganic growth initiatives would be motivated by gaining 1) technol-ogy (new products) 2) market share and 3) geographical reach (mainly do-mestic).
In FY16, Havells invested Rs 290 mn in Promptec Renewable Energy Solutionslimited for acquiring 51% stake in the same.
Performance in Thailand and Brazil business has been stable with margins atbreak-even level in Q4FY16 as compare to negative margin in the precedingquarters.
Valuation and Recommendation
At current price of Rs.341, HIL stock is trading at 29.5x P/E and 19.4x EV/EBITDAon FY18E earnings.
We roll forward our valuation on FY18 earnings (value HIL stock at 29x FY18earnings) and arrive at a revised target price of Rs 330 (Rs 320 earlier at32xFY17 earnings). In view of downside to our revised target price we changerecommendation to 'SELL' from 'ACCUMULATE' earlier.
We recommend SELL onHavells India Ltd with a price
target of Rs.330

Kotak Securities - Private Client Research Please see the disclaimer on the last page For Private Circulation 5
MORNING INSIGHT May 13, 2016
Kotak Securities Limited has two independent equity research groups: Institutional Equities and Private Client Group. This report hasbeen prepared by the Private Client Group. The views and opinions expressed in this document may or may not match or may be contrarywith the views, estimates, rating, target price of the Institutional Equities Research Group of Kotak Securities Limited.
CENTURY PLYBOARDS LTD
PRICE: RS.173 RECOMMENDATION: BUYTARGET PRICE: RS.204 FY18E P/E: 17.8X
Results overview: Revenues for Q4FY16 were better than our estimatesand were led by improvement in plywood and laminates division. CFSdivision also reported healthy growth during the quarter, althoughsupported by lower base of last year. Operating margins witnessed adecline due to shift in sales mix towards mid segment category. However,despite lower margins, better than expected revenue growth led to PATcoming in line with our estimates. Volumes are likely to improve goingforward as company has taken lot of promotional initiatives in last oneyear to push volumes along with higher expense on branding andadvertisement. Along with this, market has started witnessing someimprovement in demand as the cash crunch situation of end users iseasing now.
We tweak our FY17 estimates to factor in lower volumes. We alsointroduce FY18 estimates, and roll forward our valuations on FY18 andarrive at a revised price target of Rs 204 (Rs 200 earlier) based on 21x FY18estimates. We remain positive on the company as we expect it to benefitfrom demand revival and GST implementation going forward. Wemaintain BUY recommendation on the stock.
Financial highlights
(Rs mn) Q4FY16 Q4FY15 YoY (%)
Net Sales 4512.5 4049.4 11.4%
Total Expenditure 3774.1 3298.8 14.4%
EBITDA 738.4 750.6 -1.6%
EBITDA margins % 16.4% 18.5%
Depreciation 122.1 118.6
EBIT 616.3 632.0 -2.5%
Interest 103.1 90.2
EBT (Exc other income) 513.2 541.8 -5.3%
Other operating income 35.7 42.8
Other Income 0 8.7
EBT 548.9 593.3 -7.5%
Tax 143.7 113.5
Tax % 26.2% 19.1%
Profit After Tax 405.2 479.8 -15.5%
Equity Capital 222.53 222.53
Face Value (In Rs) 1 1
EPS (Rs) 1.8 2.2 -15.5%
Source: Company
Revenue growth led by higher commercial veneer and laminatesales; Plywood growth yet to be seen in coming quarters.The company reported revenue growth of 11.4% YoY led by 10% YoY growth inplywood and 15% YoY growth in laminate division. CFS reported a growth of36.6% YoY. Plywood division sales improvement was led by sharp jump of 44%YoY in commercial veneer volumes. Laminate division growth of 15% YoY wasled by improvement in capacity utilizations, realizations as well as higher brand-ing and advertisement.
Summary table
(Rs mn) FY16 FY17E FY18E
Sales 16,469 17,945 20,231Growth (%) 6% 9% 13%EBITDA 2,759 3,230 3,642EBITDA margin (%) 16.8 18.0 18.0PBT 1,978 2,313 2,539Net profit 1,681 1,966 2,158EPS(Rs) 7.6 8.8 9.7Growth(%) 11 17 10CEPS(Rs) 9.6 11.4 13.0BVPS(Rs) 25.0 33.8 43.5DPS (Rs) - - -ROE (%) 35.6 30.1 25.1ROCE (%) 25.6 23.4 21.4Net debt 4,515 6,062 4,582NW capital (Days) 147.0 147.0 147.0P/E (x) 22.9 19.6 17.8P/BV (x) 6.9 5.1 4.0EV/Sales (x) 2.6 2.5 2.1EV/EBITDA (x) 15.4 13.7 11.7
Source: Company, Kotak Securities - Pri-vate Client Research
RESULT UPDATE
Teena [email protected]+91 22 6218 6432

Kotak Securities - Private Client Research Please see the disclaimer on the last page For Private Circulation 6
MORNING INSIGHT May 13, 2016
Plywood segment revenues: For Q4FY16, volume growth of plywood was 4%YoY while deco ply volumes were up by 34% YoY and commercial veneer vol-umes were higher by 44% YoY. In terms of realizations, plywood realizationswere up by just 1% YoY due to demand slowdown while commercial veneer re-alizations were down by 13% YoY. Drop in commercial veneer realizations wason account of lower quality of veneer being sold in the market. Deco ply realiza-tions were down by 2% YoY. Deco ply and commercial veneer form just 10%and 11.5% respectively of the total plywood division sales.
On yearly basis, plywood volumes were down by 2% YoY with flat realizationswhile commercial veneer volumes were up by 24% with 8% YoY decline in aver-age realizations. Going ahead growth in plywood division is likely to come fromimprovement in volumes while realizations may remain flat. Additional lines ofplywood are being planned in Punjab if demand exceeds company's capacity.
Laminate segment revenues: Domestic sales volume during the quarter were15% YoY while export sales volume were up by 16% YoY. In terms of realiza-tions, domestic realizations were up by 8% YoY due to improvement in demandwhile export realizations were down by 1% YoY. Laminate division performancewas led by improvement in operational efficiencies of its plants coupled withbetter capacity utilization. It expects to run the laminate plant for 29 days in amonth during FY17.
On yearly basis, domestic laminate volumes were up by 17% YoY with flat real-izations while export volumes were up by 22% with 4% YoY improvement inaverage realizations. Going ahead, we believe that growth in laminate division islikely to come from improvement in capacity utilizations as well as prices. Com-pany is also planning to set up new laminate capacity in Kolkata if demand re-mains strong.
CFS segment revenues: Volumes handled by the logistics division were up by22% YoY for Q4FY16 while realizations are also higher by 13% YoY. This led toalmost 38% YoY growth in CFS revenues. For the full year, volumes are up by13% YoY while realizations are up by 5% YoY.
Demand scenario: Demand scenario has started witnessing improvement in se-lect segment for the plywood segment. Company is also focusing on mid-seg-ment range of Sainik in order to capture shift in demand from premium categoryto mid-segment category. Commercial veneer sales are also likely to increasegoing forward post company's additional lines in Laos get operational. It has 5lines in Myanmar with a capacity of 8000 CBM each and increasing to 10 lines inLaos with a capacity of 8000 CBM each. Thus currently including both these lo-cations (5 lines in Myanmar and 10 lines in Laos), company has a capacity of120000 CBM. Operating at an effective utilization of 65%, company would pro-duce nearly 78000 CBM of veneer. As per current requirement, for a 210000CBM of plywood capacity, company requires 16-17000 CBM of face veneer forin house use. So the surplus veneer is being sold in open market to cheapergrade plywood manufacturers.
Capex: Company is setting up an MDF manufacturing unit in Punjab with an es-timated capex of Rs 4 bn and capacity of 600 CBM per day and is expected tocommission by Dec,16 or Jan,17. It has already incurred capex of Rs 380 mn forMDF for acquiring land for the first phase and placing orders for major machin-ery with reputed foreign suppliers from China and European countries. Companyhas also invested nearly Rs 500 mn for settting up a particle board unit whichwill make particle board from timber wastage, saw mill dust etc generated atChennai unit. It will backward integrate with company's existing pre-laminationboard units at Chennai. The plant construction is complete and company isawaiting electricity connections. Remaining capex of Rs 100 mn for this plant islikely to be incurred in FY17.

Kotak Securities - Private Client Research Please see the disclaimer on the last page For Private Circulation 7
MORNING INSIGHT May 13, 2016
With imposition of anti-dumping duty expected on MDF, company is expected tobenefit from the same as its plant is likely to commission during current financialyear.
We tweak our FY17 estimates to factor in lower volumes and also introduceFY18 estimates. We expect revenues to grow at a CAGR of 11% between FY16-18. (as against revenues of Rs 18.6 bn estimated earlier).
Operating margins lower than our estimates
Operating margins witnessed a decline due to shift in sales mix towards mid seg-ment category. This shift has resulted in putting pressure on plywood divisionmargins which have declined sharply for the quarter as well as for the full year.Another reason for decline in plywood margin was lower commercial veneer re-alizations. Also during the quarter, the discounts were higher to push volumeswhich had put pressure on margins. Laminate division margins have improved onaccount of better operational efficiencies and higher capacity utilization. Com-pany expects margins to sustain around 17%-18% going forward. We maintainour estimates and expect margins of 18% going forward.
Net profit performance impacted by lower margins
Net profit performance was impacted by lower margins and higher tax rate forquarter. However, despite lower margins, better than expected revenue growthled to PAT coming in line with our estimates. Company enjoys tax benefits at itsmanufacturing locations in Guwahati and CFS division in Kolkata. We expect fullyear tax rate of 15% for the company.
Post tweaking our estimates, we expect net profits to grow at a CAGR of 13.3%between FY16-18. (as against our PAT estimate of Rs 2.12 bn earlier for FY17)
Valuation and recommendation
At current price of Rs.173, stock is trading at 19.6x and 17.8x P/E and 13.7x and11.7x EV/EBITDA on FY17 and FY18 estimates respectively. We roll forward ourvaluations on FY18 and arrive at a revised price target of Rs 204 (Rs 200 earlier)based on 21x FY18 estimates. We remain positive on the company as we expectit to benefit from demand revival and GST implementation going forward. Wemaintain BUY recommendation on the stock.
We recommend BUY onCentury Plyboards Ltd with a
price target of Rs.204
Kotak Securities - Private Client Research Please see the disclaimer on the last page For Private Circulation 8
MORNING INSIGHT May 13, 2016
Kotak Securities Limited has two independent equity research groups: Institutional Equities and Private Client Group. This report hasbeen prepared by the Private Client Group. The views and opinions expressed in this document may or may not match or may be contrarywith the views, estimates, rating, target price of the Institutional Equities Research Group of Kotak Securities Limited.
RESULT UPDATE
Arun [email protected]
+91 22 6218 6443
APOLLO TYRES (APTY)PRICE: RS.159 RECOMMENDATION: BUYTARGET PRICE: RS.185 FY18E P/E: 6.5X
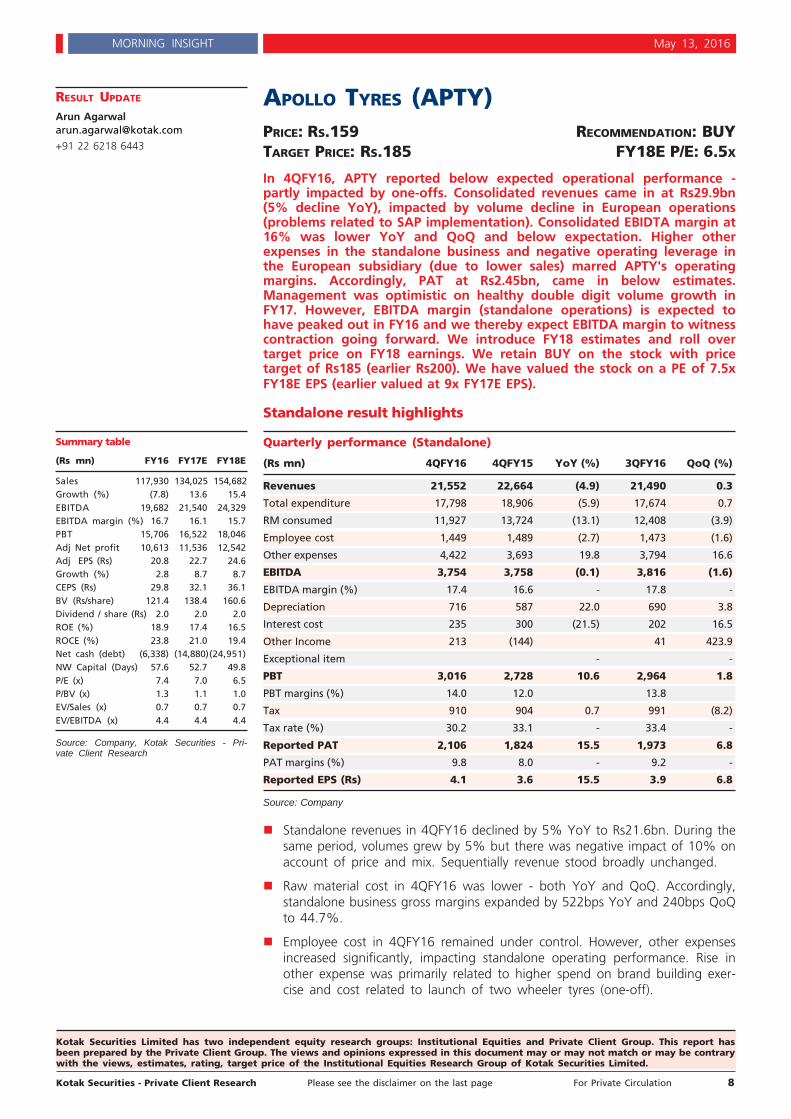
In 4QFY16, APTY reported below expected operational performance -partly impacted by one-offs. Consolidated revenues came in at Rs29.9bn(5% decline YoY), impacted by volume decline in European operations(problems related to SAP implementation). Consolidated EBIDTA margin at16% was lower YoY and QoQ and below expectation. Higher otherexpenses in the standalone business and negative operating leverage inthe European subsidiary (due to lower sales) marred APTY's operatingmargins. Accordingly, PAT at Rs2.45bn, came in below estimates.Management was optimistic on healthy double digit volume growth inFY17. However, EBITDA margin (standalone operations) is expected tohave peaked out in FY16 and we thereby expect EBITDA margin to witnesscontraction going forward. We introduce FY18 estimates and roll overtarget price on FY18 earnings. We retain BUY on the stock with pricetarget of Rs185 (earlier Rs200). We have valued the stock on a PE of 7.5xFY18E EPS (earlier valued at 9x FY17E EPS).
Standalone result highlights
Quarterly performance (Standalone)
(Rs mn) 4QFY16 4QFY15 YoY (%) 3QFY16 QoQ (%)
Revenues 21,552 22,664 (4.9) 21,490 0.3
Total expenditure 17,798 18,906 (5.9) 17,674 0.7
RM consumed 11,927 13,724 (13.1) 12,408 (3.9)
Employee cost 1,449 1,489 (2.7) 1,473 (1.6)
Other expenses 4,422 3,693 19.8 3,794 16.6
EBITDA 3,754 3,758 (0.1) 3,816 (1.6)
EBITDA margin (%) 17.4 16.6 - 17.8 -
Depreciation 716 587 22.0 690 3.8
Interest cost 235 300 (21.5) 202 16.5
Other Income 213 (144) 41 423.9
Exceptional item - -
PBT 3,016 2,728 10.6 2,964 1.8
PBT margins (%) 14.0 12.0 13.8
Tax 910 904 0.7 991 (8.2)
Tax rate (%) 30.2 33.1 - 33.4 -
Reported PAT 2,106 1,824 15.5 1,973 6.8
PAT margins (%) 9.8 8.0 - 9.2 -
Reported EPS (Rs) 4.1 3.6 15.5 3.9 6.8
Source: Company
Standalone revenues in 4QFY16 declined by 5% YoY to Rs21.6bn. During thesame period, volumes grew by 5% but there was negative impact of 10% onaccount of price and mix. Sequentially revenue stood broadly unchanged.
Raw material cost in 4QFY16 was lower - both YoY and QoQ. Accordingly,standalone business gross margins expanded by 522bps YoY and 240bps QoQto 44.7%.
Employee cost in 4QFY16 remained under control. However, other expensesincreased significantly, impacting standalone operating performance. Rise inother expense was primarily related to higher spend on brand building exer-cise and cost related to launch of two wheeler tyres (one-off).
Summary table
(Rs mn) FY16 FY17E FY18E
Sales 117,930 134,025 154,682Growth (%) (7.8) 13.6 15.4EBITDA 19,682 21,540 24,329EBITDA margin (%) 16.7 16.1 15.7PBT 15,706 16,522 18,046Adj Net profit 10,613 11,536 12,542Adj EPS (Rs) 20.8 22.7 24.6Growth (%) 2.8 8.7 8.7CEPS (Rs) 29.8 32.1 36.1BV (Rs/share) 121.4 138.4 160.6Dividend / share (Rs) 2.0 2.0 2.0ROE (%) 18.9 17.4 16.5ROCE (%) 23.8 21.0 19.4Net cash (debt) (6,338) (14,880)(24,951)NW Capital (Days) 57.6 52.7 49.8P/E (x) 7.4 7.0 6.5P/BV (x) 1.3 1.1 1.0EV/Sales (x) 0.7 0.7 0.7EV/EBITDA (x) 4.4 4.4 4.4
Source: Company, Kotak Securities - Pri-vate Client Research

Kotak Securities - Private Client Research Please see the disclaimer on the last page For Private Circulation 9
MORNING INSIGHT May 13, 2016
EBITDA growth remained almost flat as gross margin expansion gains werenegated by rise in other expenses. EBITDA margin for the quarter stood at17.4%, as against 16.6% reported during similar period last year.
Interest cost increased QoQ due to increase in standalone net debt fromRs2.5bn in 3QFY16 to Rs2.8bn by end 4QFY16.
APTY reported standalone PAT of Rs2.1bn, 16% higher YoY. Higher other in-come and lower tax provision as compared with 4QFY15 contributed towardsPAT growth.
Consolidated result highlights
Quarterly performance (Consolidated)
(Rs mn) 4QFY16 4QFY15 YoY (%) 3QFY16 QoQ (%)
Revenues 29,897 31,597 (5.4) 29,488 1.4
Total expenditure 25,123 26,429 (4.9) 24,432 2.8
RM consumed 14,813 17,720 (16.4) 14,560 1.7
Employee cost 4,202 3,956 6.2 3,967 5.9
Other expenses 6,108 4,753 28.5 5,905 3.4
EBITDA 4,773 5,169 (7.7) 5,056 (5.6)
EBITDA margin (%) 16.0 16.4 - 17.1 -
Depreciation 1,228 876 40.1 1,049 17.0
Interest cost 239 348 (31.4) 194 23.0
Other Income 197 (49) 68 189.9
Exceptional item (35) - -
PBT 3,504 3,861 (9.2) 3,881 (9.7)
PBT margins (%) 11.7 12.2 13.2
Tax 1,052 786 33.9 1,096 (4.0)
Tax rate (%) 30.0 20.4 - 28.2 -
PAT (bef minority int/asso pft) 2,452 3,075 (20.3) 2,785 (12.0)
Share of associates/Minority Int - - - - -
Reported PAT 2,452 3,075 (20.3) 2,785 (12.0)
PAT margins (%) 8.2 9.7 9.4
Reported EPS (Rs) 4.8 6.0 (20.3) 5.5 (12.0)
Source: Company
Consolidated revenues declined by 5% YoY to Rs29.9bn. Fall in revenues wasdue to volume decline in European operations and impact of price cut.
Indian operations revenue declined by 5% due to 10% impact of price cutand product mix.
European operations revenue declined by 17% YoY to Rs7.4bn due to ~17%YoY fall in volumes. Decline in volume/revenue was on account of problemrelating to SAP implementation. Management indicated that the industry vol-ume did not decline and entire volume decline in the quarter was due tocompany's internal issue.
Revenues from other geographies witnessed sharp YoY increase.
Fall in natural rubber prices and crude prices translated into YoY gross mar-gin expansion for the company. Consolidated gross margin increased by653bps YoY to 50.5%.
Employee cost increased by 6% YoY. Rise in other expenses pertains tohigher other expenses in standalone business (higher spend on brand buildingand expenses related to two wheeler tyre launch).

Kotak Securities - Private Client Research Please see the disclaimer on the last page For Private Circulation 10
MORNING INSIGHT May 13, 2016
Consolidated EBITDA margin declined YoY from 16.4% to 16%. Weak Euro-pean operation performance coupled higher other expenses in the standalonebusiness impacted margins. European business EBITDA margins declined YoYfrom 14.7% to 11%. Lower sales in European business led to negative oper-ating leverage, thereby impacting operational performance.
EBITDA de-growth and higher YoY tax provision led to PAT decline of 20%.PAT came in at Rs2.46bn.
Conference Call Highlights
Management sounded positive about standalone business volume growth inFY17. Company expects double digit volume growth in FY17 at Indian opera-tions. Company indicated bullish signs of demand pick-up in the farm seg-ment. Truck Bus Bias (TBB) segment too is showing growth. Further additionalcapacity from Chennai expansion will also contribute to volume increase inthe growing TBR segment. In 4QFY16, APTY reported 10% volume growth in4QFY16.
In Europe operations, volumes in FY16 were impacted by certain one-offs. Ona weak FY16 base, company expects significant growth in FY17. Further inFY18, volume growth will come from new plant coming up in Hungary.
Company is in the process of resolving SAP related issue at the European op-erations. However, there is likely to be some impact of this on sales in1QFY17.
Two wheeler tyre sales commenced from March 2016 and the response hasbeen strong so far. Further, the company highlighted that the business will beprofitable even at early stages.
Company expects raw material cost to increase going ahead. In 1QFY17,company expects 3-4% increase in raw material cost basket. 2QFY17 willlikely witness further input cost pressure. Standalone business margins havepeaked out in FY16 and will correct in FY17.
Over the next two years, Europe business operating margins will improveover FY16 levels, but the same will be lower than high margins achieved inFY14/FY15.
On the back of increase in raw material cost, the industry has not taken anypricing action in the past two months.
In the consolidated revenues - 75% contribution was from replacement and25% came from OEM. Trucks accounted for 46%, cars - 34% and balancefrom other vehicle category.
In the standalone business, trucks accounted for 65% and 17% came fromcar tyre segment.
Capacity utilization was ~ 75-79% at Indian operations and 90% for the Eu-ropean operations.
Average raw material price in 4QFY16 - Natural Rubber - Rs115/kg, SyntheticRubber - Rs100/kg, Tyre Cord Fabric - Rs240/kg, Steel Cord - Rs110/kg andCarbon Black - Rs62/kg.
Consolidated gross debt was Rs14.4bn and standalone net debt was Rs2.8bn.
Government has initiated investigation into dumping issue related to TBR Chi-nese imports.
Hungary plant production will start in early 2017. Chennai capacity expansionwill from 3QFY17. Apart from this, the company is working on increasing ca-pacity (marginal increase) through de-bottlenecking in 1HFY17. In 4QFY16,APTY TBR sales growth was flat QoQ due to capacity constraints.
Kotak Securities - Private Client Research Please see the disclaimer on the last page For Private Circulation 11
MORNING INSIGHT May 13, 2016
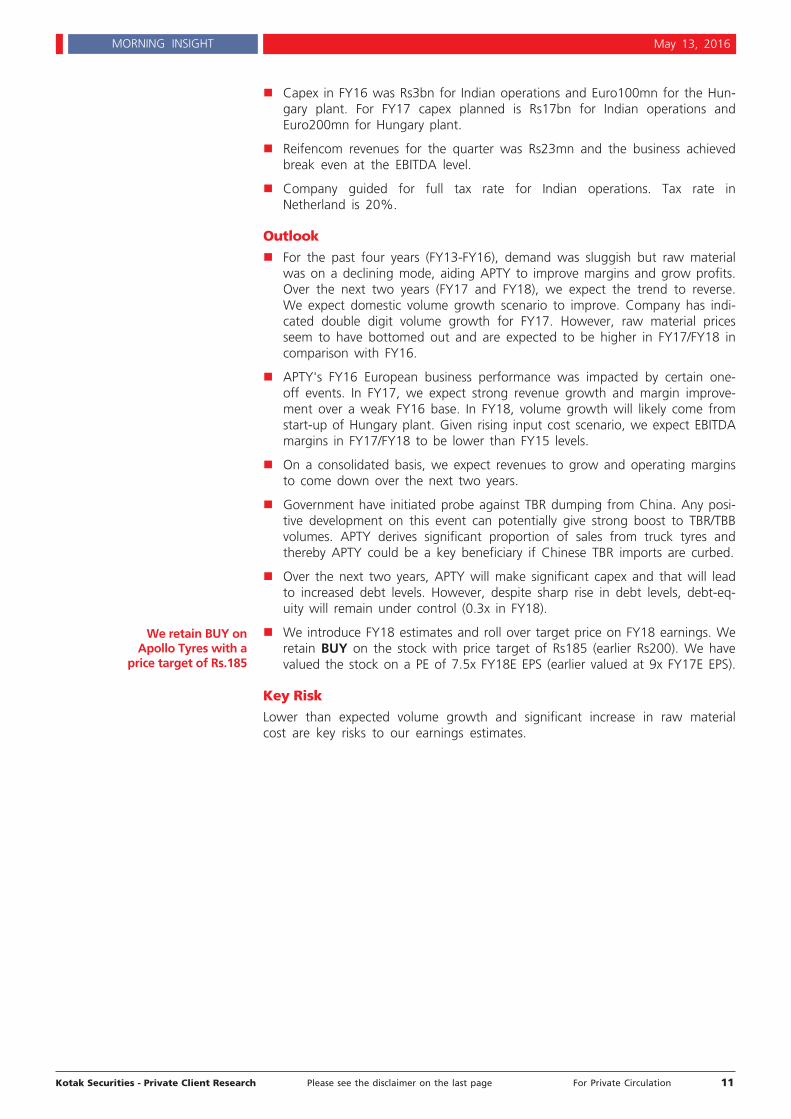
Capex in FY16 was Rs3bn for Indian operations and Euro100mn for the Hun-gary plant. For FY17 capex planned is Rs17bn for Indian operations andEuro200mn for Hungary plant.
Reifencom revenues for the quarter was Rs23mn and the business achievedbreak even at the EBITDA level.
Company guided for full tax rate for Indian operations. Tax rate inNetherland is 20%.
Outlook
For the past four years (FY13-FY16), demand was sluggish but raw materialwas on a declining mode, aiding APTY to improve margins and grow profits.Over the next two years (FY17 and FY18), we expect the trend to reverse.We expect domestic volume growth scenario to improve. Company has indi-cated double digit volume growth for FY17. However, raw material pricesseem to have bottomed out and are expected to be higher in FY17/FY18 incomparison with FY16.
APTY's FY16 European business performance was impacted by certain one-off events. In FY17, we expect strong revenue growth and margin improve-ment over a weak FY16 base. In FY18, volume growth will likely come fromstart-up of Hungary plant. Given rising input cost scenario, we expect EBITDAmargins in FY17/FY18 to be lower than FY15 levels.
On a consolidated basis, we expect revenues to grow and operating marginsto come down over the next two years.
Government have initiated probe against TBR dumping from China. Any posi-tive development on this event can potentially give strong boost to TBR/TBBvolumes. APTY derives significant proportion of sales from truck tyres andthereby APTY could be a key beneficiary if Chinese TBR imports are curbed.
Over the next two years, APTY will make significant capex and that will leadto increased debt levels. However, despite sharp rise in debt levels, debt-eq-uity will remain under control (0.3x in FY18).
We introduce FY18 estimates and roll over target price on FY18 earnings. Weretain BUY on the stock with price target of Rs185 (earlier Rs200). We havevalued the stock on a PE of 7.5x FY18E EPS (earlier valued at 9x FY17E EPS).
Key Risk
Lower than expected volume growth and significant increase in raw materialcost are key risks to our earnings estimates.
We retain BUY onApollo Tyres with a
price target of Rs.185

Kotak Securities - Private Client Research Please see the disclaimer on the last page For Private Circulation 12
MORNING INSIGHT May 13, 2016
Kotak Securities Limited has two independent equity research groups: Institutional Equities and Private Client Group. This report hasbeen prepared by the Private Client Group. The views and opinions expressed in this document may or may not match or may be contrarywith the views, estimates, rating, target price of the Institutional Equities Research Group of Kotak Securities Limited.
INDIAN BANK
PRICE: RS.86 RECOMMENDATION: BUYTARGET PRICE: RS.110 FY18E P/E: 6.2X; P/ABV: 0.5X
Q4FY16 results: Higher provisions pulled down earningsHigher NPA provisioning on a/c of second tranche of RBI's Asset QualityReview (AQR) pulled down earnings. Core earnings (NII: Rs.11.3 bn) grewat muted pace (2.4% YoY) on back of margin compression (10bps YoY)mainly impacted by interest de-recognition as asset quality deteriorated.Spike in the NPA provisions (2.1x YoY) pulled down earnings (Rs.0.84 bn;down 59% YoY). Although Indian Bank trades at reasonable valuation(0.5x FY18E ABV), it has high share of stressed assets (~12% of loan book)which remains an overhang on the stock performance, in our view.Nonetheless, bank is comfortable on core capital (CET-I at 11.7%) andtherefore we assigning slightly higher P/ABV multiple for the stock (vis-à-vis its peers) where risk of equity dilution at <1x BV is almost negligible.We are modeling subdued return profile (RoE at ~5% while RoA at ~30bps)during FY17/18E and cutting the TP to Rs.110 (Rs.125 earlier; 0.6x FY18EABV) but retain BUY rating on the stock.
Result Performance
(Rs mn) Q4FY16 Q4FY15 YoY (%)
Interest on advances 28,929 30,114 -3.9
Interest on Investment 10,626 9,101 16.8
Interest on RBI/ banks' balances 209 320 -34.8
Other interest 79 29 173.6
Total Interest earned 39,842 39,564 0.7
Interest expenses 28,496 28,484 0.0
Net interest income 11,346 11,079 2.4Other income 5,294 4,541 16.6
Net Revenue (NII + Other income) 16,640 15,621 6.5Operating Expenses 8,366 7,448 12.3
Payments to / Provisions for employees 4,872 4,359 11.8
Other operating expenses 3,493 3,090 13.1
Operating profit 8,274 8,172 1.2Provisions & contingencies 8,136 5,626 44.6
Provision for taxes (707) 485 -245.6
Net profit 845 2,062 -59.0EPS (Rs.) 1.76 4.29 -59.0
Source: Company
Higher NPA provisioning on a/c of second tranche of RBI's AssetQuality Review (AQR) pulled down earnings.
NII (Rs.11.3 bn) grew at muted pace (2.4% YoY) on back of margin compression(2.38% in Q4FY16; down 10bps YoY) mainly impacted by interest de-recognition(Rs.3.5 bn; 35bps impact) as asset quality deteriorated while loan book contin-ued to grow at subdued pace (2.9% YoY). Decline in NIM is largely due to sharpfall in yield on advances (75bps YoY) while cost of deposits fell only 53bps, dur-ing the same period. We believe change in asset mix towards lower yieldingproducts as well as income de-recognition on account of elevated delinquencieshave taken a toll on yield on assets in recent quarters while relatively lowerCASA share (28-30%) provides limited cushion to the declining margin. We havebeen conservative enough in modeling lower NIM at 2.3/2.2% during FY17/18E,as against 2.33% reported for FY16.
RESULT UPDATE
Saday [email protected]+91 22 6218 6437

Kotak Securities - Private Client Research Please see the disclaimer on the last page For Private Circulation 13
MORNING INSIGHT May 13, 2016
Trends in NIM (%)
Source: Company
Non-interest income grew at healthy pace (16.6% YoY) translating into moder-ate growth in revenue line (6.5% YoY). Spike in the NPA provisions (2.1x YoY) ona/c of second tranche of RBI's Asset Quality Review (AQR) pulled down earnings(Rs.0.84 bn; down 59% YoY) which remained in black on tax write-back (Rs.707mn).
Business growth has seen moderation on risk aversion; liabilityfranchise remained stableIndian bank has been reporting subdued loan growth during previous eight quar-ters (<10% levels) due to risk aversion (as NPL risk persists), as against the run-rate of 15-16% seen earlier. Loan book grew at subdued pace (2.9% YoY) dur-ing Q4FY16 as compared to our assumption of ~5% loan growth during FY16which is likely to trend upward to ~7%/10% during FY17/18 on back of likelyimprovement in the economic environment.
Deposit growth was also moderate at 5.4% YoY during Q4FY16, largely on backof subdued growth in term deposits. During the same period, saving depositsgrew at healthy pace (15.6% YoY) while traction in current account floats re-mained healthy (10.9% YoY). CASA mix saw marginal improvement from 29.6%in Q3FY16 to 30.9% in Q4FY16.
Trends in CASA (%)
Source: Company

Kotak Securities - Private Client Research Please see the disclaimer on the last page For Private Circulation 14
MORNING INSIGHT May 13, 2016
NPLs spiked on back of RBI's AQR; however, comfortable Tier-I capi-tal justify relatively better valuation
Indian bank witnessed spike in the fresh slippage (Rs.34 bn) which rose to 10.6%(annualized) during Q4FY16 on back second tranche of RBI's Asset Quality Re-view (AQR) vis-a-vis slippage seen at ~1.6% during H1FY16. Out of Rs.34 bn ofgross slippage, Rs.16-17 bn came from AQR and remaining mainly originatedfrom iron & Steel, Power and textile segments. In absolute terms, GNPA/NNPAgrew 24.8%/39.6% (QoQ), respectively, while in percentage terms, they standat elevated levels - 6.7%/4.2% in Q4FY16 as compared to 5.6%/3.2% inQ3FY16. Provision coverage ratio saw decline (740bps QoQ) to 53.4% (Q4FY16)which may not bode well for the stock.
Trend in NPAs
(Rs. Bn) Q1 2014 Q2 2014 Q3 2014 Q4 2014 Q1 2015 Q2 2015 Q3 2015 Q4 2015 Q1 2016 Q2 2016 Q3 2016 Q4 2016
Gross NPA 37.23 41.79 38.35 45.62 47.23 50.03 54.61 54.70 58.15 57.73 70.71 88.27
Gross NPA (%) 3.41 3.76 3.42 3.67 4.01 4.21 4.52 4.40 4.65 4.61 5.61 6.66
Net NPA 24.86 28.04 24.84 27.64 28.57 29.76 32.35 31.47 31.93 31.88 38.81 54.19
Net NPA (%) 2.31 2.56 2.25 2.26 2.48 2.48 2.74 2.50 2.62 2.60 3.17 4.20
PCR (%) 33.2% 32.9% 35.2% 39.4% 39.5% 40.5% 40.8% 44.5% 45.1% 44.8% 45.1% 38.6%
PCR (%) - inc W/O A/Cs 61.3% 58.6% 58.0% 57.8% 57.6% 57.4% 57.1% 60.1% 60.9% 62.2% 60.8% 53.4%
Source: Company
Its outstanding standard restructured book stands at ~5% (Rs.63.7 bn) with totalstressed portfolio at ~12% of loan book. Its provision coverage ratio now standsat 53.4%, which does not bode well for the stock, which used to enjoy ~90%coverage ratio only few years back. However, we believe comfortable core capi-tal (CET-I: 11.7%) reduces the risk of equity dilution at <1x BV, which could bebook value dilutive in nature.
Valuation & recommendation
Although Indian Bank trades at reasonable valuation (0.5x FY18E ABV), it hashigh share of stressed assets (~12% of loan book) which remains an overhangon the stock performance, in our view. Nonetheless, bank is comfortable on corecapital (CET-I at 11.7%) and therefore we assigning slightly higher P/ABV mul-tiple for the stock (vis-à-vis its peers) where risk of equity dilution at <1x BV isalmost negligible.
We have marginally cut the earnings estimate for FY17E on higher credit costsassumption and expect its net income growth to remain muted during FY17/18.We are modelling earnings to de-grow at 3.1% CAGR during FY16-18E with sub-dued return profile which justifies lower P/ABV multiple for the stock. Despiteasset quality concerns, we believe Indian bank deserves better valuation vis-à-visits peers in PSU banking pack with strong capitalization which reduces the riskof equity dilution at <1x BV (book value dilutive). We are modeling subdued re-turn profile (RoE at ~5% while RoA at ~30bps) during FY17/18E and cutting theTP to Rs.110 (Rs.125 earlier; 0.6x FY18E ABV) but retain BUY rating on the stock.
We recommend BUY onIndian Bank with a price
target of Rs.110

Kotak Securities - Private Client Research Please see the disclaimer on the last page For Private Circulation 15
MORNING INSIGHT May 13, 2016
Key data
(Rs. Bn) 2015 2016 2017E 2018E
Interest income 158.6 162.4 172.2 186.6
Interest expense 113.9 118.0 126.0 138.2
Net interest income 44.7 44.5 46.3 48.4
Growth (%) 2.6% -0.6% 4.0% 4.6%
Other income 13.6 17.8 16.0 17.5
Gross profit 30.2 30.3 27.4 27.9
Net profit 10.2 7.1 5.9 6.7
Growth (%) -12.3% -30.0% -16.4% 12.3%
Gross NPA (%) 4.4 6.7 6.9 6.3
Net NPA (%) 2.5 4.2 3.6 3.2
NIM (%) 2.5 2.3 2.3 2.2
CAR (%) 12.9 12.3 12.1 12.1
RoE (%) 8.4 5.6 4.5 4.9
RoA (%) 0.5 0.4 0.3 0.3
DPS (Rs) 4.2 4.5 5.0 5.0
EPS (Rs) 21.2 14.8 12.4 13.9
Adjusted BVPS (Rs) 195.9 158.0 173.0 182.6
P/E (x) 4.1 5.8 6.9 6.2
P/ABV (x) 0.4 0.5 0.5 0.5
Source: Company, Kotak Securities - Private Client Research
Kotak Securities - Private Client Research Please see the disclaimer on the last page For Private Circulation 16
MORNING INSIGHT May 13, 2016
Kotak Securities Limited has two independent equity research groups: Institutional Equities and Private Client Group. This report hasbeen prepared by the Private Client Group. The views and opinions expressed in this document may or may not match or may be contrarywith the views, estimates, rating, target price of the Institutional Equities Research Group of Kotak Securities Limited.
NESTLE INDIA
PRICE: RS.5710 RECOMMENDATION: ACCUMULATETARGET PRICE: RS.6000 CY17E P/E: 38.0X
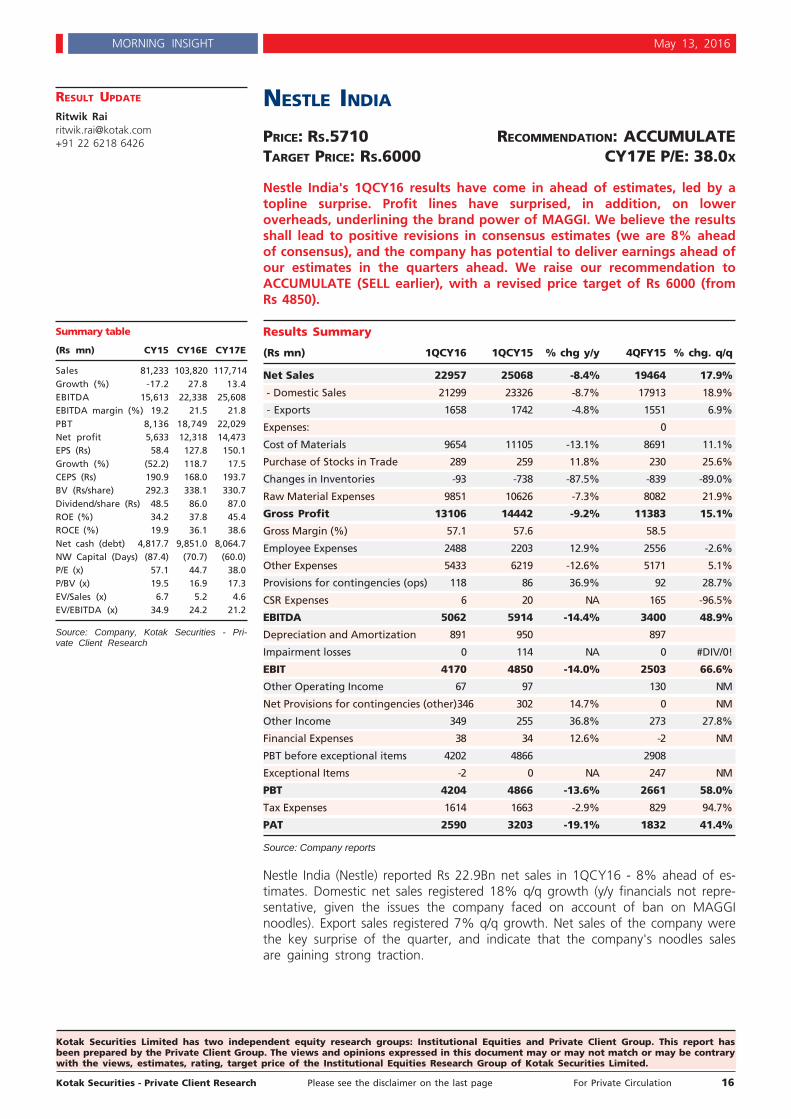
Nestle India's 1QCY16 results have come in ahead of estimates, led by atopline surprise. Profit lines have surprised, in addition, on loweroverheads, underlining the brand power of MAGGI. We believe the resultsshall lead to positive revisions in consensus estimates (we are 8% aheadof consensus), and the company has potential to deliver earnings ahead ofour estimates in the quarters ahead. We raise our recommendation toACCUMULATE (SELL earlier), with a revised price target of Rs 6000 (fromRs 4850).
Results Summary
(Rs mn) 1QCY16 1QCY15 % chg y/y 4QFY15 % chg. q/q
Net Sales 22957 25068 -8.4% 19464 17.9%
- Domestic Sales 21299 23326 -8.7% 17913 18.9%
- Exports 1658 1742 -4.8% 1551 6.9%
Expenses: 0
Cost of Materials 9654 11105 -13.1% 8691 11.1%
Purchase of Stocks in Trade 289 259 11.8% 230 25.6%
Changes in Inventories -93 -738 -87.5% -839 -89.0%
Raw Material Expenses 9851 10626 -7.3% 8082 21.9%
Gross Profit 13106 14442 -9.2% 11383 15.1%
Gross Margin (%) 57.1 57.6 58.5
Employee Expenses 2488 2203 12.9% 2556 -2.6%
Other Expenses 5433 6219 -12.6% 5171 5.1%
Provisions for contingencies (ops) 118 86 36.9% 92 28.7%
CSR Expenses 6 20 NA 165 -96.5%
EBITDA 5062 5914 -14.4% 3400 48.9%
Depreciation and Amortization 891 950 897
Impairment losses 0 114 NA 0 #DIV/0!
EBIT 4170 4850 -14.0% 2503 66.6%
Other Operating Income 67 97 130 NM
Net Provisions for contingencies (other)346 302 14.7% 0 NM
Other Income 349 255 36.8% 273 27.8%
Financial Expenses 38 34 12.6% -2 NM
PBT before exceptional items 4202 4866 2908
Exceptional Items -2 0 NA 247 NM
PBT 4204 4866 -13.6% 2661 58.0%
Tax Expenses 1614 1663 -2.9% 829 94.7%
PAT 2590 3203 -19.1% 1832 41.4%
Source: Company reports
Nestle India (Nestle) reported Rs 22.9Bn net sales in 1QCY16 - 8% ahead of es-timates. Domestic net sales registered 18% q/q growth (y/y financials not repre-sentative, given the issues the company faced on account of ban on MAGGInoodles). Export sales registered 7% q/q growth. Net sales of the company werethe key surprise of the quarter, and indicate that the company's noodles salesare gaining strong traction.
Summary table
(Rs mn) CY15 CY16E CY17E
Sales 81,233 103,820 117,714Growth (%) -17.2 27.8 13.4EBITDA 15,613 22,338 25,608EBITDA margin (%) 19.2 21.5 21.8PBT 8,136 18,749 22,029Net profit 5,633 12,318 14,473EPS (Rs) 58.4 127.8 150.1Growth (%) (52.2) 118.7 17.5CEPS (Rs) 190.9 168.0 193.7BV (Rs/share) 292.3 338.1 330.7Dividend/share (Rs) 48.5 86.0 87.0ROE (%) 34.2 37.8 45.4ROCE (%) 19.9 36.1 38.6Net cash (debt) 4,817.7 9,851.0 8,064.7NW Capital (Days) (87.4) (70.7) (60.0)P/E (x) 57.1 44.7 38.0P/BV (x) 19.5 16.9 17.3EV/Sales (x) 6.7 5.2 4.6EV/EBITDA (x) 34.9 24.2 21.2
Source: Company, Kotak Securities - Pri-vate Client Research
RESULT UPDATE
Ritwik [email protected]+91 22 6218 6426
Kotak Securities - Private Client Research Please see the disclaimer on the last page For Private Circulation 17
MORNING INSIGHT May 13, 2016
The company's earnings release notes that MAGGI has already regained the #1position in instant noodles sales and has over 50% of market share within fivemonths of re-launch (re-launched in November, 2015). Also, importantly, as therelease notes, in a recent survey of India's Brands by TRA in October/ November2015, MAGGI has emerged as the Most Trusted Brand in the Fast Moving Foodscategory.
Gross margins came in at 57.1%, modestly lower than our estimates, and a de-cline of 140 bps q/q.
Employee expenses grew broadly in line with estimates; other expenses of thecompany registered lower growth than expected. As a result, EBITDA, Rs 5.06Bn,came in 25% ahead of our estimates.
Most line items below the EBITDA line are in line with our estimates. We notethat depreciation charges for 1QCY15 included a charge of Rs 81 mn on reas-sessment of useful life of assets. Other income is higher on account of highercash. Taxes paid in the quarter have come in well higher than estimates, leadingto relatively subdued PAT outperformance.
The company has declared an interim dividend of Rs 12/share.
Outlook and Investment View
The quarter's results indicate that Nestle has been able to ramp up its distribu-tion/ market share rapidly over the past two/ three months. Market share gainssuggest that secondary sales of the company have also been strong. We notethat MAGGI is yet to relaunch certain variants of its noodles. As such, the quar-ter grants scope for further sequential growth in the coming quarters.
We further like the fact that the ramp up in sales has come in with relativelymodest growth in advertising / promotion in as much as can be judged from theother expenses line, granting credence to the idea that brand MAGGI has heldup well despite adverse publicity over the past few quarters.
Over the past few quarters, investor attention has been, in our understanding,focused on : a/ the idea that MAGGI is slow to recover the market share (beliefthat emerges from lower than expected 4QCY15 revenues) and b/ the belief thatthe company's advertising / promotion / distribution ramp-up was inadequate inthe light of the crisis that the company was facing. The 1QCY16 results, in ouropinion, do address some of these concerns.
These results, along with the market share data coming in, indicate that themanagement is in good control of the situation, and has a strong judgment ofthe traction that MAGGI would gain over a period of time.
Further, the company has lost volumes in other categories over the past fewquarters, likely as a result of weakening distribution post the MAGGI issue.There is scope for gain in market share among these products as well.
Given the underperformance of the company over the past few quarters, con-sensus estimates have been cut drastically, and are currently factoring in 8%lower EBITDA (Bloomberg consensus estimates prior to results). We expect thisearnings release to lead to a revision in consensus estimates. Further, we see anupside to our estimates, as : a/ market share gains in MAGGI are quicker thanour estimates factor in, and b/ advertising/ promotion intensity required may belower than our estimates. As of now, we leave our estimates unchanged.
To take account of the possibility of positive surprises in Nestle earnings, as alsoconsidering the fact that Nestle has, over the years, traded at a significant pre-mium to our FMCG universe, we raise our target multiple to 40X CY17E PER (38xCY16E earlier). We thus value the stock at Rs 6000 (revised from Rs 4850, as weroll forward our valuation to CY17E.

Kotak Securities - Private Client Research Please see the disclaimer on the last page For Private Circulation 18
MORNING INSIGHT May 13, 2016
We raise our recommendation to ACCUMULATE, in light of the positive returnexpectation, as also our belief that the risks in the stock have diminished, fol-lowing visibility in MAGGI market share, and anecdotal evidence that the returnto normalcy in the instant noodles market would be sharper than we had earlierbelieved.
Key Risks
Ongoing legal proceedings in the Supreme Court that may have an adverse im-pact on the company, slow ramp-up in variants, other industry-level risks.
We recommend ACCUMULATEon Nestle India with a price
target of Rs.6000

Kotak Securities - Private Client Research Please see the disclaimer on the last page For Private Circulation 19
MORNING INSIGHT May 13, 2016
Kotak Securities Limited has two independent equity research groups: Institutional Equities and Private Client Group. This report hasbeen prepared by the Private Client Group. The views and opinions expressed in this document may or may not match or may be contrarywith the views, estimates, rating, target price of the Institutional Equities Research Group of Kotak Securities Limited.
RESULT UPDATE
Sumit [email protected]+91 22 6218 6438
MANGALORE REFINERY AND PETROCHEMICALS LTD. (MRPL)PRICE: RS.70 RECOMMENDATION: ACCUMULATETARGET PRICE: RS.77 FY17E P/E: 12.1X
MRPL's result is better than markets and our expectations. In Q4FY16, thecompany reported a PAT of Rs.13.5 bn, 16% yoy and 354% qoq mainly onaccount of higher throughput, better GRMs and lower other expenses.MRPL's core operating margin stood at $9.01/bbls in Q4FY16 as comparedto $8.56/bbls in Q4FY15. The improvement in GRM is mainly on account ofpremium products like polypropylene and pet coke production from thenewly commissioned phase III secondary units and increase in throughput.
We expect going ahead, the profitability to improve on account of i).Improved product mix, ii). Better refining margins iii). Economies of scale,iv). Forward integration - Polypropylene plant and v). Various tax benefits.At current price of Rs.70, the stock is trading at 12.1x P/E and 1.6x P/Bmultiples on FY18E earnings. We believe that the stock is fairly valued at4.7x FY18E EV/EBIDTA, and offer limited upside. Hence, we recommendACCUMULATE (earlier BUY) rating with a revised price target of Rs.77(earlier Rs.63), valuing it at 5x FY18E EV/EBIDTA.
Near-term concerns: Due to acute water scarcity, the company has shut downphase-III units of the refinery. The district administration has suspended watersupply to MRPL. We believe this will meaningfully impact the crude through putand GRMs of the company. The company is planning to procure fuels from otherrefineries and marketing it. We believe that procuring fuel from other refinerieswill partially off-set the impact of shut down but will impact the GRMs. As a re-sult we revise our FY17E earnings downward to Rs. 5.72 (earlier Rs. 8.85).
Results table
MRPL (Rs.mn) Q4FY16 Q4FY15 YoY (%) QoQ (%)
Net Sales/Income from ops 92,848 110,928 (16) 5
Incr/(Decr) in stock (7,258) (1,396)
Total Expenditure 70,295 98,759 (29) (20)
EBIDTA 15,295 10,774 42 244
Depreciation 2,449 1,489 64 53
EBIT 12,846 9,285 38 351
Other income 2,475 3,816 (35) 49
Interest-net 1,458 1,138 28 (4)
PBT 13,864 11,963 16 364
Extra ordinary Exp/(Inc) 77
Tax 253.5 266.1 (5)
PAT 13,534 11,697 16 354
Equity Capital 17,526 17,526
EPS (Rs) 7.7 6.7 16 354
Source: Company
MRPL Q4FY16 results analysisCrude throughput:
In Q4FY16, MRPL reported throughput of 4.52 mmt, significantly up by 10% yoyand 18% qoq (base effect - planned shutdown in Q3FY16), resulting in sequen-tially higher capacity utilization (121% in Q4FY16 as against 102% in Q3FY16).
In FY16, the Company reported a crude throughput of 15.69 mmtpa as against14.65 mmtpa in FY15.
Summary table
(Rs mn) FY16E FY17E FY18E
Sales 397,507 346,093 484,618Growth (%) (30) (13) 40EBITDA 17,162 33,145 39,685EBITDA margin (%) 4.3 9.6 8.2PBT 3,065 12,703 14,961Net profit 2,807 8,511 10,024EPS (Rs) 4.05 4.86 5.72Growth (%) NM 20 18CEPS(Rs) 7.4 11.0 12.2BV (Rs/share) 33.7 38.6 42.9DPS (Rs) - - 1.1ROE (%) 12.7 13.4 13.8ROCE (%) 9.3 11.7 11.9Net debt/(cash) (10,495) 91,427 63,683NW Capital (days) (146) (48) (41)P/E (x) 17.0 14.2 12.1P/BV (x) 2.0 1.8 1.6EV/Sales (x) 0.28 0.61 0.38EV/EBITDA (x) 6.4 6.4 4.7
Source: Company, Kotak Securities - Pri-vate Client Research

Kotak Securities - Private Client Research Please see the disclaimer on the last page For Private Circulation 20
MORNING INSIGHT May 13, 2016
Lower crude throughput resulted in lower capacity utilization
Source: Company
Core GRMs improved:
MRPL's core operating margin stood at $9.01/bbls in Q4FY16 as compared to$8.56/bbl in Q4FY15. The improvement in GRM is mainly on account of productslike Polypropylene and Pet Coke generated out of the new Phase III secondaryunits and increase in throughput of 0.40 MMT. However, reported GRMs stoodat $8.24/bbls in Q4FY16 as compared to $6.97/bbls in Q4FY15 and $4.83/bbls inQ3FY16.
Net revenue growth
In Q4FY16, MRPL has reported net revenue of Rs.92.8 bn, lower 16% yoy but up5% qoq. Sequential increase in revenues is mainly on account of higher crudethroughput and better GRMs. In Q4FY16, average implied realization per unit(calculated on crude through put) stood at $ 38/bbls, down 12% qoq and 34%yoy.
Raw material cost:
In Q4FY16, raw material consumption decreased 16% qoq and 29% yoy to Rs.68 bn. In per unit terms, MRPL's crude oil price stands at $30/bbls. However, thefall in product prices is lower than raw material cost resulting in higher impliedspread.
Chart showing product and raw material price decline
Source: Company

Kotak Securities - Private Client Research Please see the disclaimer on the last page For Private Circulation 21
MORNING INSIGHT May 13, 2016
Margin Ratio
(%) Q4FY16 Q4FY15 YoY (%) QoQ (%)
EBITDA Margin 16.5 9.7 6.8 11.4
EBIT Margin 13.8 8.4 5.5 10.6
Adj PAT Margin 14.7 10.5 4.1 11.3
Other Income/PBT 17.9 31.9 (14.0) (37.6)
Tax/PBT 1.8 2.2 (0.4) 1.8
excise/net sales 45.2 18.6 26.6 18.2
Source: Company
Expenses
(Rs. Mn) Q4FY16 Q4FY15 YoY (%) QoQ (%)
Raw Material consumption 68,114 96,393 (29) (16)
Staff costs 884 695 27 28
Forex Loss/(Gain) 143 (91)
Other Exp. 1,154 1,671 (31) (76)
Total 70,295 98,759 (29) (20)
Source: Company
Expenses Ratio
Q4FY16 Q4FY15 YoY (%) QoQ (%)
Employee to Sales 1.0 0.6 0.4 0.3
RM to VOP 79.6 88.0 (8.4) (7.8)
Forex Loss to VOP 0.2 - 0.2 (1.6)
Mfg exp. To Sales 1.3 1.5 (0.2) (3.9)
Source: Company
Staff Cost: In Q4FY16, employee cost increased 28% qoq to Rs.884 mn (+27%yoy). Broadly, MRPL's staff cost is within control.
Forex Loss: In Q4FY16, MRPL has incurred lower forex loss of Rs.143 mn asagainst Rs.1.6 bn in Q3FY16 mainly due to forex volatility.
Other expenditure: In Q4FY16, MRPL's adjusted other expenditure decreasedmeaningfully 76% qoq and 31% yoy (base effect) to Rs.1.2 bn. In per unit terms,MRPL's operating cost stands at USD$0.97/bbls, down 67% qoq and 23% yoy.
Operating profit - In Q4FY16, MRPL’sreported operating profit increased 42%yoy and 244% qoq to Rs.15.3 bn on account of reasons mentioned above.
Depreciation cost: In Q4FY16, MRPL reported higher depreciation charge(Rs.2.45 bn, 64% yoy and 53% QoQ) mainly on account of commissioning ofnew units. The Company has adopted depreciation rate in line with the newschedule II of the Companies Act, 2013.
Finance cost: MRPL's interest cost has decreased to Rs. 1.5 bn, down 4% qoqbut up 28% yoy. Gross debt as on 30th March'16 stands at Rs.128 bn as againstRs133 bn as on 31st Mar'15. Lower crude oil price has improved working capitalsituation and lowered borrowings.
Other income: In Q4FY16, MRPL's other income stands at Rs.2.5 bn increased49% qoq (due to base effect, 32% qoq decline in Q3FY16) but decline 35% yoy.
Profit before tax (PBT): In Q4FY16, MRPL's PBT increased 16% yoy and 364%qoq to Rs.13.9 bn mainly due to higher crude throughput, better GRMs andlower forex losses.
Income Tax: In Q4FY16, due to previous quarter losses the Company has paidlower income tax.

Kotak Securities - Private Client Research Please see the disclaimer on the last page For Private Circulation 22
MORNING INSIGHT May 13, 2016
Bottom line: The Company has reported a net profit of Rs.13.5 bn in Q4FY16,higher by 16% yoy and 355% qoq supported by better GRMs, higher crudethroughput, lower interest cost and lower other expenses.
Key Developments
MRPL is venturing into RLNG business: MRPL has signed a memorandum ofunderstanding (MOU) with new Mangalore Port Trust to study the feasibility ofsetting up an LNG re-gasification terminal at Mangalore. We believe this is at apreliminary stage and will have a long gestation period. However, if materializesthen it will help MRPL to lower its refinery operating cost by replacing costlierliquid fuel with cheaper LNG.
New expansion plans in place - Growth is a process: The Company plans toexpand crude processing capacity by 40% to 420,000 bopd by end-March 2018.On a conservative basis, we have not considered the same.
Re-commencing retail outlets - MRPL has drawn up plans for opening over 100retail outlets which will improve its overall margins due to addition of marketingmargins.
Marketing initiatives
MRPL sold higher volume domestically there by reducing the dependency on ex-ports. Due to marketing initiatives, the domestic evacuation by way of directmarketing sales during Q4FY16 was 0.57 MMT as against 0.27 MMT in Q4FY15.This increase is mainly on account of products like Polypropylene, Petcoke, Bitu-men and Sulphur.
Valuations & Recommendations:
We expect going ahead, the profitability to improve on account of i). Improvedproduct mix, ii). Better refining margins iii). Economies of scale, iv). Forward in-tegration - Polypropylene plant and v). Various tax benefits. At current price ofRs.70, the stock is trading at 12.1x P/E and 1.6x P/B multiples on FY18E earnings.We believe that the stock is reasonably valued at 4.7x FY18E EV/EBIDTA, andoffer limited upside. Hence, we recommend ACCUMULATE (earlier BUY) ratingwith a revised price target of Rs.77 (earlier Rs.63), valuing it at 5x FY18E EV/EBIDTA.
Key Risk and Concerns
1). Wide fluctuations in crude, forex and product prices can impact the margins.
2). If global supply exceeds demand then margins can be under pressure.
3). Any delay in executing the project can significantly impact the valuations.
Company back ground
Mangalore Refinery and Petrochemicals Ltd. (Mini-Ratna status) is a pure playcrude oil refiner with strong promoter backing of ONGC (India's biggest govern-ment owned exploration Company). MRPL has transformed itself into a large andcomplex refinery with phase-III capacity expansion and has emerged into a muchstronger player in the industry.
We recommendACCUMULATE on MRPL
with a price target ofRs.77
Kotak Securities - Private Client Research Please see the disclaimer on the last page For Private Circulation 23
MORNING INSIGHT May 13, 2016
Kotak Securities Limited has two independent equity research groups: Institutional Equities and Private Client Group. This report hasbeen prepared by the Private Client Group. The views and opinions expressed in this document may or may not match or may be contrarywith the views, estimates, rating, target price of the Institutional Equities Research Group of Kotak Securities Limited.
ECONOMY UPDATE
Jayesh [email protected]+91 22 6218 5373
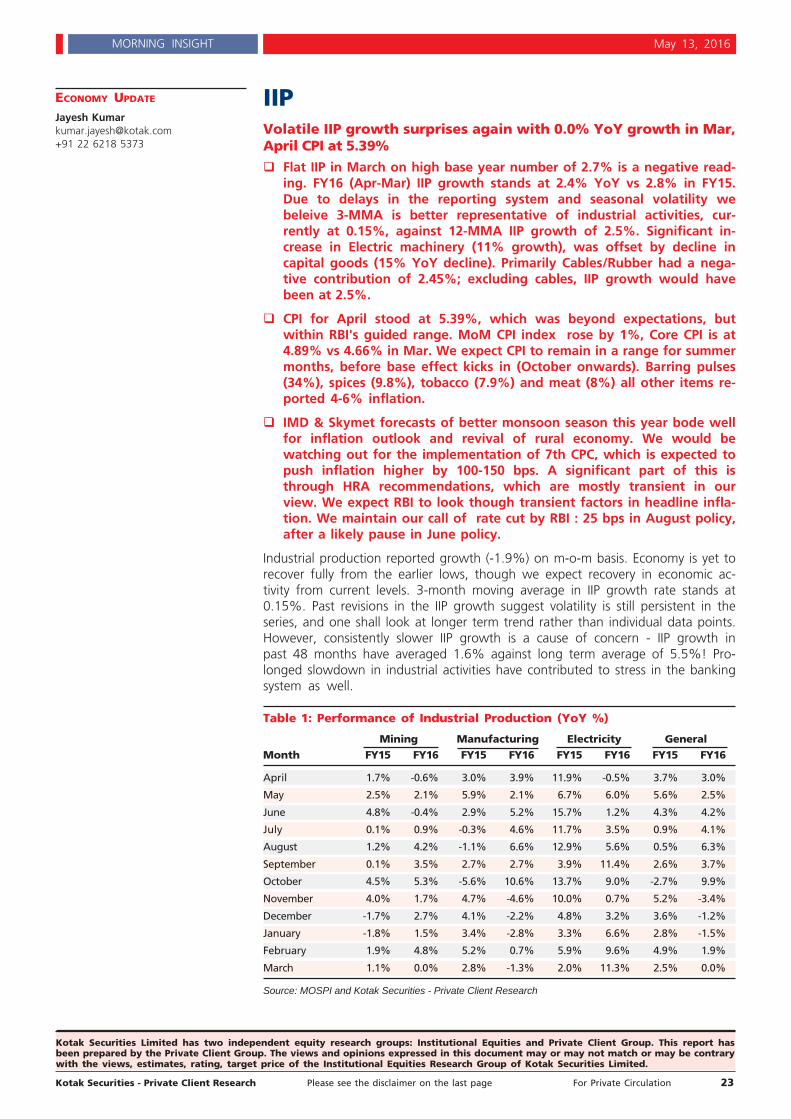
IIPVolatile IIP growth surprises again with 0.0% YoY growth in Mar,April CPI at 5.39%
Flat IIP in March on high base year number of 2.7% is a negative read-ing. FY16 (Apr-Mar) IIP growth stands at 2.4% YoY vs 2.8% in FY15.Due to delays in the reporting system and seasonal volatility webeleive 3-MMA is better representative of industrial activities, cur-rently at 0.15%, against 12-MMA IIP growth of 2.5%. Significant in-crease in Electric machinery (11% growth), was offset by decline incapital goods (15% YoY decline). Primarily Cables/Rubber had a nega-tive contribution of 2.45%; excluding cables, IIP growth would havebeen at 2.5%.
CPI for April stood at 5.39%, which was beyond expectations, butwithin RBI's guided range. MoM CPI index rose by 1%, Core CPI is at4.89% vs 4.66% in Mar. We expect CPI to remain in a range for summermonths, before base effect kicks in (October onwards). Barring pulses(34%), spices (9.8%), tobacco (7.9%) and meat (8%) all other items re-ported 4-6% inflation.
IMD & Skymet forecasts of better monsoon season this year bode wellfor inflation outlook and revival of rural economy. We would bewatching out for the implementation of 7th CPC, which is expected topush inflation higher by 100-150 bps. A significant part of this isthrough HRA recommendations, which are mostly transient in ourview. We expect RBI to look though transient factors in headline infla-tion. We maintain our call of rate cut by RBI : 25 bps in August policy,after a likely pause in June policy.
Industrial production reported growth (-1.9%) on m-o-m basis. Economy is yet torecover fully from the earlier lows, though we expect recovery in economic ac-tivity from current levels. 3-month moving average in IIP growth rate stands at0.15%. Past revisions in the IIP growth suggest volatility is still persistent in theseries, and one shall look at longer term trend rather than individual data points.However, consistently slower IIP growth is a cause of concern - IIP growth inpast 48 months have averaged 1.6% against long term average of 5.5%! Pro-longed slowdown in industrial activities have contributed to stress in the bankingsystem as well.
Table 1: Performance of Industrial Production (YoY %)
Mining Manufacturing Electricity GeneralMonth FY15 FY16 FY15 FY16 FY15 FY16 FY15 FY16
April 1.7% -0.6% 3.0% 3.9% 11.9% -0.5% 3.7% 3.0%
May 2.5% 2.1% 5.9% 2.1% 6.7% 6.0% 5.6% 2.5%
June 4.8% -0.4% 2.9% 5.2% 15.7% 1.2% 4.3% 4.2%
July 0.1% 0.9% -0.3% 4.6% 11.7% 3.5% 0.9% 4.1%
August 1.2% 4.2% -1.1% 6.6% 12.9% 5.6% 0.5% 6.3%
September 0.1% 3.5% 2.7% 2.7% 3.9% 11.4% 2.6% 3.7%
October 4.5% 5.3% -5.6% 10.6% 13.7% 9.0% -2.7% 9.9%
November 4.0% 1.7% 4.7% -4.6% 10.0% 0.7% 5.2% -3.4%
December -1.7% 2.7% 4.1% -2.2% 4.8% 3.2% 3.6% -1.2%
January -1.8% 1.5% 3.4% -2.8% 3.3% 6.6% 2.8% -1.5%
February 1.9% 4.8% 5.2% 0.7% 5.9% 9.6% 4.9% 1.9%
March 1.1% 0.0% 2.8% -1.3% 2.0% 11.3% 2.5% 0.0%
Source: MOSPI and Kotak Securities - Private Client Research

Kotak Securities - Private Client Research Please see the disclaimer on the last page For Private Circulation 24
MORNING INSIGHT May 13, 2016
Mining, Manufacturing and Electricity sectors grew by (-0.1%), (-1.2%) and11.3%. The cumulative growth in three sectors during FY16 has been 2.2%, 2%and 5.6% respectively. As per Use-based classification, the growth rates are 4%in Basic goods, (-)15.4% in Capital goods and 3.7% in Intermediate goods. TheConsumer durables and Consumer non-durables have recorded growth of 8.7%and (-)4.4% respectively, with the overall growth in Consumer goods being0.4%.
Components of Industrial ProductionIn terms of industries, tweleve out of the twenty two industry groups in themanufacturing sector have shown positive growth. The industry group 'TV andCommunication' has shown the highest positive growth of 36.5%, followed by19.8% in 'Tobacco products' and 16.9% in 'Wearing apparel.
On the other hand, the industry group 'electrical machinery' has shown the mostnegative growth of (-)36.2%, followed by (-)15.0% in 'food products and bever-ages' and (-)9.9% in 'recorded media'.
Table 2: Performance of Use Based Industries (YoY %)
Basic goods Capital goods Intermediate goods Consumer goodsMonth FY15 FY16 FY15 FY16 FY15 FY16 FY15 FY16
April 8.6% 2.6% 13.4% 5.5% 3.0% 2.3% -4.8% 2.8%
May 7.5% 6.2% 4.2% 3.0% 3.5% 1.2% 4.6% -2.2%
June 10.2% 5.1% 23.3% -2.0% 2.6% 1.3% -8.8% 7.2%
July 7.0% 5.0% -3.0% 10.6% 2.9% 1.7% -5.9% 0.9%
August 9.0% 3.5% -10.0% 21.4% -0.1% 3.1% -6.2% 6.0%
September 5.0% 4.2% 12.3% 10.1% 2.0% 1.8% -4.0% 1.2%
October 9.7% 4.2% -3.2% 16.5% -3.4% 6.3% -18.2% 18.3%
November 9.5% -0.5% 7.0% -24.4% 4.7% -1.5% -1.6% 1.0%
December 5.9% 0.5% 6.1% -19.1% 1.1% 1.3% 0.6% 3.0%
January 4.8% 2.1% 12.4% -20.9% 0.1% 2.8% -1.9% 0.0%
February 5.3% 5.3% 8.5% -9.7% 1.1% 5.4% 3.9% 0.7%
March 2.7% 4.0% 8.8% -15.0% 2.5% 3.6% -0.4% 0.2%
Source: MOSPI and Kotak Securities - Private Client Research
Some important items showing high positive growth include 'Wood Furniture'(77.0%), 'Leather Garments' (73.0%), 'Mobile Phone and Accessories' (60.2%),'Tea' (56.2%), 'Transformers' (53.8%), 'Cashew Kernels' (31.3%), 'Scooter andMopeds' (25.0%), 'Aluminium Conductor' (23.8%) and 'Commercial Vehicles'(22.2%).
Some important items that have registered high negative growth include 'Cable,Rubber Insulated' (-77.3%), 'Polythene Bags' (-47.5%), 'Cement Machinery' (-46.0%), 'Heat Exchangers' (-39.4%), 'H.R. Sheets' (-35.9%), 'Ship Building andRepairs' (-35.8%), 'Boilers' (-35.5%), 'Lubricating oil' (-31.8%), 'Sugar' (-30.1%),'Furnace oil' (-27.2%), 'Molasses' (-23.4%), 'Stainless steel' (-21.5%) and'Woollen Carpets' (-20.6%).

Kotak Securities - Private Client Research Please see the disclaimer on the last page For Private Circulation 25
MORNING INSIGHT May 13, 2016
Table 3: Major Contributions in IIP
Item Group Weights (%) Contribution
High Positive Contributors
Electricity 10.32 1.04
Commercial Vehicles 1.93 0.50
Telephone Instruments Including Mobile Phone & Accessories 0.22 0.39
Cement All Kinds 2.41 0.33
Diesel, High Speed 2.11 0.29
High Negative Contributors
Cable, Rubber Insulated 0.12 -2.44
sugar(including sugar cubes) 1.52 -1.06
Boilers 0.40 -0.38
Stainless/ alloy steel 0.64 -0.36
Plastic Machinery Incl. Moulding Machinery 0.26 -0.18
Source: MOSPI and Kotak Securities - Private Client Research

Kotak Securities - Private Client Research Please see the disclaimer on the last page For Private Circulation 26
MORNING INSIGHT May 13, 2016
Exhibit 1: Monthly Ä in IIP and Base Effect
Source: Mospi
Exhibit 2: Magnitude of IIP Revisions (in bps)
Source: Mospi
Exhibit 3: Monthly Ä in CPI and Base Effect
Source: Mospi
Exhibit 4: Monthly Ä in WPI and Base Effect
Source: Mospi

Kotak Securities - Private Client Research Please see the disclaimer on the last page For Private Circulation 27
MORNING INSIGHT May 13, 2016
Exhibit 5: Contribution to IIP
Source: Mospi
Exhibit 6: Sectoral Compenents of IIP
Source: Mospi
Exhibit 7: Use Based IIP Compenents - Cap. Gds. & Inter. Gds.
Source: Mospi
Exhibit 8: Use Based Compenents of IIP - Consumer Goods
Source: Mospi

Kotak Securities - Private Client Research Please see the disclaimer on the last page For Private Circulation 28
MORNING INSIGHT May 13, 2016
Exhibit 9: Core Sector and IIP Growth Rates
Source: Mospi
Exhibit 10: IIP & Core Secotr Growth Trend
Source: Mospi
Exhibit 11: CPI, Food and ex-Food CPI
Source: Mospi
Exhibit 12: Inflation vs. Growth
Source: Mospi

Kotak Securities - Private Client Research Please see the disclaimer on the last page For Private Circulation 29
MORNING INSIGHT May 13, 2016
Gainers & Losers Nifty Gainers & LosersPrice (Rs) chg (%) Index points Volume (mn)
Gainers
Bosch Ltd 20,925 4.4 NA 0.03
DRL 2,971 3.6 NA 1.7
ICICI Bank 232 3.5 NA 21.8
Losers
Aurobindo Pharma 801 (2.0) NA 1.6
Axis Bank 493 (1.1) NA 13.5
Eicher Motors 19,753 (1.1) NA 0.1
Source: Bloomberg
Bulk deals
Forthcoming events Company/MarketDate Event
13 - May Allahabad Bank, Bank of Baroda, Cadila Healthcare, IL&FS Transporation Networks,Union Bank, The Phoenix Mills earnings expected
Source: Bloomberg
Trade details of bulk deals
Date Scrip name Name of client Buy/ Quantity Avg.Sell of shares price
(Rs)
12-May BAJAJHCARE E Tricks Enterprises Pvt Ltd B 101,600 172.4
12-May BAJAJHCARE Ifl Enterprises Ltd B 48,000 172.4
12-May DUNE Rushabh Shantilal Kubadia S 26,100 19.2
12-May DUNE Pankaj Shantilal Kubadia S 26,300 19.2
12-May DUNE Navalben Gangji Gala S 26,200 19.2
12-May DUNE Gangji Arjan Gala S 26,400 19.2
12-May DUNE Noshir Rustomji Anklesaria B 200,000 19.3
12-May DUNE Saumil A Bhavnagri Huf S 35,300 19.3
12-May DUNE Saumil Arvindbhai Bhavnagari S 60,000 19.3
12-May FRANKLIN Midland Financial Advisory Pvt Ltd S 144,000 15.0
12-May GPCL Guiness Securities Ltd S 42,000 25.8
12-May GUJINTRX Sharad Kanayalal Shah B 20,010 58.5
12-May KRISHFAB S R Venkatesh S 22,000 31.2
12-May KRISHFAB Deepchand Ashokkumar B 22,000 31.4
12-May MRSS Vikram Navalchand Shah S 30,000 117.5
12-May NOBPOL Kalpesh Anilbhai Malvi S 79,000 5.8
12-May NUTRICIRCLE Sri Kakatiya Shelters Pvt Ltd S 50,750 8.0
12-May RISHITECH Harish Kumar Gupta S 56,585 20.0
12-May SAUMYACAP Care Wealth Advisors Pvt Ltd S 99,000 1.1
12-May SAUMYACAP Parikh Arvindkumar Jayant Ilal B 99,000 1.1
12-May SPECIAPP Shriram Credit Company Ltd S 943,772 0.3
12-May SUPRBPA Bharat Bhavsar S 36,000 33.1
12-May VIPULDYE Yogita Manoj Mittal B 30,000 47.2
12-May VIPULDYE Manoj Bishan Mittal B 32,728 46.0
12-May VIPULDYE Skyhorizon Engineering Pvt Ltd S 89,500 40.0
12-May VIPULDYE Kshetra Engineering Pvt Ltd S 87,401 40.4
12-May VIPULDYE Kshetra Engineering Pvt Ltd S 81,575 41.4
12-May YOGYA Kasturchand Jethmal Kochar B 24,000 4.4
12-May YOGYA Indo Jatalia Securities Pvt Ltd S 32,000 4.3
Source: BSE

Kotak Securities - Private Client Research Please see the disclaimer on the last page For Private Circulation 30
MORNING INSIGHT May 13, 2016
RATING SCALE
Definitions of ratingsBUY – We expect the stock to deliver more than 12% returns over the next 9 months
ACCUMULATE – We expect the stock to deliver 5% - 12% returns over the next 9 months
REDUCE – We expect the stock to deliver 0% - 5% returns over the next 9 months
SELL – We expect the stock to deliver negative returns over the next 9 months
NR – Not Rated. Kotak Securities is not assigning any rating or price target to the stock. The report has been prepared for information purposesonly.
RS – Rating Suspended. Kotak Securities has suspended the investment rating and price target for this stock, either because there is not a suffi-cient fundamental basis for determining, or there are legal, regulatory or policy constraints around publishing, an investment rating or target.The previous investment rating and price target, if any, are no longer in effect for this stock and should not be relied upon.
NA – Not Available or Not Applicable. The information is not available for display or is not applicable
NM – Not Meaningful. The information is not meaningful and is therefore excluded.
NOTE – Our target prices are with a 9-month perspective. Returns stated in the rating scale are our internal benchmark.
Fundamental Research Team
Dipen ShahInformation [email protected]+91 22 6218 5409
Sanjeev ZarbadeCapital Goods, [email protected]+91 22 6218 6424
Teena VirmaniConstruction, [email protected]+91 22 6218 6432
Saday SinhaBanking, NBFC, [email protected]+91 22 6218 6437
Arun AgarwalAuto & Auto [email protected]+91 22 6218 6443
Ruchir KhareCapital Goods, [email protected]+91 22 6218 6431
Ritwik RaiFMCG, [email protected]+91 22 6218 6426
Sumit PokharnaOil and [email protected]+91 22 6218 6438
Amit AgarwalLogistics, [email protected]+91 22 6218 6439
Meeta Shetty, [email protected]+91 22 6218 6425
Jatin DamaniaMetals & [email protected]+91 22 6218 6440
Pankaj [email protected]+91 22 6218 6434
Nipun GuptaInformation [email protected]+91 22 6218 6433
Jayesh [email protected]+91 22 6218 5373
K. [email protected]+91 22 6218 6427
Technical Research Team
Shrikant [email protected] 22 6218 5408
Amol [email protected]+91 20 6620 3350
Derivatives Research TeamSahaj [email protected]+91 79 6607 2231
Rahul [email protected]+91 22 6218 5498
Malay [email protected]+91 22 6218 6420
Prashanth [email protected]+91 22 6218 5497

Kotak Securities - Private Client Research Please see the disclaimer on the last page For Private Circulation 31
MORNING INSIGHT May 13, 2016
DisclaimerKotak Securities Limited established in 1994, is a subsidiary of Kotak Mahindra Bank Limited. Kotak Securities is one of India's largest brokerage anddistribution house.Kotak Securities Limited is a corporate trading and clearing member of Bombay Stock Exchange Limited (BSE), National Stock Exchange of India Limited (NSE),Metropolitan Stock Exchange of India Limited (MSEI). Our businesses include stock broking, services rendered in connection with distribution of primarymarket issues and financial products like mutual funds and fixed deposits, depository services and Portfolio Management.Kotak Securities Limited is also a depository participant with National Securities Depository Limited (NSDL) and Central Depository Services (India) Limited(CDSL). Kotak Securities Limited is also registered with Insurance Regulatory and Development Authority as Corporate Agent for Kotak Mahindra Old MutualLife Insurance Limited and is also a Mutual Fund Advisor registered with Association of Mutual Funds in India (AMFI). We are registered as a Research Analystunder SEBI (Research Analyst) Regulations, 2014.We hereby declare that our activities were neither suspended nor we have defaulted with any stock exchange authority with whom we are registered in lastfive years. However SEBI, Exchanges and Depositories have conducted the routine inspection and based on their observations have issued advise letters orlevied minor penalty on KSL for certain operational deviations. We have not been debarred from doing business by any Stock Exchange / SEBI or any otherauthorities; nor has our certificate of registration been cancelled by SEBI at any point of time.We offer our research services to clients as well as our prospects.This document is not for public distribution and has been furnished to you solely for your information and must not be reproduced or redistributed to any otherperson. Persons into whose possession this document may come are required to observe these restrictions.This material is for the personal information of the authorized recipient, and we are not soliciting any action based upon it. This report is not to be construedas an offer to sell or the solicitation of an offer to buy any security in any jurisdiction where such an offer or solicitation would be illegal. It is for the generalinformation of clients of Kotak Securities Ltd. It does not constitute a personal recommendation or take into account the particular investment objectives,financial situations, or needs of individual clients.We have reviewed the report, and in so far as it includes current or historical information, it is believed to be reliable though its accuracy or completenesscannot be guaranteed. Neither Kotak Securities Limited, nor any person connected with it, accepts any liability arising from the use of this document. Therecipients of this material should rely on their own investigations and take their own professional advice. Price and value of the investments referred to in thismaterial may go up or down. Past performance is not a guide for future performance. Certain transactions -including those involving futures, options andother derivatives as well as non-investment grade securities - involve substantial risk and are not suitable for all investors. Reports based on technical analysiscenters on studying charts of a stock's price movement and trading volume, as opposed to focusing on a company's fundamentals and as such, may not matchwith a report on a company's fundamentals.Opinions expressed are our current opinions as of the date appearing on this material only. While we endeavor to update on a reasonable basis theinformation discussed in this material, there may be regulatory, compliance or other reasons that prevent us from doing so. Prospective investors and othersare cautioned that any forward-looking statements are not predictions and may be subject to change without notice. Our proprietary trading and investmentbusinesses may make investment decisions that are inconsistent with the recommendations expressed herein.Kotak Securities Limited has two independent equity research groups: Institutional Equities and Private Client Group. This report has been prepared by thePrivate Client Group. The views and opinions expressed in this document may or may not match or may be contrary with the views, estimates, rating, targetprice of the Institutional Equities Research Group of Kotak Securities Limited.We and our affiliates/associates, officers, directors, and employees, Research Analyst(including relatives) worldwide may: (a) from time to time, have long orshort positions in, and buy or sell the securities thereof, of company (ies) mentioned herein or (b) be engaged in any other transaction involving such securitiesand earn brokerage or other compensation or act as a market maker in the financial instruments of the subject company/company (ies) discussed herein oract as advisor or lender / borrower to such company (ies) or have other potential/material conflict of interest with respect to any recommendation and relatedinformation and opinions at the time of publication of Research Report or at the time of public appearance. Kotak Securities Limited (KSL) may haveproprietary long/short position in the above mentioned scrip(s) and therefore may be considered as interested. The views provided herein are general innature and does not consider risk appetite or investment objective of particular investor; readers are requested to take independent professional advicebefore investing. This should not be construed as invitation or solicitation to do business with KSL. Kotak Securities Limited is also a Portfolio Manager.Portfolio Management Team (PMS) takes its investment decisions independent of the PCG research and accordingly PMS may have positions contrary to thePCG research recommendation. Kotak Securities Limited does not provide any promise or assurance of favourable view for a particular industry or sector orbusiness group in any manner. The investor is requested to take into consideration all the risk factors including their financial condition, suitability to riskreturn profile and take professional advice before investing.The analyst for this report certifies that all of the views expressed in this report accurately reflect his or her personal views about the subject company orcompanies and its or their securities, and no part of his or her compensation was, is or will be, directly or indirectly related to specific recommendations orviews expressed in this report.No part of this material may be duplicated in any form and/or redistributed without Kotak Securities' prior written consent.Details of Associates are available on our website ie www.kotak.comResearch Analyst has served as an officer, director or employee of subject company(ies): NoWe or our associates may have received compensation from the subject company(ies) in the past 12 months. We or our associates may have managed or co-managed public offering of securities for the subject company(ies) in the past 12 months. We or our associates may have received compensation forinvestment banking or merchant banking or brokerage services from the subject company(ies) in the past 12 months. We or our associates may have receivedany compensation for products or services other than investment banking or merchant banking or brokerage services from the subject company(ies) in thepast 12 months. We or our associates have not received any compensation or other benefits from the subject company(ies) or third party in connection withthe research report. Our associates may have financial interest in the subject company(ies).Research Analyst or his/her relative's financial interest in the subject company(ies): NoKotak Securities Limited has financial interest in the subject company(ies): Havells India - YesOur associates may have actual/beneficial ownership of 1% or more securities of the subject company(ies) at the end of the month immediately precedingthe date of publication of Research Report.Research Analyst or his/her relatives has actual/beneficial ownership of 1% or more securities of the subject company(ies) at the end of the monthimmediately preceding the date of publication of Research Report: NoKotak Securities Limited has actual/beneficial ownership of 1% or more securities of the subject company(ies) at the end of the month immediately precedingthe date of publication of Research Report: NoSubject company(ies) may have been client during twelve months preceding the date of distribution of the research report."A graph of daily closing prices of securities is available at www.nseindia.com and http://economictimes.indiatimes.com/markets/stocks/stock-quotes. (Choosea company from the list on the browser and select the "three years" icon in the price chart)."Kotak Securities Limited. Registered Office: 27 BKC, C 27, G Block, Bandra Kurla Complex, Bandra (E), Mumbai 400051. CIN: U99999MH1994PLC134051,Telephone No.: +22 43360000, Fax No.: +22 67132430. Website: www.kotak.com. Correspondence Address: Infinity IT Park, Bldg. No 21, Opp. Film City Road,A K Vaidya Marg, Malad (East), Mumbai 400097. Telephone No: 42856825. SEBI Registration No: NSE INB/INF/INE 230808130, BSE INB 010808153/INF011133230, MSEI INE 260808130/INB 260808135/INF 260808135, AMFI ARN 0164, PMS INP000000258 and Research Analyst INH000000586. NSDL/CDSL: IN-DP-NSDL-23-97. Our research should not be considered as an advertisement or advice, professional or otherwise. The investor is requested to take intoconsideration all the risk factors including their financial condition, suitability to risk return profile and the like and take professional advice before investing.Investments in securities are subject to market risk; please read the SEBI prescribed Combined Risk Disclosure Document prior to investing. Derivatives are asophisticated investment device. The investor is requested to take into consideration all the risk factors before actually trading in derivative contracts.Compliance Officer Details: Mr. Manoj Agarwal. Call: 022 - 4285 6825, or Email: [email protected] case you require any clarification or have any concern, kindly write to us at below email ids: Level 1: For Trading related queries, contact our customer service at '[email protected]' and for demat account related queries contact us at
[email protected] or call us on: Online Customers - 30305757 (by using your city STD code as a prefix) or Toll free numbers 18002099191 / 1800222299,Offline Customers - 18002099292
Level 2: If you do not receive a satisfactory response at Level 1 within 3 working days, you may write to us at [email protected] or call us on 022-42858445 and if you feel you are still unheard, write to our customer service HOD at [email protected] or call us on 022-42858208.
Level 3: If you still have not received a satisfactory response at Level 2 within 3 working days, you may contact our Compliance Officer (Name: ManojAgarwal ) at [email protected] or call on 91- (022) 4285 6825.
Level 4: If you have not received a satisfactory response at Level 3 within 7 working days, you may also approach CEO (Mr. Kamlesh Rao) [email protected] or call on 91- (022) 6652 9160.